global energy demand outlook in the light of higher prices: update
TRANSCRIPT

EURO PEA N FUEL PRI CE CO N FEREN CE12
Global Energy Demand Outlook in the Light of Higher Prices: Update on the Implications of Recent
HurricanesKevin Lindemer
Executive Managing Director of EnergyGlobal Insight

Copyright © 2005 Global Insight, Inc. 2
Lessons from the Hurricanes and High Prices
• Increasingly, markets are event driven• The global economy seems to be much less
sensitive to oil price than previously thought• Demand side response has been relatively
weak and of short duration – so far.• Capacity limits in the U.S. and global oil
system were exposedOPEC capacity and global capacity to produce light/sweet crude oilGlobal heavy/sour refining capabilityUS natural gas supply capability

Copyright © 2005 Global Insight, Inc. 3
Demand Impact from High Oil/Energy Prices
• Demand appears to be less elastic than years past due to relative growth in transportation
• Price effect is smaller due to significant decline in fuel substitution capability
• Income effect is smaller due to continued decline in oil/gdp in nearly all countries.
Incremental oil demand/gdp nearly half the level of 10 years ago
• For many OECD consumers, the price of crude oil is a small fraction of their fuels costs
• In some major emerging markets, energy prices are subsidized and consumers do not ‘see’ higher prices
• Oil’s share of total energy continues to fall

Copyright © 2005 Global Insight, Inc. 4
Why Near-Record High Energy Prices Are Not a Problem…and Even Higher May Not Be
• Current high prices are – still – largely demand driven
• Petro dollars are being recycled more quickly through investments and financial flows
• There is an absence of inflationary pressures thanks to increased global and domestic competition
• As a result of prudent monetary policies, inflation expectations are relatively stable

Copyright © 2005 Global Insight, Inc. 5
Demand Growth: N. America and Asia dominate
0
20
40
60
80
100
120
1990 1995 2000 2005 2010 2015 2020
mill
ion
b/d
N America C/S America Europe Asia Pacific Middle East Africa FSU

Copyright © 2005 Global Insight, Inc. 6
How Far Can You Drive on $20 of Gas?
127 213 342 385771
4,627
0
500
1,000
1,500
2,000
2,500
3,000
3,500
4,000
4,500
5,000
Germany India USA China SaudiArabia
Venezuela
Source: Foreign Affairs
Mile
s

Copyright © 2005 Global Insight, Inc. 7
US Fuel Cost per Mile Driven
0.0
5.0
10.0
15.0
20.0
25.0
1973 1977 1981 1985 1989 1993 1997 2001 2005
2004
cen
ts p
er m
ile
Cars SUVs

Copyright © 2005 Global Insight, Inc. 8
US Gasoline Demand: Bouncing Back
7,000
7,500
8,000
8,500
9,000
9,500
10,000
J F M A M J J A S O N D
Thou
sand
s of
bpd
2003 2004 2005

Copyright © 2005 Global Insight, Inc. 9
Energy Demand/GDP
100
150
200
250
300
350
1995 1996 1997 1998 1999 2000 2001 2002 2003 2004
MTO
E/B
illio
n$
US EU China India Japan

Copyright © 2005 Global Insight, Inc. 10
Oil Share of World Energy Index 1990 = 100
707580859095
100105110115120
1990 1992 1994 1996 1998 2000 2002 2004Source: BP Statistical Review
North America S.& C. America EU and Eurasia Mid EastAfrica Asia Pacific World

Copyright © 2005 Global Insight, Inc. 11
Incremental Oil Demand/GDP PPP
(0.060)
(0.040)
(0.020)
-
0.020
0.040
0.060
0.080
0.100
1994 1995 1996 1997 1998 1999 2000 2001 2002 2003 2004 2005estTO
E/$1
000
GD
P PP
P
US EU China Linear (US) Linear (EU)

Copyright © 2005 Global Insight, Inc. 12
Global Transport Share of Oil Demand
30.0%
35.0%
40.0%
45.0%
50.0%
55.0%
1971 1976 1981 1986 1991 1996 2001

Copyright © 2005 Global Insight, Inc. 13
How High Can Price Go Before There is a GDP Impact?
• Global Insight sensitivity analysis of an oil price ‘shock’ on the global economy
• WTI price over $100 for two months and over $70 for six months and over $50 for an additional year.
• Slight negative impact on global GDP in the first year, no impact in the second and positive impacts in the following years.
• Price impact shaves 0.3 – 0.4 percent off growth for China and India in year 1 and 2.
• What price is too high?

Copyright © 2005 Global Insight, Inc. 14
WTI Crude Oil Price Cases
$40.00
$50.00
$60.00
$70.00
$80.00
$90.00
$100.00
$110.00
$120.00
Oct-05 Jan-06 Apr-06 Jul-06 Oct-06
Dol
lars
per
Bar
rel
Base Case Oil 'Shock'

Copyright © 2005 Global Insight, Inc. 15
Impact of $100 Oil Shock on World Growth
0.00
0.50
1.00
1.50
2.00
2.50
3.00
3.50
4.00
2005 2006 2007 2008 2009 2010 2011 2012 2013 2014 2015
Source: Global Insight Scenario Model
Perc
ent C
hang
e in
Rea
l GD
P
Base Case Oil Shock

Copyright © 2005 Global Insight, Inc. 16
$100 Oil Impact on China’s GDP Growth
0.00
1.00
2.00
3.00
4.00
5.00
6.00
7.00
8.00
9.00
10.00
2005 2006 2007 2008 2009 2010 2011 2012 2013 2014 2015
Source: Global Insight Scenario Model
Perc
ent C
hang
e in
Rea
l GD
P G
row
th
Base Case Oil Shock
Copyright © 2005 Global Insight, Inc. 17
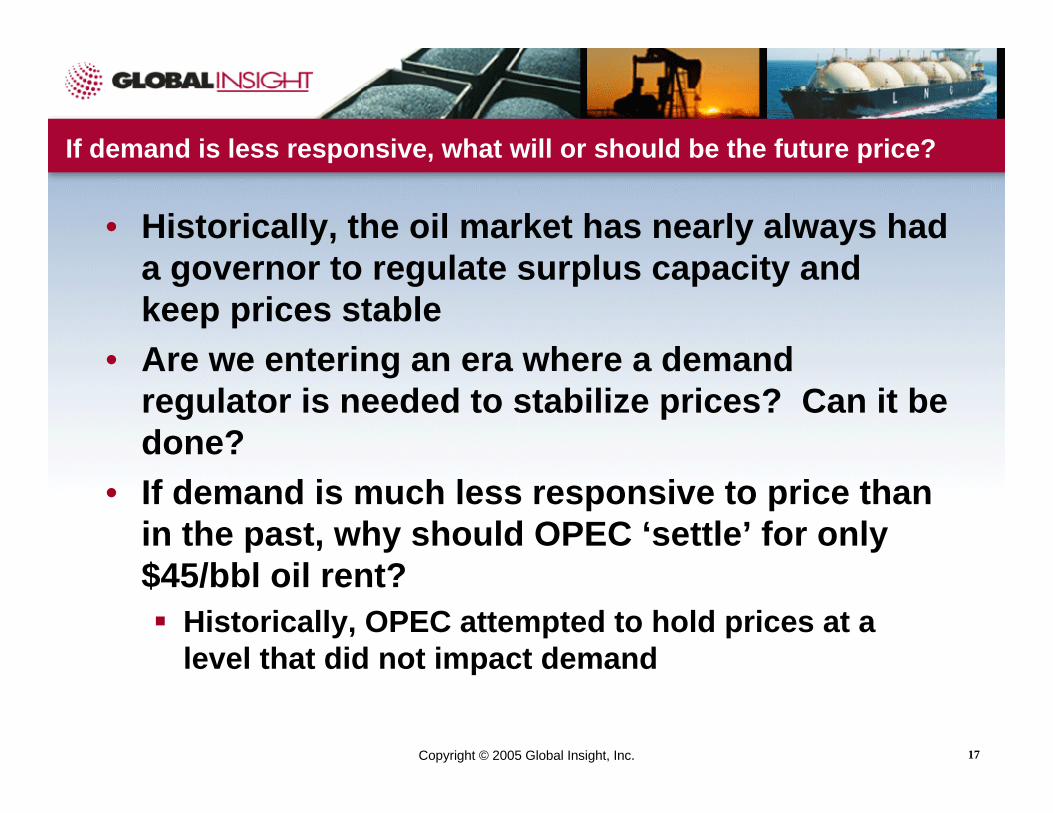
If demand is less responsive, what will or should be the future price?
• Historically, the oil market has nearly always had a governor to regulate surplus capacity and keep prices stable
• Are we entering an era where a demand regulator is needed to stabilize prices? Can it be done?
• If demand is much less responsive to price than in the past, why should OPEC ‘settle’ for only $45/bbl oil rent?
Historically, OPEC attempted to hold prices at a level that did not impact demand

Copyright © 2005 Global Insight, Inc. 18
OPEC Price Floors: Past, Present and Future?
0.00
10.00
20.00
30.00
40.00
50.00
60.00
70.00
80.00
90.00
1980 1985 1990 1995 2000 2005 2010
2004 $ Nominal $
……but why not target here?but why not target here?
‘‘NewNew’’ OPEC Reference Price?OPEC Reference Price?
‘‘OldOld’’ OPEC Reference PricesOPEC Reference Prices
……or target here?or target here?

Copyright © 2005 Global Insight, Inc. 19
If the future is higher prices, what are the implications?
• Faster growth rate for alternative and renewable fuels
• Unconventional oil production accelerates• Since demand is relatively inelastic, what
price will trigger a demand side response to reduce demand? Or,
• Will demand need to be ‘regulated’? Or, • Will consuming countries regulate price?• Policies that are sensitive to energy costs
may need to be reconsidered

Copyright © 2005 Global Insight, Inc. 20
Energy Supply Impacts from the Hurricanes is Diminishing, Gas May Still be an Issue
• Oil production lost is coming back at a relatively optimistic case.
Less than 0.1 mbd out by year endReplaced by imported crude oil
• Natural gas production returning at a steady pace.Small volumes out by year endReplaced by demand destruction
• Refineries will be back to nearly full production by year end
Small amount out will be replaced by higher output from other refineries and higher imports

Copyright © 2005 Global Insight, Inc. 21
Hurricane Related Oil Production OffLine
0
500
1000
1500
2000
2500
Sep-05 Oct-05 Nov-05 Dec-05 Jan-06 Feb-06
Shut
-in O
il Pr
oduc
tion
(MB
OPD
)
Oil Shut-in Pos. Oil Shut-in Neg. Oil Shut-in Actuals

Copyright © 2005 Global Insight, Inc. 22
Hurricane Related Gas Production Off-Line
0
2000
4000
6000
8000
10000
12000
14000
Sep-05 Oct-05 Nov-05 Dec-05 Jan-06 Feb-06
Shut
-in G
as P
rodu
ctio
n (M
MC
FD)
Gas Shut-in Pos. Gas Shut-in Neg. Gas Shut-in Actuals

Copyright © 2005 Global Insight, Inc. 23
Refinery Capacity Offline from Rita and Katrina
-
1,000
2,000
3,000
4,000
5,000
6,000
9/24 10/8 10/22 11/5 11/19 12/3 12/17 12/31
Thou
sand
s of
bpd

Copyright © 2005 Global Insight, Inc. 24
Global Per Capita Oil and Energy Demand
0.000
0.200
0.400
0.600
0.800
1.000
1.200
1.400
1.600
1.800
1965 1970 1975 1980 1985 1990 1995 2000
Tonn
es p
er P
erso
n
Oil Energy

Copyright © 2005 Global Insight, Inc. 25
Global Oil Demand: What Could Have Been
0
20,000
40,000
60,000
80,000
100,000
120,000
1965 1970 1975 1980 1985 1990 1995 2000
Thou
sand
of b
pd
Copyright © 2005 Global Insight, Inc. 26
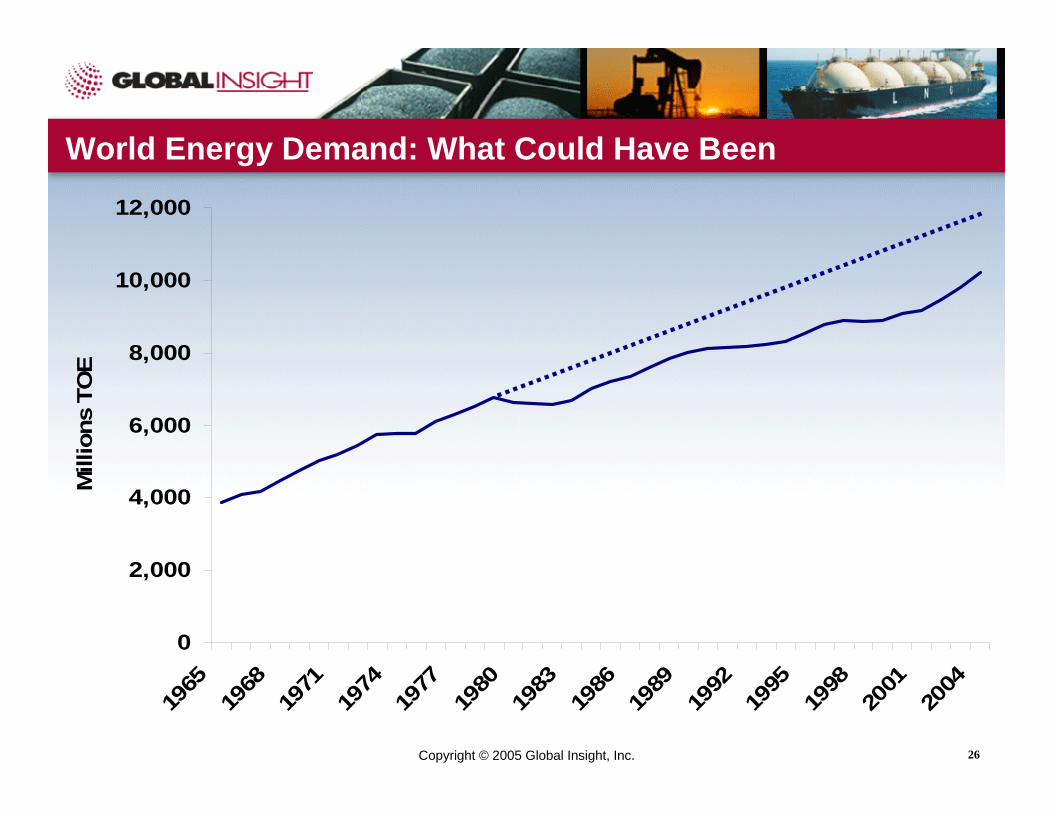
World Energy Demand: What Could Have Been
0
2,000
4,000
6,000
8,000
10,000
12,000
1965
1968
1971
1974
1977
1980
1983
1986
1989
1992
1995
1998
2001
2004
Mill
ions
TO
E

Copyright © 2005 Global Insight, Inc. 27
Thank you!
NameTitle
E-mail: [email protected]
EURO PEA N FUEL PRI CE CO N FEREN CE12
Thank You
Kevin LindemerExecutive Managing Director of Energy
E-mail: [email protected]