global economic outlook walking on thin ice
TRANSCRIPT

Global Economic Outlook
Walking on Thin Ice
Dr. Juan M. Licari – Managing Director & Chief International Economist December 3rd, 2020
XXXXX, Title

Global Economic Outlook: Walking on Thin Ice 2
Important Disclaimer
Moody's Analytics operates independently of the credit ratings activities of Moody's Investors
Service. We do not comment on credit ratings or potential rating changes, and no opinion or
analysis you hear during this presentation can be assumed to reflect those of the ratings agency.

1 Moody’s Analytics
Global Economic Outlook

Global Economic Outlook: Walking on Thin Ice 4
Expansion
In recession
At risk
Recovery
Source: Moody’s Analytics
Global Business Cycle StatusMay 2020

Global Economic Outlook: Walking on Thin Ice 5
Expansion
In recession
At risk
Recovery
Source: Moody’s Analytics
Global Business Cycle StatusNovember 2020

Global Economic Outlook: Walking on Thin Ice 6
LatAm Outlook DeterioratesReal GDP, LatAm, six largest economies, 2019Q4 =100
80
85
90
95
100
105
110
115
19Q4 20Q1 20Q2 20Q3 20Q4 21Q1 21Q2 21Q3 21Q4 22Q1 22Q2 22Q3 22Q4 23Q1 23Q2 23Q3 23Q4
Baseline Feb Baseline Nov
Baseline Feb 2.5%
Baseline Nov 1.4%
Ave. Grwoth
2020-23Vintage
Source: Moody’s Analytics

Global Economic Outlook: Walking on Thin Ice 7
LatAm Outlook: A Long Road BackReal GDP, LatAm, six largest economies, 2019Q4 =100, November Baseline
Source: Moody’s Analytics *Indexed to pre-pandemic peak of 2019Q3
70
75
80
85
90
95
100
105
110
115
19Q4 20Q1 20Q2 20Q3 20Q4 21Q1 21Q2 21Q3 21Q4 22Q1 22Q2 22Q3 22Q4 23Q1 23Q2 23Q3 23Q4
MEX BRA CHL* ARG COL PER
Mexico 0.6
Brazil 1.6
Chile 3.0
Argentina 0.7
Colombia 1.6
Peru 3.6
CountryAve. Grwoth
2020-23
Chile Peru Brazil Colombia
Mexico
Argentina
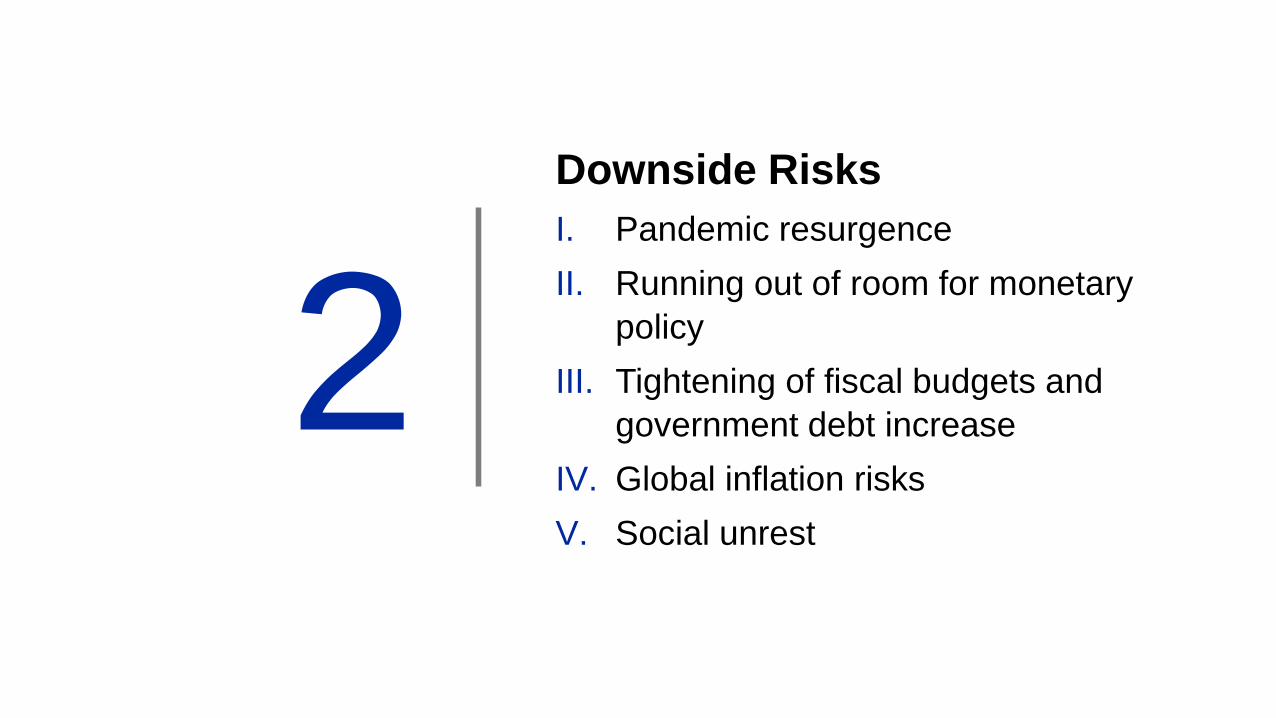
2Downside Risks
I. Pandemic resurgence
II. Running out of room for monetary
policy
III. Tightening of fiscal budgets and
government debt increase
IV. Global inflation risks
V. Social unrest

Global Economic Outlook: Walking on Thin Ice 9
0
100
200
300
400
500
600
700
800
Mar-20 Apr-20 May-20 Jun-20 Jul-20 Aug-20 Sep-20 Oct-20 Nov-20
Europe US Argentina Brazil Chile Colombia Peru Mexico
I. Pandemic ResurgenceSecond Wave Underway in US, Europe
Covid-19, confirmed cases per capita, 7-day MA
Sources: Johns Hopkins, WHO, Moody’s Analytics

Global Economic Outlook: Walking on Thin Ice 10
0
1
2
3
4
5
6
7
8
9
10
Jun-19 Aug-19 Oct-19 Dec-19 Feb-20 Apr-20 Jun-20 Aug-20 Oct-20
Mexico Brazil Chile Colombia Peru
Policy interest rate, % annual rate
II. Running out of Room for Monetary PolicyLatAm Monetary Policy Space: How Low Can You Go?
Sources: Central banks, Moody’s Analytics

Global Economic Outlook: Walking on Thin Ice 11
Change in debt to GDP ratio, LatAm, six largest economies, 2020-2022
-20
-15
-10
-5
0
5
10
15
20
25
MEX BRA CHL ARG COL PER
Feb BL May BL Nov BL
III. Tightening of Fiscal BudgetsLatAm Debt Burdens to Increase
Source: Moody’s Analytics

Global Economic Outlook: Walking on Thin Ice 12
0
1
2
3
4
5
6
7
8
9
18 19 20 21F
U.S. Europe LatAm* Japan
Sources: Central banks, Moody’s Analytics *Five largest economies ex-Argentina
Consumer prices, % change yr ago
IV. Global inflation RisksLow Inflation for Now

Global Economic Outlook: Walking on Thin Ice 13
GINI Coefficient, 2018 or latest year
0 10 20 30 40 50 60
Brazil
Colombia
Venezuela
LatAm
Mexico
Chile
Peru
Argentina
United States
Canada
Japan
Germany
V. Social UnrestInequality: a Sore Spot in LatAm
Sources: World Bank, Moody’s Analytics

3
Upside Risks
I. Vaccine earlier than expected
II. Stronger than expected recovery in
China
III. De-escalation of US-China tensions
under new Biden government
IV. Stronger rebound in global tourism
V. Structural reforms in LatAm play out
faster than anticipated

Global Economic Outlook: Walking on Thin Ice 15
Probability, timeframe for 25 million inoculations in the U.S. (10/1)
0
10
20
30
40
50
60
70
80
90
100
4/24 5/15 6/5 6/26 7/17 8/7 8/28 9/18
After Apr 1 2022Oct 1 2021-Mar 31 2022Apr 1 2021-Sep 30 2021Oct 1 2020-Mar 31 2021Before Oct 1 2020
I. Vaccine Earlier than ExpectedEffective Vaccine by Spring 2021
Sources: Good Judgment Project, Moody’s Analytics

Global Economic Outlook: Walking on Thin Ice 16
70
75
80
85
90
95
100
105
110
15 16 17 18 19 20
GDP Industrial production Exports Imports
China, 2019q4=100
II. Stronger than Expected Recovery in ChinaStronger China Recovery Could Lift South America
Sources: NBS, Moody’s Analytics

Global Economic Outlook: Walking on Thin Ice 17
Biden administration main priorities, greatest to least difference with Trump
III. De-escalation of US-China Tensions Biden Term Could Ease Tariffs, Other Disputes

Global Economic Outlook: Walking on Thin Ice 18
0
1
2
3
4
5
6
7
97 98 99 00 01 02 03 04 05 06 07 08 09 10 11 12 13 14 15 16 17 18 19 20
International arrivals, U.S., mil, 12-mo MA
IV. Stronger Rebound in Global Tourism Global Travel Still at Bay
Sources: U.S. National travel and Tourism Office, Moody’s Analytics

Global Economic Outlook: Walking on Thin Ice 19
-15
-10
-5
0
00 01 02 03 04 05 06 07 08 09 10 11 12 13 14 15 16 17 18 19 20
Central government budget balance, % of GDP
V. Structural Reforms in LatAm Play Out FasterStructural Reforms Beckon in Brazil
Sources: IGBE, BCB Moody’s Analytics
Global Economic Outlook: Walking on Thin Ice 20
Q&A
- Dr. Alfredo Coutino Zavala
Director of Economic Research – LatAm
Moody’s Analytics
- Dr. Juan M. Licari
Managing Director & Chief International Economist
Moody’s Analytics

A Appendix

Global Economic Outlook: Walking on Thin Ice 22
2019Q4 actuals and baseline projections:
Unemployment Rates
Source: Moody’s Analytics
February, May and November
0
5
10
15
20
25
MEX BRA CHL ARG COL PER US UK DEU CHN JPN
Unemployment rate in 2019Q4
Max of 2020-2022 Inemployment rate, BL Feb
Max of 2020-22 Unemployment rate, BL May
Max of 2020-22 Unemployment rate, BL Nov
Value Date Value Date
Mexico 3.4 5.7 2020Q4 6.8 2020Q3
Brazil 11.6 13.9 2020Q3 13.2 2020Q2
Chile 7.6 12.9 2020Q2 12.9 2020Q3
Argentina 9.9 12.1 2021Q1 13.6 2021Q1
Colombia 10.6 12.8 2021Q3 20.5 2020Q2
Peru 4.0 6.2 2020Q3 10.6 2020Q4
US 3.5 15.0 2020Q2 13.0 2020Q2
UK 3.8 8.3 2020Q3 8.3 2021Q3
Germany 5.0 6.4 2020Q4 6.3 2021Q2
China 3.6 4.4 2020Q3 3.8 2022Q3
Japan 2.3 3.2 2020Q4 3.2 2021Q1
Max of 2020-22
Unemployment (Nov)Country
Unemployment in
2019Q4
Max of 2020-22
Unemployment (May)
Global Economic Outlook: Walking on Thin Ice 23
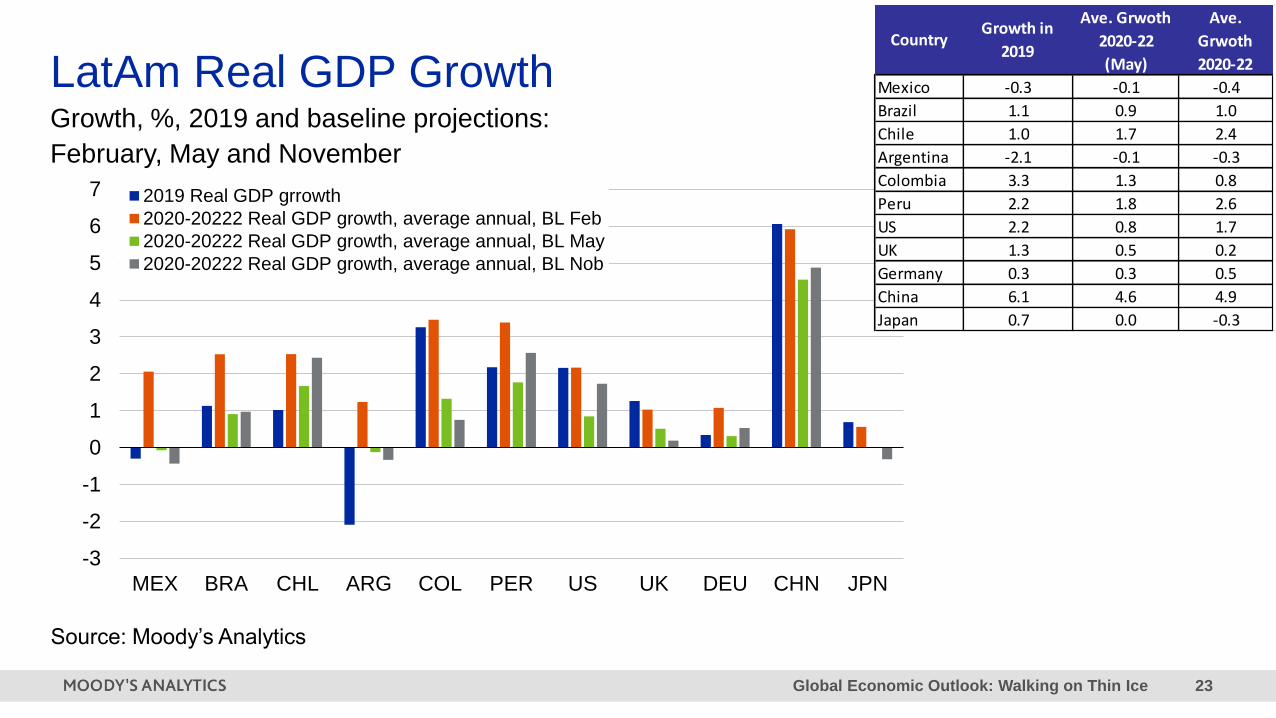
Growth, %, 2019 and baseline projections:
LatAm Real GDP Growth
Source: Moody’s Analytics
February, May and November
-3
-2
-1
0
1
2
3
4
5
6
7
MEX BRA CHL ARG COL PER US UK DEU CHN JPN
2019 Real GDP grrowth
2020-20222 Real GDP growth, average annual, BL Feb
2020-20222 Real GDP growth, average annual, BL May
2020-20222 Real GDP growth, average annual, BL Nob
Mexico -0.3 -0.1 -0.4
Brazil 1.1 0.9 1.0
Chile 1.0 1.7 2.4
Argentina -2.1 -0.1 -0.3
Colombia 3.3 1.3 0.8
Peru 2.2 1.8 2.6
US 2.2 0.8 1.7
UK 1.3 0.5 0.2
Germany 0.3 0.3 0.5
China 6.1 4.6 4.9
Japan 0.7 0.0 -0.3
Ave. Grwoth
2020-22
(May)
Ave.
Grwoth
2020-22
Growth in
2019Country

Global Economic Outlook: Walking on Thin Ice 24
Running Out of Fiscal SpaceSovereign borrowing capacity given current yields
-50
0
50
100
150
200
250
300
350
0 50 100 150 200 250 300
Circle size=Real GDP, $
Y-axis: Fiscal space
X-axis: Debt-to-GDP ratio
Italy
Argentina
Greece
Japan
MexicoTurkey Uruguay
India
Brazil
Germany
Chile
Peru
Colombia
China
U.S.
U.K.
Canada
Source: Moody’s Analytics

Global Economic Outlook: Walking on Thin Ice 25
Federal Reserve Erects a Strong Firewall
0.0
0.2
0.4
0.6
0.8
1.0
1.2
1.4
1.6
1.8
20,000
22,000
24,000
26,000
28,000
30,000
32,000
34,000
36,000
38,000
'Jan Feb Mar Apr May Jun Jul Aug Sep Oct Nov
Wilshire 5000 (L) Federal Fund Rate (R)
Sources: Federal Reserve, SIX Financial, Moody’s Analytics

Global Economic Outlook: Walking on Thin Ice 26
0
20
40
60
80
100
120
140
04 05 06 07 08 09 10 11 12 13 14 15 16 17 18 19 20
Mexico Brazil Chile Argentina Colombia Peru
LatAm Debt Burdens on the Rise
Sources: Central banks, Moody’s Analytics
General government debt, % of GDP

West Chester, EBA-HQ+1.610.235.5299
121 North Walnut Street, Suite 500
West Chester PA 19380
USA
New York, Corporate-HQ+1.212.553.1653
7 World Trade Center, 14th Floor
250 Greenwich Street
New York, NY 10007
USA
London+44.20.7772.5454
One Canada Square
Canary Wharf
London E14 5FA
United Kingdom
Toronto416.681.2133
200 Wellington Street West, 15th Floor
Toronto ON M5V 3C7
Canada
Prague+420.22.422.2929
Washingtonova 17
110 00 Prague 1
Czech Republic
Sydney+61.2.9270.8111
Level 10
1 O'Connell Street
Sydney, NSW, 2000
Australia
Singapore+65.6511.4400
6 Shenton Way
#14-08 OUE Downtown 2
Singapore 068809
Shanghai+86.21.6101.0172
Unit 2306, Citigroup Tower
33 Huayuanshiqiao Road
Pudong New Area, 200120
China
Contact Us: Economics & Business Analytics Offices
[email protected] moodysanalytics.com

Global Economic Outlook: Walking on Thin Ice 28
© 2020 Moody’s Corporation, Moody’s Investors Service, Inc., Moody’s Analytics, Inc. and/or their licensors and affiliates (collectively, “MOODY’S”). All
rights reserved.
CREDIT RATINGS ISSUED BY MOODY'S INVESTORS SERVICE, INC. AND/OR ITS CREDIT RATINGS AFFILIATES ARE MOODY’S CURRENT
OPINIONS OF THE RELATIVE FUTURE CREDIT RISK OF ENTITIES, CREDIT COMMITMENTS, OR DEBT OR DEBT-LIKE SECURITIES, AND
MATERIALS, PRODUCTS, SERVICES AND INFORMATION PUBLISHED BY MOODY’S (COLLECTIVELY, “PUBLICATIONS”) MAY INCLUDE SUCH
CURRENT OPINIONS. MOODY’S INVESTORS SERVICE DEFINES CREDIT RISK AS THE RISK THAT AN ENTITY MAY NOT MEET ITS
CONTRACTUAL FINANCIAL OBLIGATIONS AS THEY COME DUE AND ANY ESTIMATED FINANCIAL LOSS IN THE EVENT OF DEFAULT OR
IMPAIRMENT. SEE MOODY’S RATING SYMBOLS AND DEFINITIONS PUBLICATION FOR INFORMATION ON THE TYPES OF CONTRACTUAL
FINANCIAL OBLIGATIONS ADDRESSED BY MOODY’S INVESTORS SERVICE CREDIT RATINGS. CREDIT RATINGS DO NOT ADDRESS ANY
OTHER RISK, INCLUDING BUT NOT LIMITED TO: LIQUIDITY RISK, MARKET VALUE RISK, OR PRICE VOLATILITY. CREDIT RATINGS, NON-
CREDIT ASSESSMENTS (“ASSESSMENTS”), AND OTHER OPINIONS INCLUDED IN MOODY’S PUBLICATIONS ARE NOT STATEMENTS OF
CURRENT OR HISTORICAL FACT. MOODY’S PUBLICATIONS MAY ALSO INCLUDE QUANTITATIVE MODEL-BASED ESTIMATES OF CREDIT RISK
AND RELATED OPINIONS OR COMMENTARY PUBLISHED BY MOODY’S ANALYTICS, INC. AND/OR ITS AFFILIATES. MOODY’S CREDIT RATINGS,
ASSESSMENTS, OTHER OPINIONS AND PUBLICATIONS DO NOT CONSTITUTE OR PROVIDE INVESTMENT OR FINANCIAL ADVICE, AND
MOODY’S CREDIT RATINGS, ASSESSMENTS, OTHER OPINIONS AND PUBLICATIONS ARE NOT AND DO NOT PROVIDE RECOMMENDATIONS
TO PURCHASE, SELL, OR HOLD PARTICULAR SECURITIES. MOODY’S CREDIT RATINGS, ASSESSMENTS, OTHER OPINIONS AND
PUBLICATIONS DO NOT COMMENT ON THE SUITABILITY OF AN INVESTMENT FOR ANY PARTICULAR INVESTOR. MOODY’S ISSUES ITS
CREDIT RATINGS, ASSESSMENTS AND OTHER OPINIONS AND PUBLISHES ITS PUBLICATIONS WITH THE EXPECTATION AND
UNDERSTANDING THAT EACH INVESTOR WILL, WITH DUE CARE, MAKE ITS OWN STUDY AND EVALUATION OF EACH SECURITY THAT IS
UNDER CONSIDERATION FOR PURCHASE, HOLDING, OR SALE.
MOODY’S CREDIT RATINGS, ASSESSMENTS, OTHER OPINIONS, AND PUBLICATIONS ARE NOT INTENDED FOR USE BY RETAIL INVESTORS
AND IT WOULD BE RECKLESS AND INAPPROPRIATE FOR RETAIL INVESTORS TO USE MOODY’S CREDIT RATINGS, ASSESSMENTS, OTHER
OPINIONS OR PUBLICATIONS WHEN MAKING AN INVESTMENT DECISION. IF IN DOUBT YOU SHOULD CONTACT YOUR FINANCIAL OR OTHER
PROFESSIONAL ADVISER.
ALL INFORMATION CONTAINED HEREIN IS PROTECTED BY LAW, INCLUDING BUT NOT LIMITED TO, COPYRIGHT LAW, AND NONE OF SUCH
INFORMATION MAY BE COPIED OR OTHERWISE REPRODUCED, REPACKAGED, FURTHER TRANSMITTED, TRANSFERRED, DISSEMINATED,
REDISTRIBUTED OR RESOLD, OR STORED FOR SUBSEQUENT USE FOR ANY SUCH PURPOSE, IN WHOLE OR IN PART, IN ANY FORM OR
MANNER OR BY ANY MEANS WHATSOEVER, BY ANY PERSON WITHOUT MOODY’S PRIOR WRITTEN CONSENT.
MOODY’S CREDIT RATINGS, ASSESSMENTS, OTHER OPINIONS AND PUBLICATIONS ARE NOT INTENDED FOR USE BY ANY PERSON AS A
BENCHMARK AS THAT TERM IS DEFINED FOR REGULATORY PURPOSES AND MUST NOT BE USED IN ANY WAY THAT COULD RESULT IN THEM
BEING CONSIDERED A BENCHMARK.
All information contained herein is obtained by MOODY’S from sources believed by it to be accurate and reliable. Because of the possibility of human or
mechanical error as well as other factors, however, all information contained herein is provided “AS IS” without warranty of any kind. MOODY'S adopts all
necessary measures so that the information it uses in assigning a credit rating is of sufficient quality and from sources MOODY'S considers to be reliable
including, when appropriate, independent third-party sources. However, MOODY’S is not an auditor and cannot in every instance independently verify or
validate information received in the rating process or in preparing its Publications.
To the extent permitted by law, MOODY’S and its directors, officers, employees, agents, representatives, licensors and suppliers disclaim liability to any
person or entity for any indirect, special, consequential, or incidental losses or damages whatsoever arising from or in connection with the information
contained herein or the use of or inability to use any such information, even if MOODY’S or any of its directors, officers, employees, agents, representatives,
licensors or suppliers is advised in advance of the possibility of such losses or damages, including but not limited to: (a) any loss of present or prospective
profits or (b) any loss or damage arising where the relevant financial instrument is not the subject of a particular credit rating assigned by MOODY’S.
To the extent permitted by law, MOODY’S and its directors, officers, employees, agents, representatives, licensors and suppliers disclaim liability for any
direct or compensatory losses or damages caused to any person or entity, including but not limited to by any negligence (but excluding fraud, willful
misconduct or any other type of liability that, for the avoidance of doubt, by law cannot be excluded) on the part of, or any contingency within or beyond the
control of, MOODY’S or any of its directors, officers, employees, agents, representatives, licensors or suppliers, arising from or in connection with the
information contained herein or the use of or inability to use any such information.
NO WARRANTY, EXPRESS OR IMPLIED, AS TO THE ACCURACY, TIMELINESS, COMPLETENESS, MERCHANTABILITY OR FITNESS FOR ANY
PARTICULAR PURPOSE OF ANY CREDIT RATING, ASSESSMENT, OTHER OPINION OR INFORMATION IS GIVEN OR MADE BY MOODY’S IN ANY
FORM OR MANNER WHATSOEVER.
Moody’s Investors Service, Inc., a wholly-owned credit rating agency subsidiary of Moody’s Corporation (“MCO”), hereby discloses that most issuers of debt
securities (including corporate and municipal bonds, debentures, notes and commercial paper) and preferred stock rated by Moody’s Investors Service, Inc.
have, prior to assignment of any credit rating, agreed to pay to Moody’s Investors Service, Inc. for credit ratings opinions and services rendered by it fees
ranging from $1,000 to approximately $2,700,000. MCO and Moody’s investors Service also maintain policies and procedures to address the independence
of Moody’s Investors Service credit ratings and credit rating processes. Information regarding certain affiliations that may exist between directors of MCO
and rated entities, and between entities who hold credit ratings from Moody’s Investors Service and have also publicly reported to the SEC an ownership
interest in MCO of more than 5%, is posted annually at www.moodys.com under the heading “Investor Relations — Corporate Governance — Director and
Shareholder Affiliation Policy.”
Additional terms for Australia only: Any publication into Australia of this document is pursuant to the Australian Financial Services License of MOODY’S
affiliate, Moody’s Investors Service Pty Limited ABN 61 003 399 657AFSL 336969 and/or Moody’s Analytics Australia Pty Ltd ABN 94 105 136 972 AFSL
383569 (as applicable). This document is intended to be provided only to “wholesale clients” within the meaning of section 761G of the Corporations Act
2001. By continuing to access this document from within Australia, you represent to MOODY’S that you are, or are accessing the document as a
representative of, a “wholesale client” and that neither you nor the entity you represent will directly or indirectly disseminate this document or its contents to
“retail clients” within the meaning of section 761G of the Corporations Act 2001. MOODY’S credit rating is an opinion as to the creditworthiness of a debt
obligation of the issuer, not on the equity securities of the issuer or any form of security that is available to retail investors.
Additional terms for Japan only: Moody's Japan K.K. (“MJKK”) is a wholly-owned credit rating agency subsidiary of Moody's Group Japan G.K., which is
wholly-owned by Moody’s Overseas Holdings Inc., a wholly-owned subsidiary of MCO. Moody’s SF Japan K.K. (“MSFJ”) is a wholly-owned credit rating
agency subsidiary of MJKK. MSFJ is not a Nationally Recognized Statistical Rating Organization (“NRSRO”). Therefore, credit ratings assigned by MSFJ
are Non-NRSRO Credit Ratings. Non-NRSRO Credit Ratings are assigned by an entity that is not a NRSRO and, consequently, the rated obligation will not
qualify for certain types of treatment under U.S. laws. MJKK and MSFJ are credit rating agencies registered with the Japan Financial Services Agency and
their registration numbers are FSA Commissioner (Ratings) No. 2 and 3 respectively.
MJKK or MSFJ (as applicable) hereby disclose that most issuers of debt securities (including corporate and municipal bonds, debentures, notes and
commercial paper) and preferred stock rated by MJKK or MSFJ (as applicable) have, prior to assignment of any credit rating, agreed to pay to MJKK or
MSFJ (as applicable) for credit ratings opinions and services rendered by it fees ranging from JPY125,000 to approximately JPY250,000,000.
MJKK and MSFJ also maintain policies and procedures to address Japanese regulatory requirements.