global dynamics of the dairy business
TRANSCRIPT
12/11/2018
1
GLOBAL DYNAMICS OF
THE DAIRY BUSINESS
COREY A. GEIGER,
MANAGING EDITOR,
HOARD’S DAIRYMAN
VITA PLUS DAIRY SUMMIT
DECEMBER 5, 2018
LET’S TAKE A 30,000-FOOT VIEW
WE NEED TO ANALYZE THE U.S.
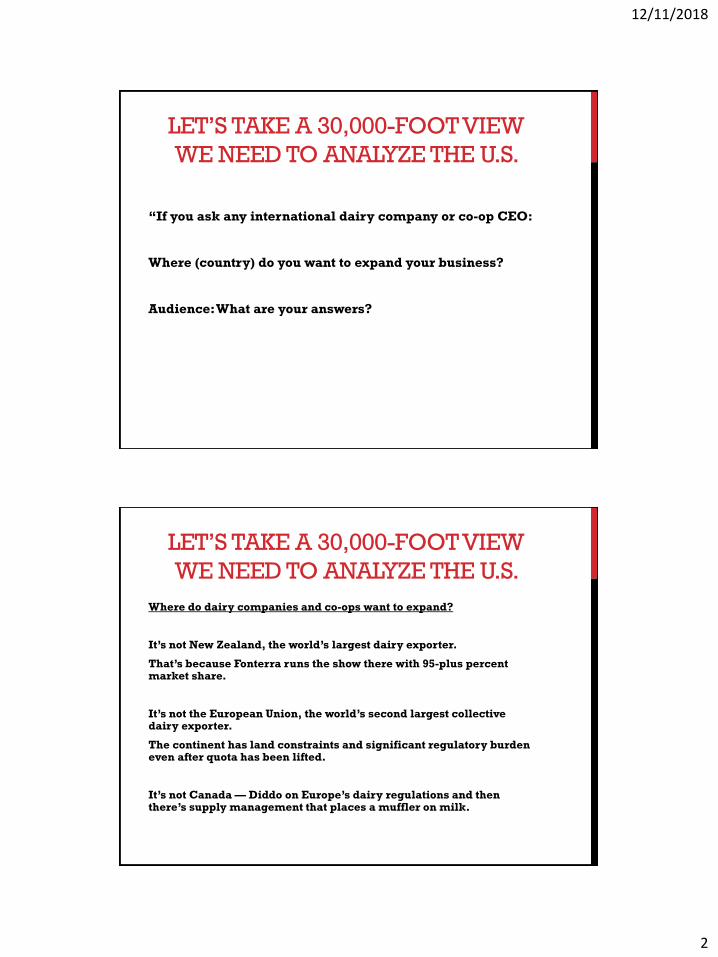
Why do we need to talk about milk markets?
In the past decade, the U.S. milk supply has climbed 14 percent or 29.9 billion pounds of milk.
In the past 20 years, the U.S. milk supply has climbed 27 percent or nearly 60 billion pounds of milk.
Domestic milk consumption has climbed from 565 to 643 pounds per person during that time. But it’s not enough.
12/11/2018
2
LET’S TAKE A 30,000-FOOT VIEW
WE NEED TO ANALYZE THE U.S.
“If you ask any international dairy company or co-op CEO:
Where (country) do you want to expand your business?
Audience: What are your answers?
LET’S TAKE A 30,000-FOOT VIEW
WE NEED TO ANALYZE THE U.S.
Where do dairy companies and co-ops want to expand?
It’s not New Zealand, the world’s largest dairy exporter.
That’s because Fonterra runs the show there with 95-plus percent market share.
It’s not the European Union, the world’s second largest collective dairy exporter.
The continent has land constraints and significant regulatory burden even after quota has been lifted.
It’s not Canada — Diddo on Europe’s dairy regulations and then there’s supply management that places a muffler on milk.
12/11/2018
3
LET’S TAKE A 30,000-FOOT VIEW
WE NEED TO ANALYZE THE U.S.
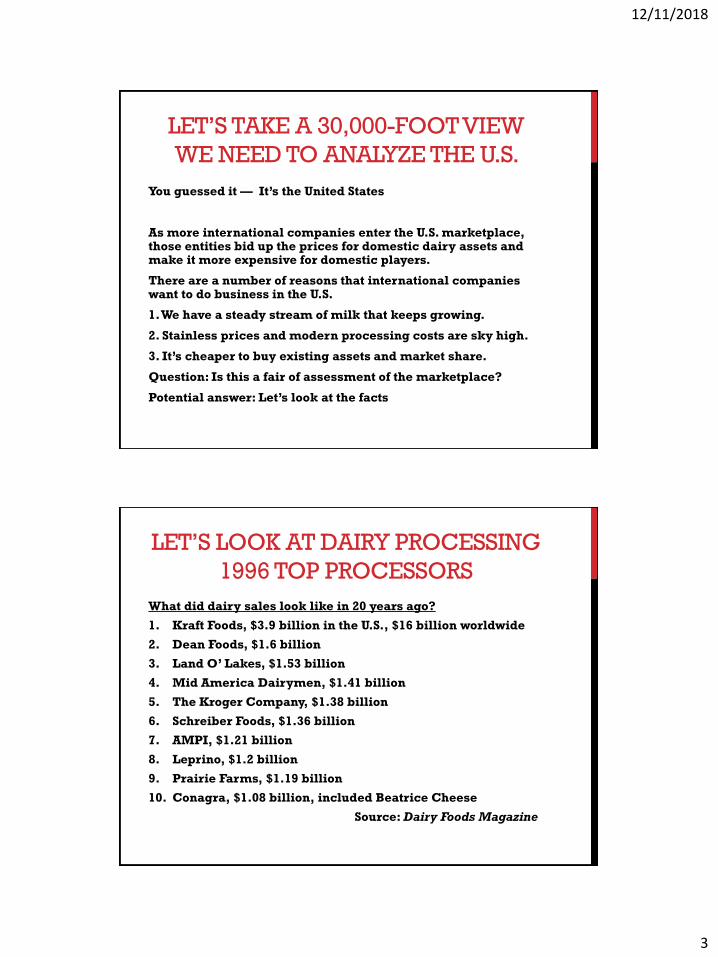
You guessed it — It’s the United States
As more international companies enter the U.S. marketplace, those entities bid up the prices for domestic dairy assets and make it more expensive for domestic players.
There are a number of reasons that international companies want to do business in the U.S.
1. We have a steady stream of milk that keeps growing.
2. Stainless prices and modern processing costs are sky high.
3. It’s cheaper to buy existing assets and market share.
Question: Is this a fair of assessment of the marketplace?
Potential answer: Let’s look at the facts
LET’S LOOK AT DAIRY PROCESSING
1996 TOP PROCESSORS
What did dairy sales look like in 20 years ago?
1. Kraft Foods, $3.9 billion in the U.S., $16 billion worldwide
2. Dean Foods, $1.6 billion
3. Land O’ Lakes, $1.53 billion
4. Mid America Dairymen, $1.41 billion
5. The Kroger Company, $1.38 billion
6. Schreiber Foods, $1.36 billion
7. AMPI, $1.21 billion
8. Leprino, $1.2 billion
9. Prairie Farms, $1.19 billion
10. Conagra, $1.08 billion, included Beatrice Cheese
Source: Dairy Foods Magazine
12/11/2018
4
LET’S LOOK AT DAIRY PROCESSING
2006 TOP PROCESSORS
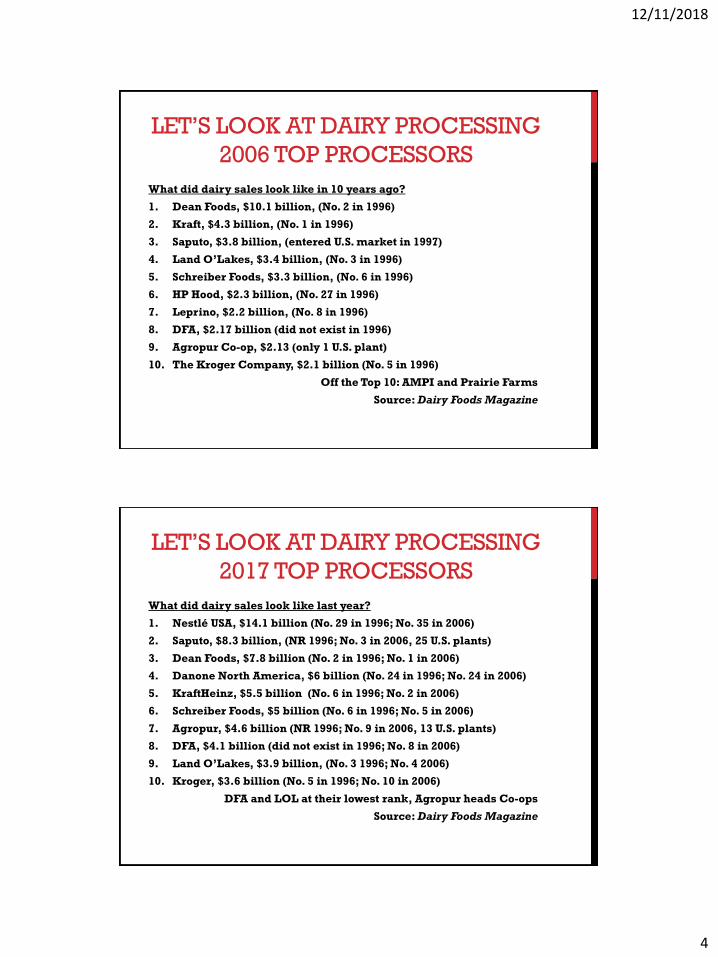
What did dairy sales look like in 10 years ago?
1. Dean Foods, $10.1 billion, (No. 2 in 1996)
2. Kraft, $4.3 billion, (No. 1 in 1996)
3. Saputo, $3.8 billion, (entered U.S. market in 1997)
4. Land O’Lakes, $3.4 billion, (No. 3 in 1996)
5. Schreiber Foods, $3.3 billion, (No. 6 in 1996)
6. HP Hood, $2.3 billion, (No. 27 in 1996)
7. Leprino, $2.2 billion, (No. 8 in 1996)
8. DFA, $2.17 billion (did not exist in 1996)
9. Agropur Co-op, $2.13 (only 1 U.S. plant)
10. The Kroger Company, $2.1 billion (No. 5 in 1996)
Off the Top 10: AMPI and Prairie Farms
Source: Dairy Foods Magazine
LET’S LOOK AT DAIRY PROCESSING
2017 TOP PROCESSORS
What did dairy sales look like last year?
1. Nestlé USA, $14.1 billion (No. 29 in 1996; No. 35 in 2006)
2. Saputo, $8.3 billion, (NR 1996; No. 3 in 2006, 25 U.S. plants)
3. Dean Foods, $7.8 billion (No. 2 in 1996; No. 1 in 2006)
4. Danone North America, $6 billion (No. 24 in 1996; No. 24 in 2006)
5. KraftHeinz, $5.5 billion (No. 6 in 1996; No. 2 in 2006)
6. Schreiber Foods, $5 billion (No. 6 in 1996; No. 5 in 2006)
7. Agropur, $4.6 billion (NR 1996; No. 9 in 2006, 13 U.S. plants)
8. DFA, $4.1 billion (did not exist in 1996; No. 8 in 2006)
9. Land O’Lakes, $3.9 billion, (No. 3 1996; No. 4 2006)
10. Kroger, $3.6 billion (No. 5 in 1996; No. 10 in 2006)
DFA and LOL at their lowest rank, Agropur heads Co-ops
Source: Dairy Foods Magazine
12/11/2018
5
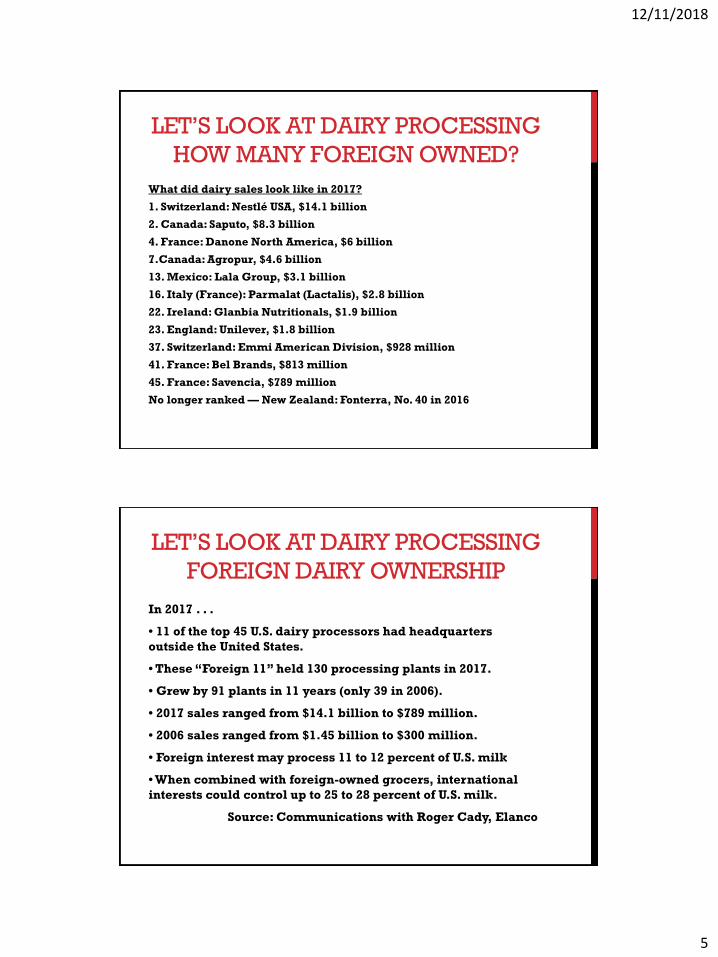
LET’S LOOK AT DAIRY PROCESSING
HOW MANY FOREIGN OWNED?
What did dairy sales look like in 2017?
1. Switzerland: Nestlé USA, $14.1 billion
2. Canada: Saputo, $8.3 billion
4. France: Danone North America, $6 billion
7.Canada: Agropur, $4.6 billion
13. Mexico: Lala Group, $3.1 billion
16. Italy (France): Parmalat (Lactalis), $2.8 billion
22. Ireland: Glanbia Nutritionals, $1.9 billion
23. England: Unilever, $1.8 billion
37. Switzerland: Emmi American Division, $928 million
41. France: Bel Brands, $813 million
45. France: Savencia, $789 million
No longer ranked — New Zealand: Fonterra, No. 40 in 2016
LET’S LOOK AT DAIRY PROCESSING
FOREIGN DAIRY OWNERSHIP
In 2017 . . .
• 11 of the top 45 U.S. dairy processors had headquarters
outside the United States.
• These “Foreign 11” held 130 processing plants in 2017.
• Grew by 91 plants in 11 years (only 39 in 2006).
• 2017 sales ranged from $14.1 billion to $789 million.
• 2006 sales ranged from $1.45 billion to $300 million.
• Foreign interest may process 11 to 12 percent of U.S. milk
• When combined with foreign-owned grocers, international
interests could control up to 25 to 28 percent of U.S. milk.
Source: Communications with Roger Cady, Elanco
12/11/2018
6
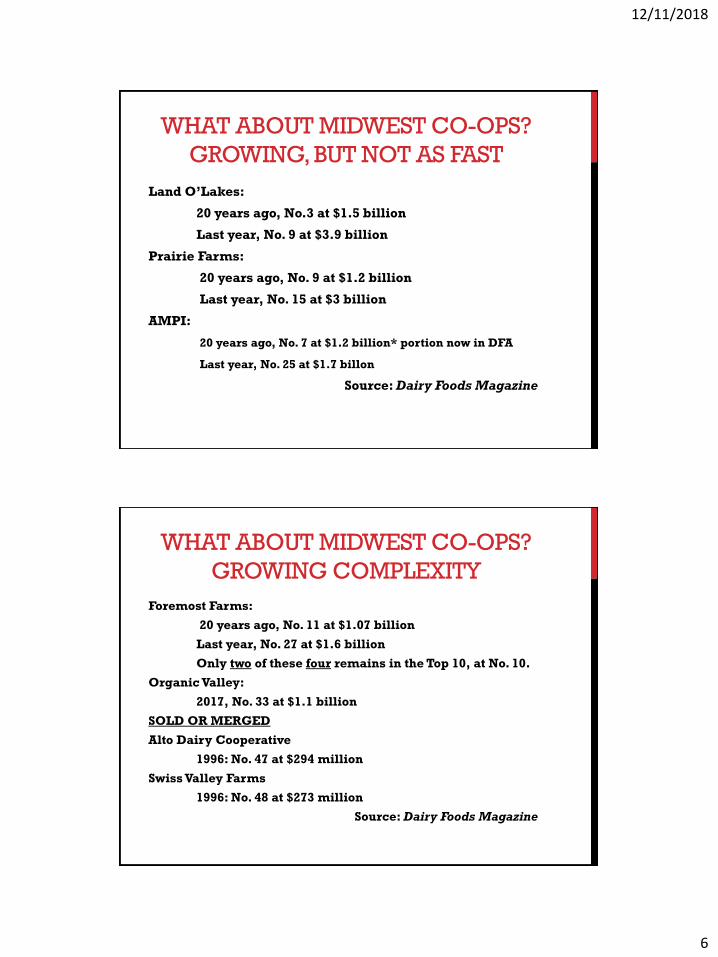
WHAT ABOUT MIDWEST CO-OPS?
GROWING, BUT NOT AS FAST
Land O’Lakes:
20 years ago, No.3 at $1.5 billion
Last year, No. 9 at $3.9 billion
Prairie Farms:
20 years ago, No. 9 at $1.2 billion
Last year, No. 15 at $3 billion
AMPI:
20 years ago, No. 7 at $1.2 billion* portion now in DFA
Last year, No. 25 at $1.7 billon
Source: Dairy Foods Magazine
WHAT ABOUT MIDWEST CO-OPS?
GROWING COMPLEXITY
Foremost Farms:
20 years ago, No. 11 at $1.07 billion
Last year, No. 27 at $1.6 billion
Only two of these four remains in the Top 10, at No. 10.
Organic Valley:
2017, No. 33 at $1.1 billion
SOLD OR MERGED
Alto Dairy Cooperative
1996: No. 47 at $294 million
Swiss Valley Farms
1996: No. 48 at $273 million
Source: Dairy Foods Magazine

12/11/2018
7
WHERE DOES CANADA FIT IN?
On the plus side:
First, let’s acknowledge that Saputo and Agropur have
been, for the most part, good players in the dairy
community.
Second, their investment has helped soak up milk.
20 years ago: 154 billion pounds of milk from 9.35 million cows
Last year: 215.5 billion pounds of milk from 9.39 million cows
That’s 40 PERCENT MORE MILK in two decades
WHERE DOES CANADA FIT IN?
On the concerning side:
Let’s remember that their first loyalty to their home office.
For example, U.S. dairy farmers cannot become members
of the Agropur and that speaks to loyalty and returns to
membership (profits).
Foreign interests have less at stake in U.S. dairy policy, and
perhaps stand counter to it.
12/11/2018
8
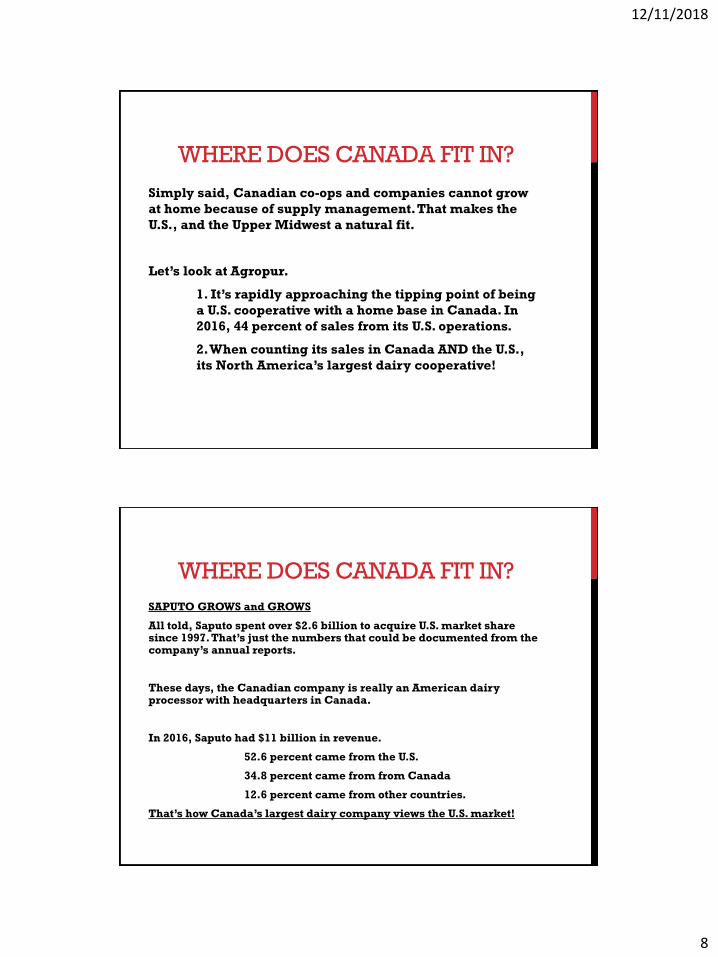
WHERE DOES CANADA FIT IN?
Simply said, Canadian co-ops and companies cannot grow
at home because of supply management. That makes the
U.S., and the Upper Midwest a natural fit.
Let’s look at Agropur.
1. It’s rapidly approaching the tipping point of being
a U.S. cooperative with a home base in Canada. In
2016, 44 percent of sales from its U.S. operations.
2. When counting its sales in Canada AND the U.S.,
its North America’s largest dairy cooperative!
WHERE DOES CANADA FIT IN?
SAPUTO GROWS and GROWS
All told, Saputo spent over $2.6 billion to acquire U.S. market share since 1997. That’s just the numbers that could be documented from the company’s annual reports.
These days, the Canadian company is really an American dairy processor with headquarters in Canada.
In 2016, Saputo had $11 billion in revenue.
52.6 percent came from the U.S.
34.8 percent came from from Canada
12.6 percent came from other countries.
That’s how Canada’s largest dairy company views the U.S. market!
12/11/2018
9
WHERE DOES CANADA FIT IN?
NOW BACK TO THE QUESTION
Question: Do Canada and European view the U.S. as part of
their long-term growth plan?
Answer: Yes, based on U.S. activity. It’s already happening.
Question: Have U.S. dairy processors and co-ops kept pace
on investment in new facilities?
Answer: Not exactly based on foreign investment & market
share.
12/11/2018
10
LEADERS ARE TALKING
Four-part article series in Hoard’s Dairyman is bringing this to the forefront.
“Ceding of domestic control and investment of U.S. dairy processing is one of my greatest concerns,” Peter Vitaliano National Milk Producers Federation.
“We need to somehow put together an organization in which dairy cooperatives can go out and borrow money to reinvest in processing. We cannot allow foreign investment to overtake our domestic markets,” Randy Mooney, Chairman of the National Milk Producers Federation.
THIS RELATES TO OUR FUTURE
“By 2066, we will need to grow our exports to between 25 to 42
percent of all U.S. milk production if milk output grows as
projected by Hoard’s Dairyman,” Tom Gallagher, CEO of Dairy
Management Inc.
The reality — 95 percent of customers live outside the U.S.
12/11/2018
11
WHAT ABOUT EXPORTS?
We must navigate these growing marketing complexities by
working with all dairy processors, whether U.S. based or owned by
international firms.
That’s where the U.S. Dairy Export Council comes into play
U.S. dairy farmer funded through the dairy checkoff
Processor and marketer membership fees
“Next 5 percent” from state and regional programs
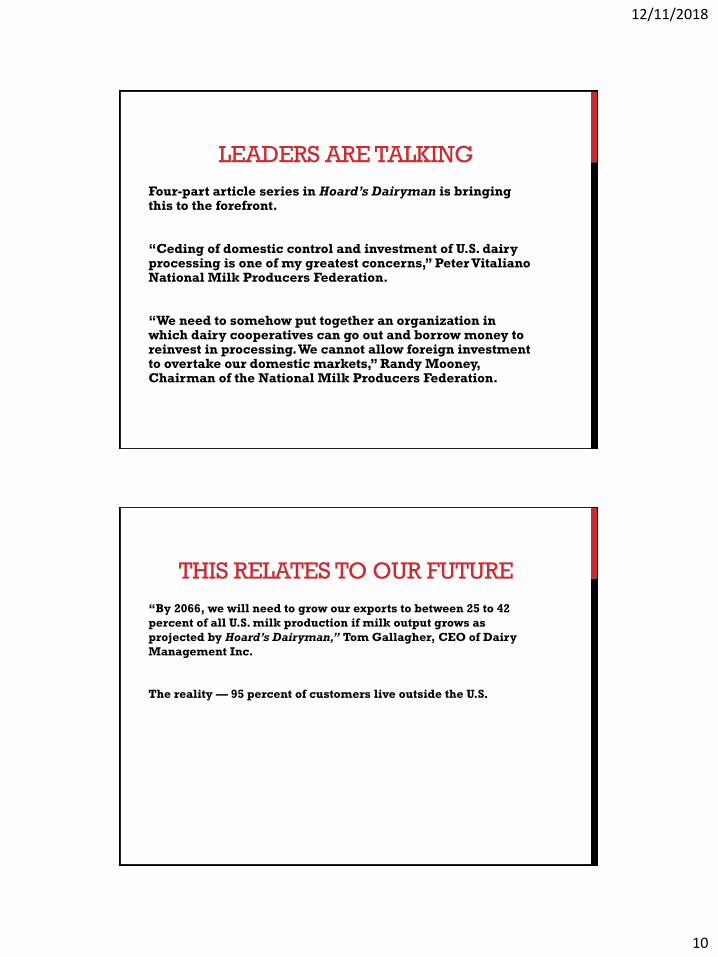
WHAT ABOUT EXPORTS?
Middle East market realities
12/11/2018
12
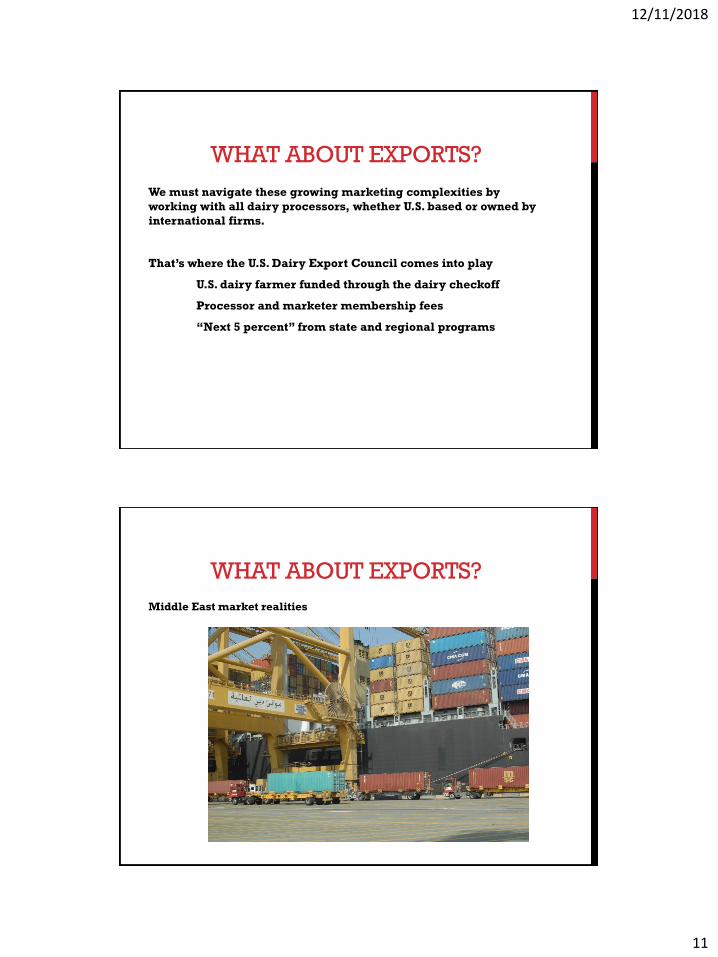
WHAT ABOUT EXPORTS?
Vietnam and Vinamilk
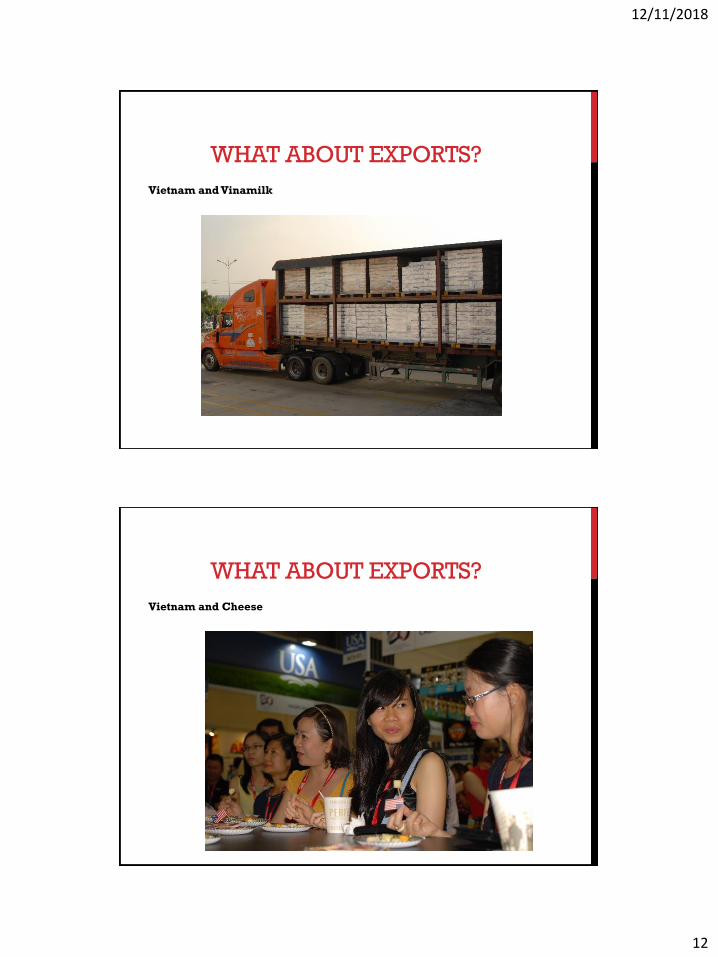
WHAT ABOUT EXPORTS?
Vietnam and Cheese
12/11/2018
13
WHAT ABOUT EXPORTS?
Vietnam — a different market
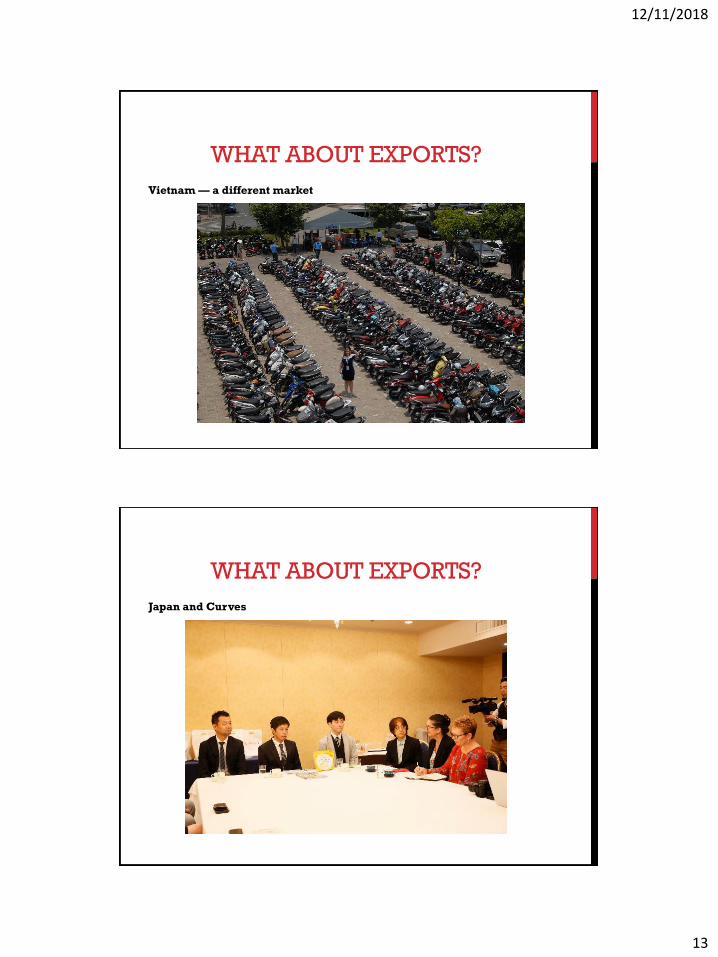
WHAT ABOUT EXPORTS?
Japan and Curves
12/11/2018
14
WHAT ABOUT EXPORTS?
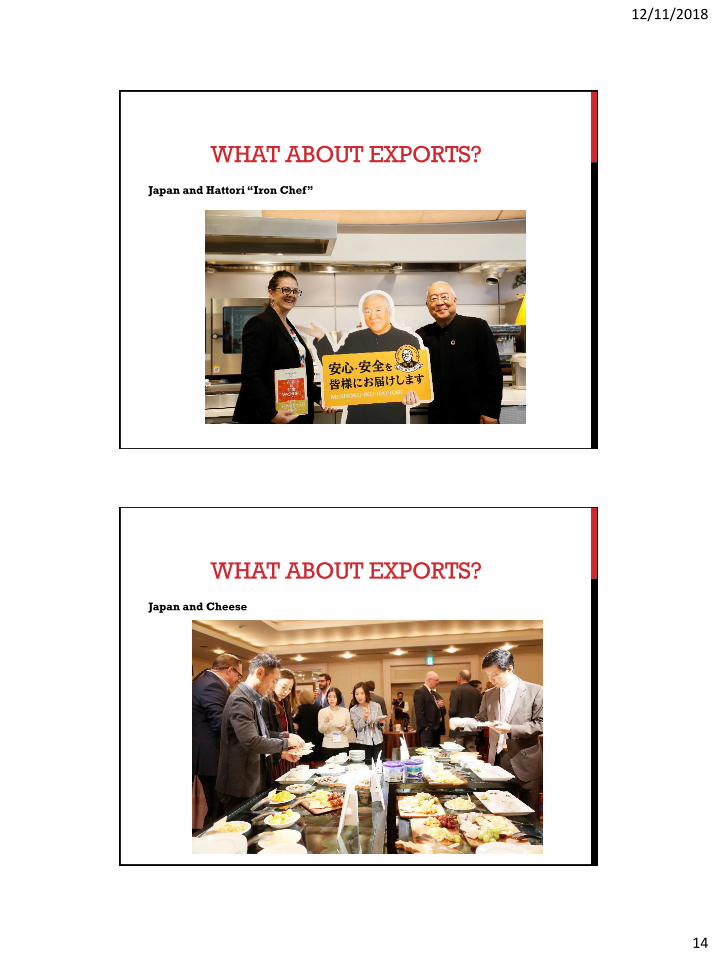
Japan and Hattori “Iron Chef”
WHAT ABOUT EXPORTS?
Japan and Cheese
12/11/2018
15
WHAT ABOUT EXPORTS?
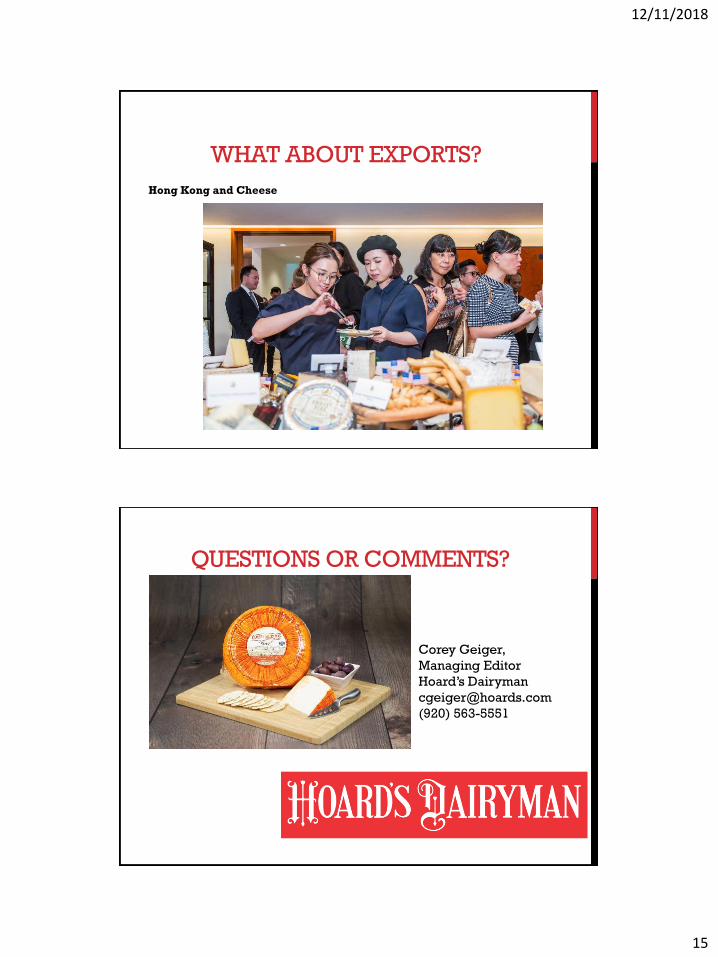
Hong Kong and Cheese
QUESTIONS OR COMMENTS?
Corey Geiger,
Managing Editor
Hoard’s Dairyman
(920) 563-5551