global dairy update - amazon web...
TRANSCRIPT

1
GLOBAL DAIRY UPDATE
NOVEMBER 2017
KEY DATES
1 December 2017 Compliance Date for Share Standard 2017/18 Season
Early December 2017 FY18 Investor Day
Early December 2017 Business Update
March 2018 Interim Results Announcement
• Strong growth in dairy imports continuesin China and Asia. Middle East and Africaimports continue to soften.
• Further decline in dairy exports fromNew Zealand and Australia. EU showingstrong export growth.
• Milk production in New Zealand improvedin October. European milk productionincreased for the fourth consecutive month.
• In October, Fonterra New Zealand milkcollection increased 2% to 209 millionkgMS and Fonterra Australia milk collectionincreased 31% to 18 million kgMS.
• Foodservice business tops$2 billion in revenue.
• Farmers band together to improve local waterway.

% % % %
To view a chart that illustrates year-on-year changes in imports –
2
OUR MARKETS
GLOBAL IMPORTS
STRONG GROWTH IN DAIRY IMPORTS CONTINUES IN CHINA AND ASIA. MIDDLE EAST AND AFRICA IMPORTS CONTINUE TO SOFTEN
Latin America’s dairy import volumes¹ were flat in July compared to the same month the previous year as growth in SMP and whey powder was offset by declines in WMP and AMF.
Imports for the 12 months to July remain strong, up 10%, or 181,000 MT, compared to the same period the previous year.
Growth for the 12 months to July was seen in almost all import categories. In particular, cheese and SMP which account for 42% of total imports, were up a combined 15%, or 112,000 MT.
Asia (excluding China) dairy import volumes² increased 3% in July compared to the same month the previous year.
Imports of SMP were up 33%, or 21,000 MT, partially offset by declines in fluid and fresh dairy, lactose and cheese.
Imports for the 12 months to July were up 9%, or 356,000 MT, compared to the same period the previous year.
Increases were seen in all key import categories, in particular SMP, fluid and fresh dairy, cheese and whey powder up a combined 10% or 257,000 MT for the 12 months to July.
Middle East and Africa dairy imports³ decreased 3%, or 8,000 MT, in July compared to the same month the previous year.
Growth in fluid and fresh dairy and SMP, up 10% collectively, was more than offset by declines in cheese, butter and infant formula.
Imports for the 12 months to July were down 2%, or 82,000 MT. Fluid and fresh dairy, the region’s largest import category, was up 57,000 MT however the majority of key import categories were down, with WMP, butter, infant formula and cheese down a combined 131,000 MT.
China dairy imports increased 34%, or 53,000 MT, in September compared to the same month last year.
WMP, infant formula and SMP led this increase, up a combined 96%, or 33,000 MT.
Imports for the 12 months to September were up 12%, or 263,000 MT, compared to the same period last year.
Imports continue to be very strong in China, with almost all categories showing growth this year. WMP, infant formula and SMP experienced the largest growth, up a combined 22%, or 179,000 MT.
LATIN AMERICA ASIA MIDDLE EAST & AFRICA CHINA
Import change for the 12 months to September 2017
Import change for the 12 months to July 2017
Import change for the 12 months to July 2017
Import change for the 12 months to July 2017
9 12210
1 Excludes Venezuela and Nicaragua. 2 Includes estimate for Indonesia (July) and Macao (October‑July).
3 Includes estimate for Egypt (July).
% % % %
To view a chart that illustrates year-on-year changes in exports –
3
OUR MARKETS
GLOBAL EXPORTS
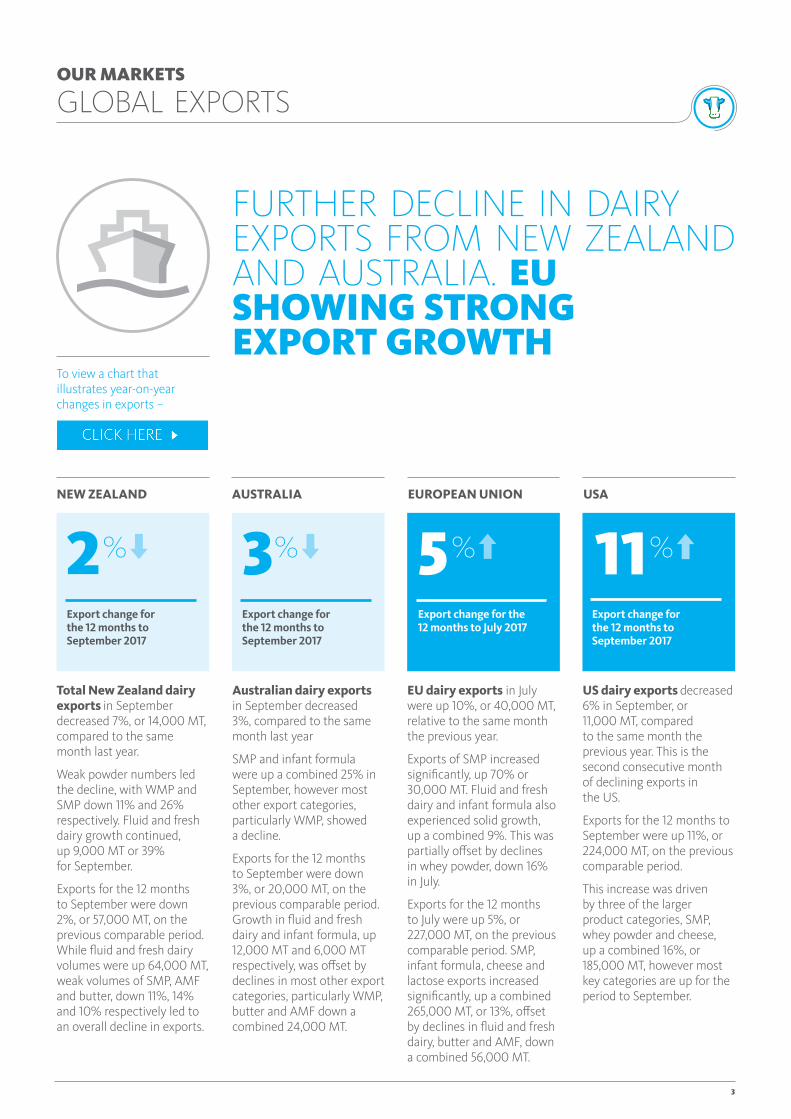
FURTHER DECLINE IN DAIRY EXPORTS FROM NEW ZEALAND AND AUSTRALIA. EU SHOWING STRONG EXPORT GROWTH
Total New Zealand dairy exports in September decreased 7%, or 14,000 MT, compared to the same month last year.
Weak powder numbers led the decline, with WMP and SMP down 11% and 26% respectively. Fluid and fresh dairy growth continued, up 9,000 MT or 39% for September.
Exports for the 12 months to September were down 2%, or 57,000 MT, on the previous comparable period. While fluid and fresh dairy volumes were up 64,000 MT, weak volumes of SMP, AMF and butter, down 11%, 14% and 10% respectively led to an overall decline in exports.
EU dairy exports in July were up 10%, or 40,000 MT, relative to the same month the previous year.
Exports of SMP increased significantly, up 70% or 30,000 MT. Fluid and fresh dairy and infant formula also experienced solid growth, up a combined 9%. This was partially offset by declines in whey powder, down 16% in July.
Exports for the 12 months to July were up 5%, or 227,000 MT, on the previous comparable period. SMP, infant formula, cheese and lactose exports increased significantly, up a combined 265,000 MT, or 13%, offset by declines in fluid and fresh dairy, butter and AMF, down a combined 56,000 MT.
US dairy exports decreased 6% in September, or 11,000 MT, compared to the same month the previous year. This is the second consecutive month of declining exports in the US.
Exports for the 12 months to September were up 11%, or 224,000 MT, on the previous comparable period.
This increase was driven by three of the larger product categories, SMP, whey powder and cheese, up a combined 16%, or 185,000 MT, however most key categories are up for the period to September.
Australian dairy exports in September decreased 3%, compared to the same month last year
SMP and infant formula were up a combined 25% in September, however most other export categories, particularly WMP, showed a decline.
Exports for the 12 months to September were down 3%, or 20,000 MT, on the previous comparable period. Growth in fluid and fresh dairy and infant formula, up 12,000 MT and 6,000 MT respectively, was offset by declines in most other export categories, particularly WMP, butter and AMF down a combined 24,000 MT.
NEW ZEALAND AUSTRALIA EUROPEAN UNION USA
1132 5Export change for the 12 months to September 2017
Export change for the 12 months to September 2017
Export change for the 12 months to September 2017
Export change for the 12 months to July 2017

% % % %
To view a chart that illustrates year-on-year changes in production –
4
OUR MARKETS
GLOBAL PRODUCTION
MILK PRODUCTION IN NEW ZEALAND IMPROVED IN OCTOBER. EUROPEAN MILK PRODUCTION INCREASED FOR THE FOURTH CONSECUTIVE MONTH
Total New Zealand milk production production in October is up 3% compared to the same month last year, as weather conditions improved towards the latter part of the month.
For the 12 months to October, milk production is flat compared to the same period the previous year.
New Zealand supply typically peaks in mid-October, however wet weather across the country for most of spring meant the peak was later and impacted volumes in both the North and South Islands.
Fonterra collections have been reported for October, see page 5 for details.
Australia production in September decreased 1% compared to the same month last year.
Production for the 12 months to September was down 4% compared to the same period the previous year.
The decline in production is largely due to poor spring weather conditions and reduced herd size compared to 2017.
Fonterra collections in Australia have been reported for October, see page 5 for details.
EU production in September increased 5% compared to the same month last year with Germany and France, the two largest EU producers, up a combined 4%.¹
September showed the largest growth since early 2016 as production ramps up on the back of increased demand.
Production for the 12 months to September was flat. Across this period, Germany and France were down 2% and 3% respectively, offset by growth out of Italy, Ireland and Poland, up 4%, 6% and 4% respectively.
US production in September increased 1% compared to the same month last year. This is largely due to increased herd numbers and improved production per cow.²
Milk production for the 12 months to September increased 2% compared to the same period the previous year.
NEW ZEALAND AUSTRALIA EUROPEAN UNION USA
Production change for the 12 months to September 2017
Production change for the 12 months to October 2017
Production change for the 12 months to September 2017
Production change for the 12 months to September 2017
0 4 20
1 http://usda.mannlib.cornell.edu/usda/current/MilkProd/MilkProd‑10‑20‑2017.pdf.
1 European production data for September has been estimated based on IFCN data.

% % %
To view a table that shows our detailed milk collection in New Zealand and Australia compared to the previous season –
VO
LUM
E (M
LIT
RES/
DAY
)
JUN JUL AUG SEP OCT NOV DEC JAN FEB MAR APR MAY
2017/18 2016/17 2015/16
0
20
40
60
80
100
5
OUR MARKETS
FONTERRA MILK COLLECTION 2017/18 SEASON
NEW ZEALAND NORTH ISLAND SOUTH ISLAND AUSTRALIA
Flat for the season from 1 June to 31 October
Flat for the season from 1 June to 31 October
Flat for the season from 1 June to 31 October
Increase for the season from 1 July to 31 October
0 0 0 26
NEW ZEALAND MILK COLLECTION
Fonterra’s milk collection across Australia for the four months to 31 October reached 53 million kgMS, 11 million kgMS higher than last season.Collections in October were up 31% on the same month last year. In addition to new farmer suppliers, growth has been supported by strong seasonal conditions across all regions.
A high-quality silage and fodder harvest, good rainfall and soil moisture profiles, combined with reasonable feed, fertiliser and water pricing continues to underpin sustained growth this season.
North Island milk collection in October reached 124 million kgMS, 2% up on October last season.
South Island milk collection in October reached 85 million kgMS, 3% up on October last season.
Fonterra’s milk collection across New Zealand for the five months to 31 October reached 502 million kgMS, in line with the same period last seasonCollections in October reached 209 million kgMS, up 2% on the same month last season, as weather conditions began to improve towards the end of the month after a wet spring.
Daily collections peaked on 26 October at 82 million litres, up 1% on last season’s peak of 80 million litres.
%

% % %
% %%
To view more information, including a snapshot of the rolling year-to-date results –
%
GDT PRICE INDEX NZD/USD SPOT RATE
NOV 15 AUG 16 JAN 17 MAR 17 JUN 17 AUG 17 NOV 17JAN 16 MAR 16 JUN 16 NOV 16400
600
800
1,000
1,200
0.62
0.66
0.70
0.74
0.78
PRIC
E IN
DEX
NZD
/ USD
6
OUR MARKETS
FONTERRA GLOBALDAIRYTRADE RESULTS
Fonterra GDT sales by destination:
Dairy commodity prices and New Zealand dollar trendThe New Zealand dollar declined during October due to the strengthening of the US dollar and uncertainty around the change in the New Zealand Government. This reflected concerns around possible changes to the Reserve Bank of New Zealand Act.
Fonterra GDT results at last trading event 7 November 2017:
The next trading event will be held on 21 November 2017. Visit www.globaldairytrade.info for more information.
Change in Fonterra’s weighted average product price from previous event
2.9Fonterra’s weighted average product price (USD/MT)
3,113USD
Fonterra product quantity sold on GDT
000’ MT34.1
NORTH ASIA (INCLUDING CHINA)
SOUTH EAST ASIA
MIDDLE EAST AND AFRICA
LATIN AMERICA
OTHER
USD 1,819/MT
1.2SMP
USD 6,894/MT
0.8AMF
USD 4,001/MT
2.6CHEDDAR
USD 5,465/MT
2.6RENNET CASEIN
USD 5,516/MT
3.8BUTTER
USD 2,852/MT
5.4WMP
34,052 MT
LATEST AUCTION
235,215 MT
FINANCIAL YEAR‑TO‑DATE

77
OUR PERFORMANCE
FONTERRA’S FOODSERVICE BUSINESS TOPS $2 BILLION IN REVENUE
Fonterra’s Foodservice business, Anchor™ Food Professionals™, generated more than $2 billion in annual revenue over the past year
Fonterra Chief Operating Officer, Consumer and Foodservice, Lukas Paravacini, said the achievement is the result of changing lifestyles by consumers and a new way of working, which is about partnering with customers to help their businesses succeed in this rapidly growing industry.
“Foodservice is one of the largest industries in the world and encompasses food and beverages that are consumed out of the home such as in restaurants, cafes and bakeries.
“In the USA more than 50% of all spend on food and beverage is now out of home and in China the market has grown by 30% over the last five years. As a result, the global industry is predicted to be worth US$3 trillion in 2021.
“We have taken advantage of this eating out trend and currently Anchor™ Food Professionals™ is growing around 10 times faster than the global total foodservice market.
“It is part of our strategy of focussing on adding more value to every drop of our farmers’ milk. The gross margin from foodservice is two or three times what we can earn from basic ingredient products,” said Lukas.
Global Director Foodservice, Grant Watson, said a new business model which
centres around providing solutions based on customer insights, has been central to this success.
“We have 56 chefs in more than 50 countries who go into kitchens to demonstrate the products. They get to know their customers, work to understand their issues and challenges, and help us design more new products to help address those problems.
“We know the smallest things can make a difference, so we make our products last longer, stretch further, work faster, waste less, withstand more. We bring together world class dairy products and the deep expertise of our people to work alongside the passionate, talented and innovative food professionals who are driving the foodservice industry to new heights,” said Grant.
“We also have a very clear channel-led system,” adds
Grant. “This provides foodservice kitchens around the world with ingredients for some of the largest categories in the business; Asian-style Bakeries, Italian Kitchens and Quick Service Restaurants. Our ingredients include our extra stretch mozzarella, UHT culinary and whipping creams, laminated butter sheets and cream cheese.”
Lukas said that over the past four years Fonterra has committed $850 million in new production capacity for Foodservice – $700 million of which has been in New Zealand. These expansions are at Waitoa in the Waikato for UHT creams, Eltham in Taranaki for slice-on-slice cheese, Clandeboye in Canterbury for extra stretch mozzarella and Te Rapa in the Waikato and Darfield in Canterbury for cream cheese.
“These investments are helping us to match increasing demand for our products and ensuring that we remain on track to meet our annual revenue target of $5 billion by 2023,” said Lukas.
LUKAS PARAVICINI, CHIEF OPERATING OFFICER CONSUMER AND FOODSERVICE AND GRANT WATSON, DIRECTOR GLOBAL FOODSERVICE

8
OUR CO-OP
Farmers band together to improve local waterway
Finding the balance between making a profit and farming sustainably has always been at the forefront of Fonterra farmer Paul Warneford’s mind. “Swimming in our local rivers, white baiting, doing things us Kiwis love doing, while having a sustainable farming practice is the ultimate goal,” says Paul.
In 2015, 12 dairy farmers started the Nukuhou North and Waiotahi River Streams Group, aiming to improve the sustainability of their farming operations. The group was formed after agri-ecology consultant Alison Dewes spoke to a group of farmers about sustainable farming and finding a sweet spot around environment, profit and production.
Paul alone spends $40,000-$60,000 every year on fencing and riparian planting on his 806ha farm. “I’ve put wetlands at the ends of all my drains to catch any sediment and have built 20 dams around my farm to help filter any runoff,” says Paul.
“Wetlands are designed by nature, we just need to enhance them to catch the sediment and disperse the leaching at a slower rate.”
The Bay of Plenty Regional Council supports this work by co-funding riparian fencing, planting and wetland restoration and creation. The council also monitors water quality improvements in the Nukuhou and Waiotahi Rivers to see where more attention is needed.
Another member of the Nukuhou North River Stream Group and Fonterra farmer Norman Craig says, “We’ve teamed up with the council to show that we are trying to make a difference. We want to comply with their standards and we encourage them to come out and run tests on our farms.”
“We want to find out if some plants are better at filtering than others or if it just looks beautiful,” says Paul.
Each farmer in the group contributes annually to have their farm’s finances and inputs analysed by external consultant, Alison Dewes, who then produces an environmental and business report. The Bay of Plenty Regional Council also provides up to $1,500 per farm in support.
Within the next three years, the group aims to identify each farmer’s strengths and how they can learn from each other to reduce their overall impact on the environment.
The Nukuhou River is tested five times per year, and Bay of Plenty Regional Council Land Management Officer, Charles Harley, says the results are showing positive trends.
“While it is improving and trends are heading in the right direction, it’s still a work in progress and the farmers in the area acknowledge this,” says Charles Harley.
In 2015, Nukuhou River won an award for the most improved river and since then has shown meaningful improvement in total nitrogen, E. coli and clarity.

PRODUCTION
AUSTRALIA AVERAGEUNITED STATESNEW ZEALAND EU27
NOV 16 JUN 17MAY 17APR 17FEB 17JAN 17DEC 16 AUG 17 OCT 17SEP 17JUL 17MAR 17
LIQ
UID
MIL
K (M
LIT
RES)
-1,000
-750
-250
-500
250
0
750
500
EXPORTS
AUSTRALIAUNITED STATESNEW ZEALAND EU27
JUL 17JUN 17MAY 17MAR 17FEB 17JAN 16DEC 16NOV 16OCT 16 SEP 17AUG 17APR 17
MT
(00
0s)
-80
-40
0
40
80
120
AVERAGE
IMPORTS
MIDDLE EAST & AFRICA LATIN AMERICAASIA CHINA
NOV 16 JUN 17MAY 17MAR 17FEB 17DEC 16 JAN 16 AUG 17OCT 16 SEP 17APR 17 JUL 17
MT
(00
0s)
-80
-40
0
160
40
80
120
AVERAGE
9
SUPPLEMENTARY INFORMATION
Global Dairy Market The charts on the right illustrate the year-on-year changes in imports, exports and production for a range of countries that are important players in global dairy trade.
The absolute size of the bars represents the change in imports, exports or production, relative to the same period the previous year.
Averages are shown where data is complete for the regions presented. NOTE: Data for Asia, Middle East and Africa and Latin America to July, China to September.
NOTE: Data for EU to July; New Zealand, US and Australia to September.
NOTE: Data for EU, Australia, and US to September, New Zealand to October.
SOURCE: Government milk production statistics/GTIS trade data/Fonterra analysis.

WEIGHTED AVERAGE PRICE QUANTITY SOLD
JAN 17DEC 16 SEP 17AUG 17 OCT 17APR 17 MAY 17FEB 17 JUN 17NOV 16 JUL 17MAR 1716,000
22,000
28,000
34,000
40,000
2,400
2,800
3,200
3,600
4,000
WEI
GH
TED
AV
ERA
GE
PRIC
E (U
SD/M
T)
QU
AN
TITY SOLD
( MT)
10
SUPPLEMENTARY INFORMATION
Fonterra milk productionThe table on the right shows Fonterra milk solids collected in New Zealand and Australia compared to the previous season.
MILK COLLECTION (MILLION KGMS)
OCTOBER 2017
OCTOBER 2016
MONTHLY CHANGE
SEASON-TO-DATE
2017/18
SEASON-TO-DATE
2016/17
SEASON-TO-DATE CHANGE
Total Fonterra New Zealand
208.8 204.2 2.3% 502.4 500.9 0.3%
North Island 124.3 121.7 2.1% 326.9 325.7 0.3%
South Island 84.6 82.5 2.6% 175.5 175.2 0.2%
Fonterra Australia 18.4 14.1 30.6% 52.6 41.8 25.8%
Fonterra GDT resultsThis table provides more information on the latest results, including a snapshot of the year-to-date results.
LAST TRADING EVENT (7 NOVEMBER 2017)
YEAR-TO-DATE (FROM 1 AUGUST 2017)
Quantity Sold on GDT (Winning MT)
34,052 235,215
Change in Quantity Sold on GDT over same period last year
28.0% 2.4%
Weighted Average Product Price (USD/MT)
3,113 3,293
Change in Weighted Average Product Price over same period last year
(8.5%) 12.7%
Change in Weighted Average Product Price from previous event
(2.9%) –
Fonterra GDT ResultsThis chart shows Fonterra GDT prices and volumes over the past 12 months.

11
AMFAnhydrous Milk Fat.
BMPButter Milk Powder.
DIRADairy Industry Restructuring Act 2001 (New Zealand).
Farmgate Milk PriceThe price for milk supplied in New Zealand to Fonterra by farmer shareholders.
Fluid and Fresh DairyThe Fonterra grouping of fluid milk products (skim milk, whole milk and cream – pasteurised or UHT processed), concentrated milk products (evaporated milk and sweetened condensed milk) and yoghurt.
GDT
GlobalDairyTrade, the online provider of the twice monthly global auctions of dairy ingredients.
kgMSKilogram of milk solids, the measure of the amount of fat and protein in the milk supplied to Fonterra.
LME (Liquid Milk Equivalent)A standard measure of the amount of milk (in litres) allocated to each product based on the amount of fat and protein (“milk solids”) in the product relative to the amount of fat and protein in a standardised raw milk.
Non-Reference ProductsAll dairy products, except for Reference Products, produced by the NZ Ingredients business.
Reference ProductsThe dairy products used in the calculation of the Farmgate Milk Price, which are currently WMP, SMP, BMP, butter and AMF.
SeasonNew Zealand: A period of 12 months to 31 May in each year.
Australia: A period of 12 months to 30 June in each year.
SMPSkim Milk Powder.
WMPWhole Milk Powder.
GLOSSARY