global core: building the global real estate foundation · global core: building the global real...
TRANSCRIPT

FOR INSTITUTIONAL / WHOLESALE / PROFESSIONAL CLIENTS AND QUALIFIED INVESTORS ONLY—NOT FOR RETAIL USE OR DISTRIBUTION
Global core: Building the global real estate foundation2Q 2017
I N B R I E F• A global core real estate allocation—diversified across developed market geographies
and sectors—can provide access to a breadth and depth of investment opportunities and diversification benefits not available through traditional financial assets and/or domestic core real estate alone.
• In a low interest rate and low growth environment, a global core real estate portfolio has the potential to provide enhanced income returns through stable, transparent and consistent cash flows that can grow as rates (and inflation) rise.
• A foundational, long-term, strategic core real estate allocation should, based on our analyses, represent 60% to 80% of a typical investor’s overall real estate portfolio. Within that core foundation, we recommend an allocation of roughly 50% U.S./30% European/20% Asia-Pacific (APAC) developed markets as sensible, with a focus on investments in major cities.
• Our analysis illustrates the positive impact that a well-diversified global core real estate allocation may have on the risk and return characteristics of an investor’s overall portfolio.
WHAT IS THE “RIGHT ” ALLOCATION TO GLOBAL CORE REAL ESTATE?
We all know the challenges institutional investors have been facing in managing their portfolios through a predominantly low growth, low interest rate environment in the developed markets. On the one hand, they are confronting yield-constrained fixed income markets that are driving a continued search for income, even as rates (at least in the U.S.) begin an anticipated gradual climb. On the other hand, uncertainty in equity markets and persistently high correlations across equity market sectors and geographies are making it difficult for investors to diversify portfolio risks through traditional financial assets alone.
We also know that pension funds, sovereign wealth funds, insurance companies, endowments, foundations and other institutional investors have long turned to core real estate for its durable income stream. But core real estate’s potential goes beyond its ability to help alleviate the pain that investors are experiencing from low-yielding bonds; the asset class can also help to diversify public equity risk given the low equity beta of its total returns. What’s more, real estate total returns are driven by local economic and market factors and local supply and demand dynamics. The result is relatively low correlation, not only between real estate and public equity markets but also among real estate markets globally. These factors are prompting investors to further diversify their domestic-heavy real estate allocations into international markets, or at least to seriously consider doing so.
AUTHORS
CONTRIBUTORS
Pulkit Sharma, CFA, CAIAHead of Real Assets Portfolio ConstructionJ.P. Morgan Global Alternatives
Bernie McNamaraHead of Real Assets Investment SolutionsJ.P. Morgan Global Alternatives
Ryan Holgan, CFAReal Assets Investment SolutionsJ.P. Morgan Global Alternatives
Cheng DaiReal Assets Investment SolutionsJ.P. Morgan Global Alternatives

2 INVESTMENT INSIGHTS
GLOBAL CORE: BUILDING THE GLOBAL REAL ESTATE FOUNDATION
In determining the “right” allocation to global core real estate and its appropriate regional mix, we take a closer look at the characteristics of real estate, its potential role in institutional portfolios and what can be learned from investors’ more global approach to their traditional equity and fixed income allocations.
THE CASE FOR A MORE GLOBAL REAL ESTATE ALLOCATION
Institutional investors tend to broadly diversify their equity and fixed income portfolios, both geographically and across investment styles. But the same is not generally true for their real estate portfolios. According to MSCI/IPD, on average, investors have approximately 50% to 60% of their equity portfolios and just over 20% of their fixed income portfolios allocated to foreign investments. Yet their real estate allocations reflect a greater home bias, with just 10% to 20% of these assets allocated internationally (EXHIBIT 1).
According to the Pension Real Estate Association (PREA) 2017 Investment Intentions Survey, North American investors have just 12% of their real estate portfolio allocated to investments outside their home region; European investors have 20% allocated abroad; and APAC investors have about 39%
allocated outside the APAC region (EXHIBIT 2A). Core real estate shares investment characteristics with both debt and equity—for example, returns underpinned by stable, bond-like yields, as well as asset values and cash flows with equity-like growth potential. It seems reasonable, then, for investors to consider a foreign real estate allocation somewhere between that for debt and equity—namely, in the range of 25% to 50%. According to the same PREA survey, investors in all three regions plan to increase allocations outside of their home markets when deploying new capital, so investors are moving closer to this implied range (EXHIBIT 2B).
There is room for further diversification of core real estateEXHIBIT 1: DOMESTIC AND FOREIGN ALLOCATIONS ACROSS ASSET CLASSES FOR DEVELOPED MARKET INVESTORS
Source: MSCI/IPD, “The erosion of the real estate home bias,” November 2014.
Developed markets = U.S., Japan, UK, Australia, Canada and Switzerland.
17%
21%
57%
Real estate
Fixed income
Equities
Domestic International
A home bias is evident in current real estate allocations …EXHIBIT 2A: REAL ESTATE REGIONAL ALLOCATIONS BY INVESTOR DOMICILE, 2016
Source: PREA 2017 Investment Intentions Survey, November 2016.
39%
20%
12%
APACinvestors
Europeaninvestors
NorthAmericaninvestors
Domestic International
… but investors seem intent on expanding internationallyEXHIBIT 2B: EXPECTED DESTINATION FOR REAL ESTATE INVESTMENTS IN 2017 BY INVESTOR DOMICILE
Source: PREA 2017 Investment Intentions Survey, November 2016.
50%
43%
22%
APACinvestors
Europeaninvestors
NorthAmericaninvestors
Domestic International

J .P. MORGAN ASSET MANAGEMENT 3
GLOBAL CORE: BUILDING THE GLOBAL REAL ESTATE FOUNDATION
Broader is better … and bigger is better, too
International real estate can provide institutional investors increased diversification benefits and greater scale of investment opportunities. These considerations are similar to those that have led investors to diversify their equity and fixed income portfolios globally, but are perhaps even more relevant within real estate.
A look at long-term inter- and intra-asset class relationships shows that 20-year annual correlations between real estate and public equities are low—indicated by the generally light green shading in EXHIBIT 3. Just as important for domestic real estate investors considering a global allocation, correlations among the real estate markets of the U.S., Europe and Asia-Pacific are moderately positive (shaded orange). These correlations are generally lower than the correlations among global public equity markets (shaded mostly red), implying that investors who go global may have even greater potential for diversification success in their real estate vs. equity portfolios.
In terms of scale, a globally diversified core real estate allocation can afford investors access to larger real estate markets and a broader range of investment opportunities. Based on market capitalization, the U.S., Europe and Asia-
Pacific real estate markets are now roughly equivalent in size (EXHIBIT 4). Investors allocating to real estate outside of their domestic markets, even if they are based in a relatively large market such as the U.S., could improve their ability to deploy capital at scale, with greater flexibility and optionality, and with room to grow and evolve their allocations over time as investment objectives and market fundamentals change.
The three core regions are nearly equivalent in sizeEXHIBIT 4: GLOBAL REAL ESTATE MARKET COMPOSITION (2015)
Source: DTZ Research, Money into Property 2015; data as of June 15, 2016.
DTZ defines invested stock as investor-held commercial real estate within the relevant country. As a consequence, the invested stock should a) increase as owner occupiers sell property to investors; b) increase as new developments are unveiled and added to the invested stock; c) increase with the general appreciation in capital values; and d) be negatively impacted by depreciation and retirement of stock.
U.S. real estate31%
Europereal estate32%
APACreal estate37%
Source: Bloomberg Barclays, Burgiss, CBRE, FTSE EPRA/NAREIT, Hedge Fund Research, Inc., IPD, Jones Lang LaSalle, MSCI, NCREIF, Standard & Poor’s, J.P. Morgan Asset Management; data (annual) as of December 2016.
*All data, except global bonds, global equities, European real estate and global income-oriented transport, is denominated in local currency. Global bonds, global equities and global income-oriented transport are denominated in USD; European real estate is denominated in euros. Unlevered real estate series were levered to reflect how institutional investors typically access the representative asset classes.
Global equities
U.S. equities
Europe equities
APAC equities
Global bonds
Private equity
Hedge funds
U.S. REITs
Int’l REITs
Core real estate
U.S. Europe APAC
Global equities
U.S. equities
Europe equities
APAC equities
Global bonds
Private equity
Hedge funds
U.S. REITs
Int’l REITs
Core
re
al e
stat
e U.S.
Europe
APAC
Global core real estate markets exhibit low correlations to equity markets and to one anotherEXHIBIT 3: LONG-TERM (1997–2016) RETURN CORRELATIONS MATRIX*
Low (negative) High (+1.0)

4 INVESTMENT INSIGHTS
GLOBAL CORE: BUILDING THE GLOBAL REAL ESTATE FOUNDATION
The tactical case: But is now a good time to go global?
There are concerns among investors that core real estate is expen-sive and returns are moderating both in the U.S. and in other major markets around the world. However, the question is—expensive vs. what? On a historical spread basis, real estate does not look expensive relative to local government and corporate debt.
In the major markets of the U.S., Europe and the Asia-Pacific region, core real estate yields are significantly higher than yields on local corporate BBB bonds (considered to be assets with comparable risk) and local government bonds—by roughly 200 to 400 basis points (bps) across all three regions (EXHIBITS 5A–5C). In the U.S., for example, core real estate’s 180bps spread to Treasuries is just slightly above the 10-year average.
Spreads over fixed income suggest real estate assets are not currently overpricedEXHIBIT 5A: U.S. FIXED INCOME AND REAL ESTATE YIELDS
EXHIBIT 5B: EUROPE FIXED INCOME AND REAL ESTATE YIELDS
EXHIBIT 5C: APAC FIXED INCOME AND REAL ESTATE YIELDS
Source: Bloomberg Barclays, NCREIF, J.P. Morgan Asset Management; data as of December 31, 2016.
Source: Bloomberg Barclays, CBRE, J.P. Morgan Asset Management; data as of December 31, 2016.
Source: Bloomberg Barclays, Jones Lang LaSalle, J.P. Morgan Asset Management; data as of December 31, 2016.
Perc
ent
2.5%3.7%4.3%
0
2
4
6
8
10
12
1990 1992 1994 1996 1998 2000 2002 2004 2006 2008 2010 2012 2014 2016
UST 10-year yield U.S. corporate BBB YTW U.S. all-property yield
180bpsoverUST
60bpsoverBBB
U.S. REyieldsare …
Perc
ent
0.3%1.1%
4.1%
Europe gov’t bond yield Europe corporate BBB yield Europe all-property yield
380bpsovergov’tbond
300bpsoverBBB
EU REyieldsare …
0123456789
10
2001 2002 2003 2004 2005 2006 2007 2008 2009 2010 2011 2012 2013 2014 2015 2016
1.1%
2.0%
4.0%
APAC gov’t bond yield APAC corporate BBB yield APAC all-property yield
290bpsovergov’tbond
200bpsoverBBB
APAC REyieldsare …
0
1
2
3
4
5
6
7
2001 2002 2003 2004 2005 2006 2007 2008 2009 2010 2011 2012 2013 2014 2015 2016
Perc
ent
J .P. MORGAN ASSET MANAGEMENT 5
GLOBAL CORE: BUILDING THE GLOBAL REAL ESTATE FOUNDATION
In Europe, however, current spreads are at historical highs, and nearly 100bps above the 10-year average. In the developed markets of the APAC region, spreads are similarly wide vs. history. These patterns suggest that now may be a good time to set out on the diversification path by investing internationally.
WHAT DOES A FOUNDATIONAL GLOBAL REAL ESTATE PORTFOLIO LOOK LIKE?
The case for “going global” in real estate appears strong, strategically and tactically. In the following sections, we address two fundamental questions for structuring a foundational global core real estate allocation:
1. What is an appropriate core/non-core real estate split? That is, how much of the real estate portfolio should be allocated to core investments—stabilized, fully leased, secure properties in major markets—with stable cash flows making up the bulk of the investments’ total returns? The remainder would be allocated to non-core assets with a higher risk/higher return profile, generally requiring new construction or improvement and more dependent on capital appreciation than on cash flow for returns.
2. How should that core component be allocated globally? How much should be invested across regions … and in what types of markets within those regions?
A lesson from equity and fixed income on core/non-core allocations
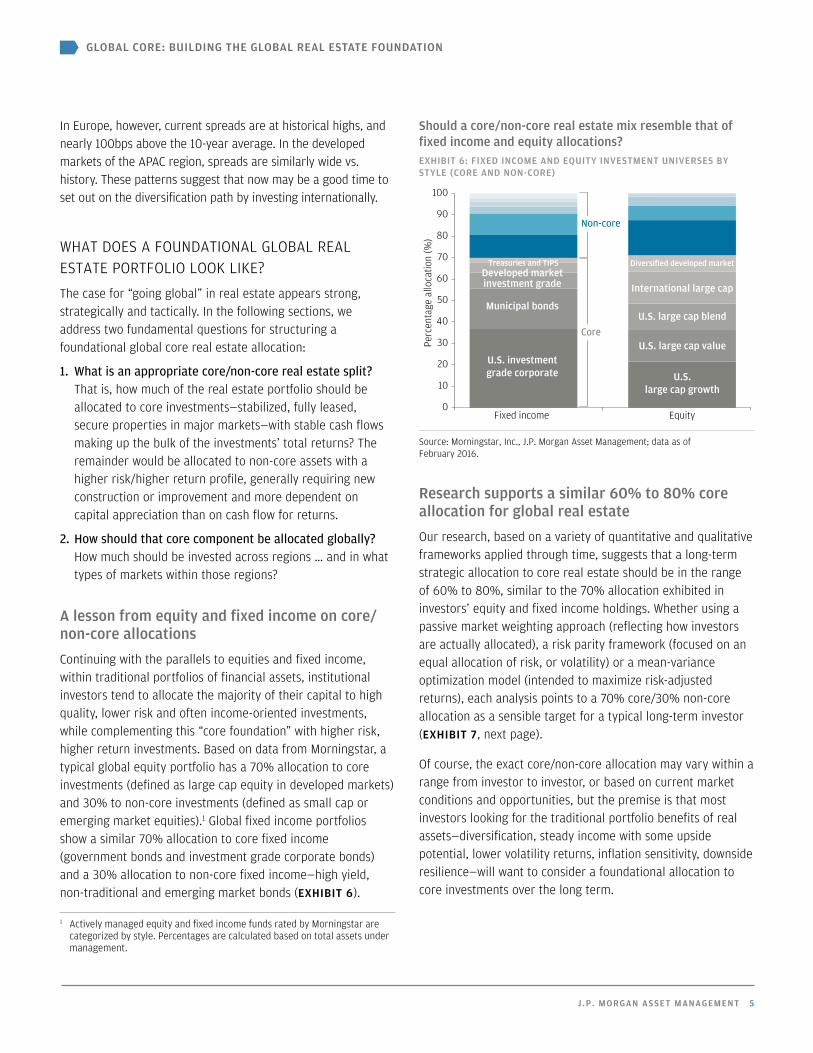
Continuing with the parallels to equities and fixed income, within traditional portfolios of financial assets, institutional investors tend to allocate the majority of their capital to high quality, lower risk and often income-oriented investments, while complementing this “core foundation” with higher risk, higher return investments. Based on data from Morningstar, a typical global equity portfolio has a 70% allocation to core investments (defined as large cap equity in developed markets) and 30% to non-core investments (defined as small cap or emerging market equities).1 Global fixed income portfolios show a similar 70% allocation to core fixed income (government bonds and investment grade corporate bonds) and a 30% allocation to non-core fixed income—high yield, non-traditional and emerging market bonds (EXHIBIT 6).
1 Actively managed equity and fixed income funds rated by Morningstar are categorized by style. Percentages are calculated based on total assets under management.
Research supports a similar 60% to 80% core allocation for global real estate
Our research, based on a variety of quantitative and qualitative frameworks applied through time, suggests that a long-term strategic allocation to core real estate should be in the range of 60% to 80%, similar to the 70% allocation exhibited in investors’ equity and fixed income holdings. Whether using a passive market weighting approach (reflecting how investors are actually allocated), a risk parity framework (focused on an equal allocation of risk, or volatility) or a mean-variance optimization model (intended to maximize risk-adjusted returns), each analysis points to a 70% core/30% non-core allocation as a sensible target for a typical long-term investor (EXHIBIT 7, next page).
Of course, the exact core/non-core allocation may vary within a range from investor to investor, or based on current market conditions and opportunities, but the premise is that most investors looking for the traditional portfolio benefits of real assets—diversification, steady income with some upside potential, lower volatility returns, inflation sensitivity, downside resilience—will want to consider a foundational allocation to core investments over the long term.
Should a core/non-core real estate mix resemble that of fixed income and equity allocations?EXHIBIT 6: FIXED INCOME AND EQUITY INVESTMENT UNIVERSES BY STYLE (CORE AND NON-CORE)
Source: Morningstar, Inc., J.P. Morgan Asset Management; data as of February 2016.
0
10
20
30
40
50
60
70
80
90
100
Fixed income EquityPe
rcen
tage
allo
catio
n (%
)
U.S. investmentgrade corporate U.S.
large cap growth
Municipal bonds
U.S. large cap value
Developed marketinvestment grade
U.S. large cap blend
International large cap
Treasuries and TIPS Diversified developed market
Core
Non-core

6 INVESTMENT INSIGHTS
GLOBAL CORE: BUILDING THE GLOBAL REAL ESTATE FOUNDATION
Core real estate characteristics provide a solid foundation
Let’s examine how core real estate delivers some of the desirable characteristics that support its 60% to 80% allocation: predictable, high cash yields; a lower volatility of total returns and a lower dispersion of returns vs. non-core real estate; and, finally, inflation sensitivity.
Stable cash flows
Historically, over 70% of core real estate total return has been generated by income vs. increases in property valuations. The stability and predictability of the income stream are driven by the underlying lease and rental agreements, which typically extend five or more years, depending on the market and sector. These lease structures result in low volatility cash flows that can support total returns throughout market cycles, especially during downturns. And the rental revenue streams are not flat. When the economy is strong, rent growth is common, resulting in equity-like upside in cash flows for landlords and investors. Thus, there is a consistent yield profile for core assets over time. As illustrated in EXHIBIT 8, over the course of several real estate cycles the income return from U.S. core real estate has been relatively stable and in all but a few instances has completely offset any capital value depreciation during recessions.
61% 63%81%
39% 37%19% 20–
40%
60–80%
0102030405060708090
100
Fixedincome
Equities Passivemarket(U.S.-
focusedpensions)
Riskparity
allocation
Sharpe-maximizing
meanvariance
Strategicreal
estateallocation
Perc
enta
ge a
lloca
tion
(%)
Real estate
Core
Non
-cor
e
Various frameworks point to an allocation of 60% to 80% to core real estate EXHIBIT 7: DETERMINING THE STRATEGIC MIX OF CORE VS. NON-CORE REAL ESTATE
Source: Institutional Real Estate, Inc. (IREI), Kingsley Associates, Morningstar Inc., NCREIF, NCREIF-ODCE, NCREIF-Townsend, J.P. Morgan Asset Management. The passive market allocation is sourced from the 2015 Institutional Investors Real Estate Trends Survey conducted by Kingsley Associates and IREI. The survey tracks responses of 86 institutional investors, of which 62 are U.S. tax-exempt institutions. The allocation represents the real estate passive market targets in private market core and non-core real estate exclusive of foreign real estate and REITs. The risk parity and mean variance frameworks are analyzed over the long term (20 years, 1995–2014, of annual U.S. real estate data) for consistency purposes.
A stable income component can smooth returns over real estate cyclesEXHIBIT 8: NCREIF NFI-ODCE ROLLING 5-YEAR APPRECIATION AND INCOME RETURNS, 1Q 1983 THROUGH 4Q 2016*
Source: NCREIF, J.P. Morgan Asset Management; data as of December 31, 2016.
*Income, appreciation and total returns are NFI-ODCE index gross returns. Returns are annualized quarterly returns.
-10
-8
-6
-4
-2
0
Perc
ent 2
4
6
8
10
1983
1984
1985
1986
1987
1988
1989
1990
1991
1992
1993
1994
1995
1996
1997
1998
1999
2000
2001
2002
2003
2004
2005
2006
2007
2008
2009
2010
2011
2012
2013
2014
2015
2016
Yield can o�setvalue declines
Rolling 5-yearappreciation(annualized)
Rolling 5-year income (annualized)
J .P. MORGAN ASSET MANAGEMENT 7
GLOBAL CORE: BUILDING THE GLOBAL REAL ESTATE FOUNDATION
Less volatile total returns
The stable income profile of core real estate contributes to the lower volatility of core vs. non-core total returns, making these core holdings more appropriate as longer-term strategic investments.
Non-core real estate strategies, on the other hand, typically invest in new development or the redevelopment, repositioning or recapitalization of existing properties. Long lead times in putting money to work and longer lock-up periods make it difficult to properly time non-core investments. For example, in the late stages of a real estate cycle, it may be difficult to find attractively priced opportunities and, as the economy subsequently weakens, to meet lease-up or property appreciation expectations.
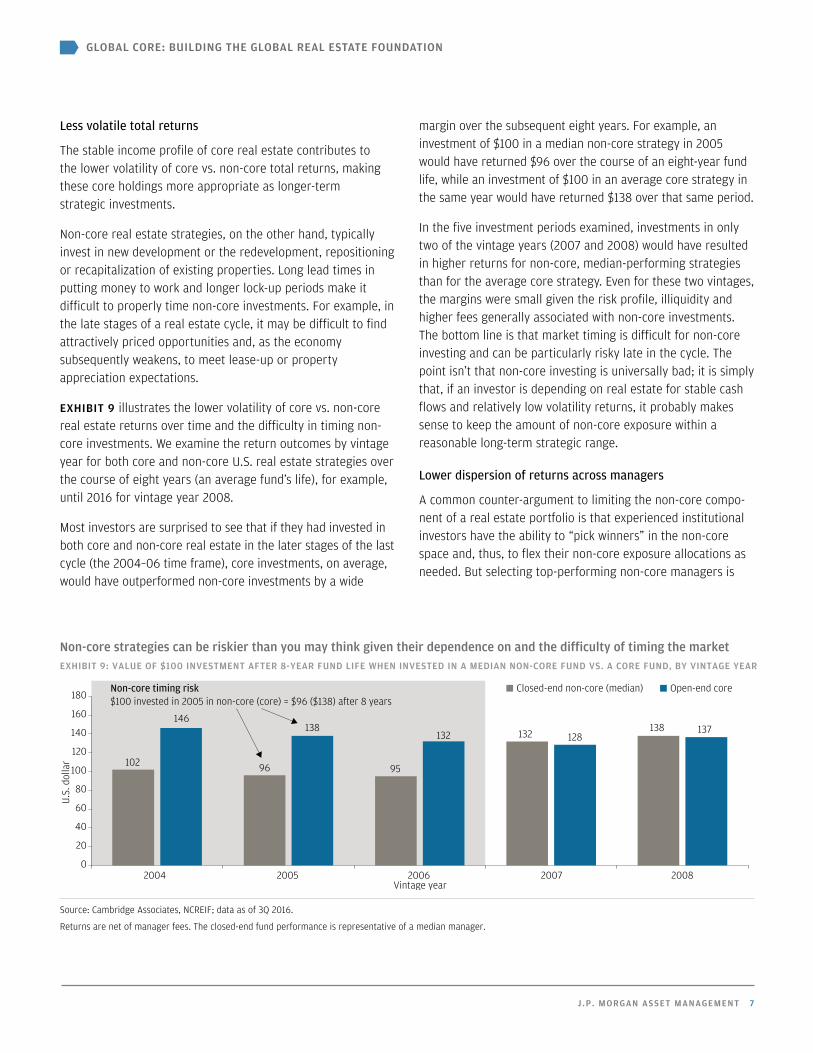
EXHIBIT 9 illustrates the lower volatility of core vs. non-core real estate returns over time and the difficulty in timing non-core investments. We examine the return outcomes by vintage year for both core and non-core U.S. real estate strategies over the course of eight years (an average fund’s life), for example, until 2016 for vintage year 2008.
Most investors are surprised to see that if they had invested in both core and non-core real estate in the later stages of the last cycle (the 2004–06 time frame), core investments, on average, would have outperformed non-core investments by a wide
margin over the subsequent eight years. For example, an investment of $100 in a median non-core strategy in 2005 would have returned $96 over the course of an eight-year fund life, while an investment of $100 in an average core strategy in the same year would have returned $138 over that same period.
In the five investment periods examined, investments in only two of the vintage years (2007 and 2008) would have resulted in higher returns for non-core, median-performing strategies than for the average core strategy. Even for these two vintages, the margins were small given the risk profile, illiquidity and higher fees generally associated with non-core investments. The bottom line is that market timing is difficult for non-core investing and can be particularly risky late in the cycle. The point isn’t that non-core investing is universally bad; it is simply that, if an investor is depending on real estate for stable cash flows and relatively low volatility returns, it probably makes sense to keep the amount of non-core exposure within a reasonable long-term strategic range.
Lower dispersion of returns across managers
A common counter-argument to limiting the non-core compo-nent of a real estate portfolio is that experienced institutional investors have the ability to “pick winners” in the non-core space and, thus, to flex their non-core exposure allocations as needed. But selecting top-performing non-core managers is
Non-core strategies can be riskier than you may think given their dependence on and the difficulty of timing the marketEXHIBIT 9: VALUE OF $100 INVESTMENT AFTER 8-YEAR FUND LIFE WHEN INVESTED IN A MEDIAN NON-CORE FUND VS. A CORE FUND, BY VINTAGE YEAR
Source: Cambridge Associates, NCREIF; data as of 3Q 2016.
Returns are net of manager fees. The closed-end fund performance is representative of a median manager.
Closed-end non-core (median) Open-end core
102 96 95
132138
146138
132 128137
0
20
40
60
80
100
120
140
160
180
2004 2005 2006 2007 2008
U.S.
dol
lar
Vintage year
Non-core timing risk$100 invested in 2005 in non-core (core) = $96 ($138) after 8 years

8 INVESTMENT INSIGHTS
GLOBAL CORE: BUILDING THE GLOBAL REAL ESTATE FOUNDATION
difficult. EXHIBITS 10A and 10B demonstrate that the dispersion of returns among non-core managers is much wider than it is for core managers. For example, a top quartile manager of a 2006 vintage fund returned, on average, 6% to investors, while the bot-tom quartile manager returned, on average, -6%. For vintage years 2004 through 2013, the average range between top and bottom quartile returns for non-core managers was 11.5% vs. a much narrower 1.8% for core managers.
Inflation sensitivity
Another attractive quality of real estate—and in particular core real estate—is its sensitivity to inflation. When inflation goes up, real estate cash flows and values may rise as well. Two key mechanisms make this inflationary pass-through possible. First, real estate lease provisions often acknowledge inflation and market rental rate movements. Second, real estate valuations are tied to replacement costs, which increase with inflation in the cost of construction labor and materials. These mechanisms work best in markets with low vacancy and low to moderate new supply, when the supply/demand balance pushes rents and/or real estate values higher.
This comparison of investment characteristics supports a foundational allocation of 60% to 80% to global core real estate through time, with complementary non-core investments of 20% to 40%, based on cycle timing and specific opportunities for investors in search of significantly higher returns. Additionally,
investors should consider weighting the core allocation toward the higher end of the range in the later stages of the real estate cycle and toward the lower end earlier in the cycle.
Next, we take a closer look at what a 60% to 80% allocation to global core real estate might look like.
The case for sticking to major cities in developed markets
The major cities of the world offer the most transparency, scale, maturity, quality and market depth for institutional investors looking to design a global core allocation that can be resilient through market cycles. Cities such as New York, San Francisco, Paris, London, Sydney and Tokyo serve as engines for both regional and global economies.
According to the Oxford Economics Global Cities 2030 study,2 by 2030 the 750 largest global cities will account for:
• 35% of the world’s population—or 2.8 billion people
• 60% of global GDP
• 55% of global consumer spending—a USD 40 trillion commercial market
• 30%, or 1.1 billion, of the world’s jobs—an increase of 240 million from 2013.
2 Global Cities 2030, Oxford Economics, September 2014.
Manager dispersion for opportunistic strategies is 6–7x wider than for core strategiesEXHIBIT 10A: PERCENTILE DISPERSION OF RETURNS SINCE INCEPTION (VINTAGE YEAR)—CLOSED-END NON-CORE FUNDS
EXHIBIT 10B: PERCENTILE DISPERSION OF RETURNS SINCE INCEPTION (VINTAGE YEAR)—OPEN-END CORE FUNDS
Source: Cambridge Associates, NCREIF; data as of 3Q 2016. Returns for core are time-weighted net returns (ODCE), and opportunistic returns are net internal rates of return (Cambridge). Returns for each year are since-inception (vintage year) returns ending in 3Q 2016.
-10
-5
0
5
10
Perc
ent
15
20
25
2004 2005 2006 2007 2008 2009 2010 2011 2012 2013Vintage year
Opportunistic median IRR
Top quartile
Bottom quartile
Average rangeof top and bottomquartile returns: 11.5%
-10
-5
0
5
10
Perc
ent
15
20
25
Vintage year2004 2005 2006 2007 2008 2009 2010 2011 2012 2013
Core median TWR
Top quartile
Bottom quartile
Average rangeof top and bottomquartile returns: 1.8%

J .P. MORGAN ASSET MANAGEMENT 9
GLOBAL CORE: BUILDING THE GLOBAL REAL ESTATE FOUNDATION
The 240 million new jobs are expected to create a need for 540 million square meters of new office space and 260 million new homes. These cities are spread throughout the major developed countries and regions, including the U.S., Western Europe, the UK, Japan, Australia, Singapore and Tier 1 cities in China.
What drives the economies of these cities? The top 25 are home to over 3,000 large companies that have annual revenue of USD 1 billion or more and account for 16% of global GDP. Tokyo alone is home to the headquarters of over 600 large companies, followed by New York, London, Osaka and Paris (EXHIBIT 11). Since 1995, the APAC region in particular has seen
the establishment of many large companies operating across industries; they both drive and benefit from regional economic growth. As of 2016, roughly 40% of Fortune 500 companies were headquartered in the APAC region, with the remainder split between the Americas and EMEA (EXHIBIT 12).
What implications does this have for a core real estate investor? The agglomeration of wealth and human capital, coupled with the presence of large, established companies, supports high and stable occupancy levels in these large cities. Gateway cities across the U.S., Europe and the APAC region have maintained higher occupancy levels than those of non-gateway cities (EXHIBITS 13A-13C, next page). Given the higher prices, greater liquidity and higher and more stable occupancy of prime real estate properties in these major metropolitan areas, yields are generally lower than the yields of real estate in less established cities. However, stable long-term occupancy supports more stable yields throughout market cycles.
Furthermore, these major cities and economies tend to be supported by strong regulations and stable governments, which can help provide transparency to investors contemplating global real estate investing. The more real estate market transparency and financial market development within a country, the more structural risks are mitigated when investing in its real estate. EXHIBIT 14 (page 11) shows that these global core markets rank high on the Jones Lang LaSalle (JLL) Global Real Estate Transparency Index. Markets in the APAC region specifically have made large strides in transparency over the past few years.
Source: McKinsey Global Institute (MGI) analysis, 2014.
The new MGI CompanyScope database includes around 8,000 public and private companies and state-owned enterprises, all with annual revenue of USD 1 billion or above.
Rank City Number of large companies1 Tokyo 6132 New York 2173 London 1934 Osaka 1745 Paris 1686 Beijing 1167 Moscow 1158 Seoul 1149 Rhein-Ruhr 10710 Chicago 10511 Hong Kong 9612 Taipei 9013 Los Angeles 8214 Zurich 7915 Sydney 7516 Stockholm 7417 Houston 7418 Nagoya 7019 Randstad 6720 Singapore 6421 Dallas 6322 Washington, DC 6223 Toronto 6124 Munich 6125 Melbourne 58
TOTALS
N. America 664Europe 694APAC 1,470
Source: The Fortune 2016 Global 500, J.P. Morgan Asset Management.
Perc
ent
33 33 3431 29
40
0
5
10
15
20
25
30
35
40
45
Americas EMEA APAC
1995 2016
EXHIBIT 11: TOP 25 CITIES RANKED BY NUMBER OF LARGE COMPANIES WITH ANNUAL REVENUE OF USD 1 BILLION OR MORE
EXHIBIT 12: LOCATION OF FORTUNE 500 COMPANY HEADQUARTERS BY REGION
Concentrations of large companies are driving real estate growth in major cities around the world

10 INVESTMENT INSIGHTS
GLOBAL CORE: BUILDING THE GLOBAL REAL ESTATE FOUNDATION
Finally, global gateway cities also tend to have more capital stock, capital flow and transaction volume than smaller secondary and tertiary cities. Such factors increase the transparency, depth and liquidity levels of global core markets, which together help make exit opportunities and the
Large gateway cities globally maintain higher occupancy, more resilient incomeEXHIBIT 13A: U.S. REAL ESTATE—LONG-TERM OCCUPANCY RATES AND MINIMUM-MAXIMUM RANGE, 2007–16
EXHIBIT 13B: EUROPE REAL ESTATE—LONG-TERM OCCUPANCY RATES AND MINIMUM-MAXIMUM RANGE, 2007–16
EXHIBIT 13C: APAC REAL ESTATE—LONG-TERM OCCUPANCY RATES AND MINIMUM-MAXIMUM RANGE, 2007–16
Source: NCREIF, J.P. Morgan Asset Management; data as of December 2016. Occupancy rates are representative of the office sector.
Source: CBRE, J.P. Morgan Asset Management; data as of December 2016. Occupancy rates are representative of the office sector.
Source: Jones Lang LaSalle Real Estate Intelligence Service; data as of December 2016.
70
75
80
85
90
95
100
Portland San Diego Atlanta
Non-gateway cities
Phoenix Houston Los Angeles Boston New YorkWashingtonD.C.
SanFrancisco
Occu
panc
y ra
te (%
)
Historicalhigh
Historicallow
Long-termaverage
Gateway cities
70
75
80
85
90
95
100
Dublin Budapest Madrid
Non-gateway cities
Lisbon Warsaw Berlin Munich ParisLondonCity
LondonWest End
Occu
panc
y ra
te (%
)
Historicalhigh
Historicallow
Gateway cities
Long-termaverage
Delhi Jakarta Mumbai
Non-gateway cities
Bangkok KualaLumpur
Sydney Singapore Hong KongTokyo
Occu
panc
y ra
te (%
)
Historicalhigh
Historicallow
Gateway cities
6065707580859095
100
Long-termaverage
probability of lease renewals throughout market cycles more likely. With all of these factors considered, major cities around the world can support all three criteria of core real estate investments—location, quality and tenancy.

J .P. MORGAN ASSET MANAGEMENT 11
GLOBAL CORE: BUILDING THE GLOBAL REAL ESTATE FOUNDATION
A foundational allocation for global core real estateEXHIBIT 15: GLOBAL CORE REAL ESTATE PORTFOLIO
STRATEGIC PORTFOLIO CHARACTERISTICS
Source: J.P. Morgan Asset Management.
*The returns are target gross returns for illustrative purposes only and are subject to significant limitations. The target returns assume moderate leverage, consistent with typical levels across regions. An investor should not expect to achieve actual returns similar to the target returns shown above. Because of the inherent limitations of the target returns, potential investors should not rely on them when making a decision on whether or not to invest in the strategy. For more information on the risks and limitations of target returns, please see disclosures at the end of this paper.
U.S.core real estate40%–60%
Europecore real estate20%–40%
APACcore real estate10%–30%
Total return* 7%–9%
Income* 4.5%–5.5%
Horizon Long term
Exposure Global
Equity beta <0.2
What is the “right” long-term strategic allocation across global real estate markets?
We propose that investors consider a strategic, broadly diversified global real estate allocation across the gateway cities of the three major regions for institutional real estate: the U.S., Europe and APAC markets. Such a portfolio has the potential to provide increased diversification benefits and greater scale of real estate investment opportunities, along with transparency, depth, liquidity and growth prospects. Specifically, a core real estate portfolio consisting of 40% to 60% U.S. real estate, 20% to 40% European real estate and 10% to 30% Asia-Pacific real estate may be a sensible, long-term allocation (EXHIBIT 15).
We took an objective, rigorous analytical approach in arriving at this strategic asset allocation, using a variety of quantitative techniques and asset allocation frameworks, including mean variance and risk parity. These portfolio modeling approaches were complemented and further refined by incorporating a
Higher transparency and liquidity of international gateway markets help ensure exit opportunities throughout market cycles and a higher probability of lease renewalsEXHIBIT 14: GLOBAL REAL ESTATE TRANSPARENCY INDEX
Source: Jones Lang LaSalle (JLL) Global Real Estate Transparency Index, 2016. Select core real estate markets ranked by JLL.
combination of target market analyses and on-the-ground market insights, as well as other qualitative inputs—in order to better account for the liquidity, transparency and depth of the respective markets, and to further inform the recommended allocation ranges. The result is an allocation designed to provide investors with durable yield, true real estate diversification across geographies and sectors, low volatility of returns, downside resilience and inflation sensitivity.
At a high level, the rationale for these allocations is to access:
• scale and transparency from the U.S.
• stability of returns from Europe
• diversification from APAC
See “Rationale for a foundational global core real estate allocation,” page 12.
Highlytransparent Transparent Semi-
transparentLow
transparency Opaque
Sweden
U.S.
U.K.
Australia
France
New Zealand
Germany
Singapore
Switzerland
Hong Kong
Japan
Spain
Taiwan
China Tier 1 cities
Highlytransparent
Transparent
Semi-transparent

12 INVESTMENT INSIGHTS
GLOBAL CORE: BUILDING THE GLOBAL REAL ESTATE FOUNDATION
R A T I O N A L E F O R A F O U N D A T I O N A L G L O B A L C O R E R E A L E S T A T E A L L O C A T I O NThis foundational allocation for global core real estate is designed to provide investors with durable yield, true real estate diversification across geographies and sectors, low volatility of returns, downside resilience and inflation sensitivity.
Diversification from APAC Allocation: 10%–30%
Finally, an allocation to the developed markets of the Asia-Pacific region, such as Japan, Australia, New Zealand, Hong Kong, Singapore and South Korea, can provide additional diversification with low historical correlations to the U.S. and Europe as well as low intra-regional correlations.
Scale and transparency from the U.S. Allocation: 40%-60%
The U.S. market is the largest institutional real estate market in the world, with the most transparency and liquidity, recom-mending it as the anchor allocation in a strategic portfolio.
RETAIL Houston
RESIDENTIAL Tokyo
OFFICE London
Stability of returns from Europe Allocation: 20%–40%
An allocation to the primary markets of Europe, including, in particular, the UK, France and Germany, can provide enhanced stability given the traditionally lower volatility of returns for these markets.

J .P. MORGAN ASSET MANAGEMENT 13
GLOBAL CORE: BUILDING THE GLOBAL REAL ESTATE FOUNDATION
A whole greater than the sum of its parts
EXHIBIT 16 compares the risk-return characteristics of the proposed 50-30-20 U.S./Europe/APAC global core real estate allocation with stand-alone regional allocations. Each region demonstrates its strengths and weaknesses across different time frames (and no region is without some low performance [red] readings). But the globally diversified core real estate portfolio (with only yellow-green readings) can provide a more robust, balanced and consistent performance over the long term.
DIVERSIFIED AND DIVERSIFYING: GLOBAL CORE REAL ESTATE IN AN OVERALL PORTFOLIO
With this strategic 50-30-20 mix, a global core real estate allo-cation has the potential to improve risk-return outcomes for the overall portfolio over the long term (20 years). EXHIBIT 17 (next page) quantifies the potential impact on a 60-40 global stock/bond portfolio when 10% to 30% of assets are allocated to such a geographically diversified core real estate mix. In this example, the low correlations of global core real estate markets with stocks and bonds—and with one another—have both a diversified and a diversifying impact that increases with the size of the allocation.3
3 Core real estate, which exhibits characteristics of both debt and equity, can be seen as a hybrid of and a potential “alternative” to these traditional asset classes (the “traditional alternative”), capable of addressing a wide range of portfolio objectives. See APPENDIX A for a discussion of where real estate fits on the spectrum of alternative asset classes and their associated investment characteristics.
RISKS AND CONSIDERATIONS OF GLOBAL CORE REAL ESTATE INVESTING
Investors in global real estate should be aware of the risks as well as the benefits of investing beyond their home borders. Many of the risks are similar to those posed by investing in domestic private real estate, including liquidity and transparency risk. But investors should also be cognizant of certain incremental risks, such as legal structuring and tax considerations. Currency risk is, perhaps, the most obvious additional risk when investing internationally. However, given the long holding periods associated with unlisted real estate investing and the tendency for developed market currencies to revert to their means, the impact of exchange rates on returns can be partially diminished over the long term, particularly with a well-diversified mix of underlying currency exposures. (See APPENDIX B: “The ‘elephant in the paper’—currency considerations.”) And, as discussed, most of these risks are mitigated to varying degrees by investing in core real estate within gateway cities, which generally have higher transaction volumes, better transparency and greater stability of occupancy and cash flows.
Return Volatility Return per unit of risk Maximum drawdown20 years 15 years 10 years 20 years 15 years 10 years 20 years 15 years 10 years
U.S. core real estate
Europe core real estate
Asia-Pacific core real estate
Global core real estate
Potential risk-return advantages of a diversified global core real estate allocationEXHIBIT 16: REGIONAL VS. GLOBAL CORE REAL ESTATE
Source: Bloomberg Barclays, CBRE, IPD, Jones Lang LaSalle, NCREIF, J.P. Morgan Asset Management; data as of December 31, 2016.
Illustrative analysis using asset class data. (1) Global core real estate is a mixture of 50% U.S. core real estate, 30% Europe core real estate and 20% APAC core real estate. (2) Volatility is calculated using annual standard deviation of historical returns. (3) Return per unit of risk is calculated by dividing the CAGR by the standard deviation. (4) The maximum drawdown denotes the maximum historical peak to trough decline in asset values. (5) The risk-return characteristics are calculated in local currency terms, except for European real estate, which is denominated in euros. (6) The portfolios assume annual rebalancing. (7) The portfolio attributes stated in the above table are for illustrative purposes only.

14 INVESTMENT INSIGHTS
GLOBAL CORE: BUILDING THE GLOBAL REAL ESTATE FOUNDATION
INVESTMENT IMPLICATIONS
In today’s yield-constrained fixed income markets and uncertain, highly correlated equity markets, institutional investors are searching for stable sources of income, investments to diversify equity market risk and broader opportunities to enhance portfolio risk-return performance. They are increasingly challenged to meet these needs through traditional equity and debt allocations (even when taking advantage of global diversification) or through domestic real estate alone.
Historical return 6.1% 6.5% 6.8% 7.2%Historical volatility 10.7% 9.9% 9.3% 8.7%Return per unit of risk 0.57 0.65 0.74 0.82Max drawdown -21% -20% -19% -19%Equity beta 0.57 0.53 0.49 0.45
Adding a global real estate allocation may help enhance the risk-return profile of a traditional stock/bond portfolioEXHIBIT 17: ILLUSTRATIVE PORTFOLIO ANALYSIS
RISK-RETURN CHARACTERISTICS
Source: Bloomberg Barclays, CBRE, IPD, Jones Lang LaSalle, NCREIF, J.P. Morgan Asset Management; data as of December 31, 2016.
Illustrative 20-year analysis (1997–2016) using asset class data. (1) Global equities are represented by MSCI World, global fixed income is represented by Bloomberg Barclays Global Agg, and global core real estate is a mixture of 50% U.S. core real estate, 30% Europe core real estate and 20% APAC core real estate. (2) Volatility is calculated using annual standard deviation of historical returns. (3) Return per unit of risk is calculated by dividing the 20-year CAGR by the 20-year standard deviation. (4) The max drawdown denotes the maximum historical peak to trough decline in asset values. (5) Equity beta is calculated vs. a portfolio of global equities. (6) The risk-return characteristics are calculated in local currency terms, except for European real estate, which is denominated in euros. (7) The portfolios assume annual rebalancing. (8) The portfolio attributes stated in the above table are for illustrative purposes only.
Global equities
Global fixed income
Global core real estate60%
40%54%36%
10%
48%
32%
20%
42%
28%
30%
60/40Stock/bond portfolio
+10%Global core real estate
+20%Global core real estate
+30%Global core real estate
A foundational global core real estate portfolio may be part of the solution. Global core real estate has the potential to provide stable, bond-like cash flows with an equity-like upside; increased diversification benefits (at the real estate and overall portfolio level); and a broad array of global investment opportunities. While the “right” global real estate allocation will vary across investors, we believe a 70/30 allocation to core vs. non-core real estate, with 50/30/20 allocated to major cities in the developed markets of the U.S., Europe and APAC, respectively, is a reasonable allocation for institutional investors to consider.

J .P. MORGAN ASSET MANAGEMENT 15
GLOBAL CORE: BUILDING THE GLOBAL REAL ESTATE FOUNDATION
In terms of risk and return characteristics, global core real estate lies between stocks/bonds and private equity/ hedge fundsEXHIBIT A.1: THE BENEFITS AND TRADE-OFFS OF TRADITIONAL AND ALTERNATIVE ASSET CLASSES
Source: Bloomberg Barclays, CBRE, IPD, Jones Lang LaSalle, MSCI, NCREIF, J.P. Morgan Asset Management; data as of December 31, 2016.
Illustrative 15-year analysis (2002–16) using asset class data. (1) Global equities are represented by MSCI World, global fixed income is represented by Bloomberg Barclays Global Agg, and global core real estate is a mixture of 50% U.S. core real estate, 30% Europe core real estate and 20% APAC core real estate. (2) Volatility is calculated using annual standard deviation of historical returns. (3) Return per unit of risk is calculated by dividing the 15-year CAGR by the 15-year standard deviation. (4) Equity beta is calculated vs. a portfolio of global equities. (5) Fixed income beta is calculated vs. a portfolio of global fixed income. (6) The drawdown denotes the maximum historical peak to trough decline in asset values. (7) The risk-return characteristics are calculated in local currency terms, except for European real estate, which is denominated in euros. (8) The portfolio attributes stated in the above table are for illustrative purposes only.
Return VolatilityReturn per unit of risk
Equity beta
Fixed income beta Drawdown
Global equities
Global fixed income
Hedge funds
Private equity
Global core infrastructure
Global core real estate
APPENDIX A: GLOBAL CORE REAL ESTATE —A TRADITIONAL ALTERNATIVE
Different alternative asset classes can exhibit investment characteristics similar to those of stocks and/or bonds. Hence, they can serve as alternatives to traditional financial assets within a portfolio context. Investors should allocate to alternatives in a way that solves for their investment objectives and constraints. For example, if an investor is seeking to diversify away public equity beta and mitigate equity volatility without primarily looking to achieve higher returns, hedge funds may be a reasonable investment. If an investor is purely looking
to maximize returns, with no concerns about volatility and/or illiquidity, private equity is likely a better strategic choice.
As discussed, core real estate exhibits characteristics of both stocks and bonds, and thus investors should look to core real estate as a hybrid of these traditional asset classes—a traditional alternative—that can help solve for a variety of investment objectives. EXHIBIT A.1 highlights the benefits and trade-offs of various alternatives categories. Global core real estate can be viewed as sitting between stocks and bonds and between private equity and hedge funds, providing true diversification and a balance of risk-return characteristics.

16 INVESTMENT INSIGHTS
GLOBAL CORE: BUILDING THE GLOBAL REAL ESTATE FOUNDATION
APPENDIX B: THE “ELEPHANT IN THE PAPER”—CURRENCY CONSIDERATIONS
Before investing in international assets, investors typically consider how exchange rates and volatility in the currency markets may impact their portfolio returns. For international real estate investments in particular, investors should note that unlisted real estate investments are typically held for seven to 10 years, if not longer. In the long term, developed market currencies tend to revert to the mean; that is, the impact of exchange rates on long-term returns is generally less significant (EXHIBITS B.1 and B.2). We performed our analysis assuming a home currency in USD, but the same trends generally hold true across all developed market currencies.
Currency volatility tends to decrease over long-term holds. In the short term, exchange rate fluctuations essentially add a layer of uncorrelated risk to investment returns. However, if a U.S. investor were to invest in a yen-denominated fund, for
example, after a holding period of 10-plus years, that additional layer of risk (or volatility) would decrease to less than 2% (Exhibit B.1).
Additionally, developed market currencies are relatively stable. U.S. exchange rates to the Canadian dollar, Australian dollar, euro , Japanese yen and pound, for example, have fluctuated within a narrow band along the 20-year rolling average for the past few decades (Exhibit B.2). This stability supports the theory that exchange rates are mean-reverting in the long term, resulting in only a marginal compounded currency impact over time.
To analyze the impact of currency fluctuations on a long-term investment portfolio, we used the portfolios in Exhibit 17 and translated returns over 20 years into USD. As shown in EXHIBIT B.3, the risk-return characteristics in USD are similar to the characteristics in local currency.
Developed market currencies are generally stable and tend to be mean-reverting, with little impact on real estate returns over the long termEXHIBIT B.1: ANNUALIZED VOLATILITY OF CURRENCY IMPACT EXHIBIT B.2: CURRENCY EXCHANGE RATES AND 20-YEAR ROLLING (EXCHANGE RATE TO USD) OVER LONG HOLD PERIODS AVERAGES
Source: Bloomberg; data as of December 2016. Volatility estimates are based on historical U.S. dollar-denominated currency exchange rates data between 1999 and 2016. Annualized return volatility calculated using annualized returns on quarterly exchange rates.
Source: Bloomberg, J.P. Morgan Asset Management; data as of December 31, 2016. Currencies are spot rates to USD (e.g., 1 CAD to USD). Data is measured from 1976–2016.
0
2
4
6
8
10
12
14
16
1 2 3 4 5 6 7 8 9 10 11 12
Annu
aliz
ed v
olat
ility
(sta
ndar
d de
viat
ion,
%)
Number of hold periods (years)
Japanese yen Australian dollar Canadian dollar
British pound Euro
Curr
ency
spo
t rat
e
Curr
ency
spo
t rat
e (J
PY)
0.0
0.5
1.0
1.5
2.0
2.5
GBP
EUR
CADJPY
AUD
0.00
0.01
0.02
1976
1978
1980
1982
1984
1986
1988
1990
1992
1994
1996
1998
2000
2002
2004
2006
2008
2010
2012
2014
2016

J .P. MORGAN ASSET MANAGEMENT 17
GLOBAL CORE: BUILDING THE GLOBAL REAL ESTATE FOUNDATION
Historical return 6.0% / 6.1% 6.4% / 6.5% 6.8% / 6.8% 7.1% / 7.2%Historical volatility 11.6% / 10.7% 10.9% / 9.9% 10.2% / 9.3% 9.6% / 8.7%Return per unit of risk 0.52 / 0.57 0.59 / 0.65 0.66 / 0.74 0.74 / 0.82Max drawdown -22% / -21% -21% / -20% -20% / -19% -20% / -19%Equity beta 0.59 / 0.57 0.55 / 0.53 0.51 / 0.49 0.47 / 0.45
Over a 20-year period, currency fluctuations have little impact on portfolio risk and returnEXHIBIT B.3: ILLUSTRATIVE PORTFOLIO ANALYSIS IN USD/LOCAL CURRENCY
RISK-RETURN CHARACTERISTICS TRANSLATED INTO USD/LOCAL CURRENCY
Source: Bloomberg Barclays, CBRE, Clarksons, IPD, Jones Lang LaSalle, MSCI, NCREIF, J.P. Morgan Asset Management; data as of December 2016.
Illustrative 20-year analysis using asset class data. (1) Global equities are represented by MSCI World, global fixed income is represented by Bloomberg Barclays Global Agg, and global core real estate is a mixture of 50% U.S. core real estate, 30% Europe core real estate and 20% APAC core real estate. (2) Volatility is calculated using annual standard deviation of historical returns. (3) Return per unit of risk is calculated by dividing the 20-year CAGR by the 20-year standard deviation. (4) The max drawdown denotes the maximum historical peak to trough decline in asset values. (5) Equity beta is calculated vs. a portfolio of global equities. (6) The risk-return characteristics are calculated in local currency terms, except for European real estate, which is denominated in euros. (7) The portfolios assume annual rebalancing. (8) The portfolio attributes stated in the above table are for illustrative purposes only.
Global equities
Global fixed income
Global core real estate60%
40%54%36%
10%
48%
32%
20%
42%
28%
30%
60/40Stock/bond portfolio
+10%Global core real estate
+20%Global core real estate
+30%Global core real estate

FOR INSTITUTIONAL / WHOLESALE / PROFESSIONAL CLIENTS AND QUALIFIED INVESTORS ONLY—NOT FOR RETAIL USE OR DISTRIBUTION
NOT FOR RETAIL DISTRIBUTION: This communication has been prepared exclusively for institutional, wholesale, professional clients and qualified investors only, as defined by local laws and regulations.
Investing in foreign countries involves a greater degree of risk and increased volatility. Changes in currency exchange rates and differences in accounting and taxation policies in foreign countries can raise or lower returns. Also, some markets may not be as politically and economically stable. The risks associated with foreign securities may be increased in countries with less developed markets. These countries may have relatively unstable governments and less established market economies than developed countries. These countries may face greater social, economic, regulatory and political uncertainties. These risks make securities from less developed countries more volatile and less liquid than securities in more developed countries.
Equity securities are subject to “stock market risk.” The price of equity securities may rise or fall because of changes in the broad market or changes in a company’s financial condition, sometimes rapidly or unpredictably. Fixed Income/Bonds are subject to interest rate risks. Bond prices generally fall when interest rates rise.
The views contained herein are not to be taken as an advice or a recommendation to buy or sell any investment in any jurisdiction, nor is it a commitment from J.P. Morgan Asset Management or any of its subsidiaries to participate in any of the transactions mentioned herein. Any forecasts, figures, opinions or investment techniques and strategies set out are for information purposes only, based on certain assumptions and current market conditions and are subject to change without prior notice. All information presented herein is considered to be accurate at the time of production, but no warranty of accuracy is given and no liability in respect of any error or omission is accepted. This material does not contain sufficient information to support an investment decision and it should not be relied upon by you in evaluating the merits of investing in any securities or products. In addition, users should make an independent assessment of the legal, regulatory, tax, credit, and accounting implications and determine, together with their own professional advisers, if any investment mentioned herein is believed to be suitable to their personal goals. Investors should ensure that they obtain all available relevant information before making any investment. It should be noted that investment involves risks, the value of investments and the income from them may fluctuate in accordance with market conditions and taxation agreements and investors may not get back the full amount invested. Both past performance and yield may not be a reliable guide to future performance.
J.P. Morgan Asset Management is the brand for the asset management business of JPMorgan Chase & Co. and its affiliates worldwide. This communication is issued by the following entities: in the United Kingdom by JPMorgan Asset Management (UK) Limited, which is authorized and regulated by the Financial Conduct Authority; in other EU jurisdictions by JPMorgan Asset Management (Europe) S.à r.l.; in Hong Kong by JF Asset Management Limited, or JPMorgan Funds (Asia) Limited, or JPMorgan Asset Management Real Assets (Asia) Limited; in Singapore by JPMorgan Asset Management (Singapore) Limited, or JPMorgan Asset Management Real Assets (Singapore) Pte Ltd; in Taiwan by JPMorgan Asset Management (Taiwan) Limited; in Japan by JPMorgan Asset Management (Japan) Limited which is a member of the Investment Trusts Association, Japan, the Japan Investment Advisers Association, Type II Financial Instruments Firms Association and the Japan Securities Dealers Association and is regulated by the Financial Services Agency (registration number “Kanto Local Finance Bureau (Financial Instruments Firm) No. 330”); in Korea by JPMorgan Asset Management (Korea) Company Limited; in Australia to wholesale clients only as defined in section 761A and 761G of the Corporations Act 2001 (Cth) by JPMorgan Asset Management (Australia) Limited (ABN 55143832080) (AFSL 376919); in Brazil by Banco J.P. Morgan S.A.; in Canada for institutional clients’ use only by JPMorgan Asset Management (Canada) Inc., and in the United States by JPMorgan Distribution Services Inc. and J.P. Morgan Institutional Investments, Inc., both members of FINRA/SIPC.; and J.P. Morgan Investment Management Inc. In APAC, distribution is for Hong Kong, Taiwan, Japan and Singapore. For all other countries in APAC, to intended recipients only.
Copyright 2017 JPMorgan Chase & Co. All rights reserved.
II_Building global RE core | 0903c02a81db633c
J.P. MORGAN ASSET MANAGEMENT