global control of aberrant splice-site activation by auxiliary splicing
TRANSCRIPT
Published online 18 September 2007 Nucleic Acids Research, 2007, Vol. 35, No. 19 6399–6413doi:10.1093/nar/gkm680
Global control of aberrant splice-site activationby auxiliary splicing sequences: evidence fora gradient in exon and intron definitionJana Kralovicova and Igor Vorechovsky*
University of Southampton, School of Medicine, Division of Human Genetics, MP808, Southampton SO16 6YD, UK
Received June 25, 2007; Revised August 6, 2007; Accepted August 19, 2007
ABSTRACT
Auxiliary splicing signals play a major role in theregulation of constitutive and alternative pre-mRNAsplicing, but their relative importance in selectionof mutation-induced cryptic or de novo splice sitesis poorly understood. Here, we show that exonicsequences between authentic and aberrant splicesites that were activated by splice-site mutationsin human disease genes have lower frequenciesof splicing enhancers and higher frequencies ofsplicing silencers than average exons. Conversely,sequences between authentic and intronic aberrantsplice sites have more enhancers and less silencersthan average introns. Exons that were skipped asa result of splice-site mutations were smaller, hadlower SF2/ASF motif scores, a decreased availabilityof decoy splice sites and a higher density ofsilencers than exons in which splice-site mutationactivated cryptic splice sites. These four variableswere the strongest predictors of the two aberrantsplicing events in a logistic regression model.Elimination or weakening of predicted silencers intwo reporters consistently promoted use of intron-proximal splice sites if these elements were main-tained at their original positions, with their modularcombinations producing expected modification ofsplicing. Together, these results show the existenceof a gradient in exon and intron definition at thelevel of pre-mRNA splicing and provide a basis forthe development of computational tools that predictaberrant splicing outcomes.
INTRODUCTION
Removal of introns from pre-messenger RNA(pre-mRNA) by splicing is a critical step in eukaryoticgene expression. Splicing of human pre-mRNAs ismediated by conserved but highly degenerate sequences
at the splice sites. These signals include the YAG|Rconsensus (Y is pyrimidine, R is purine, | is the intron/exon boundary) at the 30 splice site (30ss), with upstreampoly-Y tracts (PPTs) and the branch point sequence(BPS), and the MAG|GURAGU consensus (M is A or C)at the 50 splice site (50ss). In addition to these essentialsequences, accurate recognition of exons and introns bythe spliceosome requires auxiliary signals that repress orpromote splicing, termed exonic or intronic splicingsilencers (ESSs/ISSs) or enhancers (ESEs/ISEs). Theseelements are thought to act as binding sites for splicingfactors, which comprise serine/arginine-rich (SR) proteins(1) or heterogeneous nuclear ribonucleoproteins(hnRNPs) (2–5). Apart from direct contacts with trans-acting factors, ESSs, ISSs, ESEs and ISEs may influencesplicing through alterations of the RNA secondarystructure by modifying their access to the pre-mRNA ortheir interactions with each other (6).Auxiliary splicing sequences have been characterized by
in vivo or in vitro selection methods (1,7–10) or throughdisease-associated mutations or variants that disruptedpre-mRNA splicing (11,12). In addition to experimentalapproaches, these elements have been identified ab initioby comparing oligomer frequencies between exons andintrons and between exons with weak and strong splicesites (hexamer RESCUE-ESEs) (13), between non-codingexons and pseudoexons plus the 50 untranslated region(UTR) of intron-less genes (putative octamer ESEs/ESSsor PESEs/PESSs) (14,15), or by evaluating conservationlevels of exonic wobble positions (16). However, therelative importance of these signals in selection of 50 or 30ssand regulation of alternative splicing has been poorlyunderstood.Naturally occurring mutations or DNA variants that
affect pre-mRNA splicing represent a substantial propor-tion of gene alterations leading to Mendelian disorders(17,18) and are thought to contribute significantly topredisposition to or protection against multifactorialor complex traits (19,20). Disease-associated splicingmutations usually lead to skipping of one or more exonsor to activation of cryptic (if the mutation is in the
*To whom correspondence should be addressed. Tel: +44 2380 796425; Fax: +44 2380 794264; Email: [email protected]
� 2007 The Author(s)
This is an Open Access article distributed under the terms of the Creative Commons Attribution Non-Commercial License (http://creativecommons.org/licenses/
by-nc/2.0/uk/) which permits unrestricted non-commercial use, distribution, and reproduction in any medium, provided the original work is properly cited.
Downloaded from https://academic.oup.com/nar/article-abstract/35/19/6399/2402404by gueston 16 February 2018

splice-site consensus) or de novo (if the mutation iselsewhere) splice sites (21–25). Activation of crypticsplice sites can be influenced by the balance betweenthe intrinsic strength of aberrant splice sites and theirauthentic counterparts (23–27), the availability of tradi-tional splicing signals in the vicinity of mutated splice sites(18,28), exon and intron size (29), the nature of mutation(24,25) and by disrupting or creating ESEs, ESSs, ISEs orISSs. Although exon skipping and cryptic/de novo splice-site activation account for the vast majority of aberrantlyspliced RNA products transcribed from mutated alleles,the extent to which these cis-elements contribute to activa-tion of mutation-induced splice sites has not been systema-tically investigated. Moreover, comparative significance offactors that determine which of the two aberrant splicingoutcomes takes place is unknown.In the present study, we have examined the frequency of
computationally predicted ESEs and ESSs in a compre-hensive set of 518 human sequences located betweenmutation-induced aberrant splice sites and their authenticcounterparts. In addition, we have ascertained sequencesof 250 exons that were excluded from mature transcriptsas a result of disease-associated splice-site mutations andsequences of mutation-induced pseudoexons that wereactivated de novo in introns. We have compared thesesequences to a set of controls that included intronicsequences that were never spliced, conserved exons, alter-natively spliced exons and non-coding exons. In addition,we have compared sequences of the skipped exonswith exons that sustained aberrant splice-site activationin vivo to identify factors that best predict the twopathological splicing outcomes. Furthermore, we haveused two splicing reporter systems to experimentally testwhether predicted ESSs between competing 30ss consis-tently repress usage of intron-proximal sites and how theirmodular combinations influence 30ss selection. Finally,using the human proinsulin gene as a model, we show howESS mutations capable of reducing or increasing canoni-cal transcripts alter the expression of the resulting peptide.
MATERIALS AND METHODS
Ascertainment of nucleotide sequences
Sequences between mutation-induced aberrant 30ss andtheir authentic counterparts were obtained from theupdated version of DBASS3, the database of aberrant30ss in human disease genes (24). Sequences betweenaberrant 50ss and their authentic counterparts wereacquired from the recently published sister database ofmutation-induced aberrant 50ss, termed DBASS5 (25).These sequences and their annotations are available fromthe DBASS5 and DBASS3 web site at http://www.dbass.org.uk. Aberrant splice sites were both in exons (E) andintrons (I) and were generated by mutations within(cryptic, CR) or outside (de novo, DN) 50 or 30ss consensussequences in 264 human disease genes, leading to �250recognizable phenotypes. The resulting sequence cate-gories were designated CR-E, DN-E, CR-I and DN-I(Figure 1). The total number of non-repetitive aberrant
50 and 30ss (including pseudoexons) was 305 and 258,respectively, with 276 located in introns and 287 in exons.
In addition to aberrant splice sites, we collectedsequences of 250 human exons that were skipped as aresult of disease-causing mutations in natural splice sitesof 127 genes (EXSK; Figure 1 and Table S1). Thesesequences were obtained by searching the ‘Human GeneMutation Database’ and ‘PubMed’ for exon skippingevents reported in hereditary diseases and by comparingthe information in the literature to the integrated humangenome databases through the ‘Ensembl’ web site. Inclu-sion criteria for such exons were as follows: (i) splice-sitemutations were shown to be disease-causing or pre-disposing; (ii) exon skipping was detected either inpatients’ RNA samples or in splicing reporter assaysfollowing transfection of wild-type and mutated con-structs into mammalian cell lines, but not in controls;(iii) aberrant transcripts were characterized by nucleotidesequencing and (iv) there was no obvious utilization ofaberrant splice sites in the exon or adjacent introns.
Similarly, we analysed sequences of human pseudo-exons (PS) that were included in mature transcripts as
Figure 1. Schematic representation of sequence categories. Primarytranscripts are shown as exons (boxes) and introns (lines). Exonic orintronic sequences analysed in this study are shown as blue boxes orblue thick lines, respectively. Canonical and aberrant splicing events areshown above and below primary transcripts, respectively. Disease-associated splicing mutations are schematically shown as red stars.Designation of each sequence category and corresponding numbers ofanalysed sequences is above and below the primary transcript,respectively. Arrows denote translation initiation sites. CR-E, sequencesbetween cryptic splice sites in exons and their authentic counterparts;DN-E, sequences between de novo splice sites in exons and theirauthentic counterparts; CR-I, cryptic splice sites in introns; DN-I,de novo splice sites in introns; PS, sequences of mutation-inducedpseudoexons (Table S2); EXSK, sequences of exons that were skippedas a result of splice-site mutations leading to disease phenotypes(Table S1); IN-PS, intronic sequences that have strong 30ss and 50ss anda size of 50–250 nt, but were never used by the spliceosome (14);HM-EX, human exons homologous to mouse exons (30); ALT-EX,alternatively spliced human exons (30); NC-EX, non-coding exonslacking protein-coding information (14); 50-UTR-IL, sequences of50UTR in intron-less genes (14). The total length of the sequencecategories (in nucleotides, nt) was 10 383; 7862; 10 686; 6988; 6114;29 292; 352 688; 5 817 754; 513 162; 50 187 and 245 076, respectively.
6400 Nucleic Acids Research, 2007, Vol. 35, No. 19
Downloaded from https://academic.oup.com/nar/article-abstract/35/19/6399/2402404by gueston 16 February 2018
a result of intronic mutations creating de novo 30ss(n=13) or de novo 50ss (n=32; Figure 1, Table S2). Allthese sequences were compared to controls that includedhuman exons homologous to murine exons (HM-EX),alternatively spliced exons (ALT-EX) (30), intronicsequences that were flanked by strong splice sites butwere never spliced (‘intronic pseudoexons’, IN-PS),non-coding exons (NC-EX) and intron-less sequences inthe 50-UTR (50-UTR-IL), as described (14). Schematicrepresentation of these sequences and their number ineach category is shown in Figure 1.
Analysis of auxiliary splicing sequences
Sequences in each group were used as input files forpublicly available ESE/ESS prediction algorithms athttp://genes.mit.edu/burgelab/rescue-ese/(RESCUE-ESEs)(13,31), http://genes.mit.edu/fas-ess/(fluorescence-activatedscreen or FAS-ESSs) (10,32) and http://cubweb.biology.columbia.edu/pesx/(PESEs and PESSs) (14,15). In addi-tion, we have used the ESEfinder (v. 3.0) (33,34) availableat http://rulai.cshl.edu/tools/ESE to examine ESE motifsof four SR proteins.
The number of ESSs/ESEs in each sequence wasobtained by counting each individual site that falls entirelyor mostly in the sequences of mutated (sequence groupsshown in the left panel of Figure 1 plus EXSK) or wild-type (right panel plus 50-UTR-IL) alleles. Specifically,input sequences between cryptic and authentic splice sitehad an extra three (RESCUE-ESEs and FAS-ESSs)or four (octamer PESEs/PESSs) flanking nucleotides.To obtain the ESS/ESE density, the total number ofpredicted ESSs/ESEs was divided by the sequence length(in nucleotides) that excluded 3- or 4-nt overhangs andthis figure was multiplied by 100. For comparison ofEXSK and CR-E exons and logistic regression analysis,input exon sequences were devoid of flanking nucleotidesto minimize possible confounding effects from 30 and 50sssignal sequences. Similarly, to determine the density ofESE motifs for SF2/ASF, SC35, SRp40 and SRp55 andtheir score densities, we divided their number and the sumof their scores in each sequence by its length in nucleotidesand multiplied by 100. Threshold values for the originalSF2/ASF (34), the updated (IgM-BRCA1) SF2/ASFversion (33), SC35, SRp40 and SRp55 ESE motifs were1.956, 1.867, 2.383, 2.67 and 2.676, respectively. The ESEmotifs with scores above these standard thresholds areconsidered to be significant (33,34).
Splice-site prediction
The number of decoy 30 and 50ss in EXSK and CR-Eexons was determined using the machine-learning neuralnetwork (NN) model as described (35). We used theNN splice-site predictor (v. 0.9) available at http://www.fruitfly.org/seq_tools/splice.html. To obtain the NN scoredensity, we calculated the total number of predicted splicesites with NN scores of 0.001 and higher, divided thisfigure by the sequence length in nucleotides and multipliedby 100. The value of 0.001 was arbitrary to increase thepower of our comparison, because many aberrant splice
sites with NN scores 0.4 (default) or lower are efficientlyused in vivo.In addition to splice-site prediction ab initio, we used
the maximum entropy (ME) model (36) to estimate theintrinsic strength of splice sites in most sequence cate-gories. These scores were computed as described (24,25)using online tools available at http://genes.mit.edu/burgelab/maxent/Xmaxentscan_scoreseq_acc.html. The MEscores were shown to discriminate best aberrant 30 (24)and 50ss (25) from their authentic counterparts. Inaddition, we determined the Shapiro and Senapathy(S&S) matrix scores in EXSK and our wild-type andmutated reporter constructs. The S&S scores are basedon the nucleotide frequency matrix at 30 and 50ss andassume independence between individual positions ofsplice-site consensus sequences (37,38). The S&S scoreswere computed using an online tool available at http://ast.bioinfo.tau.ac.il/SpliceSiteFrame.htm.
Statistical analysis
To model the relationship between predictor variablesand the dichotomous splicing outcome (exon skipping andaberrant splice-site activation), we used step-wise andlogistic regression analyses in S-PLUS (v. 7.0, InsightfulCorp., USA). The S-PLUS was also employed to comparelogistic regression models containing four to seven inde-pendent variables. To test whether there are significantdifferences in the mean ESE/ESS densities amongsequence categories, we used the Kruskal–Wallis analysisof variance (ANOVA) on ranks in the same statisticalpackage, followed by the Dunn’s test, a non-parametricversion of the Holm–Sidak multiple comparison test.Multiple comparisons of ESE/ESS proportions werecarried out using the Marascuilo procedure implementedin XLSTAT (v. 2007.6; Addinsoft).
Splicing reporter constructs
Plasmids containing the entire gene for human proinsulin(INS) were prepared by amplifying a 1.5 kb genomicfragment with primers E1 (50-ag ccc tcc agg aca ggc t)and R1 (50-ttc aag ggc ttt att cca). The amplicons werecloned into the mammalian expression vector pCR3.1(Invitrogen) and validated by sequencing. Minigenescontaining exons 1 through 3 of the human gene forhepatic lipase (LIPC) were described previously (27).Mutated constructs were prepared with overlap-extensionPCR as described (39). Plasmids were propagated inEscherichia coli DH5a and purified using the Wizard PlusSV Minipreps kit (Promega). Sequences of all constructswere analysed with the ESS/ESE prediction algorithmsas described above.
Cell culture, transfections and detection of RNA products
Human embryonic kidney 293T cells were grown understandard conditions in RPMI1640 supplemented with10% (v/v) fetal calf serum (Gibco BRL). Transient trans-fections were performed in 6- or 12-well plates usingsiPORT XP-1 (Ambion) according to the manufacturer’srecommendations. Total RNA was isolated using TRIReagent (Ambion) 48 h post-transfection and treated with
Nucleic Acids Research, 2007, Vol. 35, No. 19 6401
Downloaded from https://academic.oup.com/nar/article-abstract/35/19/6399/2402404by gueston 16 February 2018

DNase I (Ambion). The first-strand cDNA was reversetranscribed using oligo(dT)15 primers and Moloneymurine virus reverse transcriptase (RT; Promega).RT-PCR products were amplified with primers directedto vector sequences and, as a validation control for theratios of RNA products, with a combination of cDNAand vector primers as described (20). Exon inclusion levelswere measured as described (40). The identity of eachRNA product was confirmed by sequencing.
Measurement of proinsulin production
Proinsulin levels were measured in culture supernatants of293T cells transfected with equimolar amounts wild-typeINS and two mutated constructs, in which ESS/ESEmutations did not alter any amino acids (20). Totalproinsulin was quantified by dissociation-enhancedlanthanide fluoroimmunoassay using monoclonal anti-bodies 3B1 and CPT3F11 as described (20).
RESULTS
Contribution of auxiliary splicing sequences to activationof mutation-induced aberrant splice sites
To characterize auxiliary signals underlying aberrantsplice-site activation, we examined sequences locatedbetween mutation-induced cryptic (CR) or de novo (DN)splice sites in exons (E) and introns (I) and their authenticcounterparts (24,25). In addition, we collected andanalysed sequences of exons that sustained splice-sitemutations and were skipped without activating anyaberrant splice site (Table S1) and pseudoexons thatwere activated by intronic point mutations (Table S2).These sequences (designated CR-E, DN-E, CR-I, DN-I,EXSK and PS, respectively; Figure 1) were compared tocontrols that included human-mouse conserved exons(HM-EX), alternatively spliced exons (ALT-EX) (30),non-coding exons (NC-EX), 50-UTR of intron-less genes(50-UTR-IL) (14) and intronic segments that were flankedby strong splice sites but never included in maturetranscripts (‘intronic pseudoexons’, IN-PS; Figure 1) (14).We first determined the total number of computation-
ally predicted ESSs/ESEs in each sequence category,divided their counts by the entire nucleotide length andmultiplied by 100 to obtain the ESS/ESE densities(Figures 2 and S1A). Exonic segments between cryptic/de novo splice sites and their authentic counterparts thatwere excluded from the mRNA as a result of splice-sitemutations (CR-E and DN-E) had significantly higherPESS and FAS-ESS densities than conserved humanexons (HM-EX), but lower than average introns (IN-PS;Table S3). Conversely, CR-E/DN-E segments had a lowerdensity of PESEs and RESCUE-ESEs than HM-EX anda higher density of PESEs than IN-PS. On the other hand,newly exonized intronic segments flanking authenticsplice sites (CR-I and DN-I) had a higher density ofPESEs and lower PESS and FAS-ESS densities thanIN-PS. More stringent sets of PESSs (the I and P scoreslower than �2.88) (14) and the FAS-ESS hex3 set (10)revealed similar differences (Figure S1A). The differencein the RESCUE-ESE density between IN-PS and
CR-E/DN-E or CR-I/DN-I was not strictly significant,which was partly attributable to a low number of thesesignals in Y-rich sequences upstream of 30ss.
In addition to ESE/ESS densities, we divided ESE/ESScounts in each input sequence by its length to obtain themean ESE/ESS densities. The differences in the medianvalues of these densities among the sequence categorieswere significantly greater than expected by chance(P< 10�10 for each signal; Kruskal–Wallis ANOVA onranks). The Dunn’s test carried out with conserved exons(HMEX), exonic sequences excluded from mRNAs,exonized intronic segments and introns (Figure S2)revealed significant differences for most pair-wise compar-isons, with an increasing (ESS) and decreasing (ESE)exon-to-intron gradient. Thus, the newly created exonicand intronic sequences had ESE/ESS levels intermediatebetween average introns and conserved exons, indicatingthat auxiliary signals contribute extensively to selectionof mutation-induced aberrant splice sites.
Characterization of compensatory signals that promoteactivation of cryptic splice sites in exons
To investigate a relationship between ESEs/ESSs andtraditional splice-site recognition sequences in each
Figure 2. Density of auxiliary splicing signals in each sequencecategory. Grey/red bars represent the total number of ESEs/ESSs ineach sequence category divided by the total length of sequence groupand multiplied by 100. Designation of sequence categories is the sameas in Figure 1. (A) Density of PESE and PESS octamers (14).(B) Density of RESCUE-ESEs (13) and FAS-ESSs (32).
6402 Nucleic Acids Research, 2007, Vol. 35, No. 19
Downloaded from https://academic.oup.com/nar/article-abstract/35/19/6399/2402404by gueston 16 February 2018
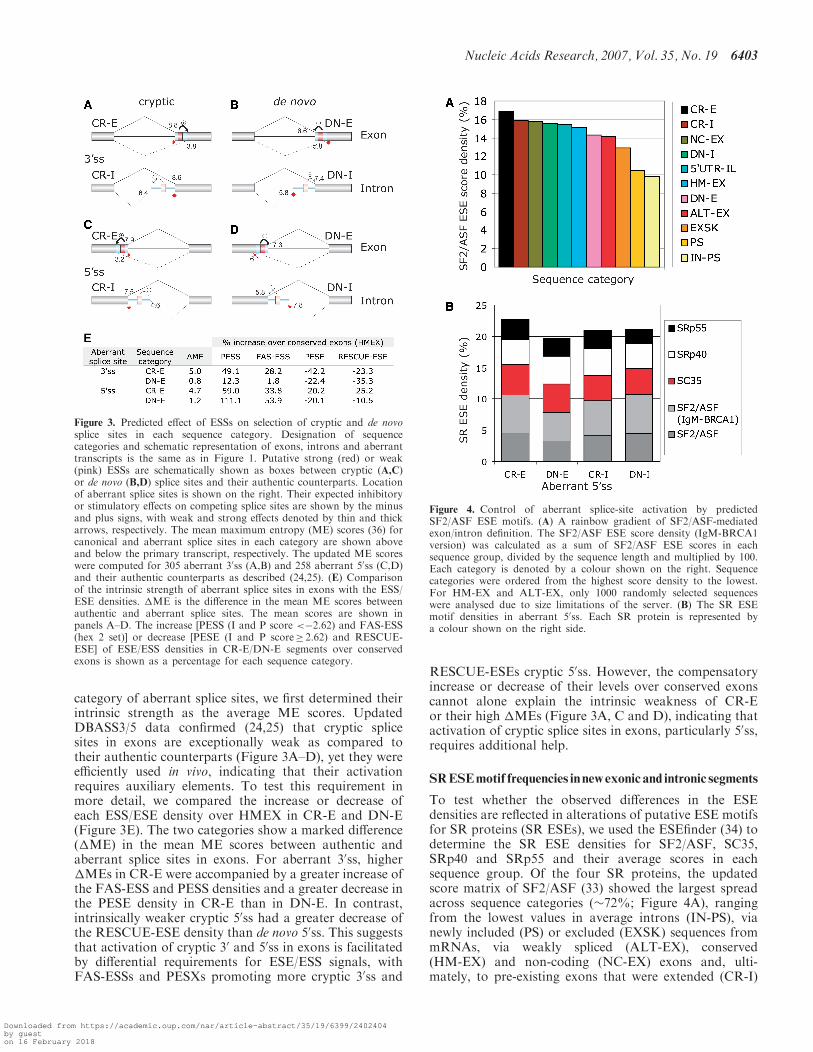
category of aberrant splice sites, we first determined theirintrinsic strength as the average ME scores. UpdatedDBASS3/5 data confirmed (24,25) that cryptic splicesites in exons are exceptionally weak as compared totheir authentic counterparts (Figure 3A–D), yet they wereefficiently used in vivo, indicating that their activationrequires auxiliary elements. To test this requirement inmore detail, we compared the increase or decrease ofeach ESS/ESE density over HMEX in CR-E and DN-E(Figure 3E). The two categories show a marked difference(�ME) in the mean ME scores between authentic andaberrant splice sites in exons. For aberrant 30ss, higher�MEs in CR-E were accompanied by a greater increase ofthe FAS-ESS and PESS densities and a greater decrease inthe PESE density in CR-E than in DN-E. In contrast,intrinsically weaker cryptic 50ss had a greater decrease ofthe RESCUE-ESE density than de novo 50ss. This suggeststhat activation of cryptic 30 and 50ss in exons is facilitatedby differential requirements for ESE/ESS signals, withFAS-ESSs and PESXs promoting more cryptic 30ss and
RESCUE-ESEs cryptic 50ss. However, the compensatoryincrease or decrease of their levels over conserved exonscannot alone explain the intrinsic weakness of CR-Eor their high �MEs (Figure 3A, C and D), indicating thatactivation of cryptic splice sites in exons, particularly 50ss,requires additional help.
SRESEmotif frequencies innewexonicand intronic segments
To test whether the observed differences in the ESEdensities are reflected in alterations of putative ESE motifsfor SR proteins (SR ESEs), we used the ESEfinder (34) todetermine the SR ESE densities for SF2/ASF, SC35,SRp40 and SRp55 and their average scores in eachsequence group. Of the four SR proteins, the updatedscore matrix of SF2/ASF (33) showed the largest spreadacross sequence categories (�72%; Figure 4A), rangingfrom the lowest values in average introns (IN-PS), vianewly included (PS) or excluded (EXSK) sequences frommRNAs, via weakly spliced (ALT-EX), conserved(HM-EX) and non-coding (NC-EX) exons and, ulti-mately, to pre-existing exons that were extended (CR-I)
Figure 3. Predicted effect of ESSs on selection of cryptic and de novosplice sites in each sequence category. Designation of sequencecategories and schematic representation of exons, introns and aberranttranscripts is the same as in Figure 1. Putative strong (red) or weak(pink) ESSs are schematically shown as boxes between cryptic (A,C)or de novo (B,D) splice sites and their authentic counterparts. Locationof aberrant splice sites is shown on the right. Their expected inhibitoryor stimulatory effects on competing splice sites are shown by the minusand plus signs, with weak and strong effects denoted by thin and thickarrows, respectively. The mean maximum entropy (ME) scores (36) forcanonical and aberrant splice sites in each category are shown aboveand below the primary transcript, respectively. The updated ME scoreswere computed for 305 aberrant 30ss (A,B) and 258 aberrant 50ss (C,D)and their authentic counterparts as described (24,25). (E) Comparisonof the intrinsic strength of aberrant splice sites in exons with the ESS/ESE densities. �ME is the difference in the mean ME scores betweenauthentic and aberrant splice sites. The mean scores are shown inpanels A–D. The increase [PESS (I and P score <�2.62) and FAS-ESS(hex 2 set)] or decrease [PESE (I and P score� 2.62) and RESCUE-ESE] of ESE/ESS densities in CR-E/DN-E segments over conservedexons is shown as a percentage for each sequence category.
Figure 4. Control of aberrant splice-site activation by predictedSF2/ASF ESE motifs. (A) A rainbow gradient of SF2/ASF-mediatedexon/intron definition. The SF2/ASF ESE score density (IgM-BRCA1version) was calculated as a sum of SF2/ASF ESE scores in eachsequence group, divided by the sequence length and multiplied by 100.Each category is denoted by a colour shown on the right. Sequencecategories were ordered from the highest score density to the lowest.For HM-EX and ALT-EX, only 1000 randomly selected sequenceswere analysed due to size limitations of the server. (B) The SR ESEmotif densities in aberrant 50ss. Each SR protein is represented bya colour shown on the right side.
Nucleic Acids Research, 2007, Vol. 35, No. 19 6403
Downloaded from https://academic.oup.com/nar/article-abstract/35/19/6399/2402404by gueston 16 February 2018
or contracted (CR-E) by mutation. Multiple comparisonsof the ASF/SF2 ESE densities showed significant differ-ences between IN-PS and both CR-E/CR-I and CR-E/DN-I, as well as among other groups (Table S4). Non-parametric ANOVA with mean SF2/ASF ESE scoredensities followed by the Dunn’s test also discriminatedsegments excluded from mRNAs from both conservedexons and introns (data not shown). Importantly, thehighest SF2/ASF score density was observed in CR-Esegments (Figure 4A), indicating that activation of exoniccryptic splice sites relies on significant SF2/ASF help.The greatest difference in the ordered SF2/ASF ESE scoredensities for adjacent sequence groups was between loss ofthe entire exon (EXSK) and gain of the entire exon (PS)(Figure 4A). CR-E showed the highest density also forSC35 and SRp55, but not for SRp40, suggesting thatSC35 and SRp55 promote selection of cryptic splice sitesin exons to a lesser extent (data not shown). SRp40 hadthe smallest fluctuations (�19%) among the sequencecategories.The SR ESE density was significantly higher in 50ss
CR-E sequences than in 50ss DN-E segments (P=0.04).This difference was similar for the SR ESE score densities(data not shown) and was mainly due to SF2/ASFESEs (P=0.002 for the original SF2/ASF score matrixand 0.004 for the IgM-BRCA1 matrix; Figure 4B). Forsequences between aberrant 30ss and their authenticcounterparts, we observed no significant differences,but their number was lower and their total sequencelength was smaller than corresponding categories of 50ss(Figure 1).
ESS/ESE frequencies in mutation-induced pseudoexonsare intermediate between exons and introns
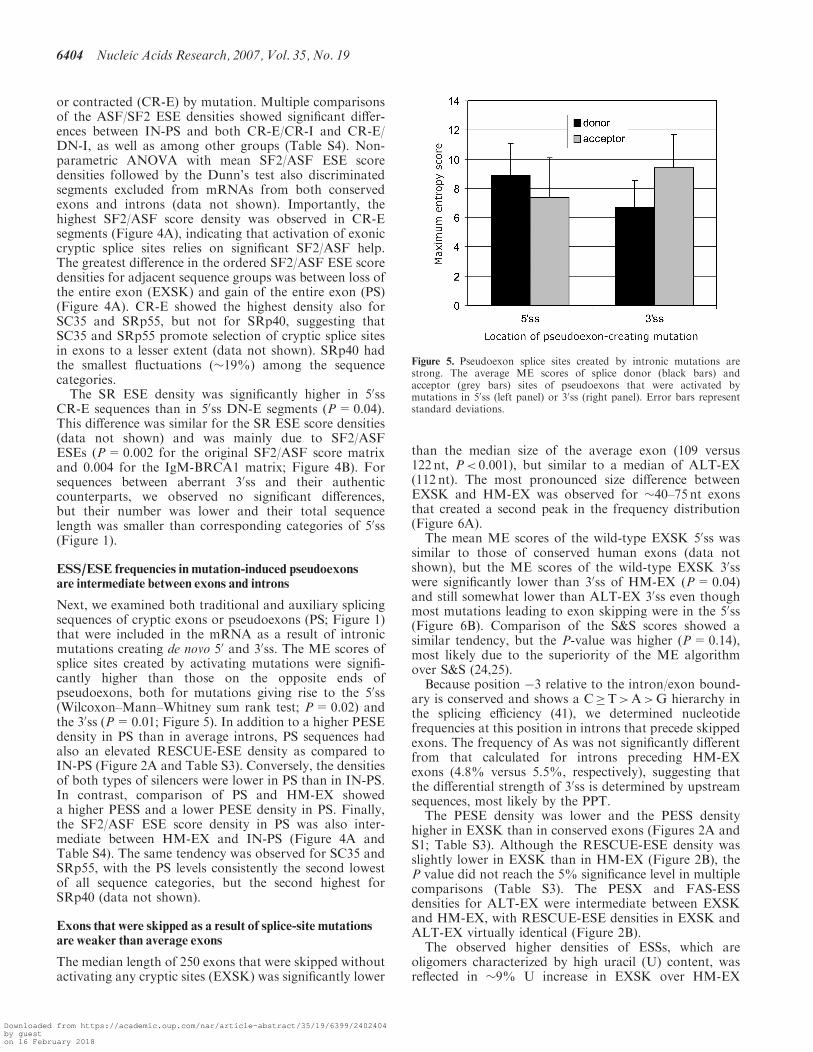
Next, we examined both traditional and auxiliary splicingsequences of cryptic exons or pseudoexons (PS; Figure 1)that were included in the mRNA as a result of intronicmutations creating de novo 50 and 30ss. The ME scores ofsplice sites created by activating mutations were signifi-cantly higher than those on the opposite ends ofpseudoexons, both for mutations giving rise to the 50ss(Wilcoxon–Mann–Whitney sum rank test; P= 0.02) andthe 30ss (P=0.01; Figure 5). In addition to a higher PESEdensity in PS than in average introns, PS sequences hadalso an elevated RESCUE-ESE density as compared toIN-PS (Figure 2A and Table S3). Conversely, the densitiesof both types of silencers were lower in PS than in IN-PS.In contrast, comparison of PS and HM-EX showeda higher PESS and a lower PESE density in PS. Finally,the SF2/ASF ESE score density in PS was also inter-mediate between HM-EX and IN-PS (Figure 4A andTable S4). The same tendency was observed for SC35 andSRp55, with the PS levels consistently the second lowestof all sequence categories, but the second highest forSRp40 (data not shown).
Exons that were skipped as a result of splice-site mutationsare weaker than average exons
The median length of 250 exons that were skipped withoutactivating any cryptic sites (EXSK) was significantly lower
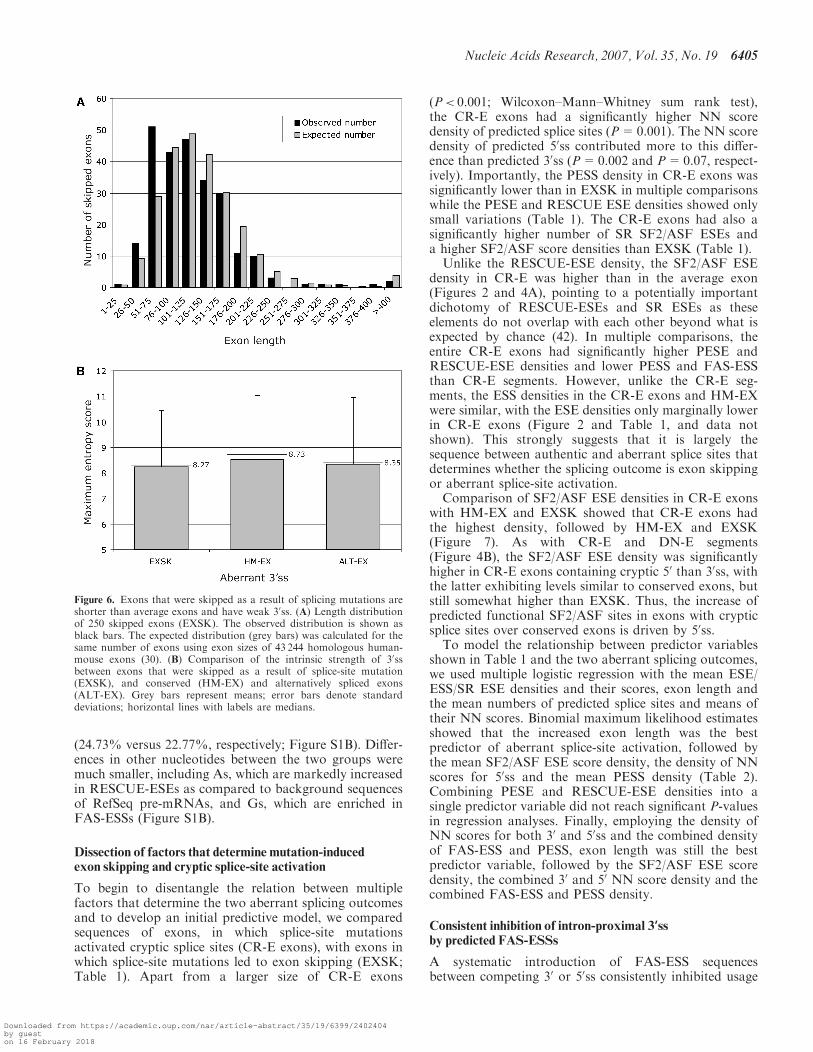
than the median size of the average exon (109 versus122 nt, P< 0.001), but similar to a median of ALT-EX(112 nt). The most pronounced size difference betweenEXSK and HM-EX was observed for �40–75 nt exonsthat created a second peak in the frequency distribution(Figure 6A).
The mean ME scores of the wild-type EXSK 50ss wassimilar to those of conserved human exons (data notshown), but the ME scores of the wild-type EXSK 30sswere significantly lower than 30ss of HM-EX (P=0.04)and still somewhat lower than ALT-EX 30ss even thoughmost mutations leading to exon skipping were in the 50ss(Figure 6B). Comparison of the S&S scores showed asimilar tendency, but the P-value was higher (P=0.14),most likely due to the superiority of the ME algorithmover S&S (24,25).
Because position �3 relative to the intron/exon bound-ary is conserved and shows a C�T>A>G hierarchy inthe splicing efficiency (41), we determined nucleotidefrequencies at this position in introns that precede skippedexons. The frequency of As was not significantly differentfrom that calculated for introns preceding HM-EXexons (4.8% versus 5.5%, respectively), suggesting thatthe differential strength of 30ss is determined by upstreamsequences, most likely by the PPT.
The PESE density was lower and the PESS densityhigher in EXSK than in conserved exons (Figures 2A andS1; Table S3). Although the RESCUE-ESE density wasslightly lower in EXSK than in HM-EX (Figure 2B), theP value did not reach the 5% significance level in multiplecomparisons (Table S3). The PESX and FAS-ESSdensities for ALT-EX were intermediate between EXSKand HM-EX, with RESCUE-ESE densities in EXSK andALT-EX virtually identical (Figure 2B).
The observed higher densities of ESSs, which areoligomers characterized by high uracil (U) content, wasreflected in �9% U increase in EXSK over HM-EX
Figure 5. Pseudoexon splice sites created by intronic mutations arestrong. The average ME scores of splice donor (black bars) andacceptor (grey bars) sites of pseudoexons that were activated bymutations in 50ss (left panel) or 30ss (right panel). Error bars representstandard deviations.
6404 Nucleic Acids Research, 2007, Vol. 35, No. 19
Downloaded from https://academic.oup.com/nar/article-abstract/35/19/6399/2402404by gueston 16 February 2018
(24.73% versus 22.77%, respectively; Figure S1B). Differ-ences in other nucleotides between the two groups weremuch smaller, including As, which are markedly increasedin RESCUE-ESEs as compared to background sequencesof RefSeq pre-mRNAs, and Gs, which are enriched inFAS-ESSs (Figure S1B).
Dissection of factors that determine mutation-inducedexon skipping and cryptic splice-site activation
To begin to disentangle the relation between multiplefactors that determine the two aberrant splicing outcomesand to develop an initial predictive model, we comparedsequences of exons, in which splice-site mutationsactivated cryptic splice sites (CR-E exons), with exons inwhich splice-site mutations led to exon skipping (EXSK;Table 1). Apart from a larger size of CR-E exons
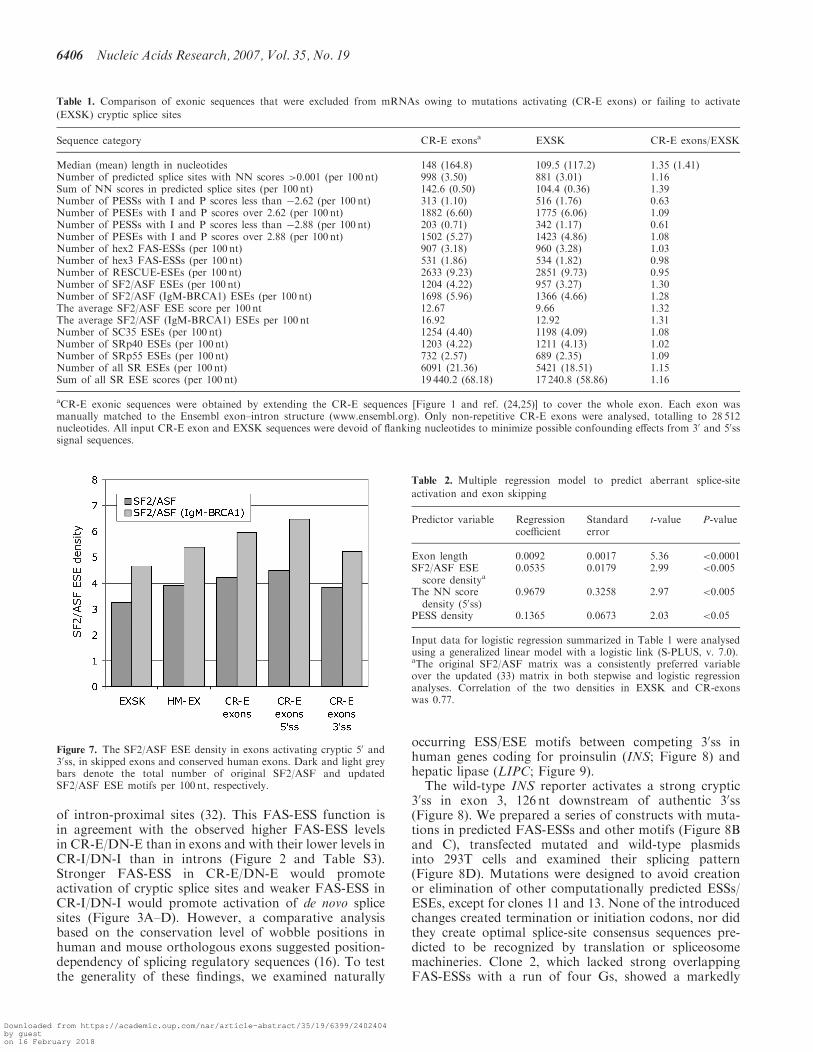
(P< 0.001; Wilcoxon–Mann–Whitney sum rank test),the CR-E exons had a significantly higher NN scoredensity of predicted splice sites (P=0.001). The NN scoredensity of predicted 50ss contributed more to this differ-ence than predicted 30ss (P=0.002 and P=0.07, respect-ively). Importantly, the PESS density in CR-E exons wassignificantly lower than in EXSK in multiple comparisonswhile the PESE and RESCUE ESE densities showed onlysmall variations (Table 1). The CR-E exons had also asignificantly higher number of SR SF2/ASF ESEs anda higher SF2/ASF score densities than EXSK (Table 1).Unlike the RESCUE-ESE density, the SF2/ASF ESE
density in CR-E was higher than in the average exon(Figures 2 and 4A), pointing to a potentially importantdichotomy of RESCUE-ESEs and SR ESEs as theseelements do not overlap with each other beyond what isexpected by chance (42). In multiple comparisons, theentire CR-E exons had significantly higher PESE andRESCUE-ESE densities and lower PESS and FAS-ESSthan CR-E segments. However, unlike the CR-E seg-ments, the ESS densities in the CR-E exons and HM-EXwere similar, with the ESE densities only marginally lowerin CR-E exons (Figure 2 and Table 1, and data notshown). This strongly suggests that it is largely thesequence between authentic and aberrant splice sites thatdetermines whether the splicing outcome is exon skippingor aberrant splice-site activation.Comparison of SF2/ASF ESE densities in CR-E exons
with HM-EX and EXSK showed that CR-E exons hadthe highest density, followed by HM-EX and EXSK(Figure 7). As with CR-E and DN-E segments(Figure 4B), the SF2/ASF ESE density was significantlyhigher in CR-E exons containing cryptic 50 than 30ss, withthe latter exhibiting levels similar to conserved exons, butstill somewhat higher than EXSK. Thus, the increase ofpredicted functional SF2/ASF sites in exons with crypticsplice sites over conserved exons is driven by 50ss.To model the relationship between predictor variables
shown in Table 1 and the two aberrant splicing outcomes,we used multiple logistic regression with the mean ESE/ESS/SR ESE densities and their scores, exon length andthe mean numbers of predicted splice sites and means oftheir NN scores. Binomial maximum likelihood estimatesshowed that the increased exon length was the bestpredictor of aberrant splice-site activation, followed bythe mean SF2/ASF ESE score density, the density of NNscores for 50ss and the mean PESS density (Table 2).Combining PESE and RESCUE-ESE densities into asingle predictor variable did not reach significant P-valuesin regression analyses. Finally, employing the density ofNN scores for both 30 and 50ss and the combined densityof FAS-ESS and PESS, exon length was still the bestpredictor variable, followed by the SF2/ASF ESE scoredensity, the combined 30 and 50 NN score density and thecombined FAS-ESS and PESS density.
Consistent inhibition of intron-proximal 3’ssby predicted FAS-ESSs
A systematic introduction of FAS-ESS sequencesbetween competing 30 or 50ss consistently inhibited usage
Figure 6. Exons that were skipped as a result of splicing mutations areshorter than average exons and have weak 30ss. (A) Length distributionof 250 skipped exons (EXSK). The observed distribution is shown asblack bars. The expected distribution (grey bars) was calculated for thesame number of exons using exon sizes of 43 244 homologous human-mouse exons (30). (B) Comparison of the intrinsic strength of 30ssbetween exons that were skipped as a result of splice-site mutation(EXSK), and conserved (HM-EX) and alternatively spliced exons(ALT-EX). Grey bars represent means; error bars denote standarddeviations; horizontal lines with labels are medians.
Nucleic Acids Research, 2007, Vol. 35, No. 19 6405
Downloaded from https://academic.oup.com/nar/article-abstract/35/19/6399/2402404by gueston 16 February 2018
of intron-proximal sites (32). This FAS-ESS function isin agreement with the observed higher FAS-ESS levelsin CR-E/DN-E than in exons and with their lower levels inCR-I/DN-I than in introns (Figure 2 and Table S3).Stronger FAS-ESS in CR-E/DN-E would promoteactivation of cryptic splice sites and weaker FAS-ESS inCR-I/DN-I would promote activation of de novo splicesites (Figure 3A–D). However, a comparative analysisbased on the conservation level of wobble positions inhuman and mouse orthologous exons suggested position-dependency of splicing regulatory sequences (16). To testthe generality of these findings, we examined naturally
occurring ESS/ESE motifs between competing 30ss inhuman genes coding for proinsulin (INS; Figure 8) andhepatic lipase (LIPC; Figure 9).
The wild-type INS reporter activates a strong cryptic30ss in exon 3, 126 nt downstream of authentic 30ss(Figure 8). We prepared a series of constructs with muta-tions in predicted FAS-ESSs and other motifs (Figure 8Band C), transfected mutated and wild-type plasmidsinto 293T cells and examined their splicing pattern(Figure 8D). Mutations were designed to avoid creationor elimination of other computationally predicted ESSs/ESEs, except for clones 11 and 13. None of the introducedchanges created termination or initiation codons, nor didthey create optimal splice-site consensus sequences pre-dicted to be recognized by translation or spliceosomemachineries. Clone 2, which lacked strong overlappingFAS-ESSs with a run of four Gs, showed a markedly
Table 1. Comparison of exonic sequences that were excluded from mRNAs owing to mutations activating (CR-E exons) or failing to activate
(EXSK) cryptic splice sites
Sequence category CR-E exonsa EXSK CR-E exons/EXSK
Median (mean) length in nucleotides 148 (164.8) 109.5 (117.2) 1.35 (1.41)Number of predicted splice sites with NN scores >0.001 (per 100 nt) 998 (3.50) 881 (3.01) 1.16Sum of NN scores in predicted splice sites (per 100 nt) 142.6 (0.50) 104.4 (0.36) 1.39Number of PESSs with I and P scores less than �2.62 (per 100 nt) 313 (1.10) 516 (1.76) 0.63Number of PESEs with I and P scores over 2.62 (per 100 nt) 1882 (6.60) 1775 (6.06) 1.09Number of PESSs with I and P scores less than �2.88 (per 100 nt) 203 (0.71) 342 (1.17) 0.61Number of PESEs with I and P scores over 2.88 (per 100 nt) 1502 (5.27) 1423 (4.86) 1.08Number of hex2 FAS-ESSs (per 100 nt) 907 (3.18) 960 (3.28) 1.03Number of hex3 FAS-ESSs (per 100 nt) 531 (1.86) 534 (1.82) 0.98Number of RESCUE-ESEs (per 100 nt) 2633 (9.23) 2851 (9.73) 0.95Number of SF2/ASF ESEs (per 100 nt) 1204 (4.22) 957 (3.27) 1.30Number of SF2/ASF (IgM-BRCA1) ESEs (per 100 nt) 1698 (5.96) 1366 (4.66) 1.28The average SF2/ASF ESE score per 100 nt 12.67 9.66 1.32The average SF2/ASF (IgM-BRCA1) ESEs per 100 nt 16.92 12.92 1.31Number of SC35 ESEs (per 100 nt) 1254 (4.40) 1198 (4.09) 1.08Number of SRp40 ESEs (per 100 nt) 1203 (4.22) 1211 (4.13) 1.02Number of SRp55 ESEs (per 100 nt) 732 (2.57) 689 (2.35) 1.09Number of all SR ESEs (per 100 nt) 6091 (21.36) 5421 (18.51) 1.15Sum of all SR ESE scores (per 100 nt) 19 440.2 (68.18) 17 240.8 (58.86) 1.16
aCR-E exonic sequences were obtained by extending the CR-E sequences [Figure 1 and ref. (24,25)] to cover the whole exon. Each exon wasmanually matched to the Ensembl exon–intron structure (www.ensembl.org). Only non-repetitive CR-E exons were analysed, totalling to 28 512nucleotides. All input CR-E exon and EXSK sequences were devoid of flanking nucleotides to minimize possible confounding effects from 30 and 50sssignal sequences.
Figure 7. The SF2/ASF ESE density in exons activating cryptic 50 and30ss, in skipped exons and conserved human exons. Dark and light greybars denote the total number of original SF2/ASF and updatedSF2/ASF ESE motifs per 100 nt, respectively.
Table 2. Multiple regression model to predict aberrant splice-site
activation and exon skipping
Predictor variable Regressioncoefficient
Standarderror
t-value P-value
Exon length 0.0092 0.0017 5.36 <0.0001SF2/ASF ESE
score densitya0.0535 0.0179 2.99 <0.005
The NN scoredensity (50ss)
0.9679 0.3258 2.97 <0.005
PESS density 0.1365 0.0673 2.03 <0.05
Input data for logistic regression summarized in Table 1 were analysedusing a generalized linear model with a logistic link (S-PLUS, v. 7.0).aThe original SF2/ASF matrix was a consistently preferred variableover the updated (33) matrix in both stepwise and logistic regressionanalyses. Correlation of the two densities in EXSK and CR-exonswas 0.77.
6406 Nucleic Acids Research, 2007, Vol. 35, No. 19
Downloaded from https://academic.oup.com/nar/article-abstract/35/19/6399/2402404by gueston 16 February 2018
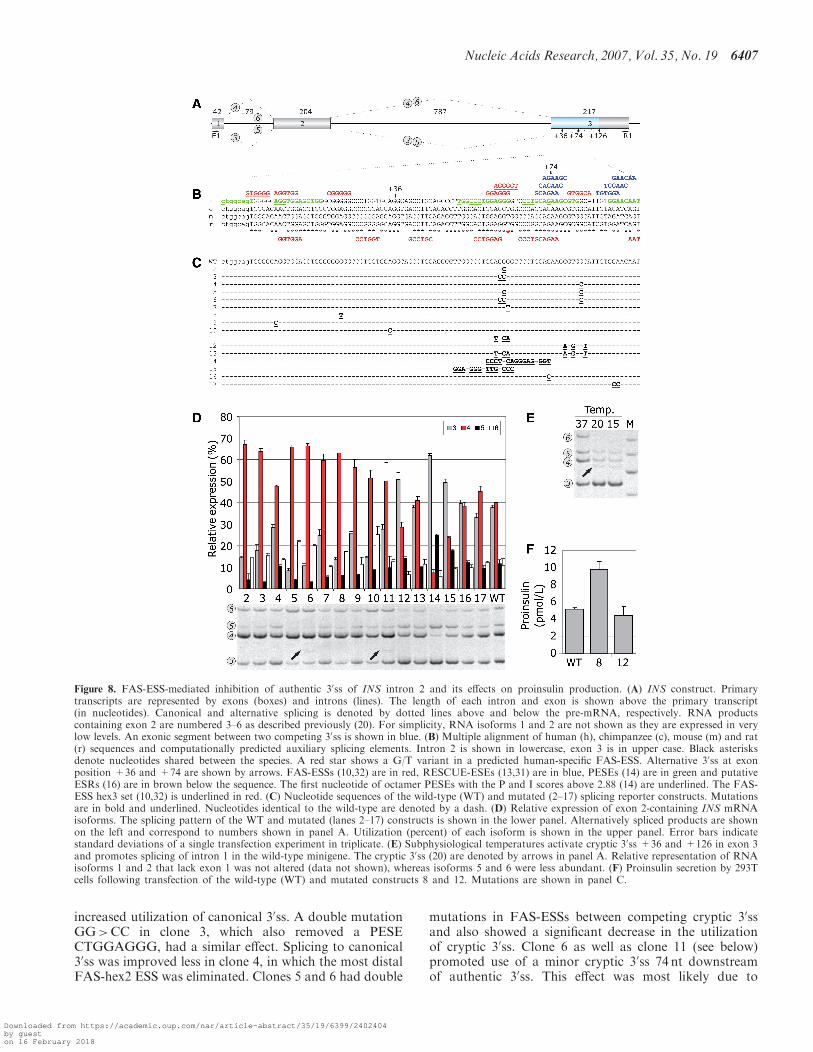
increased utilization of canonical 30ss. A double mutationGG>CC in clone 3, which also removed a PESECTGGAGGG, had a similar effect. Splicing to canonical30ss was improved less in clone 4, in which the most distalFAS-hex2 ESS was eliminated. Clones 5 and 6 had double
mutations in FAS-ESSs between competing cryptic 30ssand also showed a significant decrease in the utilizationof cryptic 30ss. Clone 6 as well as clone 11 (see below)promoted use of a minor cryptic 30ss 74 nt downstreamof authentic 30ss. This effect was most likely due to
Figure 8. FAS-ESS-mediated inhibition of authentic 30ss of INS intron 2 and its effects on proinsulin production. (A) INS construct. Primarytranscripts are represented by exons (boxes) and introns (lines). The length of each intron and exon is shown above the primary transcript(in nucleotides). Canonical and alternative splicing is denoted by dotted lines above and below the pre-mRNA, respectively. RNA productscontaining exon 2 are numbered 3–6 as described previously (20). For simplicity, RNA isoforms 1 and 2 are not shown as they are expressed in verylow levels. An exonic segment between two competing 30ss is shown in blue. (B) Multiple alignment of human (h), chimpanzee (c), mouse (m) and rat(r) sequences and computationally predicted auxiliary splicing elements. Intron 2 is shown in lowercase, exon 3 is in upper case. Black asterisksdenote nucleotides shared between the species. A red star shows a G/T variant in a predicted human-specific FAS-ESS. Alternative 30ss at exonposition +36 and +74 are shown by arrows. FAS-ESSs (10,32) are in red, RESCUE-ESEs (13,31) are in blue, PESEs (14) are in green and putativeESRs (16) are in brown below the sequence. The first nucleotide of octamer PESEs with the P and I scores above 2.88 (14) are underlined. The FAS-ESS hex3 set (10,32) is underlined in red. (C) Nucleotide sequences of the wild-type (WT) and mutated (2–17) splicing reporter constructs. Mutationsare in bold and underlined. Nucleotides identical to the wild-type are denoted by a dash. (D) Relative expression of exon 2-containing INS mRNAisoforms. The splicing pattern of the WT and mutated (lanes 2–17) constructs is shown in the lower panel. Alternatively spliced products are shownon the left and correspond to numbers shown in panel A. Utilization (percent) of each isoform is shown in the upper panel. Error bars indicatestandard deviations of a single transfection experiment in triplicate. (E) Subphysiological temperatures activate cryptic 30ss +36 and +126 in exon 3and promotes splicing of intron 1 in the wild-type minigene. The cryptic 30ss (20) are denoted by arrows in panel A. Relative representation of RNAisoforms 1 and 2 that lack exon 1 was not altered (data not shown), whereas isoforms 5 and 6 were less abundant. (F) Proinsulin secretion by 293Tcells following transfection of the wild-type (WT) and mutated constructs 8 and 12. Mutations are shown in panel C.
Nucleic Acids Research, 2007, Vol. 35, No. 19 6407
Downloaded from https://academic.oup.com/nar/article-abstract/35/19/6399/2402404by gueston 16 February 2018
optimizing its PPT in the absence (clone 6) but not in thepresence (clone 3) of FAS-ESS GTGGGCA, which mayinhibit proximal 30ss, or to more extensive alterationsupstream of cryptic 30ss (clone 11).
The strongest predicted FAS-ESS (GGAGGGGT) ishuman-specific as this motif is eliminated by a T variantpresent in other primates and rodents (shown by a redasterisk in Figure 8B). A G>T mutation at this positionin clone 7 promoted canonical splicing. A point mutationat another non-conserved exon position (clone 8) alsoimproved utilization of the natural 30ss, while removing apredicted FAS-ESS containing a run of five Gs. Mutationin clone 9, which eliminated the first exonic FAS-ESS,had a similar effect. Apart from FAS-ESSs, the increasedutilization of canonical 30ss in this reporter can beexplained by the removal of a competing AG dinucleotide8 nt downstream, although this distance may be too longfor efficient competition (40,43). The influence of adecoy 30ss on 30ss selection (30ss +36, Figure 8B–D, 20)is illustrated by an increased canonical splicing in clone 10,in which this 30ss was inactivated by mutation.
Interestingly, activation of a minor cryptic 30ss +36 wasnot observed for any of the above mutations even after ahigh number of PCR cycles. Transcripts spliced to this 30sswere found in �0.1% expressed sequence tags from aninsulinoma library and were also detected in a pancreaticmRNA sample (20). In an attempt to induce this 30ss,we stressed transfected 293T cells by subphysiologicaltemperatures, which often activate aberrant splicing(44,45). Low temperatures activated the cryptic 30ss +36and also increased utilization of the cryptic 30ss +126(Figure 8E).
Combinatorial effects of FAS-ESSs on 3’ss selection
Choice of a proximal or distal splice site driven by inter-vening auxiliary splicing signals may reflect their positionin the pre-mRNA, rather than their categorization asenhancers or silencers (16,39,46). To test whether ESSsretain their inhibitory effects on intron-proximal 30ss whenstronger silencer is replaced by a weaker one in theiroriginal positions and vice versa, we swapped two FAS-ESSs that are located in the central region betweencompeting 30ss (clones 11–13). In clone 11, a strong intron-proximal FAS-ESS was replaced by a weaker intron-distalFAS-ESS, resulting in duplication of the latter. Clone 12had a duplicated version of the stronger, intron-proximalFAS-ESS instead of the intron-distal FAS-ESS and adouble mutation in clone 13 exchanged positions of the
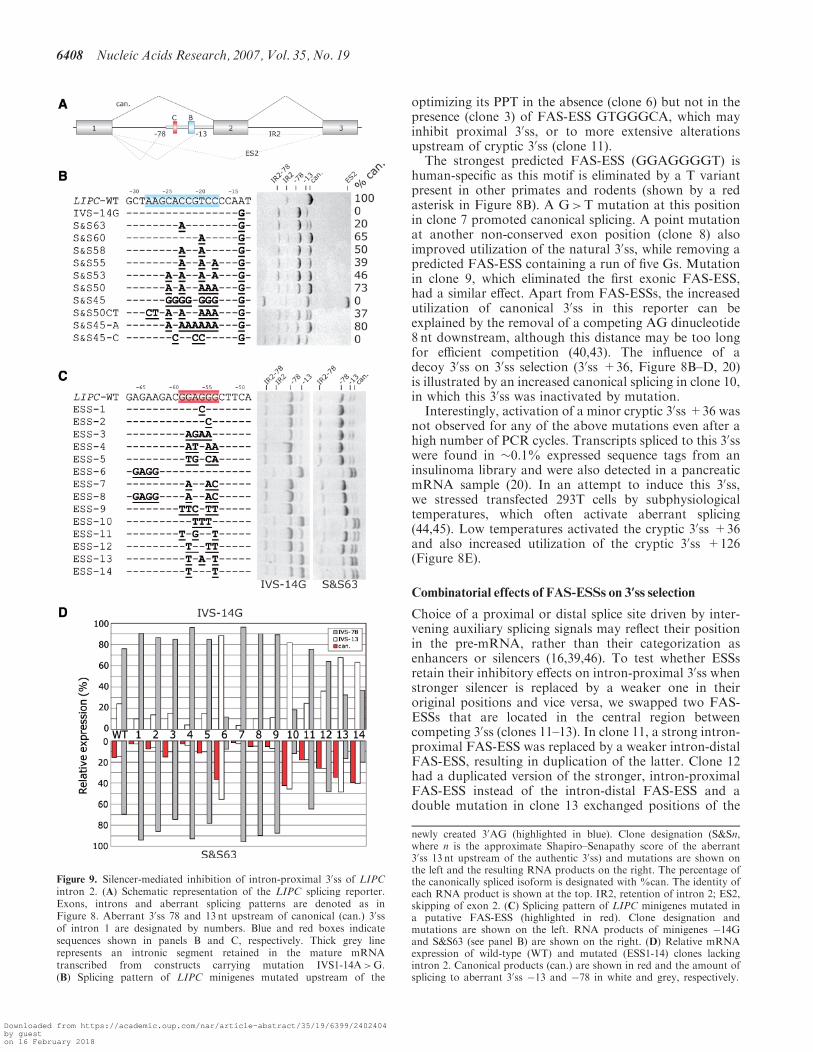
Figure 9. Silencer-mediated inhibition of intron-proximal 30ss of LIPCintron 2. (A) Schematic representation of the LIPC splicing reporter.Exons, introns and aberrant splicing patterns are denoted as inFigure 8. Aberrant 30ss 78 and 13 nt upstream of canonical (can.) 30ssof intron 1 are designated by numbers. Blue and red boxes indicatesequences shown in panels B and C, respectively. Thick grey linerepresents an intronic segment retained in the mature mRNAtranscribed from constructs carrying mutation IVS1-14A>G.(B) Splicing pattern of LIPC minigenes mutated upstream of the
newly created 30AG (highlighted in blue). Clone designation (S&Sn,where n is the approximate Shapiro–Senapathy score of the aberrant30ss 13 nt upstream of the authentic 30ss) and mutations are shown onthe left and the resulting RNA products on the right. The percentage ofthe canonically spliced isoform is designated with %can. The identity ofeach RNA product is shown at the top. IR2, retention of intron 2; ES2,skipping of exon 2. (C) Splicing pattern of LIPC minigenes mutated ina putative FAS-ESS (highlighted in red). Clone designation andmutations are shown on the left. RNA products of minigenes �14Gand S&S63 (see panel B) are shown on the right. (D) Relative mRNAexpression of wild-type (WT) and mutated (ESS1-14) clones lackingintron 2. Canonical products (can.) are shown in red and the amount ofsplicing to aberrant 30ss �13 and �78 in white and grey, respectively.
6408 Nucleic Acids Research, 2007, Vol. 35, No. 19
Downloaded from https://academic.oup.com/nar/article-abstract/35/19/6399/2402404by gueston 16 February 2018
two ESSs. Single mutants (clones 11 and 12) did not createor eliminate any predicted ESEs/ESSs, but clone 13 lostone natural PESE and had one extra ESR. Canonicalsplicing in clone 11 was increased (Figure 8D), indicatingthat replacement of the stronger ESS with the weaker ESSmoderated inhibition of intron-proximal 30ss. In contrast,canonical splicing was repressed in clone 12, indicatingthat the presence of duplicated stronger ESSs was moreinhibitory for intron-proximal 30ss than in the wild-typeconstruct. Swapping intron-distal and intro-proximalESSs in clone 13 had no effect. Clone 14, in which thestrong overlapping FAS-ESS was moved to an adjacentposition in place of an octamer PESE while removinga predicted RESCUE-ESE further downstream markedlyincreased splicing to the cryptic 30ss. In clone 15, theoverlapping FAS-ESSs were exchanged with an upstreamPESE, also promoting cryptic 30ss activation. Finally,single- (clone 16) or double-nucleotide (clone 17) muta-tions in predicted RESCUE-ESE had no or only minoreffects.
As transiently transfected 293T cells are capable ofsecreting the gene product (20), we examined the effectsof FAS-ESS mutations on the proinsulin production bymeasuring total proinsulin levels in culture supernatants.We employed clones 8 and 12 (Figure 8F), in whichmutations did not alter amino acid sequences. Proinsulinlevels were higher in clone 8 and somewhat lower in clone12 than in the wild-type, roughly reflecting the relativeexpression of canonical isoform 4 (cf. Figure 8D and F),indicating that mutations in exonic splicing auxiliarysignals can alter peptide production at the level of pre-mRNA splicing.
Activation of 3’ss by upstream poly(G) element associatedwith exon skipping
To test whether predicted auxiliary elements have similareffects on selection of an intronic cryptic 30ss, we employeda minigene containing exons 1–3 of the human LIPC gene(Figure 9A). Here, the aberrant 30ss was activated in thefirst intron 78 nt upstream of the authentic intron/exonjunction and resulted from a disease-causing pointmutation IVS1-14A>G that created a new AG dinucleo-tide downstream of the BPS (27,47). To identify cis-elements that may restore canonical splicing and toinvestigate utilization of competing splice sites upstream(30ss �78) and downstream (30ss �13) of the BPS, we firstintroduced a progressively increasing number of purinesupstream of the newly created 30ss. The mutant constructshad a varying strength of the 30ss �13, with a wide rangeof the ME (�1.55 to �9.31) and the S&S (65.8 to 46.3)scores (Figure 9B).
The increasing number of As between position �18 to�26 correlated positively with the amount of splicingto the authentic 30ss (r=0.82, P< 10�15, Spearman rankorder test, Figure 9B). Although As upstream of theaberrant 30ss �13 are likely to weaken its PPT, the newlyintroduced As may also bring in additional consensusBPSs and generally promote 30ss selection if located withinan optimal distance from the authentic 30ss (Figure 9B).This interpretation seems to be supported by zero
utilization of authentic 30ss following a replacement ofthe wild-type sequence by a stretch of Cs or Gs andactivation of 30ss �13 in clone S&S50CT, in whichputative branch point As were mutated. Surprisingly,the introduction of a stretch of nine Gs upstream of theaberrant 30ss �13 in clone S&S45 promoted use of this30ss while inducing significant exon skipping (Figure 9B).This mutation minimized the predicted strength of 30ss�13 by eliminating its upstream PPT, yet it did notprevent potent activation of this splice site.To test whether ESSs between competing 30ss �13 and
�78 consistently repress use of the intron-proximal sitein a suprabranch location, we mutated minigenes IVS-14Gand S&S63 in a strong predicted FAS-ESS (shown in redin Figure 9C). Point mutations in clones 1 and 2 elimi-nated this ESS, but did not create any predicted ESEs.Mutations in clones 3 and 4 replaced the ESS withadjacent ESEs located upstream (GAGAAG; clone 3) anddownstream (GATGAA; clone 4), duplicating the ESEelements. In clone 5, the original ESS was replaced bya weaker ESS GTGGCA. Examination of the resultingsplicing patterns revealed that utilization of 30ss �78 waspromoted in all clones, consistent with a relief from theFAS-ESS-mediated repression of the intron-proximal 30ss�78. In contrast, tandem duplication of this element inclone 6 repressed the 30ss �78 almost completely, whereasthis 30ss was strongly promoted by mutations in clone 7that created a tandem ESE GAAGAC. Double mutationsin clone 8, in which the FAS-ESS was swapped with theupstream ESE GAAGAC, promoted use of the 30ss �78.In clones 9–14, the ESS GGAGGG was replaced in the
original position by representative FAS-ESSs from groupsA, B, C, D/E, F and G (32), respectively. With theexception of clone 9, all constructs consistently promoteduse of distal 30ss, either the 30ss �13 in constructs derivedfrom IVS-14G or both the �13 and canonical 30ss inmutants derived from S&S63 (Figure 9C and D). Thestrongest effect was observed for the FAS-ESS group B(clone 10), with a repressive hierarchy of B>F�G>D/E>C on the 30ss �78. Utilization of the authentic 30ss andthe 30ss �13 was approximately equal for all mutationscreated in construct S&S63, consistent with the use of thesame BPS for both 30ss.
DISCUSSION
This work shows the first systematic evaluation of auxi-liary splicing sequences in the development of mutation-induced aberrant splice sites. Our results clearlydemonstrate that a decision to include or excludesequences adjacent to splicing mutations in maturetranscripts is influenced by their ESS/ESE frequencies(Figure 2). We show this both for exonic and intronicsegments and both for cryptic and de novo splice sites.Rather than a traditionally perceived ‘binary’ concept ofexon inclusion and exclusion in the mRNA, these resultsprovide evidence for the existence of a gradient in exonand intron definition at the level of pre-mRNA splicing(Figures 2 and 4A). The observed intermediate levels ofESSs/ESEs in newly included or excluded mRNAs are
Nucleic Acids Research, 2007, Vol. 35, No. 19 6409
Downloaded from https://academic.oup.com/nar/article-abstract/35/19/6399/2402404by gueston 16 February 2018

consistent with recently reported intermediate ESS/ESElevels in extended segments of alternatively spliced exons(48) and high levels of alternative splicing in humans (49).They also reinforce the notion that it is the continuousexonic and intronic DNA sequence that stores informa-tion critical for correct intron removal (Figures 2 and 4A)and accurate quantitative expression of the gene product(Figure 8F). Signals carrying this information contributesignificantly to a ‘splicing code’ (50), which is constitutedby combinations of regulatory elements in pre-mRNAsand cellular complements of splicing factors. This codecontrols phenotypic consequences of splicing mutations indisease genes and locus-specific mutation patterns.Systematic comparison of the ESS/ESE densities
between exonic sequences excluded from mature tran-scripts and average exons revealed greater differencesin the ESS densities than ESE densities, particularly inthe PESS levels (Table 1, Figure 2). This finding is inagreement with recent observations of a more pronouncedeffect on splicing of ESSs than ESEs (28,32). The hier-archy of IN-PS>DN-I�PS> 50UTR-IL>CR-I>DN-E>CR-E>EXSK>ALT-EX>HM-EX>NC-EX in thePESS density was comparable to that observed for FAS-ESSs. Although the PESS density was biased towardssequences that were originally used for their selection(Figure 2A and B), these elements showed also greaterdifferences between CR-I/DN-I and average intronsthan the remaining tested elements. In agreement withour data, PESSs showed the most significant overlap withauxiliary signals recently identified by a novel machine-learning algorithm (51).Comparison of the intrinsic strength of pseudoexon
30 and 50ss (Figure 5) provided statistical support for amechanism whereby a strong de novo donor or acceptorsite is critical to drive the inclusion of newly recognizedexons. This is consistent with a recent observation thatexons with alternatively spliced 30 or 50ss have an intrin-sically strong splice site on the fixated exon side (48) andwith previous case reports (52). Once a strong anchor isintroduced by mutation, exonization of intronic segmentsis more likely to proceed to full inclusion in the mRNA,and presumably to a more severe disease phenotype, iftheir ESE densities are higher and their ESS densitieslower than in average introns (Figure 2). The observedsecond highest SRp40 ESE density in PS might suggest adistinct requirement for this protein in exon definition,in line with previous in vitro studies implicating onlySRp40 (53) or only SRp40/SRp55 (54) in exon inclusion,but not the remaining SR proteins. Apart from the differ-ential splice-site strength and ESE/ESS density, the RNAsecondary structure has been recently shown to be akey feature of cryptic exon activation in the ATM andCFTR genes (55). Thus, this small but rapidly expandingsequence category may provide a useful resource for dis-secting factors that influence exonization without relianceon a pre-existing splice site.Exons that were skipped as a result of splice-site
mutations were weaker than average exons, suggestingthat such mutations are more likely to result in phenotypicconsequences than the same mutations flanking strongerexons. The observed lower intrinsic strength of 30ss in
wild-type EXSK sequences as compared to HM-EX andALT-EX sequences (Figure 6B) may reflect a special roleof 30ss in exon definition. Interestingly, an increase in thesplice-site strength with growing intron size in evolutionwas more prominent for 30ss than 50ss (56,57). In additionto the splice-site strength, skipped exons offered both theinferior choice of decoy splice sites and the diminishedchance to select them in shorter target sequences ascompared to CR-E exons (Tables 1 and 2). Together withthe higher SF2/ASF ESE and reduced ESS densities(Figure 2 and Tables 1 and 2), these four variables werekey determinants of a decision to choose either a crypticsplice site in the exon or to opt for its exclusion from themRNA. Although the remaining sequence-based predictorvariables in logistic regression did not show significantP-values (cf. Tables 1 and 2), they are by no meansexcluded from future models with updated datasets. Betterscore matrices for the remaining SR proteins may improvethe model even if their individual effects on exon inclusionand splice-site activation are smaller than SF2/ASF.Likewise, extending sequence coverage beyond the inter-vening segments with an enlarged DBASS3/5 sample maycapture additional signals. Because the predictive valueof sufficiently long individual sequences is significant(Figure S2), our results will also facilitate the developmentof publicly available algorithms that compute the like-lihood of activating aberrant splice sites in exons asopposed to exon skipping if authentic splice sites areeliminated by mutation (I.V. et al., in preparation).
The smaller peak of the EXSK exon size distribution(Figure 6A) was largely due to frequent skipping of 54-ntexons (n=19) of the collagen genes. These exons are richin FAS-ESSs, but had only two PESSs (AGAATGGT,AGGATGGG). Inspection of 60 FAS-ESS hexamersidentified in EXSK showed that about half of themcontained GGG triplets and virtually all had two conse-cutive Gs, with TCCTGG, CCTGGG and GATGGGbeing the most frequent FAS-ESSs (Table S5). A subset ofthese hexamers contained optimal binding sites forhnRNP A1 (UAGGGU or UAGGGA) (4) or G-richmotifs implicated in exon silencing or intron exonization,often reflecting their relative location from authentic splicesites (39,46,58,59). Some of the collagen exons that wereskipped as a result of splicing mutations had an extra-ordinary density of FAS-ESSs. For example, the meanFAS-ESS density of COL6A1 exon 14 (60), COL1A1 exon49 (61) and COL3A1 exon 37 (62) was 18.52, 12.96 and11.11, respectively, with the latter exon completely lackingRESCUE-ESEs. The intrinsic strength of 30 and 50ss of54-nt exons was not significantly different from theaverage exon (data not shown), suggesting that theirpropensity to exon skipping is largely due to the smallexon size and increased numbers of FAS-ESSs. Thesefeatures may have contributed to the extraordinaryevolution of collagen genes, which are characterized bymultiple 54-nt exons encoding Gly-X1-X2 triplets in thehelical domain (63). These exons were occasionallyduplicated or triplicated, possibly through partiallyprocessed RNAs (63).
Of four tested SR matrices, SF2/ASF gave the bestdiscrimination of newly intronized and exonized sequence
6410 Nucleic Acids Research, 2007, Vol. 35, No. 19
Downloaded from https://academic.oup.com/nar/article-abstract/35/19/6399/2402404by gueston 16 February 2018

categories and the largest spread across the exon-intronspectrum (Figure 4A and Table S4). This is consistent withthe lowest P-values observed for SF2/ASF of the fourproteins when comparing SR ESE motif frequencies inexons and introns (42). The elevated SF2/ASF ESE levelsbetween cryptic 50ss and their authentic counterparts ascompared to de novo 50ss and average exons (Figures 4Band 7) suggests that they compensate the relative lack ofsplicing silencers in 50ss CR-E (Figure 3E). They may alsoexplain a previous observation of more pronounced effectsof ESEs on competing 50ss than 30ss (32). As SF2/ASFESEs and high-score PESEs significantly overlap (33) andFAS-hex3 are enriched in alternative 50 exons (10), futurestudies with a higher number of 50ss CR-E sequencesshould determine a spatial relationship between theseelements and estimate to what extent the observed 50 to30ss bias can be explained by greater availability of decoy50ss than 30ss in CR-E exons (Table 1). Reduced availabi-lity of 50ss recognition sequences in the vicinity of exonsthat were skipped has been recently noticed for NF1 (28)and other genes (18). Nevertheless, dominant contributionof the 50ss NN score density to differences in the overallNN score density is likely to reflect greater sequenceconstraints imposed by the BPS-PPT-30YAG signals thanby the less extensive 50ss consensus.
Our experimental data confirm and extend the previousfinding (32) that FAS-ESSs consistently inhibit intron-proximal splice sites. The only exception was the FAS-ESSgroup A (TTCGTT; Figure 9), which showed the weakesteffect of all representative FAS-ESS with other reporters(32). In our experiments, the inhibitory effects of predictedFAS-ESSs on intron-proximal 30ss were retained if theseelements were maintained at their original positions inthe pre-mRNA and were predictably modified by combin-ing the auxiliary signals in a modular, possibly additivemanner and by removing a decoy 30AG nearby. Ourunexpected observation of significant utilization for newlycreated AGs in the AG exclusion zone in the unfavourablecontext of a preceding stretch of Gs (Figure 9B) can bemechanistically explained by creating a secondary struc-ture altering accessibility of spliceosomal complexes,by elimination of the authentic BPS that weakens exondefinition and leads to exons skipping, by introduction ofstrong ESSs that completely repress the intron-proximal30ss �78, most likely through factors that bind to poly(G)elements, such as hnRNP H/H0/F (3,5,39,46), and activatedistal the 30ss �13, or by a combination of these factors.
In conclusion, in vivo selection of aberrant splice sites inintrons and exons is extensively controlled by auxiliarysplicing signals. Exonic sequences that are excluded fromthe mRNA as a result of mutations activating aberrantsplice sites have more ESSs and less ESEs than averageconserved exons. Conversely, intronic sequences that areincluded in the mRNAs have more ESEs and less ESSsthan average introns. Second, efficient use of intrinsicallyweak cryptic splice sites in exons is facilitated by a higherthan average density of ESSs, which promote activationof intron-distal sites, particularly cryptic 30ss (Figures 2and 3E), and a high density of SF2/ASF ESE motifs,especially for cryptic 50ss (Figures 4B and 7). Third, exonsthat are skipped as a result of splice-site mutations are
smaller than typical exons (�90% of the median length ofconserved exons), have weaker 30ss (�95% of the medianME score), higher than average density of predictedESSs and lower than average density of ESEs. Fourth, adecision to exclude the whole exon or activate exonicaberrant splice site if one of the authentic splice sites isinactivated by mutation is largely driven by the overallavailability of intrinsically strong decoy splice sites, SF2/ASF support and the balance between the ESS density insequences between authentic and aberrant splice sites andthe remaining exonic sequences. Fifth, predicted ESSs canpromote efficient selection of 30ss in a highly unfavourablecontext, highlighting the power of auxiliary sequences tocontrol selection of many intrinsically weak splice sites inthe genome. Finally, altered 30ss selection through muta-tions in predicted ESSs and the resulting quantitativechanges in canonical mRNAs and peptide productionreinforce the notion that alternative splicing is an impor-tant but underappreciated mechanism of fine-tuning geneexpression and that gene variants located in these elementsare likely to contribute significantly to inter-individualphenotypic variability.
SUPPLEMENTARY DATA
Supplementary Data are available at NAR Online.
ACKNOWLEDGEMENTS
This work was supported by the grant from the JuvenileDiabetes Research Foundation International (1-2006-263) to I.V. We thank Martin Chivers (University ofSouthampton) for technical assistance, Sarah Ennis andNik Maniatis (University of Southampton) for statisticaladvice and Christine Glenn and Peter Wood (Departmentof Endocrinology, Southampton Hospital NHS Trust)for measurements of total proinsulin. Funding to paythe Open Access publication charges for this article wasprovided by the Juvenile Diabetes Research FoundationInternational.
Conflict of interest statement. None declared.
REFERENCES
1. Liu,H.X., Zhang,M. and Krainer,A.R. (1998) Identification offunctional exonic splicing enhancer motifs recognized by individualSR proteins. Genes Dev., 12, 1998–2012.
2. Ghetti,A., Pinol-Roma,S., Michael,W.M., Morandi,C. andDreyfuss,G. (1992) hnRNP I, the polypyrimidine tract-bindingprotein: distinct nuclear localization and association with hnRNAs.Nucleic Acids Res., 20, 3671–3678.
3. Matunis,M.J., Xing,J. and Dreyfuss,G. (1994) The hnRNP Fprotein: unique primary structure, nucleic acid-binding properties,and subcellular localization. Nucleic Acids Res., 22, 1059–1067.
4. Burd,C.G. and Dreyfuss,G. (1994) RNA binding specificity ofhnRNP A1: significance of hnRNP A1 high-affinity binding sitesin pre-mRNA splicing. EMBO J., 13, 1197–1204.
5. Caputi,M. and Zahler,A.M. (2001) Determination of the RNAbinding specificity of the heterogeneous nuclear ribonucleoprotein(hnRNP) H/H’/F/2H9 family. J. Biol. Chem., 276, 43850–43859.
6. Buratti,E. and Baralle,F.E. (2004) Influence of RNA secondarystructure on the pre-mRNA splicing process. Mol. Cell. Biol., 24,10505–10514.
Nucleic Acids Research, 2007, Vol. 35, No. 19 6411
Downloaded from https://academic.oup.com/nar/article-abstract/35/19/6399/2402404by gueston 16 February 2018

7. Coulter,L.R., Landree,M.A. and Cooper,T.A. (1997) Identificationof a new class of exonic splicing enhancers by in vivo selection.Mol. Cell. Biol., 17, 2143–2150.
8. Schaal,T.D. and Maniatis,T. (1999) Selection and characterizationof pre-mRNA splicing enhancers: identification of novel SRprotein-specific enhancer sequences. Mol. Cell. Biol., 19, 1705–1719.
9. Singh,N.N., Androphy,E.J. and Singh,R.N. (2004) In vivo selectionreveals combinatorial controls that define a critical exon in thespinal muscular atrophy genes. RNA, 10, 1291–1305.
10. Wang,Z., Rolish,M.E., Yeo,G., Tung,V., Mawson,M. andBurge,C.B. (2004) Systematic identification and analysis of exonicsplicing silencers. Cell, 119, 831–845.
11. Cartegni,L., Chew,S.L. and Krainer,A.R. (2002) Listening to silenceand understanding nonsense: exonic mutations that affect splicing.Nat. Rev. Genet., 3, 285–298.
12. Pagani,F., Stuani,C., Tzetis,M., Kanavakis,E., Efthymiadou,A.,Doudounakis,S., Casals,T. and Baralle,F.E. (2003) New type ofdisease causing mutations: the example of the compositeexonic regulatory elements of splicing in CFTR exon 12.Hum. Mol. Genet., 12, 1111–1120.
13. Fairbrother,W.G., Yeh,R.F., Sharp,P.A. and Burge,C.B. (2002)Predictive identification of exonic splicing enhancers in humangenes. Science, 297, 1007–1013.
14. Zhang,X.H. and Chasin,L.A. (2004) Computational definitionof sequence motifs governing constitutive exon splicing. Genes Dev.,18, 1241–1250.
15. Zhang,X.H., Kangsamaksin,T., Chao,M.S., Banerjee,J.K. andChasin,L.A. (2005) Exon inclusion is dependent on predictableexonic splicing enhancers. Mol. Cell. Biol., 25, 7323–7332.
16. Goren,A., Ram,O., Amit,M., Keren,H., Lev-Maor,G., Vig,I.,Pupko,T. and Ast,G. (2006) Comparative analysis identifies exonicsplicing regulatory sequences—the complex definition of enhancersand silencers. Mol. Cell, 22, 769–781.
17. Cooper,T.A. and Mattox,W. (1997) The regulation of splice-siteselection, and its role in human disease. Am. J. Hum. Genet., 61,259–266.
18. Krawczak,M., Thomas,N.S., Hundrieser,B., Mort,M., Wittig,M.,Hampe,J. and Cooper,D.N. (2007) Single base-pair substitutions inexon-intron junctions of human genes: nature, distribution, andconsequences for mRNA splicing. Hum. Mutat., 28, 150–158.
19. Nissim-Rafinia,M. and Kerem,B. (2002) Splicing regulation asa potential genetic modifier. Trends Genet., 18, 123–127.
20. Kralovicova,J., Gaunt,T.R., Rodriguez,S., Wood,P.J., Day,I.N.M.and Vorechovsky,I. (2006) Variants in the human insulin gene thataffect pre-mRNA splicing: is -23HphI a functional single nucleotidepolymorphism at IDDM2? Diabetes, 55, 260–264.
21. Krawczak,M., Reiss,J. and Cooper,D.N. (1992) The mutationalspectrum of single base-pair substitutions in mRNA splice junctionsof human genes: causes and consequences. Hum. Genet., 90, 41–54.
22. Nakai,K. and Sakamoto,H. (1994) Construction of a noveldatabase containing aberrant splicing mutations of mammaliangenes. Gene, 141, 171–177.
23. Roca,X., Sachidanandam,R. and Krainer,AR. (2003) Intrinsicdifferences between authentic and cryptic 50 splice sites.Nucleic Acids Res., 31, 6321–6333.
24. Vorechovsky,I. (2006) Aberrant 30 splice sites in human diseasegenes: mutation pattern, nucleotide structure and comparisonof computational tools that predict their utilization.Nucleic Acids Res., 34, 4630–4641.
25. Buratti,E., Chivers,M.C., Kralovicova,J., Romano,M., Baralle,M.,Krainer,A.R. and Vorechovsky,I. (2007) Aberrant 50 splice sites inhuman disease genes: mutation pattern, nucleotide structure andcomparison of computational tools that predict their utilization.Nucleic Acids Res., 35, 4250–4263.
26. Roca,X., Sachidanandam,R. and Krainer,A.R. (2005) Determinantsof the inherent strength of human 50 splice sites. RNA, 11, 683–698.
27. Kralovicova,J., Christensen,M.B. and Vorechovsky,I. (2005) Biasedexon/intron distribution of cryptic and de novo 30 splice sites.Nucleic Acids Res., 33, 4882–4898.
28. Wimmer,K., Roca,X., Beiglbock,H., Callens,T., Etzler,J., Rao,A.R.,Krainer,A.R., Fonatsch,C. and Messiaen,L. (2007) Extensive insilico analysis of NF1 splicing defects uncovers determinants forsplicing outcome upon 50 splice-site disruption. Hum. Mutat., 28,599–612.
29. Sterner,D.A., Carlo,T. and Berget,S.M. (1996) Architectural limitson split genes. Proc. Natl Acad. Sci. USA, 93, 15081–15085.
30. Carmel,I., Tal,S., Vig,I. and Ast,G. (2004) Comparative analysisdetects dependencies among the 50 splice-site positions. RNA, 10,828–840.
31. Fairbrother,W.G., Yeo,G.W., Yeh,R., Goldstein,P., Mawson,M.,Sharp,P.A. and Burge,C.B. (2004) RESCUE-ESE identifiescandidate exonic splicing enhancers in vertebrate exons.Nucleic Acids Res., 32, W187–W190.
32. Wang,Z., Xiao,X., Van Nostrand,E. and Burge,C.B. (2006) Generaland specific functions of exonic splicing silencers in splicing control.Mol. Cell, 23, 61–70.
33. Smith,P.J., Zhang,C., Wang,J., Chew,S.L., Zhang,M.Q. andKrainer,A.R. (2006) An increased specificity score matrix for theprediction of SF2/ASF-specific exonic splicing enhancers.Hum. Mol. Genet., 15, 2490–2508.
34. Cartegni,L., Wang,J., Zhu,Z., Zhang,M.Q. and Krainer,A.R. (2003)ESEfinder: a web resource to identify exonic splicing enhancers.Nucleic Acids Res., 31, 3568–3571.
35. Reese,M.G., Eeckman,F.H., Kulp,D. and Haussler,D. (1997)Improved splice site detection in Genie. J. Comput. Biol., 4,311–323.
36. Yeo,G. and Burge,C.B. (2004) Maximum entropy modeling of shortsequence motifs with applications to RNA splicing signals.J. Comput. Biol., 11, 377–394.
37. Shapiro,M.B. and Senapathy,P. (1987) RNA splice junctionsof different classes of eukaryotes: sequence statistics andfunctional implications in gene expression. Nucleic Acids Res., 15,7155–7174.
38. Senapathy,P., Shapiro,M.B. and Harris,N.L. (1990) Splice junc-tions, branch point sites, and exons: sequence statistics, identifica-tion, and applications to genome project. Methods Enzymol., 183,252–278.
39. Kralovicova,J. and Vorechovsky,I. (2006) Position-dependentrepression and promotion of DQB1 intron 3 splicing by GGGGmotifs. J. Immunol., 176, 2381–2388.
40. Lei,H. and Kralovicova,I. (2005) Identification of splicing silencersand enhancers in sense Alus: a role for pseudo-acceptors in splicesite repression. Mol. Cell. Biol., 25, 6912–6920.
41. Smith,C.W., Chu,T.T. and Nadal-Ginard,B. (1993) Scanning andcompetition between AGs are involved in 30 splice site selection inmammalian introns. Mol. Cell. Biol., 13, 4939–4952.
42. Wang,J., Smith,P.J., Krainer,A.R. and Zhang,M.Q. (2005)Distribution of SR protein exonic splicing enhancer motifs inhuman protein-coding genes. Nucleic Acids Res., 33, 5053–5062.
43. Chua,K. and Reed,R. (2001) An upstream AG determines whethera downstream AG is selected during catalytic step II of splicing.Mol. Cell. Biol., 21, 1509–1514.
44. Gemignani,F., Sazani,P., Morcos,P. and Kole,R. (2002)Temperature-dependent splicing of beta-globin pre-mRNA.Nucleic Acids Res., 30, 4592–4598.
45. Kralovicova,J., Houngninou-Molango,S., Kramer,A. andVorechovsky,I. (2004) Branch site haplotypes that control alter-native splicing. Hum. Mol. Genet., 13, 3189–3202.
46. Han,K., Yeo,G., An,P., Burge,C.B. and Grabowski,P.J. (2005)A combinatorial code for splicing silencing: UAGG and GGGGmotifs. PLoS Biol., 3, e158.
47. Brand,K., Dugi,K.A., Brunzell,J.D., Nevin,D.N. and Santamarina-Fojo,S. (1996) A novel A>G mutation in intron 1 of the hepaticlipase gene leads to alternative splicing resulting in enzymedeficiency. J. Lipid Res., 37, 1213–1223.
48. Koren,E., Lev-Maor,G. and Ast,G. (2007) The emergence ofalternative 3’ and 5’ splice site exons from constitutive exons.PLoS Comput. Biol., 3, e95.
49. Johnson,J.M., Castle,J., Garrett-Engele,P., Kan,Z., Loerch,P.M.,Armour,C.D., Santos,R., Schadt,E.E., Stoughton,R. et al. (2003)Genome-wide survey of human alternative pre-mRNA splicing withexon junction microarrays. Science, 302, 2141–2144.
50. Matlin,A.J., Clark,F. and Smith,C.W. (2005) Understandingalternative splicing: towards a cellular code. Nat. Rev. Mol.Cell. Biol., 6, 386–398.
51. Dogan,R.I., Getoor,L., Wilbur,W.J. and Mount,S.M. (2007)Features generated for computational splice-site prediction corre-spond to functional elements. BMC Bioinformatics, in press.
6412 Nucleic Acids Research, 2007, Vol. 35, No. 19
Downloaded from https://academic.oup.com/nar/article-abstract/35/19/6399/2402404by gueston 16 February 2018

52. Buratti,E., Baralle,M. and Baralle,F.E. (2006) Defective splicing,disease and therapy: searching for master checkpoints in exondefinition. Nucleic Acids Res., 34, 3494–3510.
53. Du,K., Peng,Y., Greenbaum,L.E., Haber,B.A. and Taub,R. (1997)HRS/SRp40-mediated inclusion of the fibronectin EIIIB exon, apossible cause of increased EIIIB expression in proliferating liver.Mol. Cell. Biol., 17, 4096–4104.
54. Ramchatesingh,J., Zahler,A.M., Neugebauer,K.M., Roth,M.B. andCooper,T.A. (1995) A subset of SR proteins activates splicing of thecardiac troponin T alternative exon by direct interactions with anexonic enhancer. Mol. Cell. Biol., 15, 4898–4907.
55. Buratti,E., Dhir,A., Lewandowska,E. and Baralle,F.E. (2007) RNAstructure is a key regulatory element in pathological ATM andCFTR pseudoexon inclusion. Nucleic Acids Res., 35, 4369–4383.
56. Dewey,C.N., Rogozin,I.B. and Koonin,E.V. (2006) Compensatoryrelationship between splice sites and exonic splicing signalsdepending on the length of vertebrate introns. BMC Genomics, 7,311.
57. Bannai,H., Inenaga,S., Shinohara,A., Takeda,M. and Miyano,S.(2002) A string pattern regression algorithm and itsapplication to pattern discovery in long introns. Genome Inform.,13, 3–11.
58. McCullough,A.J. and Berget,S.M. (1997) G triplets locatedthroughout a class of small vertebrate introns enforce intronborders and regulate splice site selection. Mol. Cell. Biol., 17,4562–4571.
59. Sironi,M., Menozzi,G., Riva,L., Cagliani,R., Comi,G.P.,Bresolin,N., Giorda,R. and Pozzoli,U. (2004) Silencer elements aspossible inhibitors of pseudoexon splicing. Nucleic Acids Res., 32,1783–1791.
60. Lamande,S.R., Shields,K.A., Kornberg,A.J., Shield,L.K. andBateman,J.F. (1999) Bethlem myopathy and engineered collagen VItriple helical deletions prevent intracellular multimer assembly andprotein secretion. J. Biol. Chem., 274, 21817–21822.
61. Griffith,A.J., Sprunger,L.K., Sirko-Osadsa,D.A., Tiller,G.E.,Meisler,M.H. and Warman,M.L. (1998) Marshall syndromeassociated with a splicing defect at the COL1A1 locus. Am. J. Hum.Genet., 62, 816–823.
62. Schwarze,U., Goldstein,J.A. and Byers,P.H. (1997) Splicing defectsin the COL3A1 gene: marked preference for 50 (donor) spice-sitemutations in patients with exon-skipping mutations and Ehlers-Danlos syndrome type IV. Am. J. Hum. Genet., 61, 1276–1286.
63. Sykes,B. (1985) The molecular genetics of collagen. BioEssays, 3,112–117.
Nucleic Acids Research, 2007, Vol. 35, No. 19 6413
Downloaded from https://academic.oup.com/nar/article-abstract/35/19/6399/2402404by gueston 16 February 2018