global construction outlook - · pdf fileglobal construction outlook scott hazelton ... •...
TRANSCRIPT

Global Construction OutlookGlobal Construction Outlook
Scott Hazelton
Director, Construction Advisory Services
June 23, 2009

Copyright © 2009 IHS Global Insight. All Rights Reserved.
The Deep Global Recession is Ending
• The worldwide scope of this financial crisis is unprecedented
• Globalization of trade and capital flows has increased business cycle synchronization and volatility
• A global inventory cycle amplified demand shocks
• Fiscal and monetary stimuli will help to revive growth
• The timing and speed of regional recoveries will vary, with Asia leading, the U.S. coincident, and Europe lagging
• Bottom Line: a deep recession in 2009, modest recovery in 2010, and a stronger rebound in 2011–12

Copyright © 2009 IHS Global Insight. All Rights Reserved.
(Percent change)
The World Economy Experiences the Worst Recession of the Postwar Era
-12
-9
-6
-3
0
3
6
9
1972 1976 1980 1984 1988 1992 1996 2000 2004 2008 2012
Real GDP Industrial Production

Copyright © 2009 IHS Global Insight. All Rights Reserved.
(Real GDP, percent change)
Economic Growth Weakens Across all Regions
-8
-6
-4
-2
0
2
4
6
8
NAFTA Western
Europe
Japan Other
Americas
Emerging
Europe
Mideast-
N. Africa
Sub-
Saharan
Africa
Other
Asia-
Pacific
2008 2009 2010 2011

Copyright © 2009 IHS Global Insight. All Rights Reserved.
(Percent change)
The World’s Real Economic Growth by Sector
-15
-10
-5
0
5
10
GDP Private
Consumption
Fixed
Investment
Government
Consumption
Exports
2008 2009 2010 2011

Copyright © 2009 IHS Global Insight. All Rights Reserved.
Global Construction Outlook: Total Construction
Billions of 2005 $U.S., Left-axis
Percent change, Right-axis
-
1,000
2,000
3,000
4,000
5,000
6,000
7,000
8,000
9,000
2000
2001
2002
2003
2004
2005
2006
2007
2008
2009
2010
2011
2012
2013
2014
2015
2016
2017
2018
-6%
-4%
-2%
0%
2%
4%
6%
8%

Copyright © 2009 IHS Global Insight. All Rights Reserved.
Total Construction Regional Review
• Non-Japan Asia dominates the construction outlook• North America worst hit in 2009• Western Europe lags in recovery
Total Construction By Region
50
70
90
110
130
150
170
190
2000 2002 2004 2006 2008 2010 2012 2014 2016 2018
(Index, 2008=100)
Asia Eastern Europe
MidEast and Africa North America
South America Western Europe
Non-Japan Asia

Copyright © 2009 IHS Global Insight. All Rights Reserved.
Asia Will Gain Construction Share at Europe’s Expense
2008
Asia
32%
Japan
9%
Eastern Europe
4%
MidEast and
Africa
3%
North America
18%
South America
3%
Western Europe
31%
2018
Asia
39%
Japan
8%
Eastern Europe
5%
MidEast and
Africa
4%
North America
17%
South America
3%
Western Europe
24%

Copyright © 2009 IHS Global Insight. All Rights Reserved.
Residential Construction Outlook Regional Comparison
1.6%
1.9%
3.3%
5.2%
5.1%
0.6%
-0.6%
-3.9%
-5% -3% -1% 1% 3% 5% 7%
Western Europe
Eastern Europe
South America
Middle East & Africa
Asia
Non-Japan Asia
North America
World
Compound Annual Growth 2008-2013

Copyright © 2009 IHS Global Insight. All Rights Reserved.
Structures Construction Outlook Regional Comparison
1.1%
1.7%
3.2%
5.4%
6.9%
1.3%
-2.2%
-1.7%
-5% -3% -1% 1% 3% 5% 7% 9%
North America
Western Europe
Eastern Europe
Middle East & Africa
South America
Asia
Non-Japan Asia
World
Compound Annual Growth 2008-2013

Copyright © 2009 IHS Global Insight. All Rights Reserved.
Infrastructure Leads GrowthAcross All Regions in 2009
2009 Construction Segments By Region
-35%
-30%
-25%
-20%
-15%
-10%
-5%
0%
5%
10%
15%
World Asia Eastern
Europe
MidEast
and
Africa
North
America
South
America
Western
Europe
Perc
ent C
hange Y
ear
Ago
TotalConstruction
Residential
NonresidentialStructures
Infrastructure

Copyright © 2009 IHS Global Insight. All Rights Reserved.
Infrastructure to Lead Global Construction
0%
1%
2%
3%
4%
5%
6%
7%
8%
Total Residential Nonresidential
Structures
Infrastructure
Co
mp
ou
nd
An
nu
al G
row
th (
CA
GR
)
2003-08
2008-13
2013-18

Copyright © 2009 IHS Global Insight. All Rights Reserved.
Institutional is the Best Bet ForStructural Investment
0%
1%
2%
3%
4%
5%
6%
7%
8%
9%
10%
Nonresidential
Structures
Office Commercial Institutional Industrial
Com
pound A
nnual G
row
th (C
AG
R)
2003-08
2008-13
2013-18

Copyright © 2009 IHS Global Insight. All Rights Reserved.
Balancing Opportunity with Risk
United States
Japan
China
Germany
United Kingdom
Italy
France
Spain
Canada
Netherlands
Mexico
Australia
Russia
Brazil
India
-4%
-2%
0%
2%
4%
6%
8%
10%
0 10 20 30 40 50
Construction Risk Score - 5 YearCircle Size = Total Nominal Construction Spending in 2008
To
tal C
on
str
ucti
on S
pen
din
g G
row
th,
Real 2000 U
S D
ollars
(C
AG
R %
, 2008-2
013)
Average Global Construction
Growth
Med
ian C
on
str
uctio
n R
isk
South Korea

Copyright © 2009 IHS Global Insight. All Rights Reserved.
South America: A Temporary Setback
• Exports are falling in response to global slowdown
• Currencies are under pressure as investors avoid risk
• Compared to late 1990s, region is better shielded from the global financial crisis
• Long-term prospects are bright for countries attracting foreign investment, including Brazil, Chile, Peru, and Colombia
• Policy mismanagement and resource nationalism will take a toll on Argentina, Venezuela, Bolivia, and Ecuador
• Brazil
• Engines of growth—capital spending and exports—have slowed
• The global financial crisis has put downward pressure on the real’s exchange rate, correcting an overvaluation
• Sound monetary policies have tamed inflation but interest rates are still very high
• Brazil could soon become a major player in energy markets
• Competitiveness is undermined by high and complex taxation, heavy bureaucracy, and insufficient infrastructure investment

Copyright © 2009 IHS Global Insight. All Rights Reserved.
Regional Focus: Latin America
Latin American construction markets will pause but not contract severely with this business cycle
0
50
100
150
200
250
300
2000
2001
2002
2003
2004
2005
2006
2007
2008
2009
2010
2011
2012
2013
2014
2015
2016
2017
2018
Peru
Venezuela
Colombia
Argentina
Brazil

Copyright © 2009 IHS Global Insight. All Rights Reserved.
Taking Stock of China’s Economy
The Good
• Limited exposure to toxic assets
• No liquidity crunch
• No foreclosure problem—home owners bought with cash or large down payment
• High saving rate—consumers are not stretched
• Swift and aggressive government response to crisis
• Domestic economy in better shape then in the Asian Crisis
The Bad
• Worst export crash in 30 years
• More exposed to external demand shocks then ever
• Export collapse could push China into a deflationary spiral
• High saving rate—consumers are structurally reluctant to spend
• 6 years of excess investment
The How Ugly
• Stimulus policies could preserve adequate growth in the short term
• But global demand downturn could get even worse and more prolonged
• But “Shock and Awe” stimulus could lead to serious problems down the road

Copyright © 2009 IHS Global Insight. All Rights Reserved.
Downturn Mostly Due to Crashing Exports
(Percent change from a year earlier)
Source: NBS, China Customs
-30
-20
-10
0
10
20
30
40
50
60
Jan-05 Jan-06 Jan-07 Jan-08 Jan-09
Exports Fixed Investment Retail Sales

Copyright © 2009 IHS Global Insight. All Rights Reserved.
Breakdown China’s 4 Trillion RMB Fiscal Package through 2010
13.3100.04,000Total
3.325.01,000Earthquake reconstruction
1.29.3370R&D and structural change
0.75.3210Environmental development
0.53.8150Healthcare and education
5.037.51,500Transport infrastructure
1.29.3370Rural infrastructure
1.310.0400Public housing projects
% 2008 GDP% totalBil. Yuan
Source: National People’s Congress, March 2009

Copyright © 2009 IHS Global Insight. All Rights Reserved.
India’s Growth Will Slow, but Medium-Term Prospects Are Sound
• Domestic demand drives the economy
• Exports amount to just 21% of GDP
• But India depends on inflows of foreign capital
• Consumer spending is decelerating
• Monetary policy is easing
• Government deficits limit essential infrastructure investment
• Demographic trends are favorable

Copyright © 2009 IHS Global Insight. All Rights Reserved.
India’s Real Economic Growth
14.26.1-14.012.2Imports
9.84.6-12.25.7Exports
9.39.518.416.1Government Consumption
11.78.02.28.0Fixed Investment
6.84.72.85.5Private Consumption
6.95.84.36.0Real GDP
2011201020092008
(Percent change)

Copyright © 2009 IHS Global Insight. All Rights Reserved.
Regional Focus: Asia
• Asia, lead by China and India, is the only region that will not see declines in total construction spending in 2009
(Billions of 2005 $U.S.)
0
500
1,000
1,500
2,000
2,500
3,000
3,500
1990
1992
1994
1996
1998
2000
2002
2004
2006
2008
2010
2012
2014
2016
2018
Indonesia
Australia
Korea
India
Japan
China

Copyright © 2009 IHS Global Insight. All Rights Reserved.
BRIC Outlook
0%
2%
4%
6%
8%
10%
12%
14%
16%
China India Russia Brazil
Co
mp
ou
nd
An
nu
al G
row
th 2003-08
2008-13
2013-08
• China and India continue to lead construction growth in the outlook
• Russia makes up for 2008–13 slowdown in the second-half of forecast

Copyright © 2009 IHS Global Insight. All Rights Reserved.
Middle East and Africa:The Boom is Over
• The drop in commodity prices is causing a sharp slowdown in economic growth
• Large financial reserves in oil-exporting countries will help to cushion the blow
• But the global liquidity squeeze is hurting investment projects throughout the region
• The global recession will hurt tourism in several countries
• Growth rates are not likely to return to the heights of 2004–08

Copyright © 2009 IHS Global Insight. All Rights Reserved.
(Percent of GDP)
Middle East and North Africa’sSurpluses Will Disappear in 2009
-15
-10
-5
0
5
10
15
20
1990 1992 1994 1996 1998 2000 2002 2004 2006 2008 2010 2012
Fiscal Balance Current Account Balance

Copyright © 2009 IHS Global Insight. All Rights Reserved.
Regional Construction Outlook
-15%
-10%
-5%
0%
5%
10%
15%
Saudi Arabia United Arab
Emirates
Iran Qatar Kuwait Bahrain
2008 2009 2010 2011

Copyright © 2009 IHS Global Insight. All Rights Reserved.
Implications for Your Business
• The global recession is now underway and 2009 will be the worst year for the world construction market in two decades
• The infrastructure construction industry is the only sector thatwill do well in this time of crisis, in part due to strong and supportive country-specific stimulus packages
• A modest recovery expected in 2010, but strong pick-up in the global construction market in 2011
Copyright © 2009 IHS Global Insight. All Rights Reserved.
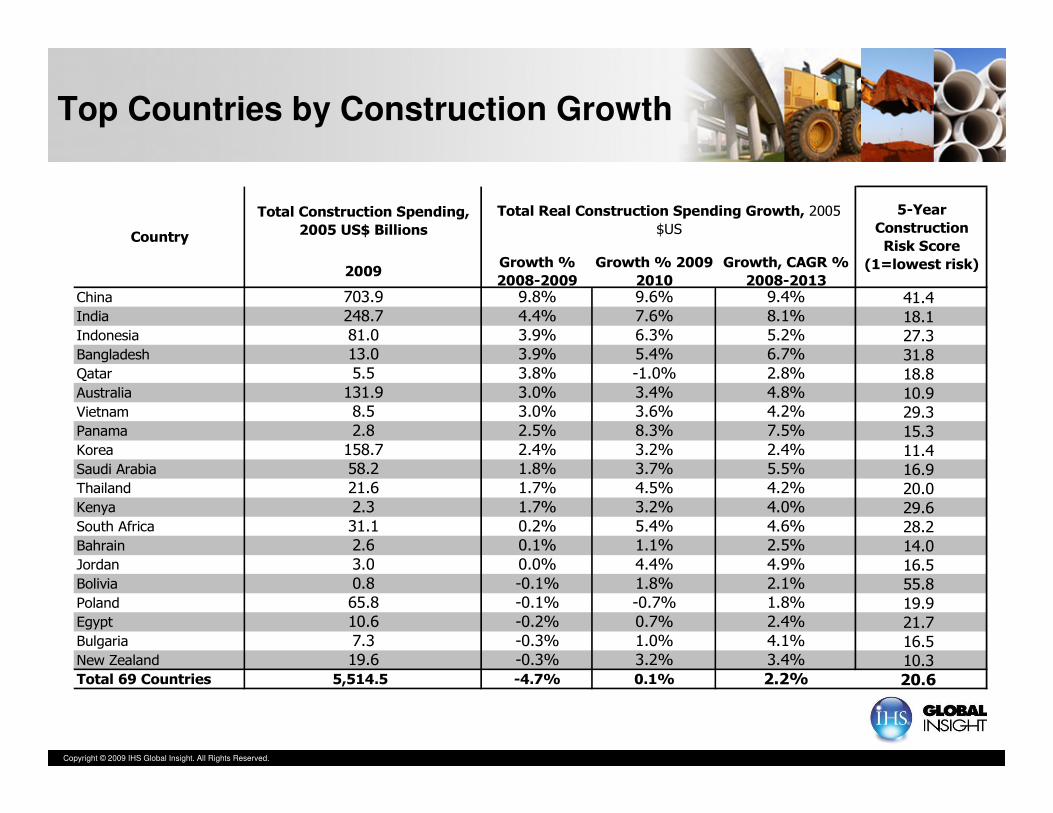
Top Countries by Construction Growth
Total Construction Spending,
2005 US$ Billions
2009Growth %
2008-2009
Growth % 2009-
2010
Growth, CAGR %
2008-2013China 703.9 9.8% 9.6% 9.4% 41.4India 248.7 4.4% 7.6% 8.1% 18.1Indonesia 81.0 3.9% 6.3% 5.2% 27.3Bangladesh 13.0 3.9% 5.4% 6.7% 31.8Qatar 5.5 3.8% -1.0% 2.8% 18.8Australia 131.9 3.0% 3.4% 4.8% 10.9Vietnam 8.5 3.0% 3.6% 4.2% 29.3Panama 2.8 2.5% 8.3% 7.5% 15.3Korea 158.7 2.4% 3.2% 2.4% 11.4Saudi Arabia 58.2 1.8% 3.7% 5.5% 16.9Thailand 21.6 1.7% 4.5% 4.2% 20.0Kenya 2.3 1.7% 3.2% 4.0% 29.6South Africa 31.1 0.2% 5.4% 4.6% 28.2Bahrain 2.6 0.1% 1.1% 2.5% 14.0Jordan 3.0 0.0% 4.4% 4.9% 16.5Bolivia 0.8 -0.1% 1.8% 2.1% 55.8Poland 65.8 -0.1% -0.7% 1.8% 19.9Egypt 10.6 -0.2% 0.7% 2.4% 21.7Bulgaria 7.3 -0.3% 1.0% 4.1% 16.5New Zealand 19.6 -0.3% 3.2% 3.4% 10.3Total 69 Countries 5,514.5 -4.7% 0.1% 2.2% 20.6
Total Real Construction Spending Growth, 2005
$US
5-Year
Construction
Risk Score
(1=lowest risk)
Country

Copyright © 2009 IHS Global Insight. All Rights Reserved.
(Percent change)
The U.S. Recession
-12.5
-10.0
-7.5
-5.0
-2.5
0.0
2.5
5.0
7.5
1990 1992 1994 1996 1998 2000 2002 2004 2006 2008 2010 2012
U.S. Real GDP Industrial Production
•Deepest, longest recession in post-war history
•Signs of stabilization in consumer and housing markets suggest that the economy may turn up this summer
•Financial market conditions are improving, but credit will remain tight for an extended period
•Downturn in nonresidential construction just beginning and will be severe
•Wage and price inflation will remain subdued for several years

Copyright © 2009 IHS Global Insight. All Rights Reserved.
Regional Focus: North America
• North America experiences the largest decline of all regions in 2009, contracting by 16.7%, mostly a result of the decline in the U.S. residential construction market
0
200
400
600
800
1,000
1,200
1,400
1,600
2000
2001
2002
2003
2004
2005
2006
2007
2008
2009
2010
2011
2012
2013
2014
2015
2016
2017
2018
-20%
-15%
-10%
-5%
0%
5%
10%
15%
Mexico
Canada
United States
North America (right-axis)
Copyright © 2009 IHS Global Insight. All Rights Reserved.
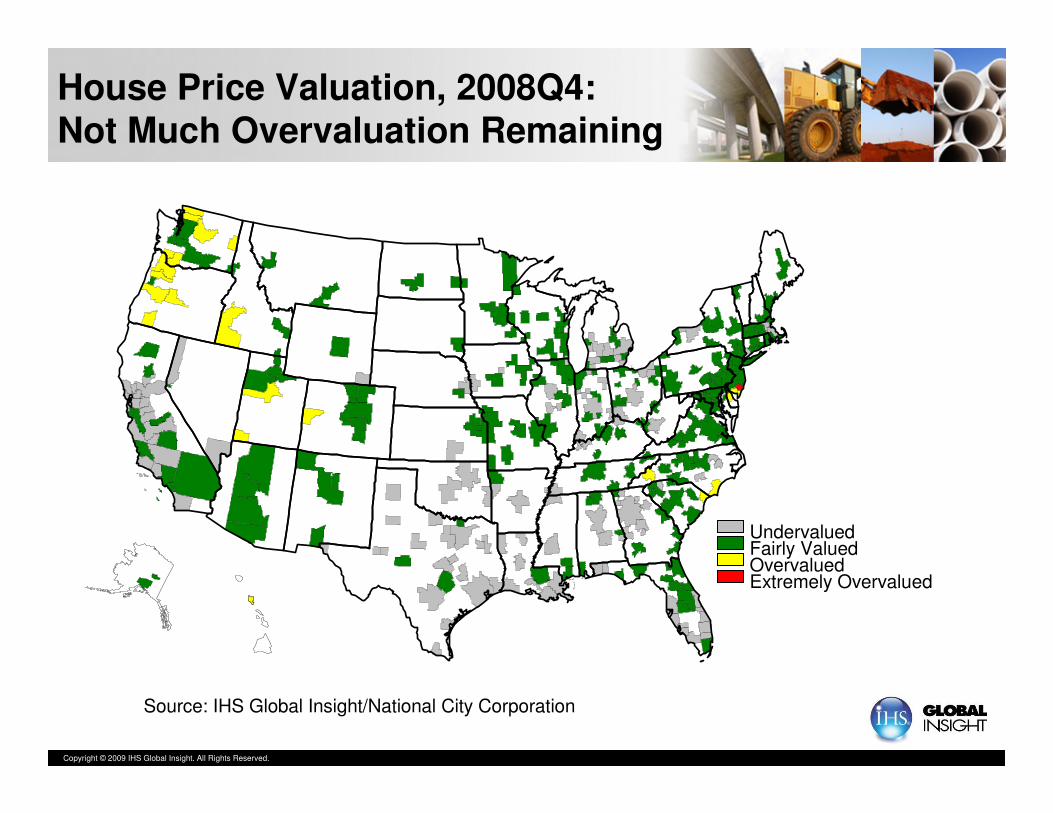
House Price Valuation, 2008Q4: Not Much Overvaluation Remaining
Source: IHS Global Insight/National City Corporation
UndervaluedFairly ValuedOvervaluedExtremely Overvalued

Copyright © 2009 IHS Global Insight. All Rights Reserved.
(Million units)
Housing Starts Near A Bottom:Prices Not Yet There
(Year/year percent change)
0.0
0.4
0.8
1.2
1.6
2.0
2.4
2001 2002 2003 2004 2005 2006 2007 2008 2009 2010 2011
-15
-10
-5
0
5
10
15
Housing Starts (Left scale) FHFA House Price Index (Right scale)

Copyright © 2009 IHS Global Insight. All Rights Reserved.
Architecture Billings LeadNonresidential Construction
* Source: American Institute of Architects
30
35
40
45
50
55
60
1996 1997 1998 1999 2000 2001 2002 2003 2004 2005 2006 2007 2008 2009
-30
-20
-10
0
10
20
30
Architecture Billings Index* (Left scale)
Real Nonresidential Construction, ex. utilities (Right scale, % change y/y)

Copyright © 2009 IHS Global Insight. All Rights Reserved.
(Percent change from a year earlier, real spending)
Business Capital Spending Cycle:Construction Lags
-30
-20
-10
0
10
20
1999 2000 2001 2002 2003 2004 2005 2006 2007 2008 2009 2010 2011
Software & Equipment Buildings

Copyright © 2009 IHS Global Insight. All Rights Reserved.
(Year-over-year percent change, 2000 dollars)
Housing and Nonresidential Cycles are Out of Sync
-30
-20
-10
0
10
20
30
1990 1992 1994 1996 1998 2000 2002 2004 2006 2008 2010 2012
Residential Structures Nonresidential Structures

Copyright © 2009 IHS Global Insight. All Rights Reserved.
Non-Residential Outlook by Structure Type
Highlights:
• Total Non-Residential still has a long way to go before hitting bottom
• Yet there is significant variation by structure
• Big winner is Healthcare
• Education, Communications, and Other are stable
• Biggest Losers are Office, Manufacturing, and Government Buildings 2011q1
2009q2
2010q1
2012q2
2010q2
-
2011q4
2010q3
2011q4
2010q3
2010q4
Trough Quarter
-22%100%$283.5Total Non-Residential
-12%7%$19.5Other 1
-27%4%$12.3Communications
-24%9%$25.0Government Buildings
-9%24%$68.8Educational Building
2% *12%$33.0Healthcare Building
-56%15%$42.5Manufacturing
-22%9%$26.3Retail Buildings
-56%7%$19.2Lodging
-64%9%$25.2Office
-33%29%$82.4Commercial
% Diff. From 2009q1
Share of Total
2009
(Millions of Constant 2000 Dollars, Put-in-Place)
(*) Healthcare growth is 2011q1 over 2009q1
(1) Other = Religious, Amusement, Conservation, and Recreation
Copyright © 2009 IHS Global Insight. All Rights Reserved.
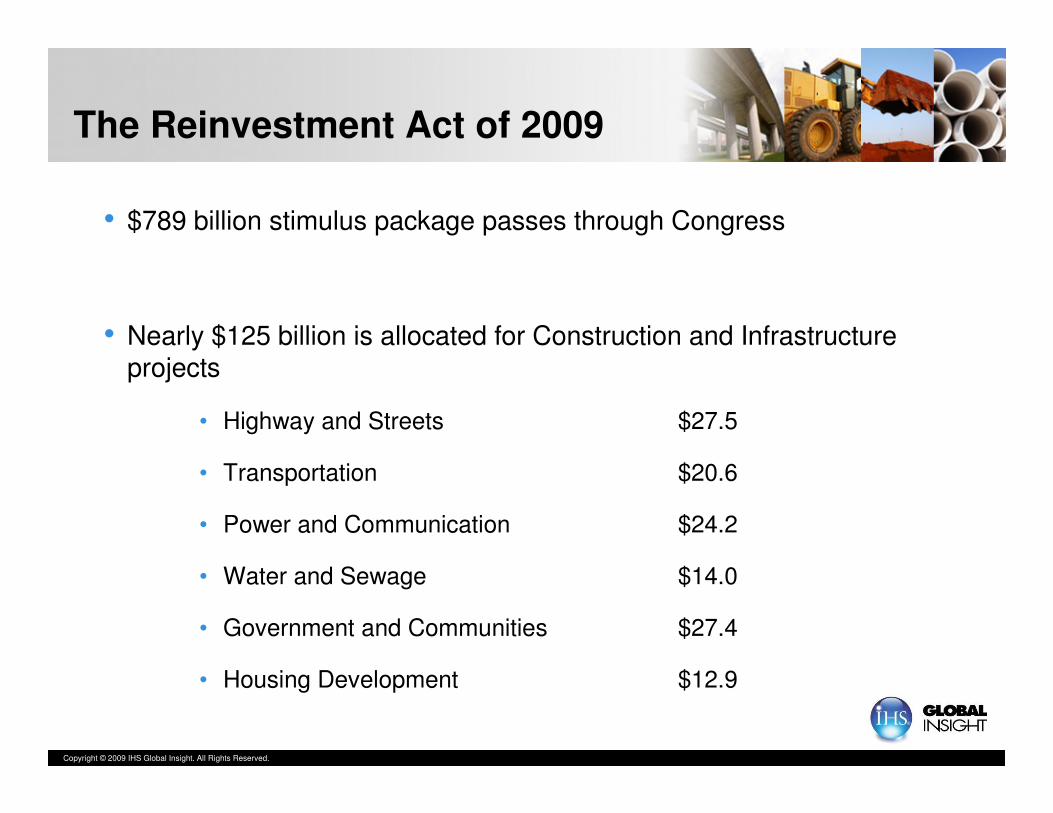
The Reinvestment Act of 2009
• $789 billion stimulus package passes through Congress
• Nearly $125 billion is allocated for Construction and Infrastructure projects
• Highway and Streets $27.5
• Transportation $20.6
• Power and Communication $24.2
• Water and Sewage $14.0
• Government and Communities $27.4
• Housing Development $12.9

Copyright © 2009 IHS Global Insight. All Rights Reserved.
Distribution of Stimulus Expenditure (Billions U.S.$)
0
50
100
150
2009 2010 2011 2012 2013 2014 2015 2016 2017 2018 2019
0
10
20
30
Cumulative Spend Annual Spend
Stimulus spending has biggest impact in 2010
Stimulus spending has biggest impact in 2010

Copyright © 2009 IHS Global Insight. All Rights Reserved.
Construction Outlook for“Vertical” Infrastructure
Federal spending on public buildings avoids worse decline
Federal spending on public buildings avoids worse decline
0
10
20
30
40
50
60
70
80
90
100
2004 2005 2006 2007 2008 2009 2010 2011 2012 2013 2014
Bil
lio
ns o
f U
S$
-5%
0%
5%
10%
% c
ha
ng
e
Total Infrastructure % change (right)

Copyright © 2009 IHS Global Insight. All Rights Reserved.
Construction Outlook for “Horizontal” Infrastructure
Federal spending plugs the gap in state and local funding for 2010 and 2011
Federal spending plugs the gap in state and local funding for 2010 and 2011
0
60
120
180
240
2004 2005 2006 2007 2008 2009 2010 2011 2012 2013 2014
Bil
lio
ns o
f U
S$
0%
4%
8%
12%
16%
% c
ha
ng
e
Total Infrastructure % change (right)

Copyright © 2009 IHS Global Insight. All Rights Reserved.
Bottom Line
• Free-fall ending
• Consumption and housing lead the upturn at first
• Business equipment spending revives before business construction —although construction equipment will see a different story
• Commercial and industrial construction sectors will be the worst hit and will not recover until 2011
• Institutional and infrastructure projects are better positioned
• Stimulus spending will be felt primarily in 2010 and 2011, wearing off thereafter
• In the medium to long term, regional growth will be strongest in the Southeast and Southwest, although short term dislocations in housing markets and state finances will limit the potential for key states (e.g. FL, CA)
