global and u.s. rice markets face tighter supplies in · pdf fileglobal and u.s. rice markets...
TRANSCRIPT
Global and U.S. Rice Markets Face Tighter Supplies in 2015/16
University of Arkansas Webinar SeriesNovember 19, 2015
Nathan Childs, Economic Research Service,
USDA
11.20.15

PART 1
THE 2015/16 GLOBAL RICE MARKET OUTLOOK

The 2015/16 Global Rice Market: Overview
• Global production is projected to decline 1 percent to 473.5 million tons (milled basis)…
• …with 2015/16 the second consecutive year of a smaller global crop.
• Total global rice supplies are expected to decline 1.5 percent in 2015/16, and would be the smallest since 2011/12.

The 2015/16 Global Rice Market: Global Production
• Largest production declines are projected for Thailand (‐12.5%), India (‐1.2%), and the United States (‐14.3%)—all three are major exporters.
• Crops are projected smaller in Cambodia (‐7.4%) and Burma (‐3.2%)—rising mid‐level exporters.
• Production is projected to decline in the other mid‐level exporters: Australia (‐10%), Argentina (‐12%), Egypt (‐12%), and Guyana (‐1 %), but to increase in Paraguay (+7%) and Uruguay (+4%).

The 2015/16 Global Rice Market: Global Production
• Among major importers, crops are projected smaller in the Philippines (‐3.5%) and Brazil (‐5.5%).
• But crops are projected to be up slightly in China (record), Indonesia, and Bangladesh (record), and up 16 percent in Sri Lanka (record).
• El Niño is major factor causing smaller crops in Southeast Asia.
• Impacts of El Niño are expected to continue into 2016 and could impact rice crops in South America.

Thailand’s rice production has declined 20 percent since 2013/14
2015/16 are forecasts. Source: Production, Supply, and Distributiondatabase, Foreign Agricultural Service, USDA, http://www.fas.usda.gov/psd.
Mil. tons Mil. Ha.

Global rice supplies are projected to decline for a second consecutive year
Milled basis. 2015/16 are forecasts. Source: Production, Supply, and Distribution database, Foreign Agricultural Service, USDA, http://www.fas.usda.gov/psd.
MIL. TONS

The 2015/16 Global Rice Market: Use, Stocks, and Prices
• At a record 486.2 million tons, consumption (including a residual) is up 1 percent from 2014/15 and exceeds production by 12.7 million tons.
• Ending stocks in 2015/16 are projected to drop 12 percent to 91.0 million tons, the lowest since 2007/08 and the third consecutive year of declining global ending stocks of rice.
• Despite tighter global ending stocks, global trading prices have shown no strength and are below levels at the start of 2015/16.

Global ending stocks in 2015/16are projected to decline 12 percent…
2015/16 are forecasts. Source: Production, Supply, and Distributiondatabase, Foreign Agricultural Service, USDA, http://www.fas.usda.gov/psd.
MILL. TONS PERCENT

… with ending stocks held by major rice exporters projected to decline 33 percent in 2015/16
MIL. TONS
These 5 countries account for about 85 percent of global exports. Milled basis. 2015/16 are forecasts. Source: Production, Supply, and Distribution database, Foreign Agricultural Service, USDA, http://www.fas.usda.gov/psd.

The Global Rice Trade: Calendar Year 2016
• Global trade in 2016 is projected to drop 1.5 percent to 41.9 million tons (milled basis), still the third highest on record.
• In 2016, weaker exports from Cambodia, Burma, India (down 2 million tons), and the United States…
• …are projected to more than offset stronger shipments from Argentina, Egypt, Pakistan, Thailand, and Vietnam.

The Global Rice Trade: Calendar Year 2016
• Nigeria (down 1.0 million tons) and Sri Lanka are projected to import less rice.
• China remains the number one importer, increasing purchases to a record 4.7 million tons.
• Bangladesh, Brazil, and Indonesia are projected to import more rice.
• Imports by Iran, Iraq, and Saudi Arabia are projected up slightly.
• The Philippines’ imports remain strong at a projected 1.8 million tons.

About 9 percent of global rice production is traded, double the share 25 year ago
2015 and 2016 are forecasts. Source: Production, Supply, and Distributiondatabase, Foreign Agricultural Service, USDA, http://www.fas.usda.gov/psd.
MILL. TONS PERCENT

India’s exports are projected to decline in 2016; Thailand, Vietnam, and Pakistan ’s to increase
2015 and 2016 forecasts.These 5 countries account for more than 80 percent of global rice exports. 2015 are forecasts. Source: Production, Supply, and Distribution database, Foreign Agricultural Service, USDA, http://www.fas.usda.gov/psd.
MIL. TONS Major Exporters

After a decade of expansion, Burma and Cambodia are projected to export less rice in 2016
2015 and 2016 are forecasts. Source: Production, Supply, and Distribution database, Foreign Agricultural Service, USDA, http://www.fas.usda.gov/psd.
1,000 TONS

China’s rice imports have risen sharply since 2012
2015 and 2016 are forecasts. Source: Production, Supply, and Distribution database, Foreign Agricultural Service, USDA, http://www.fas.usda.gov/psd.
MIL. TONS

China accounts for more than 11 percent of global rice imports
Milled basis. 2015 and 2016 are forecasts. Source: Production, Supply, and Distributiondatabase, Foreign Agricultural Service, USDA, http://www.fas.usda.gov/psd.
1,000 TONS
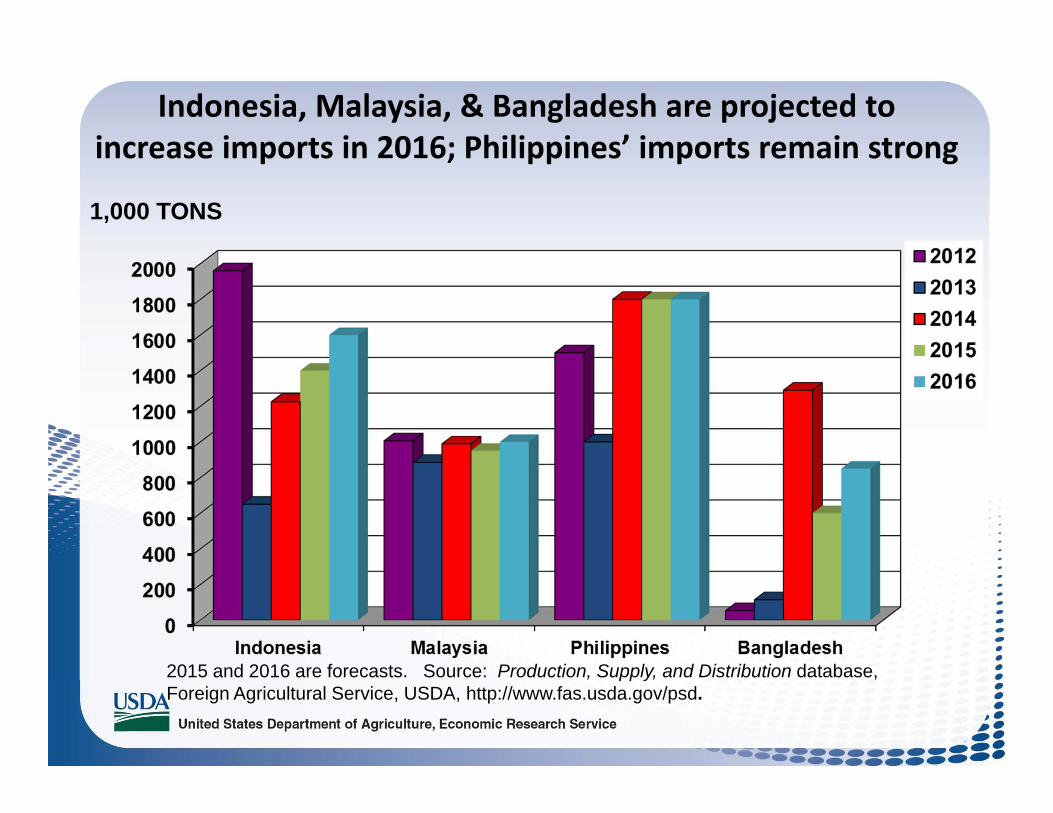
Indonesia, Malaysia, & Bangladesh are projected to increase imports in 2016; Philippines’ imports remain strong
2015 and 2016 are forecasts. Source: Production, Supply, and Distribution database, Foreign Agricultural Service, USDA, http://www.fas.usda.gov/psd.
1,000 TONS
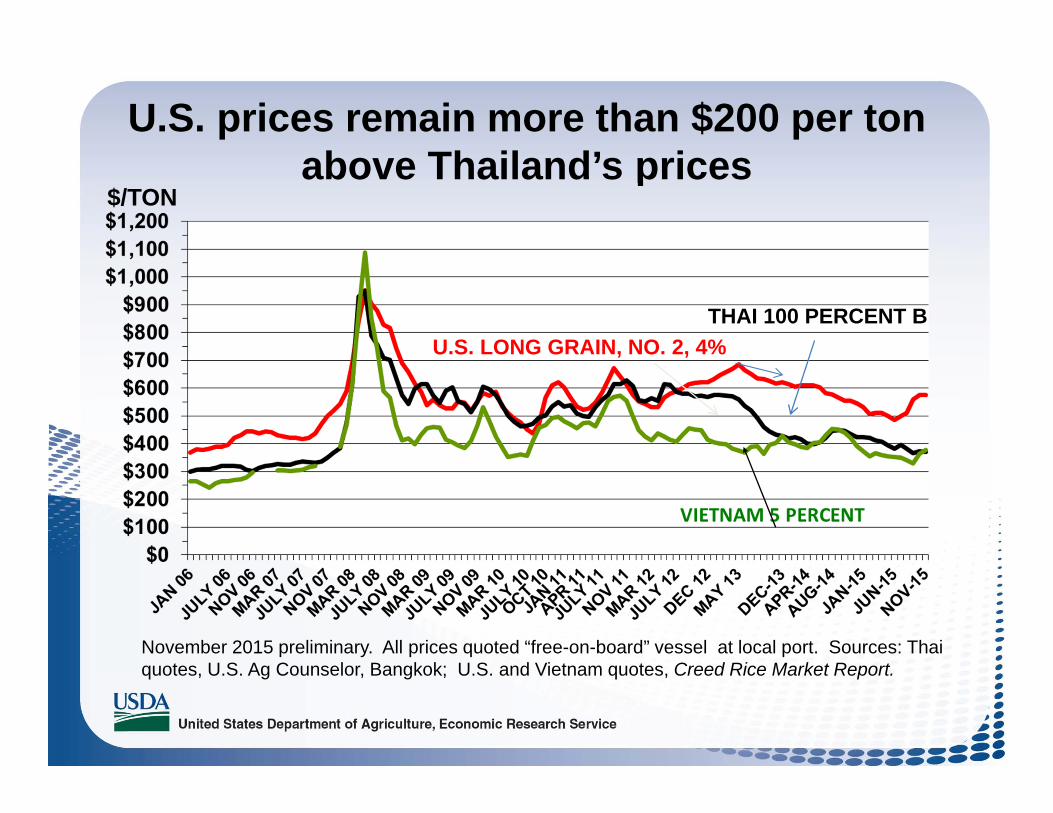
U.S. prices remain more than $200 per ton above Thailand’s prices
U.S. LONG GRAIN, NO. 2, 4%THAI 100 PERCENT B
November 2015 preliminary. All prices quoted “free-on-board” vessel at local port. Sources: Thai quotes, U.S. Ag Counselor, Bangkok; U.S. and Vietnam quotes, Creed Rice Market Report.
$/TON

PART 2
THE U.S. 2015/16 RICE MARKET OUTLOOK
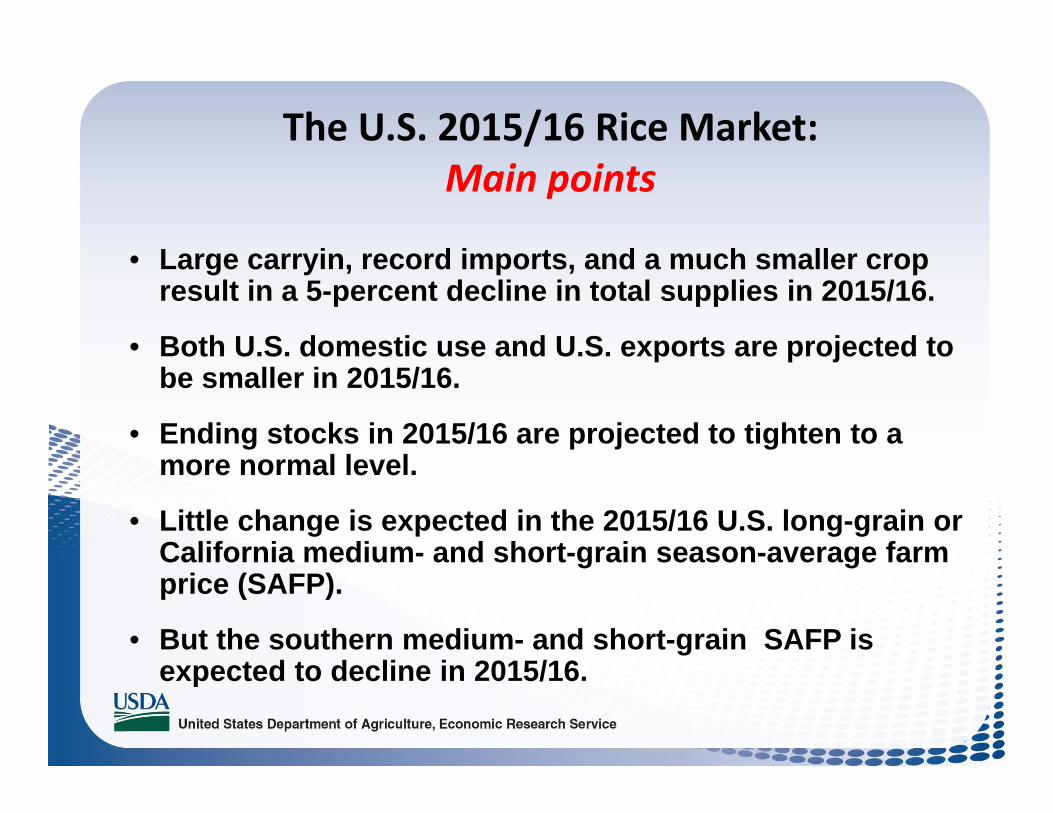
The U.S. 2015/16 Rice Market: Main points
• Large carryin, record imports, and a much smaller crop result in a 5-percent decline in total supplies in 2015/16.
• Both U.S. domestic use and U.S. exports are projected to be smaller in 2015/16.
• Ending stocks in 2015/16 are projected to tighten to a more normal level.
• Little change is expected in the 2015/16 U.S. long-grain or California medium- and short-grain season-average farm price (SAFP).
• But the southern medium- and short-grain SAFP is expected to decline in 2015/16.

Smaller plantings pulled U.S. rice production down 14 percent in 2015/16…
Rough basis. 2015/16 are forecasts. Source: World Agricultural Supply and Use Estimates, WAOB, USDA..
MILL. CWT MILL. ACRES

…with production in 2015 smaller in all reported States
2015 are forecasts. Source: Prospective Plantings, March 2015, National Agricultural Statistics Service, USDA.

U.S. rice imports in 2015/16 are projected record high
2015/16 are forecasts. 1/ Rough basis. 2/ Does not include seed use.Source: World Agricultural Supply and Use Estimates, WAOB, USDA.
MILL. CWT PERCENT

Despite a larger carryin, U.S. rice supplies are projected to decline 5 percent in 2015/16
Mill. CWT

Both U.S exports and domestic use are projected to be slightly smaller in 2015/16…
Rough-rice basis. 2015/16 are forecasts. Sources: World Agricultural Supply and Use Estimates, WAOB, USDA.
MILL. CWT

…With both milled‐rice and rough‐rice exports projected smaller in 2015/16
Rough basis. 2015/16 are forecasts. Source: World Agricultural Supply and Use Estimates, WAOB, USDA.
MILL. CWT

Long‐grain accounts for all of the projected decline in U.S. rice exports in 2015/16
Rough basis. 2015/16 are forecasts. Source: World Agricultural Supply and Use Estimates, WAOB, USDA.
MILL. CWT

Through November 12, 2015, U.S. commercial exports were 55 percent ahead of a year earlier
Does not include donations. Source: U.S. Export Sales, Foreign Agricultural Service, U.S. Department of Agriculture, http://apps.fas.usda.gov/export-sales/esrd1.html

With sales and shipments well ahead of a year earlier to…
Source: U.S. Export Sales, Foreign Agricultural Service, U.S. Department of Agriculture, http://apps.fas.usda.gov/export-sales/esrd1.html
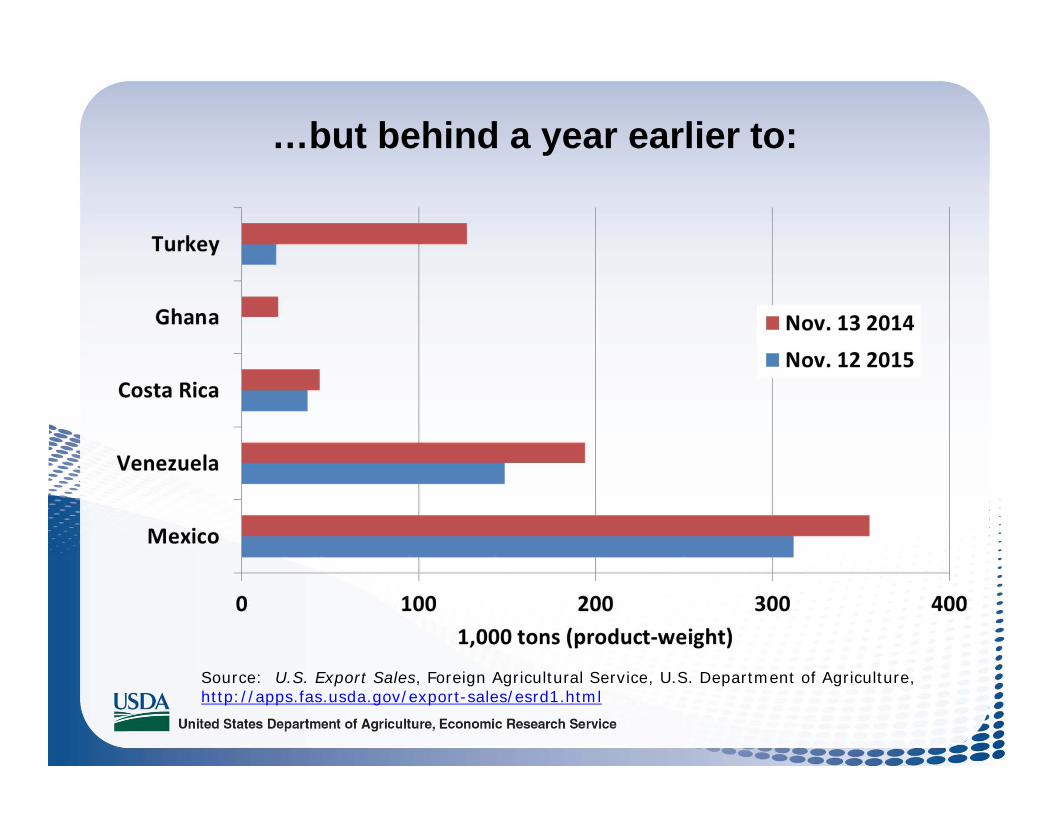
…but behind a year earlier to:
Source: U.S. Export Sales, Foreign Agricultural Service, U.S. Department of Agriculture, http://apps.fas.usda.gov/export-sales/esrd1.html

U.S. all‐rice ending stocks are projected to decrease 18 percent in 2015/16
Rough basis. 2015/16 are forecasts. Source: World Agricultural Supply and Use Estimates, WAOB, USDA..
MILL. CWT PERCENT

Little change is projected in U.S. season‐average farm prices in 2015/16
2015/16 forecasts. Source: Quick Stats, NASS, USDA, http://quickstats.nass.usda.gov/ .
$/CWT

However, the southern medium‐ and short‐grain SAFP price is projected to decline in 2015/16 1/
1/ Season-average rough-rice for medium- and short-grain rice first reported by region for the 2008/09 market year. 2/ October-September market year. 3/ August-July market year. Source: Quick Stats data base, NASS, USDA. http://www.nass.usda.gov/Quick_Stats/ .
$/CWT
Market years 2/

U.S. long‐grain rough‐rice prices increased in September
All prices are full month. 1/ Monthly U.S. cash price for all-rice reported by NASS. 2/ Monthly rough-rice prices by class first reported August 2008.. Source: Quick Stats, NASS, USDA, http://quickstats.nass.usda.gov/ .
$/CWT

The California medium- and short-grain price difference has increased since July 1/
All prices are full month. 1/ Monthly U.S. cash price for medium- and short-grain rice first reported by region for 2013/14 market year. 2/ Arkansas, Louisiana, Mississippi, Missouri, and Texas. Source: Quick Stats, NASS, USDA, http://quickstats.nass.usda.gov/ .
$/CWT

For More Information,Please Go To:
• The Economic Research Service Home Pagehttp:// www.ers.usda.gov
• The Rice Topics Page http://www.ers.usda.gov/topics/crops/rice.aspx