global analysis of polysome-associated mrna in vesicular
TRANSCRIPT

RESEARCH ARTICLE
Global analysis of polysome-associated mRNA
in vesicular stomatitis virus infected cells
William J. Neidermyer, Jr., Sean P. J. WhelanID*
Department of Microbiology & Immunobiology, Program in Virology, Harvard Medical School, Boston,
Massachusetts, United States of America
Abstract
Infection of mammalian cells with vesicular stomatitis virus (VSV) results in the inhibition of
cellular translation while viral translation proceeds efficiently. VSV RNA synthesis occurs
entirely within the cytoplasm, where during transcription the viral polymerase produces 5
mRNAs that are structurally indistinct to cellular mRNAs with respect to their 50 cap-structure
and 30-polyadenylate tail. Using the global approach of massively parallel sequencing of
total cytoplasmic, monosome- and polysome-associated mRNA, we interrogate the impact
of VSV infection of HeLa cells on translation. Analysis of sequence reads in the different
fractions shows >60% of total cytoplasmic and polysome-associated reads map to the 5
viral genes by 6 hours post-infection, a time point at which robust host cell translational shut-
off is observed. Consistent with an overwhelming abundance of viral mRNA in the polysome
fraction, the reads mapping to cellular genes were reduced. The cellular mRNAs that remain
most polysome-associated following infection had longer half-lives, were typically larger,
and were more AU rich, features that are shared with the viral mRNAs. Several of those
mRNAs encode proteins known to positively affect viral replication, and using chemical inhi-
bition and siRNA depletion we confirm that the host chaperone heat shock protein 90
(hsp90) and eukaryotic translation initiation factor 3A (eIF3A)—encoded by 2 such mRNAs
—support viral replication. Correspondingly, regulated in development and DNA damage 1
(Redd1) encoded by a host mRNA with reduced polysome association inhibits viral infec-
tion. These data underscore the importance of viral mRNA abundance in the shut-off of host
translation in VSV infected cells and link the differential translatability of some cellular
mRNAs with pro- or antiviral function.
Author summary
Viruses co-opt the host translational machinery and frequently suppress host cell protein
synthesis. Many positive-strand RNA viruses manipulate initiation factors while bypass-
ing their need for viral protein production using internal ribosome entry sites. Negative-
strand RNA viruses and DNA viruses produce mRNAs that contain host-like 50 cap-struc-
tures and 30 polyadenylate tails. Those similarities necessitate a different mechanism for
controlling viral versus host protein synthesis. We infected cells with vesicular stomatitis
PLOS Pathogens | https://doi.org/10.1371/journal.ppat.1007875 June 21, 2019 1 / 27
a1111111111
a1111111111
a1111111111
a1111111111
a1111111111
OPEN ACCESS
Citation: Neidermyer WJ, Jr., Whelan SPJ (2019)
Global analysis of polysome-associated mRNA in
vesicular stomatitis virus infected cells. PLoS
Pathog 15(6): e1007875. https://doi.org/10.1371/
journal.ppat.1007875
Editor: Peter Sarnow, Stanford University, UNITED
STATES
Received: August 22, 2018
Accepted: May 27, 2019
Published: June 21, 2019
Copyright: © 2019 Neidermyer, Whelan. This is an
open access article distributed under the terms of
the Creative Commons Attribution License, which
permits unrestricted use, distribution, and
reproduction in any medium, provided the original
author and source are credited.
Data Availability Statement: Raw sequence data
in support of the conclusions of this study are
available from the NCBI Sequence Read Archive
(SRA) under the accession code SRP158625. All
other relevant data are within the manuscript and
its Supporting Information files.
Funding: This work was funded by the National
Institutes of Health grant R37 AI059371 to SPJW.
The funders had no role in study design, data
collection and analysis, decision to publish, or
preparation of the manuscript.

virus and sequenced polysome-associated mRNAs at 2 and 6 hours post-infection provid-
ing 2 snapshots of how infection alters translation. We present evidence that the 5 viral
mRNAs outcompete cellular mRNAs for ribosomes and demonstrate that individual host
mRNAs vary in the extent to which their polysome association is altered by infection.
Host mRNAs that are more abundant, have longer half-lives, greater than average length,
and a similar AU content to the viral mRNAs were more likely to be enriched among
polysome-associated cellular mRNAs. Several of the enriched mRNAs encode proteins
that promote viral replication, whereas mRNAs that exhibit the largest decrease in poly-
some association include those that encode antiviral functions.
Introduction
Infection of mammalian cells by vesicular stomatitis virus (VSV) results in a profound shut-off
of host cell gene expression. This host cell shut-off occurs at the level of mRNA transcription
through inhibition of RNA polymerase II by the viral-encoded matrix protein (M) [1–3]. The
M protein also forms a complex with ribonucleic acid export 1 (Rae1) and nucleoporin 98
(Nup98) [4] thus suppressing host cell mRNP export from the nucleus, including that of
mature cellular mRNAs [5–8]. VSV infection also inhibits protein synthesis by manipulation
of the host-cell translation machinery, particularly at the level of translation initiation [9, 10].
Eukaryotic initiation factor 4E (eIF4E)—the rate limiting factor for translation initiation—rec-
ognizes the 7mGpppN mRNA cap structure as part of the eIF4F complex, and in concert with
other translation initiation factors facilitates the recruitment of the small 40S ribosomal sub-
unit to the mRNA prior to scanning to the initiating methionine where the 60S subunit joins
[11, 12]. VSV infection results in the rapid dephosphorylation of eIF4E itself, for which the
functional consequences are unclear, and of its binding protein (eIF4E-BP1) leading to eIF4E
sequestration and the suppression of translation initiation [9, 10].
Viral gene expression evades the shut-off mechanisms employed to suppress host gene
expression. As VSV RNA synthesis occurs entirely within the cytoplasm, viral RNA synthesis
is not subject to the inhibitory effects of M on RNA polymerase II and mRNA export from the
nucleus. The VSV RNA synthesis machinery comprises a ribonucleoprotein complex of the
negative-sense genomic RNA completely encased by a nucleocapsid protein (N) sheath and
associated with the viral polymerase complex [13]. The viral transcriptase copies the N-RNA
template into 5 monocistronic mRNAs that are structurally indistinct to those of the host-cell
with respect to their 50 cap and 30 polyadenylate tail [14–20]. The enzymes necessary for
mRNA synthesis, namely an RNA dependent RNA polymerase (RdRp) and a set of capping
enzymes, reside within the viral large protein (L) [17, 19, 21–27]. VSV L protein cannot engage
the N-RNA template directly, but instead depends on the viral phoshoprotein (P) to facilitate
the interaction [28–33]. Messenger RNA polyadenylation is also catalyzed by L through reiter-
ative transcription by the RdRp of a U7 tract that resides at the end of each gene [34–38]. This
program of viral transcription results in the cytoplasmic synthesis of 5 mRNAs that depend
upon the host machinery for their translation, and must therefore avoid the shut-down mecha-
nisms that effectively suppress host mRNA translation.
Metabolic labeling studies demonstrate that 4 hours post VSV infection of baby hamster
kidney cells in culture, total translation is suppressed to about 65% the level of uninfected con-
trols [39]. Extraction of mRNA from infected cells coupled with its in vitro translation con-
firmed that the cellular mRNAs remain intact and are competent for translation [39]. The
VSV mRNAs are present in an approximately 2–3 fold excess of the total cellular mRNA,
Control of VSV protein synthesis
PLOS Pathogens | https://doi.org/10.1371/journal.ppat.1007875 June 21, 2019 2 / 27
Competing interests: The authors have declared
that no competing interests exist.

leading to the model that competition between viral and cellular mRNAs for ribosomes results
in the dominance of viral translation [39, 40]. Polysome analysis also demonstrates that the cel-
lular mRNAs are associated with significantly fewer ribosomes in infected cells [39]. For exam-
ple, infection results in the movement of actin mRNA from polysomes containing 12 or more
ribosomes to those containing 5 [39]. This movement reflects the competition between viral
and cellular mRNA for ribosomes and the limited pool of eIF4E.
The competition model predicts that the kinetics of viral mRNA synthesis and the levels of
viral mRNA should correlate closely with host shut-off. Tests of this prediction yielded conflict-
ing results. The kinetics of host shut-off and viral mRNA accumulation correlate well for many
strains of VSV, consistent with the competition model [39, 40]. Inhibition of host protein syn-
thesis is, however, largely unaffected following coinfection of cells with increasing quantities of
defective interfering (DI) particles that suppress viral mRNA levels up to 14-fold [41]. A similar
result was obtained for a VSV mutant that is restricted for genome replication at 39˚C, and
yields only 30% of the wild type levels of viral mRNA [41]. Collectively, these studies suggest
additional mechanisms may contribute to the shut-off of host cell protein synthesis.
Specific features of the viral mRNAs that contribute to their efficient translation have not
been defined. The 50 untranslated regions of VSV mRNAs are short, being 10–15 nucleotides
for the viral N, P and L mRNAs that encode the proteins required for RNA replication [42,
43]. How such short 50 UTRs serve as effective initiators of translation is unclear. Evidence for
differential translation of viral mRNA comes from small interfering RNA suppression of
eIF4E, which inhibits host gene expression but has no impact on viral gene expression [44].
Viral translation is also hypersensitive to the loss of ribosomal protein L40, suggesting different
mRNA features facilitate translation of viral versus host mRNA [45]. Flanking cellular or
reporter genes by the conserved viral 10-nt gene-start and 13-nt gene-end sequences, and
inserting them into the viral genome is sufficient to mediate their efficient translation [46]. By
contrast, expression of the same genes following transfection of plasmid DNA into cells and
subsequent VSV infection does not offer this translational advantage [46]. Thus, transcription
of the mRNAs from the viral genome appears to contribute to their efficient translation.
In the present study, we interrogate global mRNA translation in VSV infected cells using
RNAseq analysis of the cytoplasmic mRNA transcriptome, and parallel sequencing of poly-
some-associated mRNAs. We obtain support for the model that an overabundance of viral
mRNA contributes to host shut-off by leading to a re-distribution of cellular ribosomes onto
viral mRNA. By combining this RNAseq analysis with examining the distribution of specific
viral and cellular mRNAs within polysomes, we also demonstrate that mRNAs shift to smaller
polysomes. Analysis of cellular mRNAs less-sensitive to this global shut-down of translation
identifies several host proteins that promote viral replication. Similar analyses revealed the
abundance of viral mRNA contributes to the host-cell shut-off for other viruses including
coronaviruses, influenza and vaccinia [47–49].
Results
Viral mRNA comprises 60% of the cytoplasmic mRNA at 6 hours post-
infection
To interrogate the impact of VSV infection on global translation we isolated total cytoplasmic,
monosome- and polysome-associated mRNA from HeLa cells at 2 and 6 hpi and compared
the relative sequence reads obtained by deep-sequencing (Fig 1A). Statistical analysis of
sequencing reads between biological replicates from each fraction yields a Pearson correlation
of>0.97 for cytoplasmic, monosome- and polysome-associated mRNA pools validating repro-
ducibility between the replicates.
Control of VSV protein synthesis
PLOS Pathogens | https://doi.org/10.1371/journal.ppat.1007875 June 21, 2019 3 / 27

Control of VSV protein synthesis
PLOS Pathogens | https://doi.org/10.1371/journal.ppat.1007875 June 21, 2019 4 / 27

As visible in the polysome profiles (Fig 1B), VSV infection results in a small but reproduc-
ible increase in the pool of monosomes and large polysomes at 2 hpi, and a collapse of large
polysomes and an increase in monosomes by 6 hpi. Mapping of the sequence reads to the viral
and host genome highlights that by 6 hpi>60% of the total reads in the cytoplasmic and poly-
some fractions are viral (Fig 1C). This increase from the<1% observed at 2 hpi (Fig 1C)
emphasizes the impact of the exponential phase of viral RNA replication and secondary tran-
scription of the viral genome on mRNA production. The viral sequence reads map to all 5
genes, with clear dips in coverage at gene-junctions (S1 Fig). Consistent with the order of tran-
scription of the viral genome and the localized transcriptional attenuation at gene-junctions
[50–53], the relative reads that map to each viral gene generally diminish with distance from
the single 30 promoter (Fig 1D and S1 Fig).
Analysis of the sequencing reads that map to cellular genes supports that like the viral
mRNAs, the level of reads in the polysome fraction mirrors that in the total cytoplasmic frac-
tion at 2 and 6 hpi (Fig 1C). This result demonstrates that the majority of mRNAs are poly-
some-associated in proportion to their abundance. The abundance of the 5 viral mRNAs at 6
hpi supports the model that viral mRNAs outcompete cellular mRNAs for ribosomes [39]. We
note that viral mRNAs are, however, underrepresented (49%) and cellular mRNAs overrepre-
sented (51%) in the monosome fraction at 6 hpi, compared to their cytoplasmic abundance
(Fig 1C). This finding is consistent with a differential effect on viral versus host mRNA
translation.
The relative abundance of individual cellular mRNAs in the cytoplasm and
on polysomes decreases between 2 and 6 hpi
To determine how VSV infection affects the distribution of the population of mRNAs between
total cytoplasmic, monosome or polysome fractions, we plotted the transcript per million
(TPM) for each individual mRNA mapped to the human and viral genome in all 3 fractions
(Fig 2). At 2 hpi, reads that map to the viral genes in each fraction are similar in abundance to
those reads that map to highly expressed cellular genes (Fig 2A). The reads that map to any
given cellular gene alter within a relatively narrow range, with few genes showing a greater
than 2-fold change in the relative number of sequence reads (Fig 2B). For the population of
mRNAs, the relative reads obtained from the polysome fraction mirrored the relative reads in
the total cytoplasmic fraction, consistent with the abundance of an mRNA being a determinant
of its translatability.
By 6 hpi, reads that map to each of the 5 viral genes—with the exception of L—exceed the
reads that map to any individual cellular gene (Fig 2C, red triangles). This is concurrent with a
decrease in reads that map to the majority of cellular genes in cytoplasmic, monosome and
polysome-associated fractions (Fig 2C). There were, however, some distinctions between the
monosome and polysome fractions. For the majority of the population of cellular mRNAs,
Fig 1. Viral mRNA comprises 60% of the cytoplasmic mRNA at 6 hours post-infection. (A) Schematic of
experimental design. HeLa cells were infected with VSV at a MOI of 10 and cytoplasmic extracts were prepared at 2
and 6 hpi for mRNA isolation and polysome profiling. Messenger RNA was isolated from fractions corresponding to
80S monosomes, or polysomes containing 3 or more ribosomes, and used for deep sequencing. (B) Polysome analysis
of uninfected (black) or VSV (red) infected HeLa cells. Cytoplasmic extracts were sedimented through a 10–50%
sucrose gradient and 0.5 ml fractions were collected while continuously monitoring absorbance at λ = 254nm. (C)
Distribution of fragments mapping to the concatenated hg38 (human) and VSV genomes for cytoplasmic, monosome,
and polysome samples at 2 and 6 hpi. Trimming and mapping was performed in CLC Genomics Workbench. (D)
Distribution of reads among the 5 viral genes at 2 and 6 hpi. Expression level is presented as Transcripts per Kilobase
Million (TPM) to normalize for gene length and library size, error bars denote standard deviation from two biological
replicates.
https://doi.org/10.1371/journal.ppat.1007875.g001
Control of VSV protein synthesis
PLOS Pathogens | https://doi.org/10.1371/journal.ppat.1007875 June 21, 2019 5 / 27

reads were most reduced in the polysome fraction compared to the total cytoplasmic fraction
(Fig 2D). A smaller reduction in reads was observed in the monosome fraction, and some cel-
lular mRNAs even showed an increase in reads compared to the total cytoplasmic fraction (Fig
2C). This may reflect differences in the movement of cellular mRNAs from large polysomes to
monosomes or out of the pool of translating ribosomes.
Polysome association remains directly proportional to cytoplasmic
abundance for cellular mRNAs at 6 hpi
We next mined our sequence data for evidence of differential translation of cellular mRNAs
following VSV infection. For this analysis we divided the polysome TPM by the total cyto-
plasmic TPM as an indicator of the efficiency with which any given mRNA is translated. We
also performed a similar analysis for the monosome pool. We are cognizant of the fact that
such ratios ignore the movement of any given mRNA from larger to smaller polysomes, and
will likely represent an underestimate of the extent of any translational regulation. To identify
the subset of the population of cellular mRNAs with the highest probability for translational
regulation in infected cells, we plotted the fold change in TPM at 2 and 6 hpi (Fig 3A–3D). At
2 hpi the monosome or polysome-associated reads changed within a narrow range for the
majority of cellular genes (Fig 3A). The marked shut-off of host protein synthesis observed by
Fig 2. The relative abundance of individual cellular mRNAs in the cytoplasm and on polysomes decreases between 2 and 6 hpi. (A) Scatter plots of Transcripts
per Kilobase Million (TPM) for exonic regions at 2 hpi. The TPM in uninfected cells for a given mRNA is graphed on the abscissa, and the TPM for a given cellular
mRNA in either uninfected (black circles), or VSV infected cells (gray circles) is graphed on the ordinate. The viral mRNAs are indicated by the red triangles. (B)
Density plots of the log2 fold change in TPM for cellular mRNAs between uninfected or VSV infected cells at 2 hpi. C, M, and P denote “cytoplasm”, “monosome”,
and “polysome”, respectively. (C) Scatter plots of TPMs for individual mRNAs at 6 hpi, presented as in A. (D) Density plots of the log2 fold change in TPM at 6 hpi,
presented as in B.
https://doi.org/10.1371/journal.ppat.1007875.g002
Control of VSV protein synthesis
PLOS Pathogens | https://doi.org/10.1371/journal.ppat.1007875 June 21, 2019 6 / 27

metabolic labeling suggests that at 6 hpi the association of cellular mRNA with polyribosomes
would alter significantly at the population level. Although we observe a global reduction in
polysome-associated reads for the bulk of the population of cellular mRNAs the reduction is
less than 2–3 fold. Accompanying this global reduction in polysome-associated reads, we also
observe an increase in monosome-associated reads with more than half the mRNAs within the
population exhibiting a >2-fold increase (Fig 3B and 3D). From the above ratios we selected
the subset of cellular mRNAs that exhibit the largest changes in relative polysome-associated
reads at 6 hpi to determine whether those mRNAs shared any common features. For this pur-
pose, we selected those mRNAs that change >2 standard deviations of the mean and thus
exceed the 95% confidence interval. This analysis identified 364 cellular mRNAs as candidates
for translational upregulation and 138 cellular mRNAs as candidates for translational downre-
gulation following VSV infection (Fig 3B and 3D). Consistent with monosome and polysome-
associated reads at 2 hpi changing within a narrow range, only 4 genes with increased and 20
Fig 3. Changes in monosome and polysome association of cellular mRNAs following VSV infection. (A) Density plots show the log2 fold change for any given
mRNA in both monosome and polysome fractions at 2 hpi. The region of the density within the 95% confidence interval of the mean is shaded gray. Magenta lines
denote ± 2 standard deviations of the mean. Regions with increased association relative to the mean are shaded blue, and regions with decreased association are
shaded green. (B) Analysis at 6 hpi, presented as in A. Downstream analyses were performed on genes in the green or blue regions. (C) Plots of log2 fold changes in
association at 2 hpi plotted against cytoplasmic abundance in infected cells. Magenta lines denote ± 2 standard deviations of the mean log2 fold change. Genes outside
the 95% confidence interval are denoted by blue (increased) or green (decreased) dots. (D) The log2 fold changes in association at 6 hpi as presented in C. (E) Gene
ontology analysis for mRNAs with increased polysome association, analysis was performed using GOseq in R. The pie charts shown represent the distribution of
mRNA among the 20 most significant GO Terms. (F) Gene ontology analysis for mRNAs with decreased polysome association as determined using GOseq in R.
https://doi.org/10.1371/journal.ppat.1007875.g003
Control of VSV protein synthesis
PLOS Pathogens | https://doi.org/10.1371/journal.ppat.1007875 June 21, 2019 7 / 27

with decreased polysome association, overlap between 2 and 6 hpi (Fig 3C and 3D). Within
the monosome fraction 8 genes with increased and 6 with decreased monosome association
overlap from 2 to 6 hpi.
Cellular mRNAs that exhibit evidence of positive translational regulation
are AU-rich and longer
We next determined whether shared functional or sequence elements are present within the
specific subsets of 364 mRNAs with increased polysome association, or the 138 mRNAs with
decreased polysome association (Fig 3B and 3D, blue and green dots). For the 364 genes with
significantly increased polysome-associated reads, gene ontology analysis identifies functions
in RNA binding, helicase and NTPase activities, among others (Fig 3E and S3 Dataset). The
138 genes with decreased polysome-associated reads are associated with cellular responses to
stimuli and signaling activities (Fig 3F and S3 Dataset). This gene ontology analysis reveals
that the up and down regulated transcripts comprise distinct functional groups.
At 6 hpi the cytoplasmic abundance of cellular mRNAs correlates with their polysome asso-
ciation at 6 hpi (Fig 4A and 4B), consistent with mRNA abundance being a determinant of
translatability. As described above, we use as an indicator of translation efficiency (TE) of an
mRNA the ratio of polysome to total cytoplasmic associated reads. To determine whether
there are shared features between the 364 mRNAs with evidence of enhanced polysome associ-
ation or the 138 with reduced polysome association, we extracted mRNA sequences and anno-
tations from the UCSC Genome Browser. Assisted by published datasets we examined
whether the half-life, size, GC content or poly(A) tail length correlate with increased or
decreased polysome association (Fig 4C–4F and S2 Fig) [54, 55]. Cellular mRNAs with
increased polysome-associated reads tended to have a longer half-life, were typically larger,
and were more AU-rich (Fig 4C–4E and S2 Fig). Correspondingly, those with decreased poly-
some-associated reads tended to have shorter half-lives, higher GC content, and were typically
smaller. The correlation between higher AU content and increased polysome-associated reads
was most evident for the coding region and 30 UTR (S2 Fig). The effect of length was predomi-
nantly a determinant of the ORF and not the 50 or 30 UTR (S2 Fig). There was no correlation
between poly(A) tail length and polysome-associated reads at 6 hpi (Fig 4F). This analysis
highlights that the cellular mRNAs that exceed the 95% confidence interval for increased poly-
some-associated reads in response to VSV infection are most similar to the viral mRNAs in
that they are typically longer and more AU rich.
Extent of polysome association of some cellular mRNAs correlates with
pro- or antiviral protein function
We next examined whether cellular mRNAs that exhibit increased polysome association
encode proteins that are pro- or antiviral. Among the 364 cellular mRNAs with increased poly-
some association several encode known proviral factors including the heat shock proteins
(HSP) 90, 70, and 60. Previous work demonstrated that inhibition of HSP90 inhibits viral rep-
lication, and linked inhibition of those chaperones to defects in L protein folding [56–58]. We
independently verified the proviral function of HSP90 using the inhibitor 17-[2-(Dimethyla-
mino)ethyl]amino-17-desmethoxygeldanamycin (17-DMAG) [59, 60]. Infection of HeLa cells
with VSV that expresses eGFP as a marker of infection demonstrates that 17-DMAG has no
effect on the fraction of cells infected, but slows the rate of eGFP expression (Fig 5A and S3
Fig). This was not simply due to defects in eGFP folding, as metabolic labeling of viral RNA
substantiates the defect in gene expression (S3 Fig).
Control of VSV protein synthesis
PLOS Pathogens | https://doi.org/10.1371/journal.ppat.1007875 June 21, 2019 8 / 27

Control of VSV protein synthesis
PLOS Pathogens | https://doi.org/10.1371/journal.ppat.1007875 June 21, 2019 9 / 27

We also found that polysome association of the mRNA encoding eukaryotic initiation factor
3 subunit A (eIF3a), increases after infection. To test whether this reflects a specific proviral
function of eIF3a, we used siRNA depletion to reduce eIF3a and measured viral gene expression
using reporter viruses expressing eGFP or luciferase. Both reporter viruses displayed a sensitiv-
ity to the loss of eIF3a (Figs 5B and S3). As expected, depletion of eIF3a also reduced cellular
translation in uninfected cells, but that reduction was modest as evidenced by expression of a
CMV promoter driven renilla luciferase reporter (Fig 5B). Translation of the CMV driven
reporter, however, reflects the accumulated steady-state levels of luciferase mRNA. We therefore
measured the effect of eIF3a depletion on viral vs host translation by metabolic incorporation of
[35S]-methionine in infected and uninfected cells (Fig 5B). Following eIF3a depletion we
observed a 55% reduction in viral M protein synthesis over a 30 minute time period, which is
similar to the 56% reduction in host protein synthesis measured in mock infected cells. This
analysis supports a proviral role for 2 cellular mRNAs that encode proteins with important
house-keeping functions that remain polysome-associated following VSV infection.
Among the 138 cellular mRNAs that exhibit reduced polysome association following infec-
tion was DNA-damage inducible transcript 4 (DDIT4) which encodes regulated in develop-
ment and DNA-damage response 1 (Redd1) [61–63]. Existing studies demonstrate that
DDIT4/Redd1 restricts the replication of negative-strand RNA viruses, including VSV. Deple-
tion of DDIT4/Redd1 by siRNA increased viral gene expression as evidenced from infection of
cells with VSV-eGFP, and by metabolic labeling of viral protein synthesis (Fig 5C, S3 Fig).
Consistent with the enhancement of viral gene expression following DDIT4 depletion, we
obtained an approximately 10-fold increase in viral titers (Fig 5C). Depletion of DDIT4/Redd1
also increases cellular protein synthesis likely reflecting its role as a negative regulator of
mTOR (Fig 5C and S3 Fig).
The above analysis supports that the polysome association of some host mRNAs following
VSV infection correlates with their pro- or antiviral functions, but does not directly demon-
strate that the level of polysome association is associated with a change in synthesis of the cor-
responding protein. To independently examine whether changes in polysome association of
host mRNAs affect synthesis of the corresponding protein we selected the heat shock protein
(HSP70) and Y-box binding protein 1 (YBX1) as representative mRNAs with increased and
decreased polysome association, respectively. We selected those mRNAs based on their high-
levels of expression, stability, and availability of antibodies suitable for the selective immuno-
precipitation of the corresponding protein. We compared the effect of VSV infection on pro-
tein synthesis by selective immunoprecipitation of proteins following metabolic incorporation
of [35S]-methionine from 3–6 hours post infection (Fig 5D). Synthesis of HSP70 3–6 hpi is
indistinguishable to that synthesized during a 3h period from mock infected cells (Fig 5D). By
contrast, YBX1 synthesis decreases more than two-fold (Fig 5D). This result confirms for 2 cel-
lular mRNAs that the extent of polysome association observed by our RNAseq analysis is
reflected in synthesis of the corresponding host proteins.
Fig 4. Polysome-associated cellular mRNAs are longer and more AU-rich. (A) Analysis of cellular mRNAs with
high cytoplasmic abundance (purple) or low cytoplasmic abundance (orange) as compared to mRNAs with
cytoplasmic abundance within 2 standard deviations of the mean abundance (gray) in uninfected cells. Cytoplasmic
abundance by TPM is from the data set published with this paper. ���p< 2.2 x 10⁻¹⁶; ��p< 5.0 x 10⁻⁵; �p< 0.05; all
others p> 0.05 as determined by the Wilcoxon rank sum test compared to mRNAs with relative abundance levels
within the 95% confidence interval of the mean. Hinges correspond to the 25th-75th percentiles, and whiskers denote
1.5 times the inter-quartile range. (B) Analysis as in A for cytoplasmic abundance in infected cells. (C-F) mRNA
characteristics for mRNAs with increased polysome association (blue) or decreased polysome association (green) at 6
hpi, as defined in Fig 3. Data for RNA half-life and poly(A) tail length were from [54, 55]. Analysis was performed as in
A.
https://doi.org/10.1371/journal.ppat.1007875.g004
Control of VSV protein synthesis
PLOS Pathogens | https://doi.org/10.1371/journal.ppat.1007875 June 21, 2019 10 / 27

Fig 5. Effect of suppressing specific host gene function on viral gene expression. (A) GFP expression of a rVSV-eGFP reporter virus in uninfected,
vehicle-treated, or 2.5 μM 17-DMAG treated HeLa cells. A representative histogram of GFP intensity is shown to the right, and the mean fluorescence
intensity (MFI) of live cells is shown below. MFI is normalized to vehicle, and error bars denote the standard deviation from the mean of 3 independent
replicates. (B) VSV gene expression in eIF3a depleted HeLa cells. A representative histogram of fluorescence intensity is shown to the right and the MFI
below. Error bars denote standard deviation from the mean from three independent replicates. Luciferase expression driven by rVSV-LUC (Firefly
Luciferase) or a cellular reporter driving expression of Renilla Luciferase (pRL-CMV) in eIF3a depleted cells. Luciferase expression is presented as the percent
of a non-targeting siRNA control, and error bars denote the standard deviation from 3 independent replicates. Metabolic labeling of eIF3a depleted HeLa
Control of VSV protein synthesis
PLOS Pathogens | https://doi.org/10.1371/journal.ppat.1007875 June 21, 2019 11 / 27

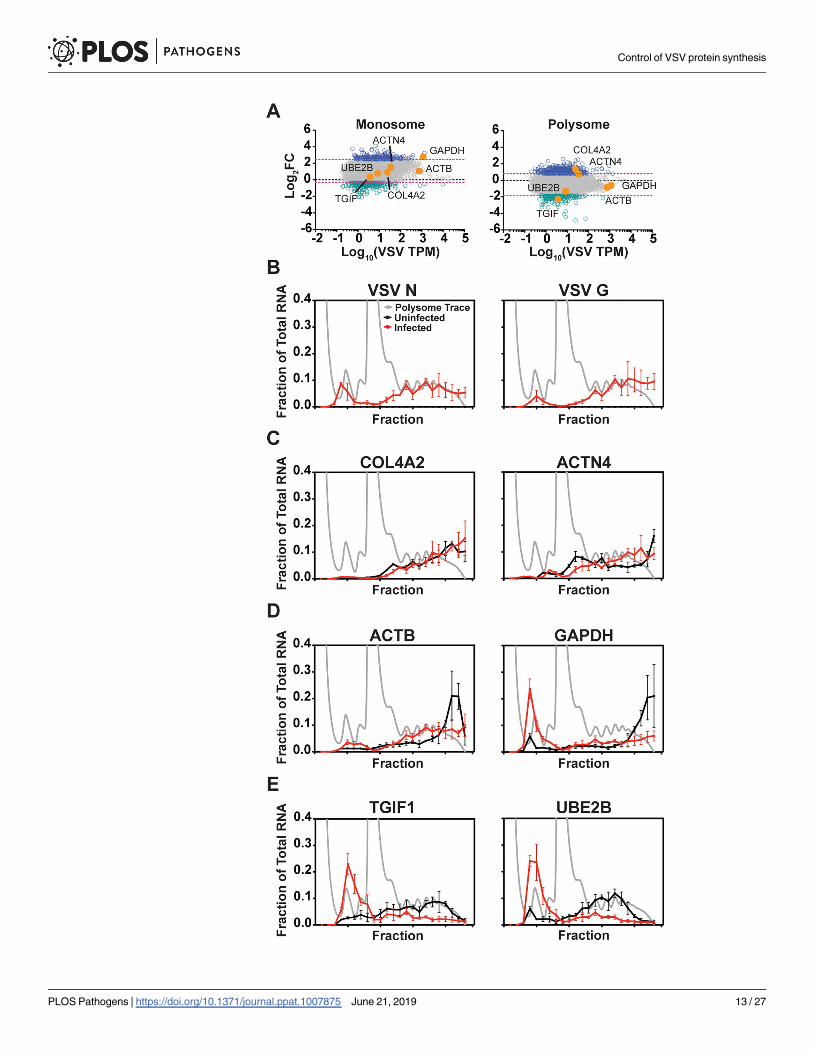
Cellular mRNAs exhibit differential polysome distributions following
infection
For our experiments we pooled fractions that contained 3 or more ribosomes prior to sequenc-
ing of the polysome-associated mRNA. As a result, we do not assess the impact of the redistri-
bution of mRNAs toward smaller polysomes. We therefore selected a subset of cellular
mRNAs (Fig 6A), and interrogated their distributions across polysomes using reverse tran-
scription and quantitative PCR. As controls, we analyzed the distribution of N and G mRNAs
as representative viral transcripts translated by soluble and endoplasmic reticulum-associated
ribosomes, respectively [64]. Consistent with the robust production of viral proteins at 6 hpi,
the VSV N and G mRNAs were localized in fractions corresponding to 3 or more ribosomes
(Fig 6B). For two cellular mRNAs with increased polysome TPM—collagen type IV alpha 2
(COL4A2) and alpha-actinin-4 mRNA (ACTN4)–the mRNAs remained associated with larger
polysomes in infected cells (Fig 6C). Two cellular transcripts that were largely unaltered in
their polysome associated TPM–β-actin (ACTB) and glyceraldehyde 3-phosphate dehydroge-
nase (GAPDH)–remained polysome-associated, although there was a shift toward smaller
polysomes and some GAPDH transcripts exited polysomes (Fig 6D). For two representative
cellular mRNAs with decreased polysome TPM—transforming growth factor B induced fac-
tors (TGIF1) and ubiquitin conjugating enzyme E2 B (UBE2B)–the mRNAs largely exited the
polysome fractions, and those that remained were predominantly present on smaller poly-
somes (Fig 6E). In all cases examined, dissociation of polysomes with EDTA shifted the
mRNA distribution toward the fractions corresponding to free ribosomal subunits (S4 Fig).
These qPCR data highlight the shift towards smaller polysome fractions for some cellular
mRNAs, which also likely contributes to suppression of host protein synthesis. This shift
might also explain our finding that HSP70 protein synthesis is relatively unaffected by viral
infection (Fig 5D), although the mRNA exhibits increased polysome association.
Transcripts from viral mutants defective in cap methylation are translated
efficiently in infected cells
The abundance of viral mRNA and the suppression of translation initiation through reducing
the pool of eIF4E will both contribute to the movement of mRNAs toward smaller polysomes.
Recognition of the mRNA cap-structure by eIF4E requires that the guanine-N-7 position of
the 7mGpppNmN cap is methylated [65]. We previously reported a panel of recombinant
VSVs containing amino acid substitutions within the L-encoded mRNA cap methylase
domain that are defective in viral mRNA cap methylation [25]. Mutants VSV-LG4A and
VSV-LG1670A contain substitutions in the binding site for the methyl donor s-adenosyl methio-
nine (SAM) and ablate all viral mRNA cap methylation (VSV-LG4A) or guanine-N7 but not
ribose-20-O methylation (VSV-LG1670A) [25]. As VSV mRNA is relatively insensitive to the loss
of eIF4E [44], we would anticipate that the methylation status of the mRNA cap-structure
would have little impact on polysome association. Analysis of the distribution of VSV N and G
mRNA within polysomes at 6 hpi revealed a similar distribution in cells infected with wild-
cells infected with wild-type VSV. The position of viral proteins is noted to the right. Presented is a representative gel from two independent replicates. (C)
VSV gene expression and replication in DDIT4 depleted cells. A representative histogram of eGFP expression is shown along with the MFI of cells
normalized to a non-targeting siRNA control. Error bars denote the standard deviation from the mean of three independent replicates. For metabolic
labeling a representative gel of two independent replicates is presented. Kinetics of viral replication were measured by titration of yields at various times post
infection of siRNA treated HeLa cells. Error bars denote the standard deviation from the mean of 3 independent replicates. (D) Immunoprecipitation of
cellular proteins synthesized post-infection with VSVWT. Shown is a representative gel from two independent replicates. A quantitative analysis of the HSP70
and YBX1 bands is shown in the bottom two panels, error bars denote the standard deviation from two independent replicates.
https://doi.org/10.1371/journal.ppat.1007875.g005
Control of VSV protein synthesis
PLOS Pathogens | https://doi.org/10.1371/journal.ppat.1007875 June 21, 2019 12 / 27
Control of VSV protein synthesis
PLOS Pathogens | https://doi.org/10.1371/journal.ppat.1007875 June 21, 2019 13 / 27

type virus as well as those infected with VSV-LG1670A and VSV-LG4A (Fig 7A–7C). Corre-
spondingly, the rate of viral protein synthesis in cells infected with VSV-LWT and VSV-LG1607A
measured by a 10-minute pulse of [35S]-methionine is similar (S5 Fig). These results demon-
strate that defects in viral mRNA cap methylation do not significantly alter the rate of viral
protein synthesis, consistent with a reduced dependence on eIF4E [25].
To directly test whether manipulating eIF4E levels affects viral translation we depleted
eIF4E levels approximately 10-fold using a peptide-conjugated morpholino (PPMO) and mea-
sured the rates of VSV-LWT and VSV-LG1607A viral protein synthesis by a 10-minute pulse of
[35S]-methionine at various times post-infection (Fig 7D–7F). Depletion of eIF4E decreased
the rate of viral protein synthesis in VSV-L1670A infected cells, but not LWT infected cells (Fig
7E and 7F). This was not due to sequestration of eIF4E by differential activation of eIF4E-BP1
between VSV-LWT and VSV-LG1607A infected cells, as the kinetics of eIF4E-BP1 dephosphory-
lation are the same during both infections (S6 Fig). We previously reported that although
VSV-L1670A is defective in mRNA cap methylation, up to 20% of the mRNA cap-structures are
guanine-N7 methylated. We interpret this finding as indicative of an eIF4E dependent mecha-
nism of translation early in infection.
Discussion
We obtained two snapshots into the complex battle for control of protein synthesis in cells
infected with vesicular stomatitis virus by sequencing of polysome-associated mRNAs at 2 and
6 hpi. Those snapshots provide further evidence that the abundance of vesicular stomatitis
virus mRNAs is a determinant of the dominance of viral protein synthesis in infected cells, but
highlight several additional attributes of this complex relationship. Those include the demon-
stration that some host mRNAs that remain polysome associated encode proteins that support
viral replication, and some of those that exhibit reduced polysome association encode proteins
that are antiviral. We also obtained further insight into the seemingly paradoxical observations
that viral infection results in a reduction of the available pool of eIF4E –the rate limiting factor
for translation initiation–yet viral mRNAs contain a cap structure that is indistinct to that of
host mRNAs. Through the use of a viral mutant defective in mRNA cap methylation, and sup-
pression of eIF4E levels we provide evidence consistent with a transition from an eIF4E depen-
dent phase of viral translation to one less-dependent on eIF4E.
Evidence in support of a role of mRNA abundance in viral dominance of
protein synthesis
The sequence data reported here provides some support for the model that the VSV mRNAs
overwhelm the pool of cellular mRNA leading to a redistribution of ribosomes onto viral mes-
sages [39]. Evidence in support of this model is based on massively parallel sequencing of
mRNAs associated with polysomes, compared with those present in the cytoplasm. As a frac-
tion of the total cytoplasmic mRNA, the VSV mRNAs represent ~1% by 2 hpi, but more than
60% by 6 hpi, illustrating the power of exponential amplification of the viral genome. As a
Fig 6. Altered distribution of cellular mRNA within polysomes following infection. (A) The monosome or
polysome association of cellular mRNAs at 6 hpi, as determined by RNAseq. Genes picked for validation by polysome
profiling and qPCR are highlighted in orange. (B-E) The distribution of mRNA in polysome profiles from uninfected
or infected HeLa cells at 6 hpi. A representative polysome trace from infected cells at 6 hpi is shown in light gray, and
the mRNA polysome distribution in uninfected cells is shown in black, and infected cells in red. The RNA distribution
is presented as the fraction of the total recovered. Error bars denote the standard deviation from three independent
replicates. (B) Distribution of VSV N and G mRNA. (C) RNAs with increased polysome association by RNAseq. (D)
RNAs with unchanged polysome association following infection. (E) mRNAs with decreased polysome association.
https://doi.org/10.1371/journal.ppat.1007875.g006
Control of VSV protein synthesis
PLOS Pathogens | https://doi.org/10.1371/journal.ppat.1007875 June 21, 2019 14 / 27

result, the viral N, P, M and G mRNAs far exceed the abundance of any given cellular mRNA,
and even the least abundant viral mRNA–that encoding the L polymerase–is present at similar
levels to the most abundant cellular mRNA. Thus, one contributor to host cell shut-off in VSV
infected cells appears to relate to the synthetic capabilities of the viral polymerase in transcrip-
tion of viral mRNA.
Fig 7. Transcripts from viral mutants defective in cap methylation are translated efficiently in infected cells. (A) Polysome distribution of VSV N and G
mRNAs at 6 hpi with wild-type VSV. Results of qPCR for each individual polysome fraction are presented as a fraction of the total recovered, in red. Error bars
denote the standard deviation from two independent replicates, and a representative polysome profile from infected cells is shown in gray. (B) Polysome
distribution of VSV N and G mRNAs at 6 hpi with a VSV mutant deficient in guanine N-7 cap methylation, LG1670A. (C) Polysome distribution of VSV N and G
mRNAs at 6 hpi with a VSV mutant, LG4A, defective in both guanine-N-7 and ribose-20-O cap methylation. (D) Western blot showing depletion of eIF4E by
PPMO. “Scr” and “4E” denote “scramble” or “eIF4E” PPMO treated cells, respectively. (E-F) Rates of viral protein synthesis in PPMO treated VSVWT or
VSVG1670A-infected cells following a 10-minute pulse with [35S] methionine. A quantitative analysis is presented as a ratio of the rate of synthesis in eIF4E-
depleted cells to scramble PMO treated cells. Error bars denote the standard deviation from the mean of two independent replicates.
https://doi.org/10.1371/journal.ppat.1007875.g007
Control of VSV protein synthesis
PLOS Pathogens | https://doi.org/10.1371/journal.ppat.1007875 June 21, 2019 15 / 27

Similar conclusions have recently been reached for other viruses. Infection of cells with
mouse hepatitis virus (MHV) a positive-strand RNA coronavirus that replicates within the
cytoplasm results in 80–90% of the cytoplasmic mRNA being viral by 5 hpi [47]. For influenza
A virus, a segmented negative-strand RNA virus that replicates in the nucleus, >50% of the
total mRNA in the cytoplasm is viral [48]. In this case however, the viral endonuclease PA-X
degrades cellular mRNA which further contributes to the dominance of viral mRNA [66, 67].
For vaccinia virus, a DNA virus that replicates entirely within the cytoplasm, degradation of
host mRNA through the viral encoded decapping enzymes D9 and D10 also helps the viral
mRNAs overwhelm those of the host cell [49, 68, 69]. Collectively these studies indicate that
one shared mechanism for host cell shut-off in virus-infected cells is competition for host cell
ribosomes through tipping the balance between viral and host mRNA.
Earlier work concludes that viral mRNA abundance is not the determinant of host cell
shut-off [41]. When VSV mRNA levels were suppressed up to 14-fold by using defective inter-
fering particles of VSV or a viral mutant defective in transcription, host shut-off was still
observed. We did not directly test how suppressing viral mRNA levels impacts host shut-off in
this study, but rather conclude that abundance is only part of the mechanism by which the
virus induces host cell shut-off–as discussed below.
A role for eIF4E, the rate limiting factor for translation initiation
We also obtained evidence in support of additional mechanisms that contribute to host cell
shut-off in VSV infected cells. We confirmed earlier work that demonstrated a suppression of
the pool of the rate limiting factor for initiation, eIF4E, by altering the phosphorylation status
of its negative regulator, eIF4E-BP1, which results in eIF4E sequestration [9]. Differences in
sensitivity to reductions in eIF4E may contribute to the overrepresentation of cellular mRNA
we observe in monosome fractions during infection. We also provide new evidence in support
of a phase of VSV gene expression that is dependent on eIF4E through the use of a viral mutant
partially defective in guanine-N7 methylation [25] and by the suppression of cellular pools of
eIF4E. When eIF4E levels are suppressed 10-fold, we unmask a defect in viral protein synthesis
in cells infected with VSV-VSV-LG1670A a mutant with a 4-fold defect in methylation at the
guanine-N7-position of the cap-structure. We suspect that this significantly underestimates
the eIF4E dependent phase of viral replication since transformed cell lines, like the HeLa cells
used here, have higher constitutive levels of eIF4E [70]. Our findings are consistent with a
model where viral mRNAs initially compete with cellular mRNAs and translate in an eIF4E
dependent manner. As infection progresses and the shut-down of host transcription, mRNA
export and eIF4E sequestration continue, the process of initiation is increasingly less depen-
dent on eIF4E. The mechanism by which the viral mRNAs become less dependent on eIF4E
remains uncertain, but earlier studies demonstrate that neither the 50 or 30 UTR of viral
mRNAs facilitate this efficient translation. Ongoing transcription of viral mRNA from the
viral genome has also been linked to efficient protein synthesis [46, 71]. Whether this reflects
the fact that the virus is an efficient producer of mRNA that supports the competition model,
or whether there is a temporal requirement for continued viral mRNA synthesis is uncertain.
Balancing host and viral gene expression
As obligate intracellular parasites, viruses depend upon host cell functions for their replication.
Our sequence analysis provides evidence that VSV infection differentially impacts the poly-
some association of cellular mRNAs. Several host mRNAs increased in polysome association
include genes with known “proviral” functions for entry and replication including heparan
sulfate, clathrin, and HSP90 [56, 72–74]. Similarly, host mRNAs with decreased polysome
Control of VSV protein synthesis
PLOS Pathogens | https://doi.org/10.1371/journal.ppat.1007875 June 21, 2019 16 / 27

association included genes with published roles in restricting VSV replication such as inter-
feron regulatory factor 1 (IRF1), DDIT4, and TXNIP [62, 63, 75]. It is difficult to definitively
determine whether this reflects evolution of the virus to contend with the environment in
which it finds itself or a bona-fide pro and antiviral effect of a given host protein. Our efforts to
address this are confounded by the essential house-keeping nature of many of the proteins
encoded by host mRNAs that remain polysome associated. An example of this is provided by
enhanced polysome association of eIF3a on VSV infection–a protein that is required for
assembly of the multisubunit eIF3 complex. That complex also includes eIF3d which has dem-
onstrated cap-binding ability, and directs eIF4E-independent translation of select mRNAs
[76–79]. Depletion of eIF3A, however, resulted in an equivalent reduction in the rates of viral
and host translation–inconsistent with a specialized need for eIF3 components in VSV protein
synthesis.
Polysome association and protein synthesis
In this study, we validated that the effect of VSV infection on the polysome association of 2
host mRNAs–HSP70 and YBX1—had a concordant impact on protein synthesis. Although
synthesis of HSP70 did not increase per se, this is likely explained by the shifting of many cellu-
lar mRNAs towards smaller polysomes. This finding highlights the fact that the designation of
RNAs as having “increased” or “decreased” polysome association is imprecise, and reflects the
complexities of how any given host gene is regulated. Nevertheless, the general finding that
mRNAs with “increased” polysome association on VSV infection are typically larger, have lon-
ger half-lives and higher AU content–features that are shared with the viral mRNA–highlights
commonalities among mRNAs that remain polysome-associated and thus are more efficient
in competing for ribosomes during host shut-off. The cellular mRNAs that exhibit reduced
translation efficiency were shorter, have shorter half-lives and higher GC content. Although
we validated changes in translatability and differential impacts on viral gene expression for a
few cellular genes, it would be of significant interest to perform stable isotope labelling by
amino acids in cell culture (SILAC) to non-radioactively label newly synthesized cellular pro-
teins, quantify them on a genome-wide scale and correlate those data with the RNAseq results
presented here.
Integration of different mechanisms of viral suppression of host gene
expression
In addition to suppression of host translation through mRNA synthesis and eIF4E manipula-
tion, the VSV matrix protein inhibits host RNA polymerase II transcription [1, 3], and blocks
nuclear export of mature mRNAs through complex formation with the nuclear pore compo-
nents Rae1 and Nup98 [4–8]. A well characterized viral mutant (VSV-MM51R) fails to interact
with the nuclear pore complex and exhibits a delayed kinetics of host shut-off [6, 10, 80]. A
similar analysis to that described here of cells infected with such a mutant may help delineate
the extent to which ongoing synthesis and export of cellular mRNA impacts host cell shut-off.
We anticipate that over the time course of VSV infection, the contribution of ongoing synthe-
sis and export of host mRNA from the nucleus will result in a relatively modest increase in the
fraction of the cytoplasmic mRNA that is cellular.
This study highlights a strategy shared among distinct viruses to commandeer the host
translational machinery by outcompeting cellular mRNAs. Precisely where the tipping point
between viral and host mRNA levels with respect to this shut-off occurs is uncertain. For VSV,
a viral mutant that makes less mRNA than the wild type yet still exhibits host cell shut-off sug-
gests that shut-off can be achieved with less than the 60% of total cytoplasmic mRNA observed
Control of VSV protein synthesis
PLOS Pathogens | https://doi.org/10.1371/journal.ppat.1007875 June 21, 2019 17 / 27

here [41]. Additional work will be required to define whether a specific tipping point exists
and how this is influenced by other viral strategies such as eIF4E suppression or blocking host
gene transcription.
Materials and methods
Cells and viruses
HeLa cells (a gift from James Hogle) were maintained in Dulbecco’s modified Eagle medium
(DMEM; Invitrogen, Carlsbad, CA) supplemented with 10% fetal bovine serum (FBS; Tissue
Culture Biologicals, Tulare, CA). Viral stocks were grown on Syrian golden hamster kidney
BSRT7 cells (a gift from K. Conzelmann), and purified on linear 15–45% sucrose gradients
prepared in NTE (10 mM Tris pH 7.4, 100 mM NaCl, 1 mM EDTA). Viral titers were deter-
mined by plaque assay on African green monkey kidney Vero cells (ATCC, CCL-81). For
infections, cells were first washed with Hanks’ Balanced Salt Solution (HBSS) and incubated
with virus for 1 hour at 37˚C in serum free medium, washed with HBSS and subsequently
incubated with medium supplemented with 2% FBS.
Polysome profiling
For polysome profiling, HeLa cells were treated with DMEM containing 100 μg ml-1 cyclohexi-
mide at 37˚C for 3 minutes. Cells were washed twice with 1X ice-cold phosphate buffered
saline (PBS) containing 100 μg ml-1 cycloheximide, and kept on ice or at 4˚C. Cells were
scraped into a 1.5 ml microcentrifuge tube in 1X PBS with 100 μg ml-1 cycloheximide, and pel-
leted at 300 × g for 10 minutes. Cells were resuspended in 250 μl of a hypotonic buffer of 5 mM
Tris (pH 7.4), 2.5 mM MgCl2, 1.5 mM KCl, and RNAsin (Promega, Madison, WI), supple-
mented with cycloheximide to 100 μg ml-1 and DL-Dithiothreitol (DTT) to 3 μM. The deter-
gents Triton X-100 0.5% (vol/vol) and sodium deoxycholate 0.5% (wt/vol) were then added
sequentially, cells were briefly vortexed, and incubated for 15 minutes on ice and clarified by
centrifugation at 12,000 × g for 2 min. Polysomes were separated on sucrose gradients pre-
pared on a Gradient Master Station (Biocomp, Fredericton, Canada) using 10% and 50% (wt/
vol) sucrose dissolved in 15 mM Tris (pH 7.4), 15 mM MgCl2, and 150 mM NaCl supple-
mented with RNAsin and 100 μg ml-1 cycloheximide. Following centrifugation for 2 hours at
40,000 × g in a Beckman Coulter ultracentrifuge using an SW40Ti rotor, 500 μl fractions were
collected from the top of the gradient while monitoring absorbance at λ = 254 nm on a Gradi-
ent Master Station.
RNA extraction, library preparation, and RNAseq
RNA was extracted from total cytoplasmic, polysome, or monosome fractions using LS Trizol
(Invitrogen) according to the manufacturer’s protocol. Equal amounts of RNA as determined
by spectrophotometry using absorbance at 260 nm on a Nanodrop 2000 (Thermo Fisher, Wal-
tham, MA) were subject to library preparation using the Illumina TruSeq vII RNA Library
Preparation Kit (Illumina, San Diego, CA), and sequenced at the Whitehead Institute (Cam-
bridge, MA) on an Illumina HiSeq2500. Reads were trimmed and mapped to the concatenated
hg38 and VSV genomes using CLC Genomics Workbench (Qiagen, Redwood City, CA). Map-
ping parameters were as follows; mismatch cost 2, insertion cost 3, deletion cost 3, length frac-
tion 0.8, similarity fraction 0.8, and a maximum of 10 hits per read. Raw sequence data is
available from the NCBI Sequence Read Archive (SRA) under the primary accession code
SRP158625.
Control of VSV protein synthesis
PLOS Pathogens | https://doi.org/10.1371/journal.ppat.1007875 June 21, 2019 18 / 27

Gene expression analysis
Transcripts per Kilobase Million (TPM) was calculated for genes with 56 or more mapped reads
in the cytoplasmic fraction of both uninfected and infected cells using the total number of mapped
exon reads. To identify cellular mRNAs that were potential targets for translational regulation in
infected cells, we determined the TPM in the polysome fraction/TPM in the total cytoplasmic
fraction for each individual mRNA. This ratio was determined for uninfected and infected cells,
and presented as the log2 fold change. Gene ontology analysis was performed in R using GOseq.
mRNA characteristics and statistical analysis
UTRs and CDS sequences were downloaded from the UCSC table browser using “KnownCa-
nonical” mRNA identifiers. Non-protein coding RNAs were excluded from the analysis. Poly
(A) tail length and mRNA half-lives were from published data sets [54, 55]. Graphs and statisti-
cal analyses were performed in R using the “wilcox_test” statistical test, the “density” kernel
density estimation, and “geom_boxplot” or “geom_density” functions in ggplot and cowplot.
RT-qPCR
Total RNA was recovered from polysome fractions using LS Trizol according to the manufac-
turer’s protocol. RNA (500 ng) was annealed with oligo d(T)20 and reverse-transcribed using
Superscript III Reverse Transcriptase (Thermo Fisher) at 50˚C for 1 hour. Following digestion
of the RNA strand with RNaseA and RNaseH for 15 min at 37˚C, reactions were diluted 1:5
for cellular gene-specific qPCR or 1:125 for viral gene-specific qPCR. Quantitative PCR was
performed using Power Sybr Green (Thermo Fisher) and relative amounts determined by
ΔΔCt. Forward (F) and Reverse (R) primers were as follows:
ACTB (F) 50 ACCCAGCACAATGAAGATCA 30, (R) 50 CTCGTCATACTCCTGCTTGC 30;
ACTN4 (F) 50 ACATCTCCGTGGAAGAGACC 30, (R) 50 GGAAGTTCTGCACATT-
GACG 30;
COL4A2 (F) 50 AACGGGATTCCATCAGACAC 30, (R) 50 ATGCCTCTTATTCCTGGTT
CC 30;
DDIT4 (F) 50 CGGAGGAAGACACGGCTTA 30, (R) 50 ACAAGTGTTCATCCTCAGGGT 30;
GAPDH (F) 50 AGCCTCAAGATCATCAGCAATG 30, (R) 50 ATGGACTGTGGTCATGA
GTCCTT 30;
TGIF1 (F) 50 CACCGTTACAATGCCTATCC 30, (R) 50 GATTTGGATCTTTGCCATCC 30;
UBE2B (F) 50 CAATTCAGTCTCTGCTGGATG 30, (R) 50 AACAATGGCC-
GAAACTCTTT 30;
VSV G (F) 50 GTGGGATGACTGGGCTCCAT 30, (R) 50 CTGCGAAGCAGCGTCTTGAA 30;
VSV N (F) 50 GAGTGGGCAGAACACAAATG 30, (R) 50 CTTCTGGCACAAGAGGTTCA 30
Polysome distribution is presented as the fraction of total recovered RNA for each individ-
ual polysome fraction.
Chemical, siRNA or morpholino inhibition of host factors
For inhibition of HSP90, cells were incubated throughout the course of the experiment in
2.5 μM 17-[2-(Dimethylamino)ethyl]amino-17-desmethoxygeldanamycin (17-DMAG; Adipo-
Gen Corp, San Diego, CA). For siRNA depletions, cells were pretreated with siRNAs against
DDIT4 (D-010855-01), eIF3a (D-019534-03), or non-targeting siRNA #2 (D-001210-02), and
#3 (D-001210-03) Dharmacon (Lafayette, CO) for 48 h. Briefly, Lipofectamine 2000 (Thermo
Fisher) was diluted 100-fold in Optimem (Invitrogen), and incubated for 15-minutes with an
equal volume of siRNA in Optimem. Reverse transfections were performed in 24 well plates
Control of VSV protein synthesis
PLOS Pathogens | https://doi.org/10.1371/journal.ppat.1007875 June 21, 2019 19 / 27

with 5.5 x 10⁴ HeLa cells per well at a final concentration of 50 nM siRNA in a total volume of
600 μl.
Images of rVSV-eGFP infected cells were acquired using a 10× objective on a Nikon Eclipse
TE300 microscope (Nikon Instruments, Melville, NY) equipped with a Spot RT SE18 Mono-
chrome camera (Diagnostic Instruments, Sterling Heights, MI). For cytometry, cells were
washed in HBSS, trypsinized, fixed in 4% paraformaldehyde at 4˚C for 15 minutes and mea-
sured using a FACSCalibur (Cytek Development, Freemont, CA). Cytometry data was ana-
lyzed using FlowJo (FlowJo Inc, Ashland, OR). For mean fluorescence intensity (MFI) we
gated on live cells identified by forward and side-scatter. To measure the % infected cells we
subtracted those cells that fell within the gate established from uninfected control cells.
For luciferase assays, where indicated HeLa cells were transfected with siRNA, and the
medium replenished at 24 h. Cells were transfected 6 h later with 25 ng pRL-CMV (Promega),
and activity measured 24 h later. For viral driven luciferase reporters siRNA transfected cells
were infected at 48 h and monitored 6 h later. Luciferase expression was measured in a Spec-
traMax L microplate reader using the appropriate reagents according to the manufacturer’s
instructions (Promega, E1501 and E2810).
For depletion of host factors by peptide-conjugated morpholinos (PPMOs) approximately
2.0 x 10⁴ HeLa cells per well of a 24 well plate were treated 24 h later with 15 μM of the indi-
cated PPMO. At 24 h post treatment, the media was replaced with fresh medium containing
15 μM PPMO, and used for testing 24 h later.
Western blots
Cells were washed twice with ice-cold 1X PBS and lysed in Rose Lysis Buffer consisting of 10
mM Tris-HCl (pH 7.4), 66 mM EDTA, 0.4% w/v sodium deoxycholate, and 1% v/v NP-40 on
ice for 15 minutes. Rose Lysis Buffer was supplemented with Phosphatase Inhibitor Cocktail 2
(Sigma-Aldrich, St. Louis, MO) and Halt Protease and Phosphatase Inhibitor Cocktail
(Thermo Fisher) for detection of phospho-eIF4E-BP1. Lysates were clarified, protein input
was normalized by Bradford Assay and proteins resolved on polyacrylamide gels– 10% for
eIF3a and eIF4E or 12%, eIF4E-BP1. Proteins were transferred to nitrocellulose membranes
for 90 minutes, eIF4E and eIF4E-BP1, or 120 minutes, eIF3a, at 100v. Membranes were
blocked with Odyssey Blocking Buffer in PBS (LI-COR, Lincoln, NE) for 1 h at room tempera-
ture, and incubated overnight at 4˚C with the following primary antibodies: rabbit anti-eIF3a
(Cell Signaling, #3411), rabbit anti-eIF4E (Cell Signaling, #9742), rabbit anti-4E-BP1 (Cell Sig-
naling, #9452), rabbit anti-phospho-4E-BP1 Ser65 (Cell Signaling, #9451), rabbit anti-phos-
pho-4E-BP1 Thr37/46 (Cell Signaling, #2855), mouse anti-actin (Millipore, #MAB1501),
mouse anti-actin (Sigma, #A5316). Membranes were washed 3X with 1X PBS-T for 5 minutes
at room temperature, and incubated with the relevant secondary antibodies: goat anti-mouse
IRDye 680RD (LI-COR, #925–68070) or goat anti-rabbit IRDye 800CW (LI-COR, #925–
32211), for 1 hour at room temperature. Membranes were washed again and kept in 1X PBS,
and scanned on an Odyssey CLx (LI-COR).
Metabolic labeling of proteins and immunoprecipitation
HeLa cells were starved in DMEM lacking L-methionine (Corning, #17-204-Cl) for 30 min-
utes, prior to addition of [35S] Express Protein Labeling Mix (Perkin Elmer, Waltham, MA) at
0.11 mCi ml-1. Cell lysates were prepared as described above and separated on a low-bis 10%
polyacrylamide gel. The gel was dried for 1.5 h at 80˚C in a vacuum gel drier and detected
using a phosphoimager. Quantitative analyses of band intensities was performed in Image-
Quant TL v8.1 (GE Healthcare, Marlborough, MA).
Control of VSV protein synthesis
PLOS Pathogens | https://doi.org/10.1371/journal.ppat.1007875 June 21, 2019 20 / 27

For radioimmunoprecipitations, 4.0 x 10⁶ HeLa cells plated in 10 cm dishes (Corning) were
starved of methionine for 1 h at 24 h post-plating, and labeled with [35S]-Express for 3 h. Cells
were washed twice with ice-cold 1X PBS, collected by scraping and subsequent centrifugation
for 2 minutes at 4˚C and 2,000 × g and lysed in 1 ml of 50 mM Tris (pH 7.4), 150 mM NaCl2, 1
mM EDTA, 1% v/v NP40, 2 mM DTT, supplemented with Pierce Protease Inhibitor (Thermo
Fisher) on ice for 15 minutes. Protein input was normalized by Bradford Assay, SDS was
added to 0.1%, and 450 μl lysate was pre-cleared for 1h at 4˚C on a nutator with 50 μl pre-
washed Pierce Protein A Agarose Beads. Protein A beads were pelleted by centrifugation for 2
minutes at 4˚C and 2,000 × g and the labeled supernatant incubated with primary antibody at
4˚C overnight. The antibodies used for immunoprecipitation were 4 μg anti-YB1 (Abcam,
#ab76149) and 5 μg anti-HSP70 (Enzo, #ADI-SPA-822). Immune complexes were isolated
using 50 μl pre-washed Pierce Protein A Agarose Beads, by incubating for 4 hours at 4˚C. Bead
complexes were collected by centrifugation for 2 minutes at 4˚C and 2,000 × g, washed 5X
with 950 μl ice-cold IP lysis buffer with 0.1% SDS, on an orbital shaker for 3 minutes at room
temperature. Protein-antibody complexes were eluted by boiling in 4X SDS loading buffer, the
beads pelleted for 2 minutes at 4˚C in a microcentrifuge and the supernatant loaded on a 10%
polyacrylamide gel. After electrophoresis the gel was dried and imaged using a
phosphoimager.
Metabolic labeling of viral RNA
Approximately 1.5 x 10⁶ HeLa cells were plated per well of a 6-well dish and 24 hours later
incubated with phosphate free media (Gibco, 11971–025) for 1 h. Thirty minutes before infec-
tion, actinomycin D-mannitol (Sigma, #A5156) was added to a final concentration of 5 μg ml-
1. Infections were carried out in phosphate free media supplemented with 10 μg ml-1 actino-
mycin D and 2.5 μM 17-DMAG. At 1 hpi cells were washed, fresh medium added, and supple-
mented 3 h later with [32P]-orthophosphoric acid (Perkin Elmer, #NEX053H) 0.20 μCi μl-1.
Cells were harvested at 6 hpi in Rose Lysis Buffer, and total RNA was extracted using LS Trizol.
RNA was separated on a 6M Urea-Agarose gel as previously described, and detected using a
phosphoimager [81].
Supporting information
S1 Fig. The viral gene cascade at 2 and 6 hpi. (A) Sequence read coverage of the viral genome
in the cytoplasmic or polysome fractions at 6 hpi. Analysis was performed in CLC Genomics
Workbench. (B) Distribution of viral mRNAs present in monosome and polysome fractions at
2 hpi mapped to the viral genome. Expression level is presented as Transcripts per Kilobase
Million (TPM) to normalize for gene length and library size, error bars denote standard devia-
tion from two biological replicates. (C) Viral mRNA distribution at 6 hpi, presented as in B.
(TIF)
S2 Fig. High AU content is a general feature of cellular mRNAs that remain most poly-
some-associated on infection. (A-F) Analysis of mRNA characteristics for RNAs with
increased (blue) or decreased (green) polysome association as compared to mRNAs with poly-
some association measurements at 6 hpi within 2 standard deviations of the mean (gray).���p<2.2 x 10⁻¹⁶, ��p<5.05 x 10⁻⁵, �p<0.05; all other p>0.05 as determined by the Wilcoxon
rank sum test compared to mRNAs within the 95% confidence interval. Hinges correspond to
the 25th-75th percentiles, and whiskers denote 1.5 times the inter-quartile range. CDS is
defined as the coding region of the gene sequence.
(TIF)
Control of VSV protein synthesis
PLOS Pathogens | https://doi.org/10.1371/journal.ppat.1007875 June 21, 2019 21 / 27

S3 Fig. Effect of perturbing host gene function on viral replication. (A) Brightfield and eGFP
images of rVSV-eGFP infected HeLa cells treated with 17-DMAG, refers to Fig 5. Below, a repre-
sentative histogram of flow data, and quantitative analysis of GFP positive cells by flow cytometry,
normalized to vehicle. Error bars denote standard deviation from the mean of three independent
replicates. To the right is viral RNA transcription from 3–6 hpi in actinomycin D and 17-DMAG
treated HeLa cells. The position of viral RNAs is noted on the right. Shown is a representative gel
from three independent replicates. (B) Top panel, western blot for eIF3a protein 48 hours post-
siRNA transfection. Presented is a representative western blot from three independent replicates.
The bottom two panels show the brightfield images for Fig 5 and percent infected cells, as in A.
(C) Top panel showing the knockdown efficiency of DDIT4 RNA by RT-qPCR 48 hours post
siRNA transfection. The bottom two panels show cell density and rVSV-eGFP expression, pre-
sented as in A except that GFP quantification was normalized to a non-targeting control siRNA.
(TIF)
S4 Fig. Messenger RNAs are ribosome-associated at 6 hpi. (A-E) The distribution of mRNA
in polysome profiles from uninfected or infected HeLa cells at 6 hpi in the presence or absence
of EDTA. EDTA was added to a final concentration of 50 mM and lysates were incubated for 5
minutes on ice. Lysates were sedimented through gradients containing EDTA. Cycloheximide
was omitted from all experimental conditions, including non-EDTA treated lysates. A repre-
sentative polysome trace from infected cells at 6 hpi following EDTA treatment is shown in
light gray. The mRNA polysome distribution from untreated, uninfected lysates is shown in
black, and untreated, infected cells in red. EDTA treated uninfected distributions are shown in
dashed gray, and EDTA treated infected cell lysates in dashed pink. The RNA distribution is
presented as the fraction of the total amount of a given RNA recovered. A representative
experiment from two independent replicates is presented. Polysome distributions of (A) VSV
N, (B) VSV G, (C) ACTN4, (D) ACTB, and (E) UBE2B.
(TIF)
S5 Fig. Efficient protein synthesis by a viral mutant defective in mRNA cap methylation.
(A) Phosphoimage analysis of an SDS-PAGE of proteins synthesized in cells following a
10-minute pulse with [35S]-methionine at the indicated times post-infection. Cells were
infected with VSVWT or a mutant defective in guanine-N7 cap-methylation, VSVG1670A. The
position of viral proteins is shown to the right, and the gel presented is a representative gel of
three independent replicates.
(TIF)
S6 Fig. The kinetics of eIF4E-BP1 activation is the same between VSVWT and VSVG1670
infected cells. (A) Western blot using an antibody that detects total eIF4E-BP1. Infected cells
were lysed at the indicated times post-infection in the presence of phosphatase inhibitors, and
the lysates separated on 12% polyacrylamide gels. The same samples were used for panels A-C.
Actin is used to show equal loading. Tor denotes samples treated with torin, a positive control
for eIF4E-BP1 dephosphorylation. (B) Western blot for Serine 65 phosphorylated eIF4E-BP1.
(C) Western blot for Threonine 37/46 phosphorylated eIF4E-BP1. The blots presented are rep-
resentative of two independent replicates.
(TIF)
S1 Dataset. 2 hpi normalized gene expression results.
(TXT)
S2 Dataset. 6 hpi normalized gene expression results.
(TXT)
Control of VSV protein synthesis
PLOS Pathogens | https://doi.org/10.1371/journal.ppat.1007875 June 21, 2019 22 / 27

S3 Dataset. Results of GO analysis.
(XLSX)
Acknowledgments
We thank members of the Whelan lab for scientific discussions and suggestions; we further
thank Carl Novina and Cailin Joyce for help with polysome profiling, Keith Ketterer for assis-
tance with CLC Genomics Workbench, and Alos Diallo for help with R and statistical analyses.
We thank David Stein and Hong Moulton, of Oregon State University, for design and produc-
tion of the PPMOs used in this study.
Author Contributions
Conceptualization: William J. Neidermyer, Jr., Sean P. J. Whelan.
Data curation: William J. Neidermyer, Jr.
Formal analysis: William J. Neidermyer, Jr., Sean P. J. Whelan.
Funding acquisition: Sean P. J. Whelan.
Investigation: William J. Neidermyer, Jr.
Methodology: William J. Neidermyer, Jr., Sean P. J. Whelan.
Resources: Sean P. J. Whelan.
Supervision: Sean P. J. Whelan.
Validation: William J. Neidermyer, Jr.
Visualization: William J. Neidermyer, Jr.
Writing – original draft: William J. Neidermyer, Jr., Sean P. J. Whelan.
Writing – review & editing: William J. Neidermyer, Jr., Sean P. J. Whelan.
References
1. Black BL, Lyles DS. Vesicular stomatitis virus matrix protein inhibits host cell-directed transcription of
target genes in vivo. J Virol. 1992; 66(7):4058–64. PMID: 1318397; PubMed Central PMCID:
PMC241208.
2. Black BL, Rhodes RB, McKenzie M, Lyles DS. The role of vesicular stomatitis virus matrix protein in
inhibition of host-directed gene expression is genetically separable from its function in virus assembly. J
Virol. 1993; 67(8):4814–21. PMID: 8392615; PubMed Central PMCID: PMC237868.
3. Ahmed M, Lyles DS. Effect of vesicular stomatitis virus matrix protein on transcription directed by host
RNA polymerases I, II, and III. J Virol. 1998; 72(10):8413–9. PMID: 9733895; PubMed Central PMCID:
PMC110232.
4. Quan B, Seo HS, Blobel G, Ren Y. Vesiculoviral matrix (M) protein occupies nucleic acid binding site at
nucleoporin pair (Rae1 * Nup98). Proc Natl Acad Sci U S A. 2014; 111(25):9127–32. https://doi.org/10.
1073/pnas.1409076111 PMID: 24927547; PubMed Central PMCID: PMC4078809.
5. Her LS, Lund E, Dahlberg JE. Inhibition of Ran guanosine triphosphatase-dependent nuclear transport
by the matrix protein of vesicular stomatitis virus. Science. 1997; 276(5320):1845–8. https://doi.org/10.
1126/science.276.5320.1845 PMID: 9188527.
6. Petersen JM, Her LS, Varvel V, Lund E, Dahlberg JE. The matrix protein of vesicular stomatitis virus
inhibits nucleocytoplasmic transport when it is in the nucleus and associated with nuclear pore com-
plexes. Mol Cell Biol. 2000; 20(22):8590–601. https://doi.org/10.1128/mcb.20.22.8590-8601.2000
PMID: 11046154; PubMed Central PMCID: PMC102164.
7. von Kobbe C, van Deursen JM, Rodrigues JP, Sitterlin D, Bachi A, Wu X, et al. Vesicular stomatitis
virus matrix protein inhibits host cell gene expression by targeting the nucleoporin Nup98. Mol Cell.
2000; 6(5):1243–52. PMID: 11106761.
Control of VSV protein synthesis
PLOS Pathogens | https://doi.org/10.1371/journal.ppat.1007875 June 21, 2019 23 / 27

8. Faria PA, Chakraborty P, Levay A, Barber GN, Ezelle HJ, Enninga J, et al. VSV disrupts the Rae1/
mrnp41 mRNA nuclear export pathway. Mol Cell. 2005; 17(1):93–102. https://doi.org/10.1016/j.molcel.
2004.11.023 PMID: 15629720.
9. Connor JH, Lyles DS. Vesicular stomatitis virus infection alters the eIF4F translation initiation complex
and causes dephosphorylation of the eIF4E binding protein 4E-BP1. J Virol. 2002; 76(20):10177–87.
https://doi.org/10.1128/JVI.76.20.10177-10187.2002 PMID: 12239292; PubMed Central PMCID:
PMC136556.
10. Connor JH, Lyles DS. Inhibition of host and viral translation during vesicular stomatitis virus infection.
eIF2 is responsible for the inhibition of viral but not host translation. J Biol Chem. 2005; 280(14):13512–
9. https://doi.org/10.1074/jbc.M501156200 PMID: 15705563.
11. Hinnebusch AG, Lorsch JR. The mechanism of eukaryotic translation initiation: new insights and chal-
lenges. Cold Spring Harb Perspect Biol. 2012; 4(10). https://doi.org/10.1101/cshperspect.a011544
PMID: 22815232; PubMed Central PMCID: PMC3475172.
12. Fraser CS. Quantitative studies of mRNA recruitment to the eukaryotic ribosome. Biochimie. 2015;
114:58–71. https://doi.org/10.1016/j.biochi.2015.02.017 PMID: 25742741; PubMed Central PMCID:
PMC4458453.
13. Emerson SU, Wagner RR. Dissociation and reconstitution of the transcriptase and template activities of
vesicular stomatitis B and T virions. J Virol. 1972; 10(2):297–309. PMID: 4342247; PubMed Central
PMCID: PMC356462.
14. Huang AS, Baltimore D, Stampfer M. Ribonucleic acid synthesis of vesicular stomatitis virus. 3. Multiple
complementary messenger RNA molecules. Virology. 1970; 42(4):946–57. PMID: 4321313.
15. Mudd JA, Summers DF. Polysomal ribonucleic acid of vesicular stomatitis virus-infected HeLa cells.
Virology. 1970; 42(4):958–68. PMID: 4321314.
16. Morrison T, Stampfer M, Baltimore D, Lodish HF. Translation of vesicular stomatitis messenger RNA by
extracts from mammalian and plant cells. J Virol. 1974; 13(1):62–72. PMID: 4359431; PubMed Central
PMCID: PMC355259.
17. Rhodes DP, Moyer SA, Banerjee AK. In vitro synthesis of methylated messenger RNA by the virion-
associated RNA polymerase of vesicular stomatitis virus. Cell. 1974; 3(4):327–33. PMID: 4374314.
18. Both GW, Moyer SA, Banerjee AK. Translation and identification of the mRNA species synthesized in
vitro by the virion-associated RNA polymerase of vesicular stomatitis virus. Proc Natl Acad Sci U S A.
1975; 72(1):274–8. https://doi.org/10.1073/pnas.72.1.274 PMID: 164017; PubMed Central PMCID:
PMC432286.
19. Moyer SA, Abraham G, Adler R, Banerjee AK. Methylated and blocked 5’ termini in vesicular stomatitis
virus in vivo mRNAs. Cell. 1975; 5(1):59–67. PMID: 165901.
20. Baltimore D, Huang AS, Stampfer M. Ribonucleic acid synthesis of vesicular stomatitis virus, II. An RNA
polymerase in the virion. Proc Natl Acad Sci U S A. 1970; 66(2):572–6. https://doi.org/10.1073/pnas.66.
2.572 PMID: 4317920; PubMed Central PMCID: PMC283083.
21. Emerson SU, Wagner RR. L protein requirement for in vitro RNA synthesis by vesicular stomatitis virus.
J Virol. 1973; 12(6):1325–35. PMID: 4357510; PubMed Central PMCID: PMC356774.
22. Sleat DE, Banerjee AK. Transcriptional activity and mutational analysis of recombinant vesicular stoma-
titis virus RNA polymerase. J Virol. 1993; 67(3):1334–9. Epub 1993/03/01. PMID: 8382299; PubMed
Central PMCID: PMC237502.
23. Li J, Fontaine-Rodriguez EC, Whelan SP. Amino acid residues within conserved domain VI of the vesic-
ular stomatitis virus large polymerase protein essential for mRNA cap methyltransferase activity. J Virol.
2005; 79(21):13373–84. https://doi.org/10.1128/JVI.79.21.13373-13384.2005 PMID: 16227259;
PubMed Central PMCID: PMC1262600.
24. Grdzelishvili VZ, Smallwood S, Tower D, Hall RL, Hunt DM, Moyer SA. A single amino acid change in
the L-polymerase protein of vesicular stomatitis virus completely abolishes viral mRNA cap methylation.
J Virol. 2005; 79(12):7327–37. https://doi.org/10.1128/JVI.79.12.7327-7337.2005 PMID: 15919887;
PubMed Central PMCID: PMC1143665.
25. Li J, Wang JT, Whelan SP. A unique strategy for mRNA cap methylation used by vesicular stomatitis
virus. Proc Natl Acad Sci U S A. 2006; 103(22):8493–8. https://doi.org/10.1073/pnas.0509821103
PMID: 16709677; PubMed Central PMCID: PMC1482520.
26. Ogino T, Banerjee AK. Unconventional mechanism of mRNA capping by the RNA-dependent RNA
polymerase of vesicular stomatitis virus. Mol Cell. 2007; 25(1):85–97. https://doi.org/10.1016/j.molcel.
2006.11.013 PMID: 17218273.
27. Li J, Rahmeh A, Morelli M, Whelan SP. A conserved motif in region v of the large polymerase proteins
of nonsegmented negative-sense RNA viruses that is essential for mRNA capping. J Virol. 2008; 82
Control of VSV protein synthesis
PLOS Pathogens | https://doi.org/10.1371/journal.ppat.1007875 June 21, 2019 24 / 27

(2):775–84. https://doi.org/10.1128/JVI.02107-07 PMID: 18003731; PubMed Central PMCID:
PMC2224588.
28. Mellon MG, Emerson SU. Rebinding of transcriptase components (L and NS proteins) to the nucleocap-
sid template of vesicular stomatitis virus. J Virol. 1978; 27(3):560–7. PMID: 212581; PubMed Central
PMCID: PMC525842.
29. Emerson SU, Schubert M. Location of the binding domains for the RNA polymerase L and the ribonu-
cleocapsid template within different halves of the NS phosphoprotein of vesicular stomatitis virus. Proc
Natl Acad Sci U S A. 1987; 84(16):5655–9. https://doi.org/10.1073/pnas.84.16.5655 PMID: 2441389;
PubMed Central PMCID: PMC298921.
30. Green TJ, Zhang X, Wertz GW, Luo M. Structure of the vesicular stomatitis virus nucleoprotein-RNA
complex. Science. 2006; 313(5785):357–60. https://doi.org/10.1126/science.1126953 PMID:
16778022.
31. Green TJ, Luo M. Structure of the vesicular stomatitis virus nucleocapsid in complex with the nucleo-
capsid-binding domain of the small polymerase cofactor, P. Proc Natl Acad Sci U S A. 2009; 106
(28):11713–8. https://doi.org/10.1073/pnas.0903228106 PMID: 19571006; PubMed Central PMCID:
PMC2710649.
32. Rahmeh AA, Schenk AD, Danek EI, Kranzusch PJ, Liang B, Walz T, et al. Molecular architecture of the
vesicular stomatitis virus RNA polymerase. Proc Natl Acad Sci U S A. 2010; 107(46):20075–80. Epub
2010/11/03. https://doi.org/10.1073/pnas.1013559107 PMID: 21041632; PubMed Central PMCID:
PMC2993402.
33. Rahmeh AA, Morin B, Schenk AD, Liang B, Heinrich BS, Brusic V, et al. Critical phosphoprotein ele-
ments that regulate polymerase architecture and function in vesicular stomatitis virus. Proc Natl Acad
Sci U S A. 2012; 109(36):14628–33. Epub 2012/08/22. https://doi.org/10.1073/pnas.1209147109
PMID: 22908284; PubMed Central PMCID: PMC3437890.
34. Villarreal LP, Holland JJ. Synthesis of poly(A) in vitro by purified virions of vesicular stomatitis virus. Nat
New Biol. 1973; 246(149):17–9. PMID: 4357167.
35. Banerjee AK, Rhodes DP. In vitro synthesis of RNA that contains polyadenylate by virion-associated
RNA polymerase of vesicular stomatitis virus. Proc Natl Acad Sci U S A. 1973; 70(12):3566–70. https://
doi.org/10.1073/pnas.70.12.3566 PMID: 4357880; PubMed Central PMCID: PMC427281.
36. Schubert M, Keene JD, Herman RC, Lazzarini RA. Site on the vesicular stomatitis virus genome speci-
fying polyadenylation and the end of the L gene mRNA. J Virol. 1980; 34(2):550–9. PMID: 6246280;
PubMed Central PMCID: PMC288735.
37. Hunt DM, Smith EF, Buckley DW. Aberrant polyadenylation by a vesicular stomatitis virus mutant is due
to an altered L protein. J Virol. 1984; 52(2):515–21. PMID: 6092672; PubMed Central PMCID:
PMC254553.
38. Barr JN, Whelan SP, Wertz GW. cis-Acting signals involved in termination of vesicular stomatitis virus
mRNA synthesis include the conserved AUAC and the U7 signal for polyadenylation. J Virol. 1997; 71
(11):8718–25. PMID: 9343230; PubMed Central PMCID: PMC192336.
39. Lodish HF, Porter M. Translational control of protein synthesis after infection by vesicular stomatitis
virus. J Virol. 1980; 36(3):719–33. PMID: 6257923; PubMed Central PMCID: PMC353700.
40. Lodish HF, Porter M. Vesicular stomatitis virus mRNA and inhibition of translation of cellular mRNA—is
there a P function in vesicular stomatitis virus? J Virol. 1981; 38(2):504–17. PMID: 6264124; PubMed
Central PMCID: PMC171181.
41. Schnitzlein WM, O’Banion MK, Poirot MK, Reichmann ME. Effect of intracellular vesicular stomatitis
virus mRNA concentration on the inhibition of host cell protein synthesis. J Virol. 1983; 45(1):206–14.
PMID: 6296431; PubMed Central PMCID: PMC256403.
42. Rose JK. Complete intergenic and flanking gene sequences from the genome of vesicular stomatitis
virus. Cell. 1980; 19(2):415–21. PMID: 6244108.
43. Rose JK. Complete sequences of the ribosome recognition sites in vesicular stomatitis virus mRNAs:
recognition by the 40S and 80S complexes. Cell. 1978; 14(2):345–53. PMID: 208778.
44. Welnowska E, Castello A, Moral P, Carrasco L. Translation of mRNAs from vesicular stomatitis virus
and vaccinia virus is differentially blocked in cells with depletion of eIF4GI and/or eIF4GII. J Mol Biol.
2009; 394(3):506–21. https://doi.org/10.1016/j.jmb.2009.09.036 PMID: 19769989.
45. Lee AS, Burdeinick-Kerr R, Whelan SP. A ribosome-specialized translation initiation pathway is
required for cap-dependent translation of vesicular stomatitis virus mRNAs. Proc Natl Acad Sci U S A.
2013; 110(1):324–9. https://doi.org/10.1073/pnas.1216454109 PMID: 23169626; PubMed Central
PMCID: PMC3538191.
Control of VSV protein synthesis
PLOS Pathogens | https://doi.org/10.1371/journal.ppat.1007875 June 21, 2019 25 / 27
46. Whitlow ZW, Connor JH, Lyles DS. Preferential translation of vesicular stomatitis virus mRNAs is con-
ferred by transcription from the viral genome. J Virol. 2006; 80(23):11733–42. https://doi.org/10.1128/
JVI.00971-06 PMID: 17005665; PubMed Central PMCID: PMC1642595.
47. Irigoyen N, Firth AE, Jones JD, Chung BY, Siddell SG, Brierley I. High-Resolution Analysis of Coronavi-
rus Gene Expression by RNA Sequencing and Ribosome Profiling. PLoS Pathog. 2016; 12(2):
e1005473. https://doi.org/10.1371/journal.ppat.1005473 PMID: 26919232; PubMed Central PMCID:
PMC4769073.
48. Bercovich-Kinori A, Tai J, Gelbart IA, Shitrit A, Ben-Moshe S, Drori Y, et al. A systematic view on influ-
enza induced host shutoff. Elife. 2016; 5. https://doi.org/10.7554/eLife.18311 PMID: 27525483;
PubMed Central PMCID: PMC5028189.
49. Dai A, Cao S, Dhungel P, Luan Y, Liu Y, Xie Z, et al. Ribosome Profiling Reveals Translational Upregu-
lation of Cellular Oxidative Phosphorylation mRNAs during Vaccinia Virus-Induced Host Shutoff. J Virol.
2017; 91(5). https://doi.org/10.1128/JVI.01858-16 PMID: 28003488; PubMed Central PMCID:
PMC5309933.
50. Iverson LE, Rose JK. Localized attenuation and discontinuous synthesis during vesicular stomatitis
virus transcription. Cell. 1981; 23(2):477–84. PMID: 6258804.
51. Ball LA. Transcriptional mapping of vesicular stomatitis virus in vivo. J Virol. 1977; 21(1):411–4. PMID:
189074; PubMed Central PMCID: PMC353828.
52. Ball LA, White CN. Order of transcription of genes of vesicular stomatitis virus. Proc Natl Acad Sci U S
A. 1976; 73(2):442–6. https://doi.org/10.1073/pnas.73.2.442 PMID: 174107; PubMed Central PMCID:
PMC335925.
53. Villarreal LP, Breindl M, Holland JJ. Determination of molar ratios of vesicular stomatitis virus induced
RNA species in BHK21 cells. Biochemistry. 1976; 15(8):1663–7. https://doi.org/10.1021/bi00653a012
PMID: 178352.
54. Tani H, Mizutani R, Salam KA, Tano K, Ijiri K, Wakamatsu A, et al. Genome-wide determination of RNA
stability reveals hundreds of short-lived noncoding transcripts in mammals. Genome Res. 2012; 22
(5):947–56. https://doi.org/10.1101/gr.130559.111 PMID: 22369889; PubMed Central PMCID:
PMC3337439.
55. Chang H, Lim J, Ha M, Kim VN. TAIL-seq: genome-wide determination of poly(A) tail length and 3’ end
modifications. Mol Cell. 2014; 53(6):1044–52. https://doi.org/10.1016/j.molcel.2014.02.007 PMID:
24582499.
56. Connor JH, McKenzie MO, Parks GD, Lyles DS. Antiviral activity and RNA polymerase degradation fol-
lowing Hsp90 inhibition in a range of negative strand viruses. Virology. 2007; 362(1):109–19. Epub
2007/01/30. https://doi.org/10.1016/j.virol.2006.12.026 PMID: 17258257; PubMed Central PMCID:
PMC1995422.
57. Geller R, Andino R, Frydman J. Hsp90 inhibitors exhibit resistance-free antiviral activity against respira-
tory syncytial virus. PLoS One. 2013; 8(2):e56762. Epub 2013/03/06. https://doi.org/10.1371/journal.
pone.0056762 PMID: 23460813; PubMed Central PMCID: PMC3584091.
58. Bloyet LM, Welsch J, Enchery F, Mathieu C, de Breyne S, Horvat B, et al. HSP90 Chaperoning in Addi-
tion to Phosphoprotein Required for Folding but Not for Supporting Enzymatic Activities of Measles and
Nipah Virus L Polymerases. J Virol. 2016; 90(15):6642–56. Epub 2016/05/14. https://doi.org/10.1128/
JVI.00602-16 PMID: 27170753; PubMed Central PMCID: PMC4944277.
59. Whitesell L, Mimnaugh EG, De Costa B, Myers CE, Neckers LM. Inhibition of heat shock protein
HSP90-pp60v-src heteroprotein complex formation by benzoquinone ansamycins: essential role for
stress proteins in oncogenic transformation. Proc Natl Acad Sci U S A. 1994; 91(18):8324–8. Epub
1994/08/30. https://doi.org/10.1073/pnas.91.18.8324 PMID: 8078881; PubMed Central PMCID:
PMC44598.
60. Jez JM, Chen JC, Rastelli G, Stroud RM, Santi DV. Crystal structure and molecular modeling of 17-
DMAG in complex with human Hsp90. Chem Biol. 2003; 10(4):361–8. Epub 2003/05/03. PMID:
12725864.
61. Jin HO, Seo SK, Kim YS, Woo SH, Lee KH, Yi JY, et al. TXNIP potentiates Redd1-induced mTOR sup-
pression through stabilization of Redd1. Oncogene. 2011; 30(35):3792–801. Epub 2011/04/05. https://
doi.org/10.1038/onc.2011.102 PMID: 21460850.
62. Mata MA, Satterly N, Versteeg GA, Frantz D, Wei S, Williams N, et al. Chemical inhibition of RNA
viruses reveals REDD1 as a host defense factor. Nat Chem Biol. 2011; 7(10):712–9. Epub 2011/09/13.
https://doi.org/10.1038/nchembio.645 PMID: 21909097; PubMed Central PMCID: PMC3329801.
63. Tiwarekar V, Wohlfahrt J, Fehrholz M, Scholz CJ, Kneitz S, Schneider-Schaulies J. APOBEC3G-Regu-
lated Host Factors Interfere with Measles Virus Replication: Role of REDD1 and Mammalian TORC1
Inhibition. J Virol. 2018; 92(17). Epub 2018/06/22. https://doi.org/10.1128/JVI.00835-18 PMID:
29925665; PubMed Central PMCID: PMC6096796.
Control of VSV protein synthesis
PLOS Pathogens | https://doi.org/10.1371/journal.ppat.1007875 June 21, 2019 26 / 27

64. Knipe DM, Baltimore D, Lodish HF. Separate pathways of maturation of the major structural proteins of
vesicular stomatitis virus. J Virol. 1977; 21(3):1128–39. PMID: 191640; PubMed Central PMCID:
PMC515654.
65. Niedzwiecka A, Marcotrigiano J, Stepinski J, Jankowska-Anyszka M, Wyslouch-Cieszynska A, Dadlez
M, et al. Biophysical studies of eIF4E cap-binding protein: recognition of mRNA 5’ cap structure and
synthetic fragments of eIF4G and 4E-BP1 proteins. J Mol Biol. 2002; 319(3):615–35. https://doi.org/10.
1016/S0022-2836(02)00328-5 PMID: 12054859.
66. Jagger BW, Wise HM, Kash JC, Walters KA, Wills NM, Xiao YL, et al. An overlapping protein-coding
region in influenza A virus segment 3 modulates the host response. Science. 2012; 337(6091):199–
204. https://doi.org/10.1126/science.1222213 PMID: 22745253; PubMed Central PMCID:
PMC3552242.
67. Khaperskyy DA, Schmaling S, Larkins-Ford J, McCormick C, Gaglia MM. Selective Degradation of
Host RNA Polymerase II Transcripts by Influenza A Virus PA-X Host Shutoff Protein. PLoS Pathog.
2016; 12(2):e1005427. https://doi.org/10.1371/journal.ppat.1005427 PMID: 26849127; PubMed Cen-
tral PMCID: PMC4744033.
68. Parrish S, Moss B. Characterization of a second vaccinia virus mRNA-decapping enzyme conserved in
poxviruses. J Virol. 2007; 81(23):12973–8. https://doi.org/10.1128/JVI.01668-07 PMID: 17881455;
PubMed Central PMCID: PMC2169080.
69. Parrish S, Resch W, Moss B. Vaccinia virus D10 protein has mRNA decapping activity, providing a
mechanism for control of host and viral gene expression. Proc Natl Acad Sci U S A. 2007; 104(7):2139–
44. https://doi.org/10.1073/pnas.0611685104 PMID: 17283339; PubMed Central PMCID:
PMC1793903.
70. Lazaris-Karatzas A, Montine KS, Sonenberg N. Malignant transformation by a eukaryotic initiation fac-
tor subunit that binds to mRNA 5’ cap. Nature. 1990; 345(6275):544–7. https://doi.org/10.1038/
345544a0 PMID: 2348862.
71. Whitlow ZW, Connor JH, Lyles DS. New mRNAs are preferentially translated during vesicular stomatitis
virus infection. J Virol. 2008; 82(5):2286–94. https://doi.org/10.1128/JVI.01761-07 PMID: 18094194;
PubMed Central PMCID: PMC2258916.
72. Matlin KS, Reggio H, Helenius A, Simons K. Pathway of vesicular stomatitis virus entry leading to infec-
tion. J Mol Biol. 1982; 156(3):609–31. PMID: 6288961.
73. Superti F, Seganti L, Ruggeri FM, Tinari A, Donelli G, Orsi N. Entry pathway of vesicular stomatitis virus
into different host cells. J Gen Virol. 1987; 68 (Pt 2):387–99. https://doi.org/10.1099/0022-1317-68-2-
387 PMID: 3029282.
74. Cureton DK, Massol RH, Saffarian S, Kirchhausen TL, Whelan SP. Vesicular stomatitis virus enters
cells through vesicles incompletely coated with clathrin that depend upon actin for internalization. PLoS
Pathog. 2009; 5(4):e1000394. https://doi.org/10.1371/journal.ppat.1000394 PMID: 19390604; PubMed
Central PMCID: PMC2667253.
75. Liu SY, Sanchez DJ, Aliyari R, Lu S, Cheng G. Systematic identification of type I and type II interferon-
induced antiviral factors. Proc Natl Acad Sci U S A. 2012; 109(11):4239–44. Epub 2012/03/01. https://
doi.org/10.1073/pnas.1114981109 PMID: 22371602; PubMed Central PMCID: PMC3306696.
76. Lee AS, Kranzusch PJ, Cate JH. eIF3 targets cell-proliferation messenger RNAs for translational activa-
tion or repression. Nature. 2015; 522(7554):111–4. https://doi.org/10.1038/nature14267 PMID:
25849773; PubMed Central PMCID: PMC4603833.
77. Meyer KD, Patil DP, Zhou J, Zinoviev A, Skabkin MA, Elemento O, et al. 5’ UTR m(6)A Promotes Cap-
Independent Translation. Cell. 2015; 163(4):999–1010. https://doi.org/10.1016/j.cell.2015.10.012
PMID: 26593424; PubMed Central PMCID: PMC4695625.
78. Lee AS, Kranzusch PJ, Doudna JA, Cate JH. eIF3d is an mRNA cap-binding protein that is required for
specialized translation initiation. Nature. 2016; 536(7614):96–9. https://doi.org/10.1038/nature18954
PMID: 27462815; PubMed Central PMCID: PMC5003174.
79. Zhou J, Wan J, Gao X, Zhang X, Jaffrey SR, Qian SB. Dynamic m(6)A mRNA methylation directs trans-
lational control of heat shock response. Nature. 2015; 526(7574):591–4. https://doi.org/10.1038/
nature15377 PMID: 26458103; PubMed Central PMCID: PMC4851248.
80. Ahmed M, McKenzie MO, Puckett S, Hojnacki M, Poliquin L, Lyles DS. Ability of the matrix protein of
vesicular stomatitis virus to suppress beta interferon gene expression is genetically correlated with the
inhibition of host RNA and protein synthesis. J Virol. 2003; 77(8):4646–57. https://doi.org/10.1128/JVI.
77.8.4646-4657.2003 PMID: 12663771; PubMed Central PMCID: PMC152115.
81. Lehrach H, Diamond D, Wozney JM, Boedtker H. RNA molecular weight determinations by gel electro-
phoresis under denaturing conditions, a critical reexamination. Biochemistry. 1977; 16(21):4743–51.
Epub 1977/10/18. https://doi.org/10.1021/bi00640a033 PMID: 911786.
Control of VSV protein synthesis
PLOS Pathogens | https://doi.org/10.1371/journal.ppat.1007875 June 21, 2019 27 / 27