global analysis of gene expression changes during retinoic
TRANSCRIPT

Marshall UniversityMarshall Digital Scholar
Biochemistry and Microbiology Faculty Research
10-11-2008
Global Analysis of Gene Expression ChangesDuring Retinoic Acid-Induced Growth Arrest andDifferentiation of Melanoma: Comparison toDifferentially Expressed Genes in Melanocytes vsMelanomaMary H. EstlerMarshall University
Goran BoskovicMarshall University
James DenvirMarshall University, [email protected]
Sarah MilesMarshall University, [email protected]
Donald A. PrimeranoMarshall University, [email protected]
This Article is brought to you for free and open access by the Faculty Research at Marshall Digital Scholar. It has been accepted for inclusion inBiochemistry and Microbiology by an authorized administrator of Marshall Digital Scholar. For more information, please [email protected].
Recommended CitationEstler M, Boskovic G, Denvir J, Miles S, Primerano DA, Niles RM: Global analysis of gene expression changes during retinoic acid-induced growth arrest and differentiation of melanoma: comparison to differentially expressed genes in melanocytes vs melanoma.Bmc Genomics 2008, 9:478.

See next page for additional authors
Follow this and additional works at: http://mds.marshall.edu/sm_bmPart of the Biochemistry Commons, Biology Commons, Medical Biochemistry Commons,
Medical Cell Biology Commons, Medical Genetics Commons, Microbiology Commons, OncologyCommons, and the Other Biochemistry, Biophysics, and Structural Biology Commons

AuthorsMary H. Estler, Goran Boskovic, James Denvir, Sarah Miles, Donald A. Primerano, and Richard M. Niles
This article is available at Marshall Digital Scholar: http://mds.marshall.edu/sm_bm/31

BioMed Central
Page 1 of 12(page number not for citation purposes)
BMC Genomics
Open AccessResearch articleGlobal analysis of gene expression changes during retinoic acid-induced growth arrest and differentiation of melanoma: comparison to differentially expressed genes in melanocytes vs melanomaMary Estler, Goran Boskovic, James Denvir, Sarah Miles, Donald A Primerano and Richard M Niles*
Address: Department of Biochemistry and Microbiology, Joan C. Edwards School of Medicine, Marshall University, One John Marshall Drive – BBSC, Huntington, WV 25755, USA
Email: Mary Estler - [email protected]; Goran Boskovic - [email protected]; James Denvir - [email protected]; Sarah Miles - [email protected]; Donald A Primerano - [email protected]; Richard M Niles* - [email protected]
* Corresponding author
AbstractBackground: The incidence of malignant melanoma has significantly increased over the last decade. Some ofthese malignancies are susceptible to the growth inhibitory and pro-differentiating effects of all-trans-retinoic acid(RA). The molecular changes responsible for the biological activity of RA in melanoma are not well understood.
Results: In an analysis of sequential global gene expression changes during a 4–48 h RA treatment of B16 mousemelanoma cells, we found that RA increased the expression of 757 genes and decreased the expression of 737genes. We also compared the gene expression profile (no RA treatment) between non-malignant melan-a mousemelanocytes and B16 melanoma cells. Using the same statistical test, we found 1495 genes whose expression wassignificantly higher in melan-a than in B16 cells and 2054 genes whose expression was significantly lower in melan-a than in B16 cells. By intersecting these two gene sets, we discovered a common set of 233 genes whose RNAlevels were significantly different between B16 and melan-a cells and whose expression was altered by RAtreatment. Within this set, RA treatment altered the expression of 203 (87%) genes toward the melan-aexpression level. In addition, hierarchical clustering showed that after 48 h of RA treatment expression of the 203genes was more closely related to the melan-a gene set than any other RA treatment time point. Functionalanalysis of the 203 gene set indicated that RA decreased expression of mRNAs that encode proteins involved incell division/cell cycle, DNA replication, recombination and repair, and transcription regulation. Conversely, itstimulated genes involved in cell-cell signaling, cell adhesion and cell differentiation/embryonic development.Pathway analysis of the 203 gene set revealed four major hubs of connectivity: CDC2, CHEK1, CDC45L andMCM6.
Conclusion: Our analysis of common genes in the 48 h RA-treatment of B16 melanoma cells and untreated B16vs. melan-a data set show that RA "normalized" the expression of genes involved in energy metabolism, DNAreplication, DNA repair and differentiation. These results are compatible with the known growth inhibitory andpro-differentiating effects of RA. Pathway analysis suggests that CDC2, CHEK1, CDC45L and MCM6 are keyplayers in mediating the biological activity of RA in B16 melanoma cells.
Published: 11 October 2008
BMC Genomics 2008, 9:478 doi:10.1186/1471-2164-9-478
Received: 11 June 2008Accepted: 11 October 2008
This article is available from: http://www.biomedcentral.com/1471-2164/9/478
© 2008 Estler et al; licensee BioMed Central Ltd. This is an Open Access article distributed under the terms of the Creative Commons Attribution License (http://creativecommons.org/licenses/by/2.0), which permits unrestricted use, distribution, and reproduction in any medium, provided the original work is properly cited.

BMC Genomics 2008, 9:478 http://www.biomedcentral.com/1471-2164/9/478
Page 2 of 12(page number not for citation purposes)
BackgroundMalignant melanoma is one of the fastest rising cancers inthe US population and its yearly incidence is estimated at60,000 [1]. If it is diagnosed early and is restricted to theepidermis, surgical resection can yield high cure rates.However, once the melanoma invades through the base-ment membrane into the dermis, surgical resection is lesssuccessful and there is no effective radio/chemotherapyfor patients with metastatic melanoma.
Vitamin A (retinol) is an essential nutrient that is requiredfor night vision, reproduction, embryogenesis and differ-entiation [2]. Retinol is metabolized by cells into anumber of compounds, the most biologically active beingall-trans-retinoic acid (RA). The biological changesinduced by RA are mediated by binding and activation ofnuclear receptors [3,4]. There are three subtypes of retin-oic acid receptors (RAR); RAR-α, β and γ, which bind RA.Another vitamin A metabolite, 9-cis RA, also binds thesereceptors but in addition serves as the ligand for closelyrelated nuclear receptors, the retinoid × receptors (RXRs)[5,6]. Analogous to the RARs, there are three RXR sub-types, α, β and γ [7]. RXRs form heterodimers with theRARs as well as with several other members of the nuclearhormone receptor family, such as Peroxisome ProliferatorActivated Receptor (PPAR) [8], vitamin D3 [9] and thy-roid hormone receptors [10]. The RXR:RAR heterodimerappears to be the physiologically relevant dimer for stim-ulating target gene expression [11]. This receptor het-erodimer binds to a DNA element in the 5' flanking regionof target genes and usually consists of a direct repeat of thesequence 5'-(A/G)G(G/T)TCA-3' separated by 5 bp[12,13]. These receptors are also regulated by co-repres-sors and co-activators. Several of the co-activators containhistone acetyltransferase activity, while co-repressor com-plexes contain histone deacetylase activity, suggesting thatlocalized chromatin remodeling modulates receptor activ-ity [14].
RA inhibits the proliferation and stimulates the differenti-ation of many different tumor cell lines, including murineand human melanoma cells [15]. We have previouslyused B16 mouse melanoma as a model for our retinoidstudies. This cell line is very responsive to the growth
inhibitory and pro-differentiating effects of retinoic acid[16]. The B16 cell line also has major deletions in thep16INK4a and p19QRFgenes with consequent loss of expres-sion of these proteins, but it lacks an activating mutationin the BRAF gene [17]. Loss of p16INK4a and p19ORF con-tributes to melanomagenesis by overcoming senescence[18]. In addition, activating BRAF mutations have beenfound in up to 60% of sporadic human melanomas [19].We have found that our strain of B16 melanoma has anactivating N-ras mutation (Niles et al., unpublished).Thus B16 cells have a number of the genetic/proteinchanges found in human melanoma cell lines and clinicalmelanoma specimens.
Melan-a cells are nonmalignant mouse melanocytesderived from C57BL/6 mice (the same origin as B16melanoma) that have been partially immortalized. Theyhave diploid chromosomes and do not form tumors insyngeneic or athymic mice [20]. Therefore melan-a cellsserve as a good model to compare gene expression profilesto B16 melanoma cells with the aim of identifying geneswhose altered expression might contribute to malignancy.In the study reported here, we used DNA microarrays tocompare gene expression patterns between B16 andmelan-a cells. We also used DNA microarrays to identifytime-dependent changes in gene expression during RA-induced growth arrest and differentiation of B16melanoma cells. From these two data sets, we then per-formed an analysis to identify a unique gene set, whoseexpression was altered in B16 compared to melan-a andwhose expression was restored toward the melan-a levelin RA-treated B16 melanoma cells.
ResultsTime-dependent regulation of gene expression by RAOur previous studies [21] have determined the amount oftime required for RA to induce significant growth arrestand differentiation of B16 melanoma cells to be 48 – 72h. Using DNA microarrays, we profiled the series ofchanges in gene expression that occurred in RA-treatedcells prior to and coincident with these phenotypicchanges. Table 1 shows the number of genes significantlyup-regulated or down-regulated at 4, 10, 24, and 48 h ofRA treatment in B16 melanoma cells. The statistical anal-
Table 1: Numbers of genes significantly differentially expressed relative to untreated B16 cellsa
Retinoic Acid Treatment melan-a vs. B16
4 hour 10 hour 24 hour 48 hour
Upregulated 13 25 151 701 1495Downregulated 1 3 3 734 2054Total 14 28 154 1435 3549
a Significance was determined by Significance Analysis of Microarrays (SAM) with median false discovery rate of 10%, and a minimum fold change of 1.5.

BMC Genomics 2008, 9:478 http://www.biomedcentral.com/1471-2164/9/478
Page 3 of 12(page number not for citation purposes)
ysis of microarrays (SAM) method [22] was used to deter-mine significance in all microarray studies reported in thiscommunication. Only 14 genes were differentially regu-lated at the 4 hour time point. This set includes two genes,RARβ and retinal short chain dehydrogenase 3 (DHRS3),whose expression has previously been shown to beinduced by RA [23,24]. The number of RA-regulated genesincreases over time, with the largest increase between the24 h and 48 h time points. The number of upregulatedgenes exceeds the downregulated genes at all time pointsexcept the 48 h time point. A few genes (RARβ andDHRS3) were up- or down-regulated during the entiretime of retinoic acid treatment, but more commonly,genes exhibited altered expression for one or two timepoints and then their expression returns to control levels.The identity of these RA-regulated genes can be found inAdditional file 1.
Expression profiling of untreated melan-a nonmalignant mouse melanocytes vs. B16 mouse melanoma cellsMelan-a and B16 cells are both derived from the C57BL/6strain of mouse. The melan-a cells are partially immortal-ized, but they are diploid, lack transformed cell pheno-types and do not form tumors in syngeneic mice [20]. Acomparison of global gene expression between these twomelanocyte/melanoma cell lines has not been reported.Our analyses show that 1495 genes had expression levelssignificantly higher in melan-a vs. B16 cells, i.e. theirexpression was downregulated in the malignantmelanoma cells relative to the non-malignant cells (Table1). In addition, there were 2054 genes whose expressionlevels were significantly lower in melan-a cells vs. B16cells, i.e. their expression was upregulated in the malig-nant melanoma cells. The identity of these differentiallyregulated genes can be found in Additional file 2.
Gene expression changes induced by RA treatment of B16 cells that mimic expression in Melan-a cells: the intersecting gene setWe combined data sets from RA-treated B16 melanomacells and untreated melan-a vs. B16 data sets in order todiscover common genes that were significantly changed inboth sets (Table 2). There were 71 genes that were upreg-ulated in melan-a compared to B16 cells and whoseexpression was upregulated by RA treatment of B16 cells
at one or more time point. There were however a smallnumber of genes (16) whose expression was downregu-lated in B16 compared to melan-a and whose expressionwas also decreased by RA treatment of B16 cells. Likewise,there were 132 genes whose expression was downregu-lated in melan-a cells compared to B16 cells and whoseexpression was decreased by RA treatment of B16 cells.Again, a small number of genes (14) had increased expres-sion in B16 vs. melan-a and treatment of B16 cells with RAfurther enhanced their expression. Overall, the majority ofgenes in this combined data set (203 out of 233) werethose whose expression was restored toward the melan-a(non-malignant melanocyte) level when B16 melanomacells were treated with RA for 48 h. Three of the 203 genes(DHRS3, calcium/calmodulin-dependent protein kinaseII inhibitor 1 (CAMK2N1) and RIKEN cDNA3110001A13) were upregulated by RA at 4 h. The identi-ties of these 203 genes, their fold changes at 48 h of RAtreatment and their relative expression in melan-a vs. B16cells are shown in Additional file 3.
We determined if members of the 203 gene set wereenriched in known biological processes listed in the GeneOntology database by using the Fisher Exact Test in Ari-adne Genomics Pathway Studio. Additional file 4 pro-vides a list of these processes ordered by statisticalsignificance. The five biological processes which weremost significant are cell division, cell cycle, cell cycle reg-ulation, DNA replication and mitosis. In these processes,all genes were expressed higher in B16 than in melan-acells. Examination of members within the processesreveals gene products that are clearly involved in promot-ing the cell division and DNA replication. For example, inthe DNA replication set, 12 of the 13 genes encode pro-teins known to function directly in DNA synthesis ornucleotide metabolism (TOP2A, MCM2, MCM4, MCM6,CDC6, POLA, POLE, CDC45L, DUT, RNASEH2A, RPA1and ZRF1). The identity of each gene within the five proc-esses is given in Additional file 5. Several significant bio-logical processes (protein phosphorylation, proteolysis,apoptosis induction cell-cell signaling) contained genesthat were overexpressed in melan-a cells. These findingsare consistent with the more rapid doubling of B16 (16hours in log phase) in contrast to melan-a cells (28 hoursin log phase). The total number of genes in both columns
Table 2: Numbers of genes in the intersections of gene sets generated by the two experiments
Over-expressed in melan-a v B16 Under-expressed in melan-a v B16 Total
Upregulated by RA treatment 71 14 85Downregulated by RA treatment 16 132 151Total 87 149 233
In both the experiment comparing gene expression in RA-treated B16 cells to that in untreated B16 cells, and the experiment comparing gene expression in melan-a cells to that in B16 cells, significance is determined by SAM with median false discovery rate of 10%, and a minimum fold change of 1.5. Table entries in bold represent genes for which treatment by RA changes the expression in B16 cells towards that in melan-a cells.

BMC Genomics 2008, 9:478 http://www.biomedcentral.com/1471-2164/9/478
Page 4 of 12(page number not for citation purposes)
is greater than 203 because several genes are present inmore than one process.
We confirmed the authenticity of the microarray-meas-ured expression changes for seven genes within the 203gene set by quantitative real time polymerase chain reac-tion (qRT-PCR) (Table 3). All gene expression changesexcept for the PLAT melan-a vs. B16 ratio were verified bythese independent analyses. Protein Kinase C alpha(PKCα), not listed here, but a member of the 203 gene set,has previously been verified by us using both Northernand Western analysis [25]. It is interesting to note that inmost instances, the reported degree of difference in geneexpression between melan-a vs. B16 or RA treatment at 48h is greater by qRT-PCR analysis than by microarray anal-ysis. Thus the microarray technology tends to underesti-mate changes in gene expression between the comparisongroups. This phenomenon has been previously reportedby Yuen et al. [26].
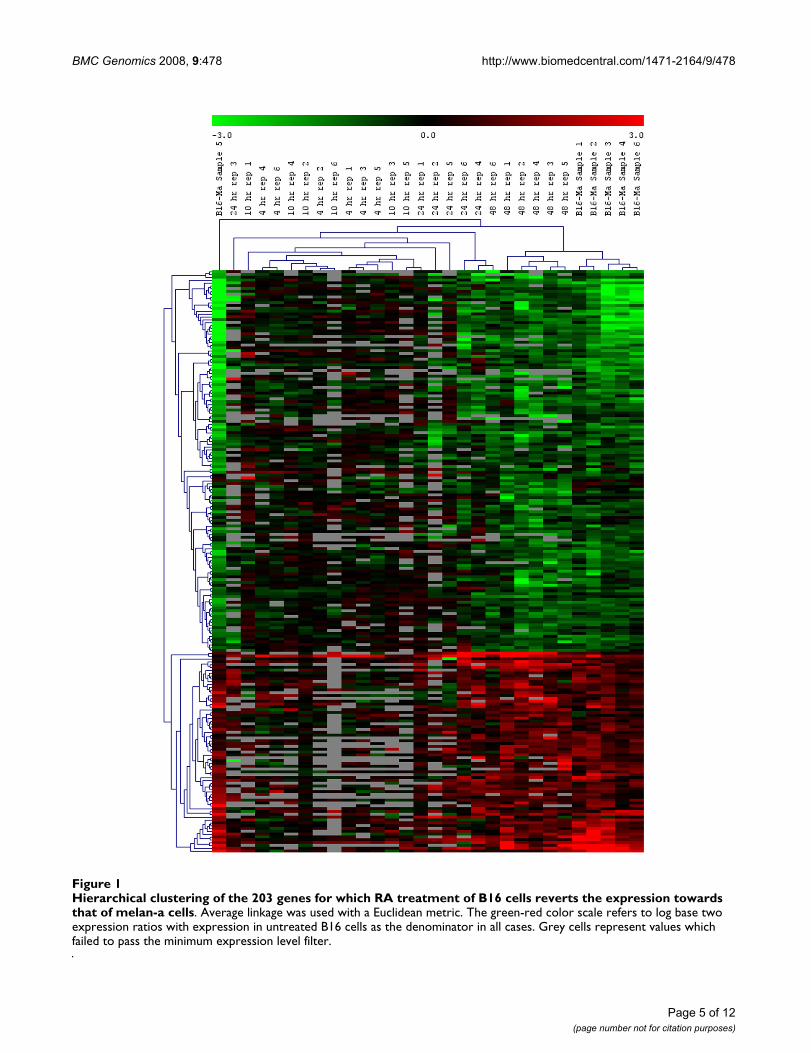
Clustering and pathway analysisHierarchical clustering of the 203 genes over all 30 arrays(six replicates each of the RA-treated cells at 4 h, 10 h, 24h, and 48 h, and six replicates of the melan-a cells com-pared to untreated B16 cells) is shown in Fig. 1. Weobserved that the 4 and 10 hours arrays tend to clustertogether, indicating that there is little overall expressiondifference between these two time points. However, the 4hour arrays and 10 hour arrays considered as a single setform a tight cluster, indicating that the expression at the 4-and 10-hour time points is significantly different fromlater time points. The majority of the 48 h arrays form asingle cluster, as do the majority of the arrays comparingmelan-a expression to B16 expression. Furthermore, theexpression at the 48 h time point for these 203 genes iscloser to the expression in melan-a cells than to any of theRA-treated cells at other time points. The arrays at 24 h donot form a cluster, indicating that there is much greatervariation in expression at this time point than at the othertime points or in the melan-a expression profile.
Lastly we used Pathway Studio v5.0 (Ariadne Genomics)program to identify and illustrate molecular connectionsbetween the proteins encoded by the 203 gene set. Thisprogram searches through the ResNet database for allknown interactions between genes/proteins such as phys-ical interaction, regulation of expression and proteinmodification (e.g. phosphorylation) and expresses theresult in graphical form (Fig. 2). We calculated the statis-tical significance of the number of interactions, account-ing for the number of known interactions in the PathwayStudio database. Those with Holm-Bonferroni adjusted p< 0.05 are shown in Table 4. Based on the most significantp-values, we identified four major "hubs" for connectivity;cell division cycle 2 protein (CDC2), checkpoint kinase1(CHEK1), CDC45 cell division cycle 45-like (CDC45L)and minichromosome maintenance deficient protein 6(MCM6). Three hubs with relatively high numbers ofinteractions (p53 protein (TP53), cyclin-dependentkinase inhibitor 1A protein (CDKN1A/p21/WAF1/CIP1)and CMYC protein) also met our criteria for statistical sig-nificance but with lower p-values.
DiscussionRA has the ability to induce differentiation and/or growtharrest in a variety of cancer cells [15]. However, the genesand pathways that mediate the biological effects of RAhave not been fully elucidated. B16 mouse melanomacells are very sensitive to RA treatment and respond byundergoing growth arrest and differentiation [16]. In thisstudy we used mouse DNA microarrays to determine thetime-dependent changes in gene expression in control vs.RA-treated B16 mouse melanoma cells. Our results showa small number of changes, mostly increases, in geneexpression at early time points (4–10 h).
There was a major increase in the number of genes whoseexpression changed at 48 h of RA treatment and at thistime point genes that were downregulated outnumberedthose that were upregulated. To our knowledge, this is thefirst reported study of time-dependent changes in geneexpression in RA-treated melanoma cells. Other studies
Table 3: Validation of microarray-based mRNA levels by qRT-PCR
Microarray qRT-PCR
Gene Accession Number B16 48 h RA vs. control melan-a vs. B16 B16 48 h RA vs. control melan-a vs. B16
BRCA2 NM_009765 0.30 0.36 0.301 0.0938CDC2A NM_007659 0.40 0.22 0.298 0.0311TOP2A NM_011623 0.50 0.11 0.226 0.00668TINAGL NM_023476 3.70 4.00 1.81 5.64PLAT NM_008872 2.10 3.33 3.15 1.43*DHRS3 NM_011303 4.60 2.70 4.89 133FGF1 NM_010197 2.20 2.27 3.53 2.35
All qRT-PCR values were significant by Bonferroni-corrected (n = 14) T-test with p < 0.01 with the exception of starred (*) value.
BMC Genomics 2008, 9:478 http://www.biomedcentral.com/1471-2164/9/478
Page 5 of 12(page number not for citation purposes)
Hierarchical clustering of the 203 genes for which RA treatment of B16 cells reverts the expression towards that of melan-a cellsFigure 1Hierarchical clustering of the 203 genes for which RA treatment of B16 cells reverts the expression towards that of melan-a cells. Average linkage was used with a Euclidean metric. The green-red color scale refers to log base two expression ratios with expression in untreated B16 cells as the denominator in all cases. Grey cells represent values which failed to pass the minimum expression level filter.

BMC Genomics 2008, 9:478 http://www.biomedcentral.com/1471-2164/9/478
Page 6 of 12(page number not for citation purposes)
have examined time-dependent gene expression changesin human embryonal carcinoma cells [27], F9 teratocarci-noma cells [28], and mouse skin [29] treated with RA.Similar to our results, a much larger number of genes hadaltered expression at 24–48 h of RA treatment. Compari-son of the identity of RA-regulated genes in these studieswith those reported here reveal some commonality ofgenes such as RAR-β2, PKCα and insulin-like growth fac-tor binding protein 6, but also a number of different geneexpression changes. Possible explanations for these differ-
ences are analysis of different cell types, use of differentmicroarray platforms and different methods of statisticalanalysis.
In the hierarchical clustering analysis (Fig. 1) the 4 and 10h RA-treated B16 cell-gene expression changes formed atight cluster as do the 48 h RA-treated B16 cell genechanges. However, the changes in gene expression in 24 hRA-treated B16 cells did not form a cluster. This impliesmore variability in gene expression around this time of RAtreatment, possibly because there are dramatic changes ingene expression around this time point.
The second microarray data set is a comparison betweengene expression in untreated B16 mouse melanoma cellsand melan-a mouse melanocytes. Both of these cell linesare derived from the same C57BL/6 inbred mouse strain.The melan-a cells have a longer replicative life-span thanprimary mouse melanocytes before they enter senescence[20]. Significant differences in expression are found ingenes encoding cell cycle regulatory proteins, DNA metab-olism, and DNA repair enzymes. There have been anumber of studies comparing gene expression profiles inhuman melanocytes to human melanoma cell lines[30,31] and human nevus tissue to various stages ofhuman melanoma tumors from patients [32,33], but verylittle information is available comparing expression pro-files in mouse melanocytes with mouse melanoma cells.Despite the species difference, a number of genes whichhad altered expression in human melanocytes vs. humanmelanoma cells, such as CDC2, C-MYC, DNA repairenzymes and differentiation/embryonic markers, werefound to be altered in the expression profiles betweenmelan-a and B16 cells. Our findings suggest that B16melanoma cells serve as a valid model for studyinghuman melanoma
We sought to determine whether there were commongenes between the microarray data set generated from RAtreatment of B16 melanoma cells and the microarray dataset comparing the gene expression of melan-a to B16 cells.We found that there were 233 genes in common betweenthese two data sets. Within this group, the large majority,203 genes, (87%) had their expression altered by RA treat-ment of B16 melanoma cells toward the levels found inmelan-a cells. In general, RA treatment decreases theexpression of genes involved in cell division/cell cycle,DNA replication and repair, and transcription regulation.It also decreases expression of the genes involved in DNArecombination and protein folding. In contrast, RAincreases the expression of genes that regulate cell-cell sig-naling, cell adhesion and cell differentiation and develop-ment. Considering that RA inhibits cell replication andstimulates differentiation, these RA-induced changes ingene expression reflect the reprogramming of the B16 cells
Table 4: Number of interactions among genes in the 203 gene set
Gene Number of Interactions Adjusted p-value
CDC2 17 1.25 × 10-08
CHEK1 9 1.05 × 10-07
CDC45L 5 1.03 × 10-06
MCM6 5 1.98 × 10-05
P21 13 2.66 × 10-05
MCM4 5 6.96 × 10-05
CDC6 6 1.70 × 10-04
GADD45B 4 3.44 × 10-04
CMYC 13 5.55 × 10-04
PLAT 6 6.17 × 10-04
FGF1 5 1.50 × 10-03
CDC25B 4 3.11 × 10-03
MCM2 4 8.50 × 10-03
STAT2 11 0.0119
BRCA2 7 0.0334
SPA9A 2 0.0361
P53 19 0.0366
TIMM23 2 0.0367
GMNN 3 0.0407
AGT 10 0.0436
Genes listed are those which have a statistically significant number of interactions according to Fisher's Exact Test with Holm-Bonferroni adjusted p-value < 0.05.

BMC Genomics 2008, 9:478 http://www.biomedcentral.com/1471-2164/9/478
Page 7 of 12(page number not for citation purposes)
Pathway Studio Analysis of 203 Gene SetFigure 2Pathway Studio Analysis of 203 Gene Set. Out of 203 genes, 74 genes were found to be involved in direct interactions. Protein hubs which have most significant interactions (CDC2, CHEK1, CDC45L and MCM6) are marked with an asterisk (*). Although there are relatively large numbers of interactions stemming from TP53, P21 and CMYC, these proteins were not among the most statistically significant hubs. Green color indicates a gene is upregulated in melan-a relative to B16 whereas red color indicates that a gene is downregulated in melan-a relative to B16. Color intensity reflects the expression ratio.

BMC Genomics 2008, 9:478 http://www.biomedcentral.com/1471-2164/9/478
Page 8 of 12(page number not for citation purposes)
toward the melan-a (normal) phenotype. The reversion isnot complete since some genes whose expression isdecreased in B16 melanoma cells relative to melan-a cells(e.g. cell adhesion and extracellular matrix proteins) arenot regulated by RA. Finally, we note that only three geneswithin the 203 gene set were differentially regulated by RAat 4 h. (1) DHRS3, a member of SDR family, encodes anenzyme which catalyzes the reduction of all trans-retinalto all-trans-retinol in the presence of NADPH and is highlyexpressed in the retina [34]. (2) Mouse CAMK2Nl mRNAis induced 2.2 fold by RA at 4 h and is downregulated 3.8fold in B16 relative to melan-a cells. This protein exhibitsstrong similarity (97.44%) to the human CAMKIINαwhich has been shown to inhibit cell cycle progression inS phase in human colon adenocarcinoma cells [35]. (3)Although RIKEN cDNA 3110001A13 had significanthomology to human, chimp, macaque and rat cDNAs(Blast search results not shown), no function has beenascribed to its predicted protein.
To determine the pathway(s) that mediate the effect of RAinhibition of cell proliferation and stimulation of differ-entiation, we used Pathway Studio v5.0 software to dis-cover relationships between the proteins encoded by the203 gene set. We found 74 genes (36%) whose encodedproteins have known connections either through physicalinteraction, regulation of gene expression or protein mod-ification (e.g. phosphorylation). These interactions clus-tered around four major "hub" proteins: CDC2, CHEK1,CDC45L and MCM6. We note that even though these fourproteins had small numbers of partners, by using theFisher Exact Test we found that these hubs were statisti-cally enriched for molecular interactions. In addition,three other proteins p53, p21 and CMYC appear to beimportant since they have large numbers of known inter-actions. Zhang and Rosdahl [36] found that RA treatmentof human melanoma cells increased the expression ofp53, while Vertuani et al. [37] observed p53 to beincreased in RA-treated human uveal melanoma cells.Likewise there are numerous reports that RA alters theexpression of p21WAF-1/CIP-1 in a variety of tumor cells[38,39]. Gompel [40] found that RA decreases the expres-sion and activity of CDK1 (CDC2) and there are a varietyof studies showing that RA inhibits the expression of C-MYC [41,42]. In contrast, no evidence has been publishedthat RA regulates CHEK1 gene expression. CHEK1 isinvolved in stopping cells from progressing through thecell cycle while DNA damage is repaired. Increased expres-sion of this gene is frequently associated with resistance tochemotherapy [43]. A search of the PubMed databaserevealed no publications linking retinoic acid to the regu-lation of MCM6 or CDC45L. Further analysis of the time-dependent changes in RA-induced gene expression isneeded to define the sequence of pathways that lead toRNA expression levels found in the 203 gene set.
ConclusionOur study has shown that RA regulates the expression of4.8% of the total known mouse genes in B16 mousemelanoma cells over the course of 48 h of treatment.Alteration of the expression of these genes is associatedwith RA-induced growth arrest and differentiation of B16mouse melanoma cells. We also found that ~13.7% of thetotal known mouse genes were differentially expressed inmelan-a mouse melanocytes vs. B16 mouse melanomacells. In comparing these two data sets, we found 233common genes. Within this set, 203 genes in B16melanoma cells had their RNA expression "normalized"toward the melan-a level by treatment with RA. Pathwayanalysis of the proteins encoded by this 203 data setrevealed that 32% are involved in common interactions.The major hubs of connectivity are centered aroundCDC2, CHEK1, CDC45L and MCM6. It is likely that thesefour genes and their encoded proteins play a major role inRA-induced growth arrest and differentiation of B16mouse melanoma cells.
MethodsCell cultureB16 mouse melanoma cells obtained from the AmericanType Culture Collection were grown in DMEM (Invitro-gen, Carlsbad, CA), supplemented with 10% bovine calfserum (Hyclone Laboratories, Logan, UT) at 37°C in a 5%CO2/95% air humidified atmosphere. Cells were treatedfor 4, 10, 24, and 48 h with 10 μM RA (Fluka ChemicalCorp., Ronkonkoma, NY). Control cells received the solu-bilization vehicle, DMSO. All manipulations involvingRA were conducted under subdued lighting or yellowlights in order to minimize photo-oxidation. Melan-acells (non-malignant mouse melanocytes) were a gener-ous gift from Dr. Dorothy Bennett (St. George's Hospital,London, England). They were grown in RPMI 1640medium with 5% fetal bovine serum supplemented with200 nM phorbol 12-myristate 13-acetate plus antibiotics.
RNA extraction and DNA microarray analysisControl and RA-treated B16 cells were harvested at 4, 10,24, and 48 h of treatment. Melan-a and B16 cells wereseeded at appropriate cell numbers so that at harvest (72h after seeding) they would be at approximately the samedegree of confluence on the tissue culture dishes. RNA wasextracted using TRI Reagent (Sigma Chemical Co., St.Louis, MO) according to the manufacturer's suggestedprotocol. RNA quality was assessed by electrophoreticanalysis on an Agilent Model 2100 Bioanalyzer (SantaClara, CA). All RNA samples used for expression profilinghad RNA Integrity Numbers greater than 9.
MWG Biotech (Ebersberg, Germany) Mouse 30K arrayswere used to identify genes in B16 melanoma whoseexpression was altered by treatment with 10 μM RA for the

BMC Genomics 2008, 9:478 http://www.biomedcentral.com/1471-2164/9/478
Page 9 of 12(page number not for citation purposes)
various time periods using a balanced block design. Alltreatments were repeated 6 times to provide biologicalreplicates for the microarray analysis. Labeled cDNAswere prepared from total RNA using the Invitrogen Super-Script II direct cDNA labeling system in the presence ofeither Cyanine-3 (Cy3) dCTP or Cyanine-5 (Cy5) dCTP(Perkin Elmer, Waltham, MA). For each time point, threeof the arrays were hybridized with Cy3 labeled cDNAfrom the untreated cells and Cy5 labeled cDNA fromtreated cells. The remaining three arrays were hybridizedwith the labeling reversed to eliminate the effects of differ-ential dye incorporation. The amounts of dye incorpo-rated into cDNA were measured on a NanoDropspectrophotometer (ThermoFisher Scientific, Pittsburgh,PA). Equimolar amounts of Cy3 and Cy5 labeled cDNAswere combined and added to MWG hybridization solu-tion. This solution was heated for 3 min. at 95°C, cooledon ice for 3 min., and added to the microarray slide.Hybridizations were carried out for 16 h at 42°C on aGeneTAC hybridization station (Genomic Solutions, AnnArbor, MI). Slides were washed on the automated hybrid-ization station according to a Genomic Solutions proto-col. Slides were scanned on a PerkinElmer ScanArrayExpress Microarray Scanner.
For the melan-a vs. B16 melanoma expression profiles, weemployed the same balanced block design with a dyeswap using six biological replicates. Equimolar amountsof the Cy3 and Cy5 labeled cDNAs were loaded onto Agi-lent Whole Mouse Genome Arrays, and hybridized for 17h at 60°C using a MAUI hybridization system (BioMi-croSystems, Salt Lake City, UT). The microarray slideswere then washed using Agilent Gene Expression WashBuffer and scanned using a Perkin Elmer ScanArrayExpress scanner.
Statistical Analysis of Microarray DataFeature intensities for the RA time course were extractedfrom the scanned image using PerkinElmer ScanArraysoftware with the default lowess normalization settings;for melan-a vs. B16 comparisons, intensities wereextracted using ImaGene software (BioDiscovery, El Seg-undo, CA). All extracted data were exported to MicrosoftExcel (Microsoft Corporation, Redmond, WA) as tabdelimited files. For each feature, a low intensity filter wasapplied in which data were only included if the total back-ground-subtracted intensity of the two channels wasgreater than 400. The log base 2 of the expression ratios ofRA-treated samples to untreated samples or the log base 2of the expression ratios of melan-a samples to B16 sam-ples were computed, and assembled into a single tab-delimited file for each comparison. Each file wasimported to the Multiple Experiment Viewer (MeV) v4.0[44] to perform statistical analysis.
Calculated log ratios were compared for significant devia-tion from zero using one-class Significance Analysis ofMicroarrays (SAM) [22]. This analysis was performedindependently at each time point for the RA treatmentexperiments and for the melan-a vs. B16 experiment. Ineach case, only probes for which at least three of the sixreplicates passed the low intensity filter were included inthe analysis. SAM was performed with the maximumnumber of unique permutations available, and delta val-ues were chosen to give a median False Discovery Rate of10%. All other parameters were set to the MeV defaults.Features found to be statistically significant by this analy-sis were subsequently filtered for a minimum fold changegreater than 1.5. In both array platforms, a number ofgenes are represented by multiple probes. Additionally, anumber of identical probes are represented as multiplefeatures on the array. For genes which were determined tobe significantly differentially expressed and which wererepresented by multiple features on the array, we reportthe feature with the largest fold change. In the melan-a vs.B16 comparison, three genes represented by multiple fea-tures were reported to be significantly differentiallyexpressed with some features showing overexpression inmelan-a and some showing underexpression in melan-a.These genes, which were not reported as significantly dif-ferentially expressed at any time point in the RA treatmentcomparison, were eliminated from the results as beinginternally inconsistent.
We compiled a set of all genes differentially regulated byRA at one or more time points and intersected this set withthose genes differentially expressed in the melan-a vs. B16cell experiment. We restricted this intersection to thosegenes which were upregulated by RA and overexpressed inmelan-a cells OR which were downregulated by RA andunderexpressed in melan-a cells. Hierarchical clusteringwas performed on the resulting gene set using MeV. Bothgene clusters and sample clusters were computed usingthe Euclidean metric and average linkage. Microarray datamay be accessed at the NCBI Gene Expression Omnibus(GEO) database (accession # GSE11588).
Independent verification of gene expression changesWe selected seven genes from the 203 gene set to validatethe microarray results. Total RNA was extracted fromuntreated and 48 h RA-treated B16 cells and melan-a cellsas described above. qRT-PCR assays were used to measureexpression of the selected genes. For qRT-PCR, total RNAwas reverse transcribed into cDNA with the Advantage RT-for-PCR system (Clontech, Mountain View, CA) in thepresence of random primers. The real time amplificationswere carried out using a TaqMan Universal PCR Master-mix (ABI, Foster City, CA) and TaqMan probes specific forBRCA2, CDC2A, TINAGL, PLAT, TOP2A, DHRS3 andFGF1. All amplifications were performed on an ABI Model

BMC Genomics 2008, 9:478 http://www.biomedcentral.com/1471-2164/9/478
Page 10 of 12(page number not for citation purposes)
7000 Sequence Detection System with the followingcycles: 95°C for 10 min, and 40 cycles of 95°C for 15 sand 60°C for 1 min. Each assay was performed in tripli-cate and resulting qRT-PCR data was analyzed used amodification of the ΔΔCt method that accounts for varia-tions in primer efficiency [45]. 18S rRNA was used as thereference gene for all normalizations. p values were com-puted for the RA-treated and melan-a ΔCt values com-pared by T test to the untreated B16 ΔCt values andcorrected by Bonferroni correction for multiple hypothe-sis testing.
Pathway analysisIn order to identify molecular interactions among the pro-tein products of 203 genes, we entered the expression datafrom these genes into Pathway Studio software [Rockville,MD] and set the analysis for the identification of directinteractions within the gene set. We used Fisher's ExactTest as implemented by Pathway Studio to determine thep-value associated with the biological processes, and sub-sequently adjusted for multiple hypothesis testing usingthe Holm-Bonferroni method [46] with an overall type-1error rate of 0.05. In order to determine statistical signifi-cance of the "hubs" in the graphical output, we directlyimplemented Fisher's Exact Test with the same parametersusing custom-written Java code. The Holm-Bonferroniadjusted p-values reported for the hubs indicate the signif-icance level for the number of connections to other genesin our set, accounting for the number of known connec-tions in the Pathway Studio database.
Competing interestsThe authors declare that they have no competing interests.
Authors' contributionsME conducted the time-course treatment of B16melanoma cell with RA, and did the classification of RA-regulated genes for biological function. GB conducted allof the microarray experiments, carried out the data extrac-tion and performed the pathway interaction analysis. JDwas responsible for the statistical analysis of significanceof all gene expression changes on the microarrays, as wellas the hierarchical clustering. SM performed all the exper-iments using qRT-PCR to confirm the microarray resultsfor the seven selected genes. DP had overall responsibilityfor the execution of the microarray assays and statisticalanalyses of the data. RMN wrote the manuscript and wasresponsible for the overall design of the project and datainterpretation. All authors read and approved the finalmanuscript.
Additional material
AcknowledgementsThe authors wish to thank Margaret McFarland for her help in preparing some of the illustrations. We also thank Dr. Dorothy Bennett, St. George's Hospital, University of London for providing the melan-a cells. This work was supported in part by NIH NCRR grants 5P20RR020180 awarded to RMN and 5P20RR016477 which supports the WV-INBRE program and the Marshall University Genomics Core Facility. Points of view in this docu-
Additional file 1List of genes whose expression is significantly regulated by RA treat-ment at one or more time point. Statistical significance is determined by SAM with a false discovery rate of 10%, and a minimum fold change of 1.5. Average fold changes across six replicates are reported for significant changes only. Gene IDs (first column) are linked to search pages at the National Center for Biotechnology Information.Click here for file[http://www.biomedcentral.com/content/supplementary/1471-2164-9-478-S1.htm]
Additional file 2List of genes whose expression is significantly different between the melan-a and B16 cell lines. Statistical significance is determined by SAM with a false discovery rate of 10% and a minimum fold change of 1.5. Average fold changes across six replicates are reported. Gene IDs (first column) are linked to search pages at the National Center for Bio-technology Information.Click here for file[http://www.biomedcentral.com/content/supplementary/1471-2164-9-478-S2.htm]
Additional file 3Members of the 203 gene set, fold change at 48 h of RA treatment and relative expression in melan-a vs. B16 cells.Click here for file[http://www.biomedcentral.com/content/supplementary/1471-2164-9-478-S3.pdf]
Additional file 4Classification of 203 Gene Set Members According to Gene Ontology Bio-logical Processes. Processes were ranked by p-value which is the Holm-Bonferroni adjusted probability of a random set of 203 genes containing at least the stated representation in the Pathway Studio database. The number of members within each process that are expressed lower in melan-a, higher in melan-a and the total number of members are provided in columns 2, 3 and 4 respectively.Click here for file[http://www.biomedcentral.com/content/supplementary/1471-2164-9-478-S4.pdf]
Additional file 5Members of 203 gene set which are components of the major biological processes. Using Pathway Studio, we identified biological processes which were enriched for members of the 203 gene set. Members of the five proc-esses that are most significantly enriched according to Fisher's Exact Test are given.Click here for file[http://www.biomedcentral.com/content/supplementary/1471-2164-9-478-S5.pdf]
BMC Genomics 2008, 9:478 http://www.biomedcentral.com/1471-2164/9/478
Page 11 of 12(page number not for citation purposes)
ment are those of the author(s) and do not necessarily represent the official position or views of the NIH.
References1. Wartman D, Weinstock M: Are we overemphasizing sun avoid-
ance in protection from melanoma? Cancer Epidemiol BiomarkersPrev 2008, 17:469-70.
2. Wolbach SB, Howe PR: Tissue changes following deprivation offat soluble vitamin A. J Exp Med 1925, 62:753-777.
3. Petkovich M, Brand NJ, Krust A, Chambon P: A human retinoicacid receptor which belongs to the family of nuclear recep-tors. Nature 1987, 330:440-450.
4. Giguere V, Ong ES, Segui P, Evans RM: Identification of a receptorfor the morphogen retinoic acid. Nature 1987, 330:624-629.
5. Mangelsdorf DJ, Ong ES, Dyck JA, Evans RM: Nuclear receptorthat identifies a novel retinoic acid response pathway. Nature1990, 345:224-229.
6. Levin AA, Sturzenbecker LJ, Kazmer S, et al.: 9-cis retinoic acidstereo-isomer binds and activates the nuclear receptorRXR-alpha. Nature 1992, 355:359-361.
7. Hoopes CW, Taketo M, Ozato K, Lin Q, Howard TA, Linney E, SeldinMF: Mapping of the Rxr loci encoding nuclear retinoic ×receptors RXR alpha, RXR beta and RXR gamma. Genomics1992, 14:611-617.
8. Keller H, Dreyer C, Medin J, Mahfoudi A, Ozato K, Wahli W: Fattyacids and retinoids control lipid metabolism through activa-tion of peroxisome proliferator-activated receptor-retinoid× receptor heterodimers. Proc Natl Acad Sci USA 1993,90:2160-2164.
9. Kliewer SA, Umesono K, Mangelsdorf DJ, Evans RM: Retinoid ×receptor interacts with nuclear receptors in retinoic acid,thyroid hormone and vitamin D3 signaling. Nature 1992,355:446-449.
10. Leid M, Kastner P, Lyons R, et al.: Purification, cloning and RXRidentity of the HeLa cell factor with which RAR or TR het-erodimerizes to bind target sequences efficiently. Cell 1992,68:377-395.
11. Marks MS, Hallenbeck PI, Nagata T, Segars JH, Apella E, Nikodem VM,Ozato K: H-2 RIIBP (RXR-beta) heterodimerization providesa mechanism for combinatorial diversity in the regulation ofretinoic acid and thyroid hormone responsive genes. EMBO J1992, 11:1419-1435.
12. Umesono K, Murakami KK, Thompson CC, Evans RM: Directrepeats as selective response elements for the thyroid hor-mone, retinoic acid, and vitamin D3 receptors. Cell 1991,65:1255-1266.
13. Mader S, Leroy P, Chen J-Y, Chambon P: Multiple parameterscontrol the selectivity of nuclear receptors for theirresponse elements: selectivity and promiscuity in theresponse element recognition by retinoic acid receptors andretinoid × receptors. J Biol Chem 1993, 268:591-600.
14. Shibata H, Spencer TE, Onate SA, Jenster G, Tsai SY, Tsai MJ, O'Mal-ley BW: Role of co-activators and co-repressors in the mech-anism of steroid/thyroid receptor action. Recent Prog Horm Res1997, 52:141-164.
15. Sporn MB, Roberts AB: Role of retinoids in differentiation andcarcinogenesis. Cancer Res 1983, 43:3034-3040.
16. Niles RM: Vitamin A (retinoids) regulation of mousemelanoma growth and differentiation. J Nutr 2003,133:282S-286S.
17. Melnikova VO, Bolshakov SV, Walker C, Ananthaswamy HN:Genomic alterations in spontaneous and carcinogen-inducedmurine melanoma cell lines. Oncogene 2004, 23:2347-2356.
18. Gray-Schopfer VC, Cheong SC, Chong H, Chow J, Moss T, Abdel-Malik ZA, Marais R, Wynford-Thomas D, Bennett DC: Cellularsenescence in naevi and immortalization in melanoma: arole for p16? Br J Cancer 2006, 95:496-505.
19. Kuman R, Angelini S, Hemnenki K: Activating BRAF and N-rasmutations in sporadic primary melanomas: an inverse asso-ciation with allelic loss on chromosome 9. Oncogene 2003,22:9217-9224.
20. Bennett DC, Cooper PJ, Hart IR: A line of non-tumorigenicmouse melanocytes, syngeneic with the B16 melanoma andrequiring a tumour promoter for growth. Int J Cancer 1987,39:414-418.
21. Gruber JR, Desai S, Blusztajn JK, Niles RM: Retinoic acid specifi-cally increases nuclear PKCα and stimulates AP-1 transcrip-tional activity in B16 mouse melanoma cells. Exp Cell Res 1995,221:377-384.
22. Tusher V, Tibshirani R, Chu G: Significance analysis of microar-rays applied to transcriptional responses to ionizing radia-tion. Proc Natl Acad Sci USA 2001, 98:5116-5121.
23. deThe H, Marchio A, Tiollais P, Dejean A: Differential expressionand ligand regulation of the retinoic acid receptor α and βgenes. EMBO J 1989, 8:429-433.
24. Cerignoli F, Guo X, Cardinali B, Rinaldi C, Casaletto J, Frati L, Screp-anti I, Gudas LJ, Gulino A, Thiele CJ, Giannini G: RetSDR1, a short-chain retinol dehydrogenase/reductase, is retinoic acid-inducible and frequently deleted in human neuroblastomacell lines. Cancer Res 2002, 62:1196-1204.
25. Niles RM, Combs R: The relationship between susceptibility toretinoic acid treatment and protein kinase C α expression inmurine melanoma cell lines. Exp Cell Res 1996, 223:21-28.
26. Yuen T, Wurmbach E, Pfeffer RL, Ebersole BJ, Sealfon SC: Accuracyand calibration of commercial oligonucleotide and customcDNA microarrays. Nucl Acids Res 2002, 30:: e48. doi: 10.1093/nar/30.10.e48
27. Freemantel SJ, Kerley JS, Olsen SL, Gross RH, Spinella MJ: Develop-mentally-related candidate retinoic acid target genes regu-lated early during neuronal differentiation of humanembryonal carcinoma. Oncogene 2002, 21:2880-2889.
28. Harris TM, Childs G: Global gene expression patterns duringdifferentiation of F9 embryonal carcinoma cells into parietalendoderm. Funct Integr Genomics 2002, 2:105-119.
29. Cheepala SB, Syed Z, Trutschi M, Cvek U, Clifford JL: Retinoids andskin: microarrays shed new light on chemopreventive actionof all-trans retinoic acid. Mol Carcinog 2007, 46:634-639.
30. Hoek K, Rimm DL, et al.: Expression profiling reveals novelpathways in the transformation of melanocytes to melano-mas. Cancer Res 2004, 64:5270-5282.
31. Ryu B, Kim DS, Deluca AM, Alani RM: Comprehensive expressionprofiling of tumor cell lines identifies molecular signatures ofmelanoma progression. PLos ONE 2007, 3:609-611.
32. Seykora JT, Jih D, Elenitaas R, Horng WH, Elder DE: Gene expres-sion profiling of melanocytic lesions. Am J Dermatopathol 2003,25:6-11.
33. Jaeger J, Koczan D, Thiesen HJ, Ibrahim SM, Gross G, Spang R, KunzM: Gene expression signatures for tumor progression, tumorsubtype. Clin Cancer Res 2007, 13:806-815.
34. Haeseleer F, Huang J, Lebioda L, Saari JC, Palczewski K: Molecularcharacterization of a novel short-chain dehydrogenase/reductase that reduces all-trans retinal. J Biol Chem 1998,283:21790-21799.
35. Wang C, Li N, Liu X, Zheng Y, Cao X: A novel endogenoushuman CaMKII inhibitory protein suppresses tumor growthby inducing cell cycle arrest via p27 stabilization. J Biol Chem2008, 283:11565-11574.
36. Zhang H, Rosdahl I: Expression profiles of p53, p21, bax, andbcl2 proteins in all-trans-retinoic acid treated primary andmetastatic melanoma cells. Int J Oncol 2004, 25:303-308.
37. Vertuani S, Dubrovska E, Levitsky V, Jager MJ, Kiessling R, LevitskayaJ: Retinoic acid elicits cytostatic, cytotoxic, and immu-nomodulatory effects on uveal melanoma cells. Cancer Immu-nol Immunother 2007, 56:193-204.
38. Tanaka T, Suh KS, Lo AM, DeLuca LM: p21 WAF-1/CIP-1 is acommon mechanism through retinoic acid receptor (RAR)/retinoid × receptor (RXR) heterodimer and RXR/RXRhomodimer. J Biol Chem 2007, 282:29987-29997.
39. Claus R, Lubbert M: Epigenetic targets in hematopoietic malig-nancies. Oncogene 2003, 22:6489-6496.
40. Gompel M, Soulie C, Ceballos-Picot I, Meijer L: Expression andactivity of cyclin-dependent kinases and glycogen synthasekinase-3 during NT2 neuronal differentiation. Neurosignals2004, 13:134-143.
41. Finklestein R, Weinberg RA: Differential regulation of N-mycand c-myc expression in F9 teratocarcinoma cells. OncogeneRes 1988, 3:287-292.
42. Prasad KN, Chors RJ, Sharma OK: Decreased expressions of c-myc and H-ras oncogenes in vitamin E succinate inducedmorphologically differentiated murine B-16 melanoma cellsin culture. Biochem Cell Biol 1990, 68:1250-1255.

Publish with BioMed Central and every scientist can read your work free of charge
"BioMed Central will be the most significant development for disseminating the results of biomedical research in our lifetime."
Sir Paul Nurse, Cancer Research UK
Your research papers will be:
available free of charge to the entire biomedical community
peer reviewed and published immediately upon acceptance
cited in PubMed and archived on PubMed Central
yours — you keep the copyright
Submit your manuscript here:http://www.biomedcentral.com/info/publishing_adv.asp
BioMedcentral
BMC Genomics 2008, 9:478 http://www.biomedcentral.com/1471-2164/9/478
Page 12 of 12(page number not for citation purposes)
43. Gao Q, Zhou J, Huang X, Chen G, Ye F, Lu Y, Li K, Zhuang L, HuangM, Xu G, Wang S, Ma D: Selective targeting of checkpointkinase 1 in tumor cells with a novel potent oncolytic adeno-virus. Mol Ther 2006, 13:928-937.
44. Saeed AI, Sharov V, White J, Li J, Liang W, Bhagabati N, Braisted J,Klapa M, Currier T, Thiagarajan M, Sturn A, Snuffin M, Rezantsev A,Popov D, Ryltsov A, Kostukovich E, Borisovsky I, Liu Z, Vinsavich A,Trush V, Quackenbush J: TM4: a free, open-source system formicroarray data management and analysis. Biotechniques 2003,34:374-8.
45. Pfaffl M: A new mathematical model for relative quantifica-tion in real-time RT-PCR. Nucleic Acids Res 2001, 29:e45.
46. Holm S: A simple sequentially rejective multiple test proce-dure. Scandinavian Journal of Statistics 1979, 6:65-70.