global agricultural trade and developing countries - isbn
TRANSCRIPT

exports of sugar, and seven times exports of textilefibers.
This chapter highlights major global, regional,and product-specific trends in the trade in fruit andvegetable products, and examines the major policyand other factors that have affected this trade overthe past two decades.1 Particular attention is givento the performance and position of developingcountries in this trade and the policies, institutions,and infrastructure they need to succeed.
Fruit and Vegetable Productionand Trade Growth
For the purpose of this study, we group fruits andvegetables in four main categories: fresh fruits,fresh vegetables, processed fruits, and processedvegetables. These categories comprise all SITC(Standard International Trade Classification) Revi-sion 1, Chapter 5 items except nuts, roots, andtubers. They correspond to most products inChapter 7 (edible vegetables and certain rootsand tubers), Chapter 8 (edible fruits and nuts;peel of citrus fruits or melons) and Chapter 20(preparations of vegetables, fruit, nuts, or otherparts of plants) of the Harmonized System (HS)nomenclature.
Trade in fruit and vegetable products has beenamong the most dynamic areas of internationalagricultural trade, stimulated by rising incomes andgrowing consumer interest in product variety, fresh-ness, convenience, and year-round availability.Advances in production, postharvest handling, pro-cessing, and logistical technologies—along withincreased levels of international investment—haveplayed a facilitating role. For developing countries,trade in these products has been attractive in theface of highly volatile or declining long-term trendsin the prices for many traditional export products.Although many developing-country suppliers haveentered the field, relatively few have achieved signif-icant, sustained success, reflecting the fact that theindustry is highly competitive and rapidly changing.
Still, the aggregate picture is favorable. Fresh andprocessed fruit and vegetable products accounted for16.7 percent of total agricultural exports from devel-oping countries in 1980–81. By 2000–01, this sharehad increased to 21.8 percent. Only for one otherproduct category—fish and fisheries products—aredeveloping countries more significant exporters (seechapter 1). Fruit and vegetable exports from devel-oping countries are now more than double exportsfor tropical beverages, three times exports of grains,three times exports of livestock products, five times
237
13
FRUITS AND VEGETABLES:GLOBAL TR ADE AND
COMPETITION IN FRESHAND PROCESSED
PRODUCT MARKETS
Ndiame Diop and Steven M. Jaffee

238 Global Agricultural Trade and Developing Countries
Trends in World Production and Trade
World production of fruit and vegetables grew by30 percent between 1980 and 1990 and by 56 per-cent between 1990 and 2003, reaching 1,274 mil-lion tons by 2003. Much of this growth occurred inChina, where production grew by 134 percent inthe 1980s and by 200 percent in the 1990s. China iscurrently the world’s largest producer of fruits andvegetables, with a share of 34 percent, followed byLatin America and the Caribbean (11 percent),India (10 percent), and Africa and the EuropeanUnion (EU) (both at 9 percent) (figure 13.1).
The structure of world trade in fruits and veg-etables does not fully mirror that of production.Many of the largest producers are not significanttraders due to a combination of domestic demandand geographical and logistical factors. For exam-ple, in China and India, where strong domesticdemand is fueled by growing income and a largeand rapidly growing urban population, only a smallpercentage of fruit and vegetable production isexported. In contrast, Latin American countries(such as Mexico, Chile, and Costa Rica) are amongthe world’s leading exporters of fruits and vegeta-bles, mainly because of their proximity to the largeU.S. market.
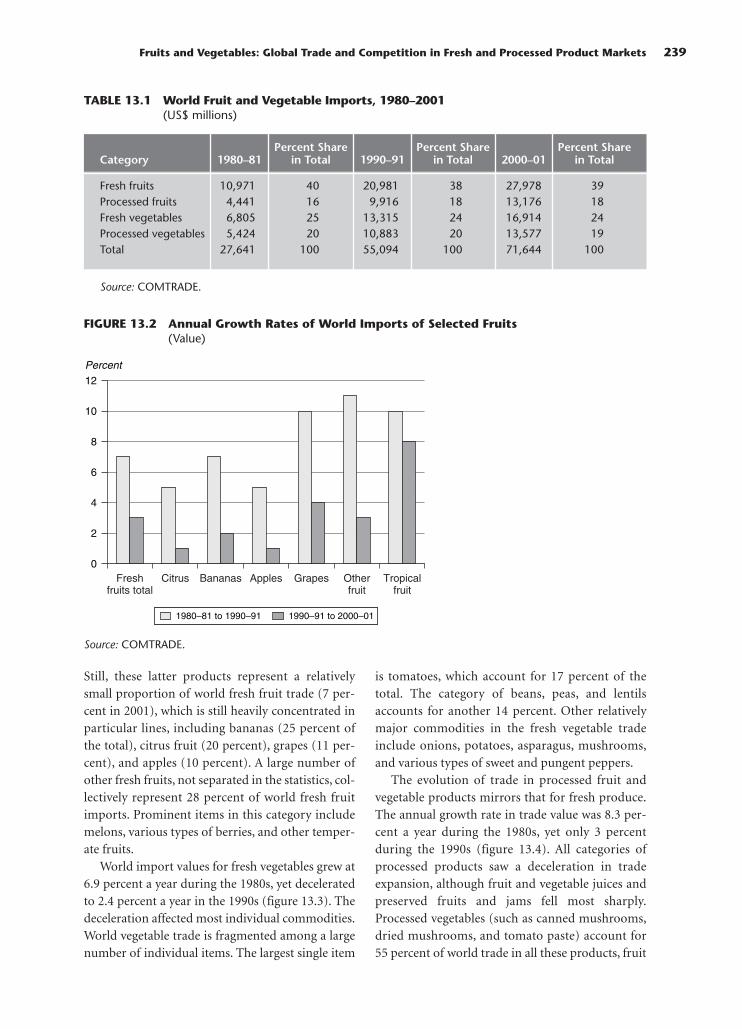
World trade in fruits and vegetables, fresh andprocessed, has increased by 30 percent since 1990,reaching $71.6 billion in 2001 (table 13.1). This
followed even more robust growth in the 1980s,when trade in fruits and vegetables doubled. Worldtrade in all categories of fruits and vegetableshas grown strongly, with only slight changes inits broad composition. In 2001 fresh produceaccounted for 63 percent of the total, whereasprocessed products accounted for 37 percent. Thecomplexity of these definitions must be kept inmind, however. Both in Europe and the UnitedStates, one of the fastest-growing product segmentsis semi-prepared and packed fresh produce, includ-ing preassembled salads, vegetable dips, and slicedor mixed fruit products.
Taking all fruit and vegetable products com-bined, the value of world imports grew at 2–3 per-cent a year during the 1990s, a sharp decelerationfrom the 7–8 percent annual growth during theprevious decade (figures 13.2–13.5). As elaboratedbelow, the slower growth in world imports duringthe 1990s reflects two primary factors: a decline inworld prices for many important fruit and veg-etable products in the latter half of the 1990s, andstagnation in EU import demand due to marketsaturation.
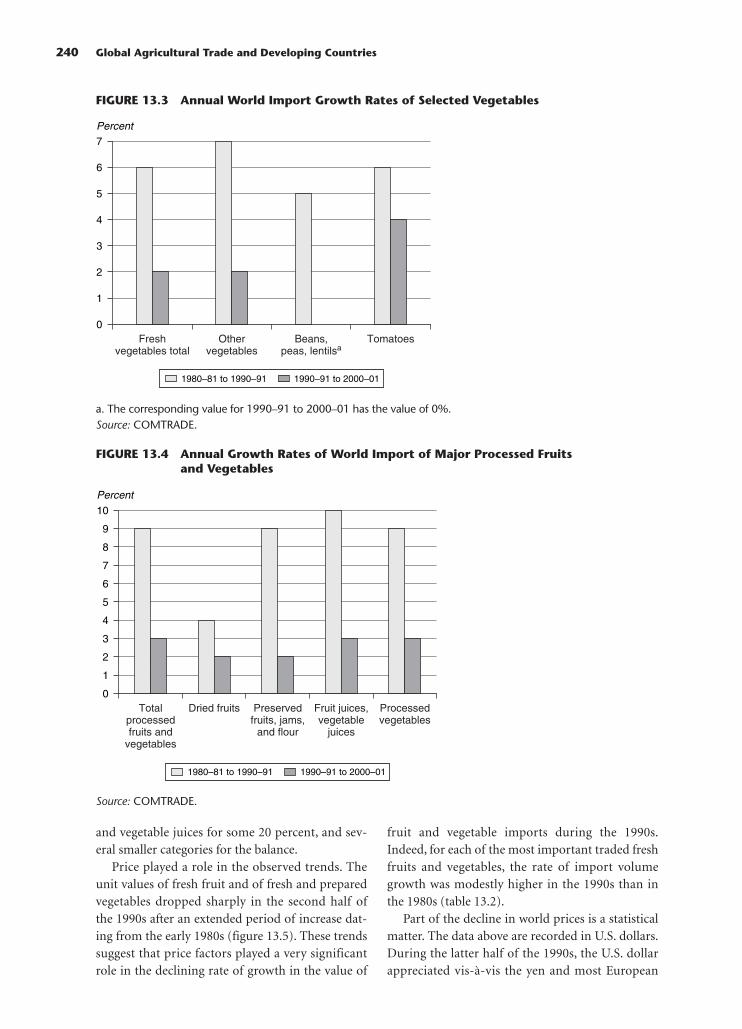
Within the fresh fruit category, the decelerationhas been sharpest for apples, grapes, and citrus (fig-ure 13.2). Comparatively more dynamic trade hasremained for various tropical fruits (especiallypapaya, mango, and pineapple), with averageannual growth in the 1990s remaining at 8 percent.
FIGURE 13.1 Production of Fruit and Vegetables by Region (million of tons)
Africa EU-15 LAC China India U.S. Rest of World0
50
100
150
200
250
300
Millions of tons
350
400
450
500
1980 1990 2003
Source: United Nations Food and Agriculture Organization.
Still, these latter products represent a relativelysmall proportion of world fresh fruit trade (7 per-cent in 2001), which is still heavily concentrated inparticular lines, including bananas (25 percent ofthe total), citrus fruit (20 percent), grapes (11 per-cent), and apples (10 percent). A large number ofother fresh fruits, not separated in the statistics, col-lectively represent 28 percent of world fresh fruitimports. Prominent items in this category includemelons, various types of berries, and other temper-ate fruits.
World import values for fresh vegetables grew at6.9 percent a year during the 1980s, yet deceleratedto 2.4 percent a year in the 1990s (figure 13.3). Thedeceleration affected most individual commodities.World vegetable trade is fragmented among a largenumber of individual items. The largest single item
is tomatoes, which account for 17 percent of thetotal. The category of beans, peas, and lentilsaccounts for another 14 percent. Other relativelymajor commodities in the fresh vegetable tradeinclude onions, potatoes, asparagus, mushrooms,and various types of sweet and pungent peppers.
The evolution of trade in processed fruit andvegetable products mirrors that for fresh produce.The annual growth rate in trade value was 8.3 per-cent a year during the 1980s, yet only 3 percentduring the 1990s (figure 13.4). All categories ofprocessed products saw a deceleration in tradeexpansion, although fruit and vegetable juices andpreserved fruits and jams fell most sharply.Processed vegetables (such as canned mushrooms,dried mushrooms, and tomato paste) account for55 percent of world trade in all these products, fruit
Fruits and Vegetables: Global Trade and Competition in Fresh and Processed Product Markets 239
Source: COMTRADE.
TABLE 13.1 World Fruit and Vegetable Imports, 1980–2001 (US$ millions)
Percent Share Percent Share Percent ShareCategory 1980–81 in Total 1990–91 in Total 2000–01 in Total
Fresh fruits 10,971 40 20,981 38 27,978 39Processed fruits 4,441 16 9,916 18 13,176 18Fresh vegetables 6,805 25 13,315 24 16,914 24Processed vegetables 5,424 20 10,883 20 13,577 19Total 27,641 100 55,094 100 71,644 100
Source: COMTRADE.
FIGURE 13.2 Annual Growth Rates of World Imports of Selected Fruits (Value)
0
2
4
6
8
12
10
Percent
Freshfruits total
Citrus Bananas Apples Grapes Otherfruit
Tropicalfruit
1980–81 to 1990–91 1990–91 to 2000–01
and vegetable juices for some 20 percent, and sev-eral smaller categories for the balance.
Price played a role in the observed trends. Theunit values of fresh fruit and of fresh and preparedvegetables dropped sharply in the second half ofthe 1990s after an extended period of increase dat-ing from the early 1980s (figure 13.5). These trendssuggest that price factors played a very significantrole in the declining rate of growth in the value of
fruit and vegetable imports during the 1990s.Indeed, for each of the most important traded freshfruits and vegetables, the rate of import volumegrowth was modestly higher in the 1990s than inthe 1980s (table 13.2).
Part of the decline in world prices is a statisticalmatter. The data above are recorded in U.S. dollars.During the latter half of the 1990s, the U.S. dollarappreciated vis-à-vis the yen and most European
240 Global Agricultural Trade and Developing Countries
FIGURE 13.4 Annual Growth Rates of World Import of Major Processed Fruitsand Vegetables
0
2
1
3
4
5
7
8
9
10
6
Percent
Totalprocessedfruits and
vegetables
Dried fruits Preservedfruits, jams,
and flour
Fruit juices,vegetable
juices
Processedvegetables
1980–81 to 1990–91 1990–91 to 2000–01
FIGURE 13.3 Annual World Import Growth Rates of Selected Vegetables
0
2
1
3
4
5
7
6
Percent
Freshvegetables total
Othervegetables
Beans,peas, lentilsa
Tomatoes
1980–81 to 1990–91 1990–91 to 2000–01
a. The corresponding value for 1990–91 to 2000–01 has the value of 0%.Source: COMTRADE.
Source: COMTRADE.

currencies, deflating Japanese and Europeanimport values upon conversion into U.S. dollars.For some commodities, however, the unit importvalues into Japan, Europe, and elsewhere actuallydid decline in local currency terms—in some casessubstantially. For example, from 1996 to 2001, theaverage unit value of Japanese fresh vegetableimports fell by 25 percent, while that of processedvegetable imports fell by 8 percent.2 A major factorin this decline was the rapidly expanding supply oflow-cost production in China. During the 1990sChina accounted for virtually all of the incrementalexpansion in Japan’s vegetable trade, taking marketshare from other suppliers. Declining unit importvalues for various products in Europe can be attrib-uted to at least three factors: the slow economicgrowth in the region (especially in Germany, the
leading importer); competitive and structuralchanges in fruit and vegetable distribution systems,which put downward pressures on trader andmanufacturer margins; and greater availability ofproduct and intensified international competition.
Sources and Destinations ofExported Fruits and Vegetables
The European Union, NAFTA (North AmericanFree Trade Agreement), and a few middle-incomecountries dominate trade in fruits and vegetables(table 13.3). Eight categories of countries are dis-tinguished. China, India, Japan, and the EuropeanUnion are singled out. The United States, Canada,and Mexico are grouped together in the NAFTAcategory. The developing-country group minusChina and India is split between low-income coun-tries and middle-income ones.
Global Trade Patterns
The European Union is the world’s largest marketand supplier of fresh and processed fruits and veg-etables. In 2001 its 15 member countries accountedfor $37 billion in imports, or 51 percent of worldimports, while exports stood at $28 billion, or39.5 percent of world exports.3 EU trade in fruitsand vegetables is, however, largely intraregional.Intra-EU imports represent 64 percent of EUimports, while 83 percent of EU export trade occursamong its 15 member states. Still, with its affluent
Fruits and Vegetables: Global Trade and Competition in Fresh and Processed Product Markets 241
TABLE 13.2 Average Annual Growth Ratesin World Import Volumes,1980–2001
Commodity 1980–1991 1990–2001
Bananas 3.45 3.96Oranges 1.11 1.68Apples 1.42 2.33Grapes 4.31 4.34Tomatoes 3.11 4.45Onions 3.50 4.17Green beans 4.59 5.98
Source: FAOSTAT.
FIGURE 13.5 World Unit Values for Fresh Fruits, Fresh Vegetables, and Prepared Vegetables (US$ per metric ton)
0
1,400
1,000
1,200
800
600
400
200
1980 1982 1984 1986 1988 1990 1992 1994 1996 1998 2000 2002
US$
Prepared vegetables Fresh fruit Fresh vegetables
Source: FAOSTAT.
and aging population, its high factor costs, and itscold winters, this region represents one of the largestfruit and vegetable markets for non-EU countries($13.2 billion), especially for low- and middle-income countries, which exported $1.08 and $9 bil-lion, respectively, to the European Union in 2001.Major middle-income suppliers to the EuropeanUnion market include banana-exporting coun-tries (mainly Colombia, Costa Rica, Côte d’Ivoire,Ecuador, and Panama4) and counterseasonal-supplying countries such as Argentina, Chile, andSouth Africa. Led by South Africa, the latter threecountries dominate exports of apples, grapes, andpears to the European Union.
Intraregional trade is also significant in NAFTA,the world’s second-largest fruit and vegetable
market. Trade between Mexico, Canada, and theUnited States accounted for 49 percent of NAFTA’simports and 53 percent of its exports in 2001.Intra-NAFTA trade is most important for freshvegetables. For this commodity group, 90 percentof exports and 86 percent of imports occur withinthe trade group (Huang 2004). Still, middle-income countries (excluding Mexico) have a strongfoothold in this market. By securing 71 percent ofthe $7.25 billion extra-NAFTA import market in2001, middle-income countries are major players.
Interestingly, thanks to growing incomes in the1990s, middle-income countries have seen theirown market become a major destination of fruit andvegetable exports from other countries, with importdemand totaling $11 billion in 2001. South-South
242 Global Agricultural Trade and Developing Countries
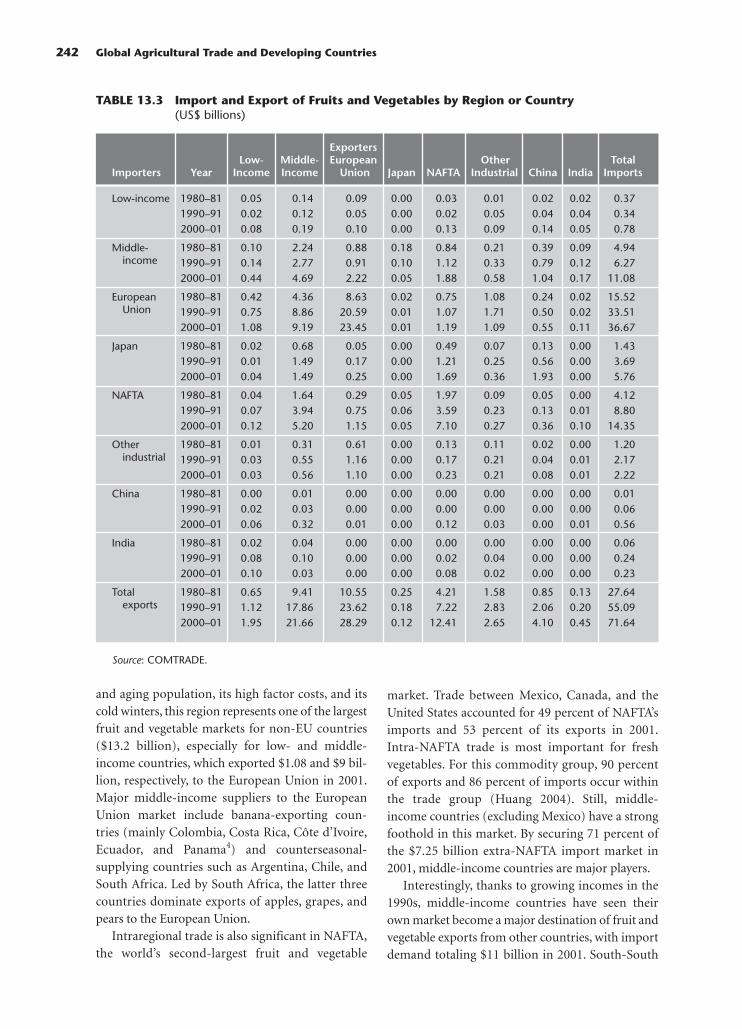
TABLE 13.3 Import and Export of Fruits and Vegetables by Region or Country(US$ billions)
ExportersLow- Middle- European Other Total
Importers Year Income Income Union Japan NAFTA Industrial China India Imports
Low-income 1980–81 0.05 0.14 0.09 0.00 0.03 0.01 0.02 0.02 0.371990–91 0.02 0.12 0.05 0.00 0.02 0.05 0.04 0.04 0.342000–01 0.08 0.19 0.10 0.00 0.13 0.09 0.14 0.05 0.78
Middle- 1980–81 0.10 2.24 0.88 0.18 0.84 0.21 0.39 0.09 4.94income 1990–91 0.14 2.77 0.91 0.10 1.12 0.33 0.79 0.12 6.27
2000–01 0.44 4.69 2.22 0.05 1.88 0.58 1.04 0.17 11.08
European 1980–81 0.42 4.36 8.63 0.02 0.75 1.08 0.24 0.02 15.52 Union 1990–91 0.75 8.86 20.59 0.01 1.07 1.71 0.50 0.02 33.51
2000–01 1.08 9.19 23.45 0.01 1.19 1.09 0.55 0.11 36.67
Japan 1980–81 0.02 0.68 0.05 0.00 0.49 0.07 0.13 0.00 1.431990–91 0.01 1.49 0.17 0.00 1.21 0.25 0.56 0.00 3.692000–01 0.04 1.49 0.25 0.00 1.69 0.36 1.93 0.00 5.76
NAFTA 1980–81 0.04 1.64 0.29 0.05 1.97 0.09 0.05 0.00 4.121990–91 0.07 3.94 0.75 0.06 3.59 0.23 0.13 0.01 8.802000–01 0.12 5.20 1.15 0.05 7.10 0.27 0.36 0.10 14.35
Other 1980–81 0.01 0.31 0.61 0.00 0.13 0.11 0.02 0.00 1.20industrial 1990–91 0.03 0.55 1.16 0.00 0.17 0.21 0.04 0.01 2.17
2000–01 0.03 0.56 1.10 0.00 0.23 0.21 0.08 0.01 2.22
China 1980–81 0.00 0.01 0.00 0.00 0.00 0.00 0.00 0.00 0.011990–91 0.02 0.03 0.00 0.00 0.00 0.00 0.00 0.00 0.062000–01 0.06 0.32 0.01 0.00 0.12 0.03 0.00 0.01 0.56
India 1980–81 0.02 0.04 0.00 0.00 0.00 0.00 0.00 0.00 0.061990–91 0.08 0.10 0.00 0.00 0.02 0.04 0.00 0.00 0.242000–01 0.10 0.03 0.00 0.00 0.08 0.02 0.00 0.00 0.23
Total 1980–81 0.65 9.41 10.55 0.25 4.21 1.58 0.85 0.13 27.64exports 1990–91 1.12 17.86 23.62 0.18 7.22 2.83 2.06 0.20 55.09
2000–01 1.95 21.66 28.29 0.12 12.41 2.65 4.10 0.45 71.64
Source: COMTRADE.
trade—trade between developing countries, exclud-ing China and India—totaled $5.4 billion in 2001,accounting for 45 percent of developing countries’imports. Japan has also emerged as a significantmarket for fruits and vegetables over the 1990s, withimport demand culminating at $5.8 billion in 2001.China has emerged as a major supplier of horticul-ture to Japan with its market share doubling from16 percent in the 1980s to 33 percent in the 1990s.
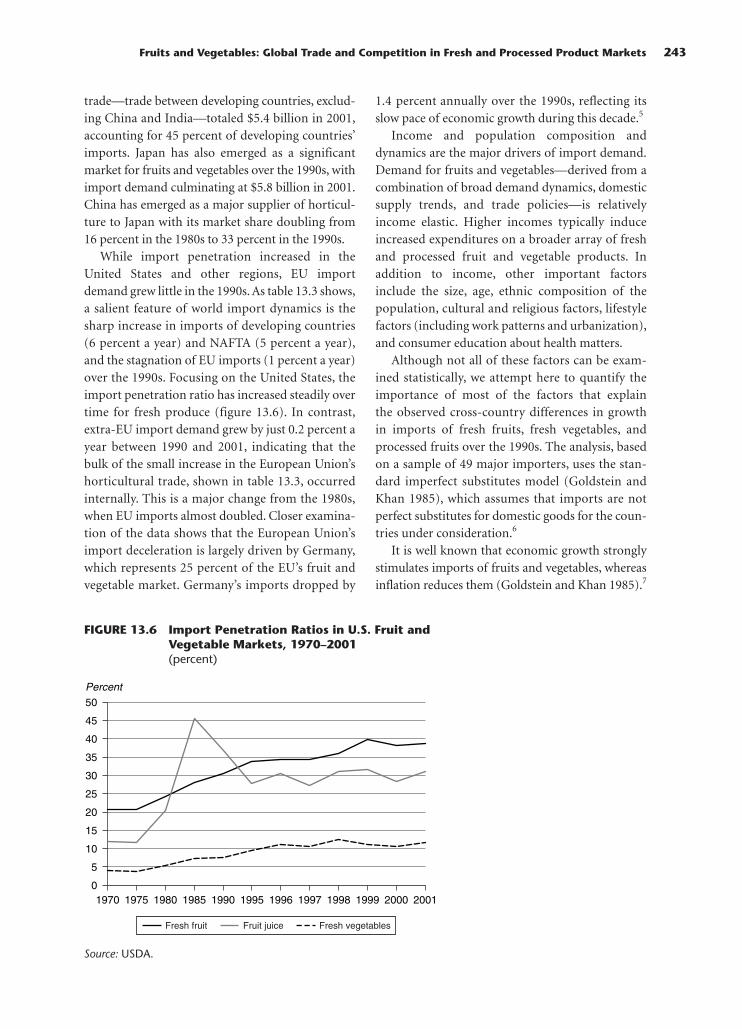
While import penetration increased in theUnited States and other regions, EU importdemand grew little in the 1990s. As table 13.3 shows,a salient feature of world import dynamics is thesharp increase in imports of developing countries(6 percent a year) and NAFTA (5 percent a year),and the stagnation of EU imports (1 percent a year)over the 1990s. Focusing on the United States, theimport penetration ratio has increased steadily overtime for fresh produce (figure 13.6). In contrast,extra-EU import demand grew by just 0.2 percent ayear between 1990 and 2001, indicating that thebulk of the small increase in the European Union’shorticultural trade, shown in table 13.3, occurredinternally. This is a major change from the 1980s,when EU imports almost doubled. Closer examina-tion of the data shows that the European Union’simport deceleration is largely driven by Germany,which represents 25 percent of the EU’s fruit andvegetable market. Germany’s imports dropped by
1.4 percent annually over the 1990s, reflecting itsslow pace of economic growth during this decade.5
Income and population composition anddynamics are the major drivers of import demand.Demand for fruits and vegetables—derived from acombination of broad demand dynamics, domesticsupply trends, and trade policies—is relativelyincome elastic. Higher incomes typically induceincreased expenditures on a broader array of freshand processed fruit and vegetable products. Inaddition to income, other important factorsinclude the size, age, ethnic composition of thepopulation, cultural and religious factors, lifestylefactors (including work patterns and urbanization),and consumer education about health matters.
Although not all of these factors can be exam-ined statistically, we attempt here to quantify theimportance of most of the factors that explainthe observed cross-country differences in growthin imports of fresh fruits, fresh vegetables, andprocessed fruits over the 1990s. The analysis, basedon a sample of 49 major importers, uses the stan-dard imperfect substitutes model (Goldstein andKhan 1985), which assumes that imports are notperfect substitutes for domestic goods for the coun-tries under consideration.6
It is well known that economic growth stronglystimulates imports of fruits and vegetables, whereasinflation reduces them (Goldstein and Khan 1985).7
Fruits and Vegetables: Global Trade and Competition in Fresh and Processed Product Markets 243
FIGURE 13.6 Import Penetration Ratios in U.S. Fruit andVegetable Markets, 1970–2001 (percent)
01970 1975 1980 1985 1990 1995 1996 1997 1998 1999 2000 2001
50
45
40
35
30
25
20
15
10
5
Percent
Fresh fruit Fruit juice Fresh vegetables
Source: USDA.

But it is urbanization, not growth per se, that exer-cises the strongest and most significant influence onimports of fresh fruits (with the nuance that it playsa major role in developing countries only given thepopulation shifts that are still occurring in thesecountries, see the Result Table A1 on the CD-ROM).Several factors could explain this relationship. First,urbanization helps to reduce the logistical andtransaction costs to service demand from interna-tional sources, especially if the major cities arelocated in close vicinity to major ports or along effi-cient transport nodes. Second, with urbanization,there is greater demand for convenience in meetingfood needs. Many fresh and processed fruit and veg-etable products can be consumed with little or nofurther household preparation. Plus, these productsfeature heavily in menus of restaurants and cateringservices, most of which are in urban areas. Third,urban populations tend to be more heterogeneousin ethnic and other composition than is typical inany single rural setting. This mixing of populationsincreases consumer exposure to new or even exoticproducts, some of which may only be sourced inlarge quantities from abroad.
As expected, tariffs negatively affect fresh fruittrade, but the elasticity is not significantly differentfrom zero. In sharp contrast, tariffs have a negativeand statistically significant effect on processed fruittrade, highlighting the high degree of tariff escala-tion affecting trade in fruits and vegetables.
Developing Countries’ Performance
Although many countries have entered the freshfruit and vegetable export markets, only a few
middle-income countries have succeeded on a sus-tained basis. The average shares of developingcountries in world exports of fresh fruits and veg-etables hide the heavy domination of trade by just ahandful of middle-income countries. Between 1997and 2001, just four Latin American countries—Chile, Costa Rica, Ecuador, and Mexico—accounted for 43 percent of developing-countryexports of fresh fruit (FAO 2003). These countriesare leading players in the most internationallytraded fruit products (table 13.4). While exports ofvegetables are similarly concentrated, the geo-graphical distribution of exporters is wider. Mexicois the world’s leading exporter of tomatoes, Kenyasupplies 25 percent of the world’s green beans,while Guatemala and Kenya jointly lead the worldmarket for green peas.8 Between 1997 and 2001,four suppliers—Argentina, China, Mexico, and theSyrian Arab Republic—accounted for 67 percent offresh vegetable exports by developing countries(FAO 2003).9
A small number of medium-income countrieshave been successful in the processed segment ofthe export market, but as a group, developingcountries account for a relatively low share in worldexports of these products (36 percent in 2001).Chile, China, Thailand, and Turkey account for58 percent of developing countries’ exports ofprocessed fruit and vegetable products (FAO 2003).Secondary, yet still significant exporters includeArgentina, Indonesia, Mexico, and the Philippines(a combined 14 percent of developing countries’exports). Trade by developing countries in specificprocessed products is relatively highly concentrated(table 13.5).
244 Global Agricultural Trade and Developing Countries
TABLE 13.4 Concentration of Fresh Fruit and Vegetable Exports among DevelopingCountries, 2001
Joint Percentage ofProduct Leading Suppliers World Exports (value)
Asparagus Peru, Mexico, Thailand 94Mangoes Brazil, Mexico, Philippines 62Pineapples Costa Rica, Côte d’Ivoire 61Bananas Ecuador, Colombia, Costa Rica 60Avocados Chile, Mexico 53Tomatoes Mexico, Syria 52Grapes Chile, China, Mexico 38Green beans Jordan, Kenya, Mexico 49Green peas Guatemala, Kenya, Zimbabwe 38
Source: FAOSTAT.

Policy Factors Shaping InternationalTrade Patterns
Domestic Support and Export Subsidies
Government interventions for fruits and vegetablesare significantly lower than in other agriculturalsectors. Consistently, domestic subsidies to produc-ers are relatively low in OECD (Organisation forEconomic Co-operation and Development) coun-tries. Of the major industrialized regions, only theEuropean Union reports an aggregate measure ofsupport related specifically to several fruits andvegetables, while Japan and Canada indicate mod-erate levels of aggregate support for a few com-modities.10 The European Union’s budgetary out-lays for fruits and vegetables totaled $1.55 billion in1999. Those expenditures covered compensationfor surplus withdrawals; production aid to produc-ers of bananas, peas, lentils, beans, pineapples,grapes, and stone fruits; and aid to producers ofcertain products intended for processing (toma-toes, peaches, pears) and to processors who pay
producers at least the minimum price fixed eachyear (for dried figs and certain prunes, for exam-ple). Japan reported price support for starches($179 million for potatoes and sweet potatoes in1998) and direct payments to the vegetable andfruit sectors, but the aggregate measure of supportwas below the de minimis level. Similarly, inCanada, only its support for dry beans was abovethe de minimis levels (WTO 2000a).
Unlike in many other agricultural sectors, theuse of export subsidies is not pervasive in horticul-ture. The export subsidy expenditures notified tothe WTO in 2000 (WTO 2000b) (table 13.6) arewell below those reported for other agriculturalcategories. In only one country, Switzerland, wereexpenditures large relative to horticultural exports,with export subsidies accounting for 21 percent ofthat country’s exports. The European Union’sexport subsidies represented less than 1 percent ofthe value of its total exports. Although it did notsupply information to the WTO, the United Statesindirectly subsidized horticultural exports, albeit
Fruits and Vegetables: Global Trade and Competition in Fresh and Processed Product Markets 245
TABLE 13.5 Concentration of Processed Fruit and Vegetable Exports among DevelopingCountries
Joint Percentage ofProduct Leading Suppliers World Exports (value)
Orange juice concentrated Brazil 91Canned pineapples Indonesia, Philippines, Thailand 74Canned mushrooms China 52Dried mushrooms China 52Dried fruits Chile, China, Thailand 35Tomato paste Chile, China, Turkey 35Apple juice, concentrated Argentina, Chile, Turkey 31
Source: FAO 2003.
TABLE 13.6 Export Subsidy Expenditures for Horticultural Products
Export Total Horticultural Export Expenditures as aExpenditure Exports Percent of Total Horticultural
Country (US$ millions) (US$ millions) Export Value
European Union 40 5,301 0.8Switzerland 14 69 20.6Colombia 13 521 2.4Turkey 11 2,348 0.0
Source: WTO 2000b and subsequent WTO notification updates. Export data from FAOSTAT.
to a very limited degree, through export creditguarantees.
Tariffs and Other Import Restrictions
Regulating market access is the main instrumentused to protect the fruit and vegetable sector. TheEuropean Union, Japan, and the United States use,to varying degrees, similar protection tools: low buthighly dispersed ad valorem tariffs, specific duties,seasonal tariffs, tariff escalation, and preferentialaccess along with tariff-rate quotas. Tariffs for aspecific range of products depend on numerousfactors, including the date of entry (seasonality fac-tor), the degree of processing (escalation phenome-non), and the relationships with exporting coun-tries (preferential agreements and regional andbilateral free trade agreements—FTAs).
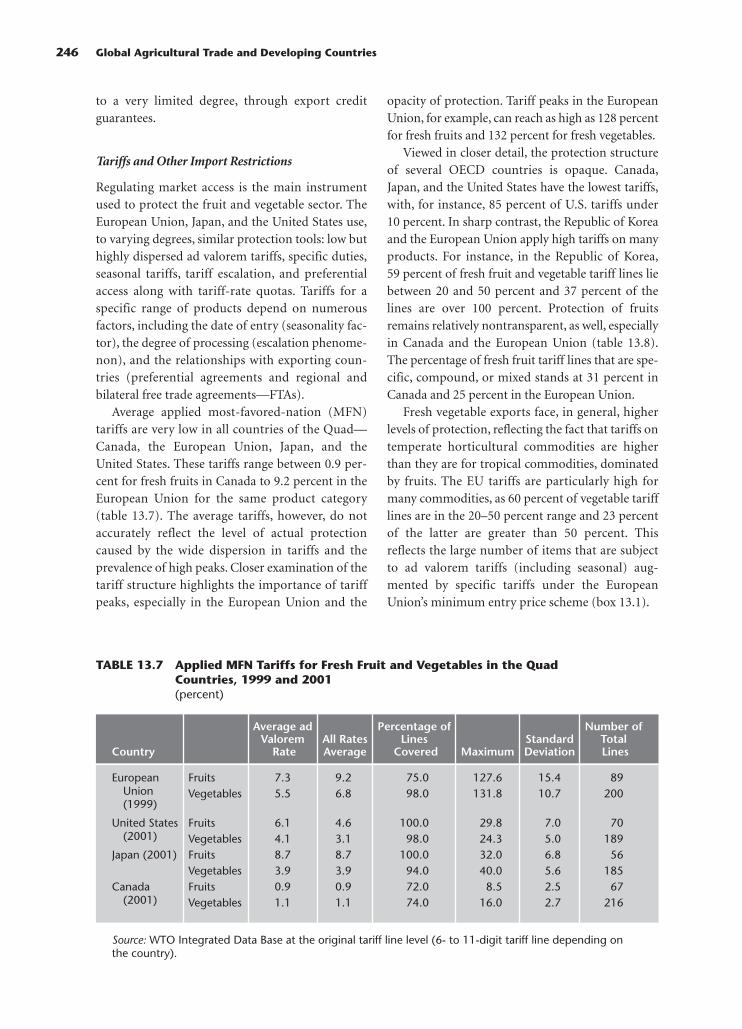
Average applied most-favored-nation (MFN)tariffs are very low in all countries of the Quad—Canada, the European Union, Japan, and theUnited States. These tariffs range between 0.9 per-cent for fresh fruits in Canada to 9.2 percent in theEuropean Union for the same product category(table 13.7). The average tariffs, however, do notaccurately reflect the level of actual protectioncaused by the wide dispersion in tariffs and theprevalence of high peaks. Closer examination of thetariff structure highlights the importance of tariffpeaks, especially in the European Union and the
opacity of protection. Tariff peaks in the EuropeanUnion, for example, can reach as high as 128 percentfor fresh fruits and 132 percent for fresh vegetables.
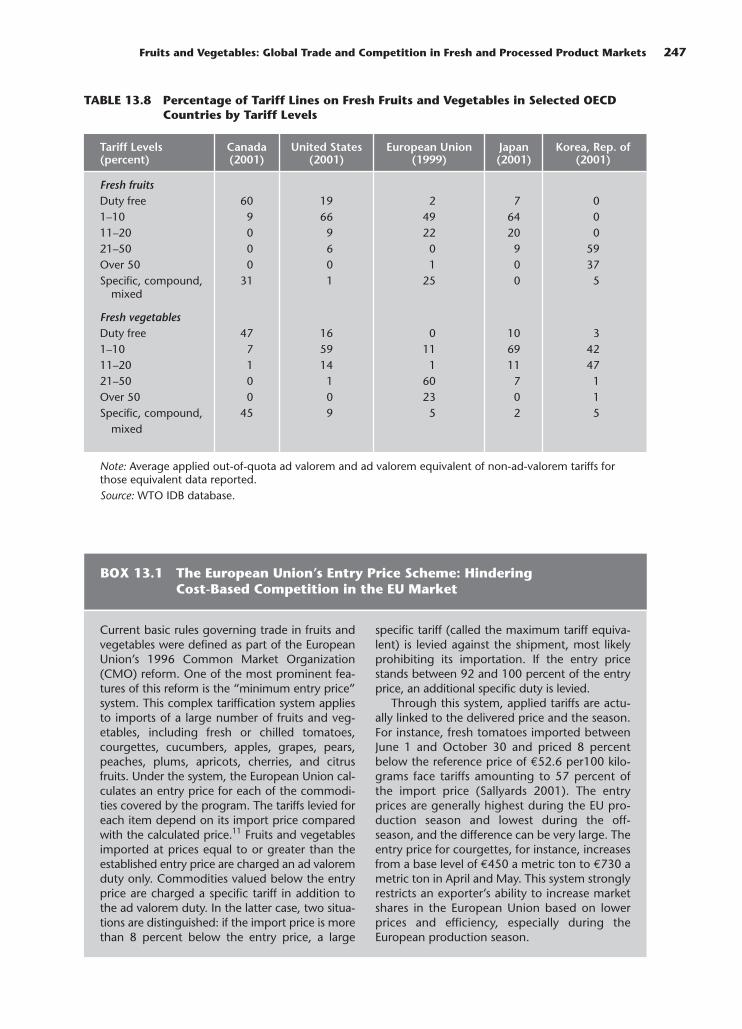
Viewed in closer detail, the protection structureof several OECD countries is opaque. Canada,Japan, and the United States have the lowest tariffs,with, for instance, 85 percent of U.S. tariffs under10 percent. In sharp contrast, the Republic of Koreaand the European Union apply high tariffs on manyproducts. For instance, in the Republic of Korea,59 percent of fresh fruit and vegetable tariff lines liebetween 20 and 50 percent and 37 percent of thelines are over 100 percent. Protection of fruitsremains relatively nontransparent, as well, especiallyin Canada and the European Union (table 13.8).The percentage of fresh fruit tariff lines that are spe-cific, compound, or mixed stands at 31 percent inCanada and 25 percent in the European Union.
Fresh vegetable exports face, in general, higherlevels of protection, reflecting the fact that tariffs ontemperate horticultural commodities are higherthan they are for tropical commodities, dominatedby fruits. The EU tariffs are particularly high formany commodities, as 60 percent of vegetable tarifflines are in the 20–50 percent range and 23 percentof the latter are greater than 50 percent. Thisreflects the large number of items that are subjectto ad valorem tariffs (including seasonal) aug-mented by specific tariffs under the EuropeanUnion’s minimum entry price scheme (box 13.1).
246 Global Agricultural Trade and Developing Countries
TABLE 13.7 Applied MFN Tariffs for Fresh Fruit and Vegetables in the QuadCountries, 1999 and 2001(percent)
Average ad Percentage of Number ofValorem All Rates Lines Standard Total
Country Rate Average Covered Maximum Deviation Lines
European Fruits 7.3 9.2 75.0 127.6 15.4 89Union Vegetables 5.5 6.8 98.0 131.8 10.7 200(1999)
United States Fruits 6.1 4.6 100.0 29.8 7.0 70 (2001) Vegetables 4.1 3.1 98.0 24.3 5.0 189
Japan (2001) Fruits 8.7 8.7 100.0 32.0 6.8 56Vegetables 3.9 3.9 94.0 40.0 5.6 185
Canada Fruits 0.9 0.9 72.0 8.5 2.5 67(2001) Vegetables 1.1 1.1 74.0 16.0 2.7 216
Source: WTO Integrated Data Base at the original tariff line level (6- to 11-digit tariff line depending onthe country).
Fruits and Vegetables: Global Trade and Competition in Fresh and Processed Product Markets 247
TABLE 13.8 Percentage of Tariff Lines on Fresh Fruits and Vegetables in Selected OECDCountries by Tariff Levels
Tariff Levels Canada United States European Union Japan Korea, Rep. of(percent) (2001) (2001) (1999) (2001) (2001)
Fresh fruitsDuty free 60 19 2 7 01–10 9 66 49 64 011–20 0 9 22 20 021–50 0 6 0 9 59Over 50 0 0 1 0 37Specific, compound, 31 1 25 0 5
mixed
Fresh vegetablesDuty free 47 16 0 10 31–10 7 59 11 69 4211–20 1 14 1 11 4721–50 0 1 60 7 1Over 50 0 0 23 0 1Specific, compound, 45 9 5 2 5
mixed
Note: Average applied out-of-quota ad valorem and ad valorem equivalent of non-ad-valorem tariffs forthose equivalent data reported.Source: WTO IDB database.
Current basic rules governing trade in fruits andvegetables were defined as part of the EuropeanUnion’s 1996 Common Market Organization(CMO) reform. One of the most prominent fea-tures of this reform is the “minimum entry price”system. This complex tariffication system appliesto imports of a large number of fruits and veg-etables, including fresh or chilled tomatoes,courgettes, cucumbers, apples, grapes, pears,peaches, plums, apricots, cherries, and citrusfruits. Under the system, the European Union cal-culates an entry price for each of the commodi-ties covered by the program. The tariffs levied foreach item depend on its import price comparedwith the calculated price.11 Fruits and vegetablesimported at prices equal to or greater than theestablished entry price are charged an ad valoremduty only. Commodities valued below the entryprice are charged a specific tariff in addition tothe ad valorem duty. In the latter case, two situa-tions are distinguished: if the import price is morethan 8 percent below the entry price, a large
specific tariff (called the maximum tariff equiva-lent) is levied against the shipment, most likelyprohibiting its importation. If the entry pricestands between 92 and 100 percent of the entryprice, an additional specific duty is levied.
Through this system, applied tariffs are actu-ally linked to the delivered price and the season.For instance, fresh tomatoes imported betweenJune 1 and October 30 and priced 8 percentbelow the reference price of €52.6 per100 kilo-grams face tariffs amounting to 57 percent ofthe import price (Sallyards 2001). The entryprices are generally highest during the EU pro-duction season and lowest during the off-season, and the difference can be very large. Theentry price for courgettes, for instance, increasesfrom a base level of €450 a metric ton to €730 ametric ton in April and May. This system stronglyrestricts an exporter’s ability to increase marketshares in the European Union based on lowerprices and efficiency, especially during theEuropean production season.
BOX 13.1 The European Union’s Entry Price Scheme: HinderingCost-Based Competition in the EU Market
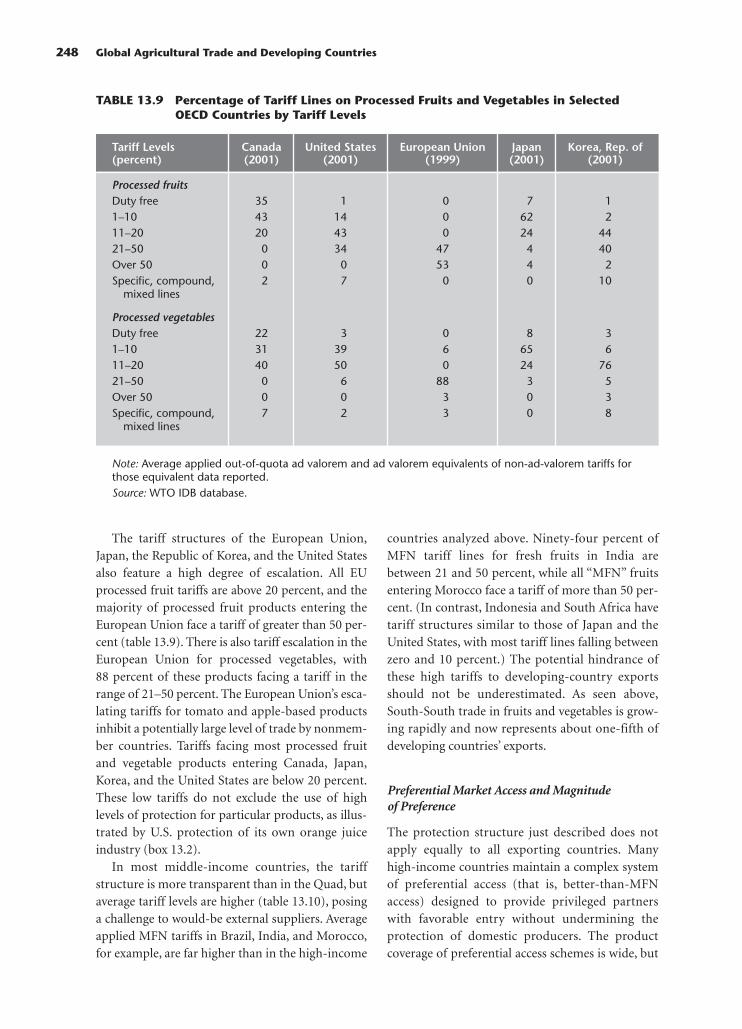
The tariff structures of the European Union,Japan, the Republic of Korea, and the United Statesalso feature a high degree of escalation. All EUprocessed fruit tariffs are above 20 percent, and themajority of processed fruit products entering theEuropean Union face a tariff of greater than 50 per-cent (table 13.9). There is also tariff escalation in theEuropean Union for processed vegetables, with88 percent of these products facing a tariff in therange of 21–50 percent. The European Union’s esca-lating tariffs for tomato and apple-based productsinhibit a potentially large level of trade by nonmem-ber countries. Tariffs facing most processed fruitand vegetable products entering Canada, Japan,Korea, and the United States are below 20 percent.These low tariffs do not exclude the use of highlevels of protection for particular products, as illus-trated by U.S. protection of its own orange juiceindustry (box 13.2).
In most middle-income countries, the tariffstructure is more transparent than in the Quad, butaverage tariff levels are higher (table 13.10), posinga challenge to would-be external suppliers. Averageapplied MFN tariffs in Brazil, India, and Morocco,for example, are far higher than in the high-income
countries analyzed above. Ninety-four percent ofMFN tariff lines for fresh fruits in India arebetween 21 and 50 percent, while all “MFN” fruitsentering Morocco face a tariff of more than 50 per-cent. (In contrast, Indonesia and South Africa havetariff structures similar to those of Japan and theUnited States, with most tariff lines falling betweenzero and 10 percent.) The potential hindrance ofthese high tariffs to developing-country exportsshould not be underestimated. As seen above,South-South trade in fruits and vegetables is grow-ing rapidly and now represents about one-fifth ofdeveloping countries’ exports.
Preferential Market Access and Magnitudeof Preference
The protection structure just described does notapply equally to all exporting countries. Manyhigh-income countries maintain a complex systemof preferential access (that is, better-than-MFNaccess) designed to provide privileged partnerswith favorable entry without undermining theprotection of domestic producers. The productcoverage of preferential access schemes is wide, but
248 Global Agricultural Trade and Developing Countries
TABLE 13.9 Percentage of Tariff Lines on Processed Fruits and Vegetables in SelectedOECD Countries by Tariff Levels
Tariff Levels Canada United States European Union Japan Korea, Rep. of(percent) (2001) (2001) (1999) (2001) (2001)
Processed fruitsDuty free 35 1 0 7 11–10 43 14 0 62 211–20 20 43 0 24 4421–50 0 34 47 4 40Over 50 0 0 53 4 2Specific, compound, 2 7 0 0 10
mixed lines
Processed vegetablesDuty free 22 3 0 8 31–10 31 39 6 65 611–20 40 50 0 24 7621–50 0 6 88 3 5Over 50 0 0 3 0 3Specific, compound, 7 2 3 0 8
mixed lines
Note: Average applied out-of-quota ad valorem and ad valorem equivalents of non-ad-valorem tariffs forthose equivalent data reported.Source: WTO IDB database.
entry is often limited by quotas for “sensitive prod-ucts” such as those put in special protocols (such asbananas).
The major EU preferential access schemes rele-vant to trade in fruits and vegetables include theEverything but Arms (EBA) initiative that benefitsthe 48 UN-defined least-developed countries(LDCs); the EU-ACP Lomé Conventions, underwhich the European Union grants unilateral prefer-ential access to 75 African, Caribbean, and Pacific(ACP) countries, bilateral agreements such as theEuro-Med Agreements between the EuropeanUnion and many Mediterranean countries, and theEU-South Africa free trade area; and the general-ized system of preferences (GSP).
A large number of countries also enjoy preferen-tial access to the United States through formalregional, bilateral, and preferential trade agree-ments. These include NAFTA, the African GrowthOpportunity Act (AGOA), the Caribbean BasinEconomic Recovery Act (CBERA), the Andean
Trade Preference Act (ATPA), and free trade agree-ments with Israel and Chile. Since NAFTA wassigned, tropical fruits shipped from Mexico (man-goes, guavas, avocados, and papayas) have beensubject to steadily reduced tariffs. Since January2003 they have entered the U.S. market free of duty.
While these different agreements are not alwaysdirectly comparable, it is clear that they providevaried degrees of preference to the suppliersinvolved. Figure 13.7, adapted from Stevens andKennan (2000), highlights the hierarchy of prefer-ences within the European Union’s fruit and veg-etable import regime as of 2003. The major changessince 2000 include the promulgation of the EBAinitiative and the multiplication of bilateral agree-ments, which erode the preferences of those on topof the pyramid. The ranking of preferencesdepends on the difference between preferential ver-sus MFN tariffs (that is, the margin of preference),the breadth of product coverage, the extent ofquota limitations, and the degree of certainty of
Fruits and Vegetables: Global Trade and Competition in Fresh and Processed Product Markets 249
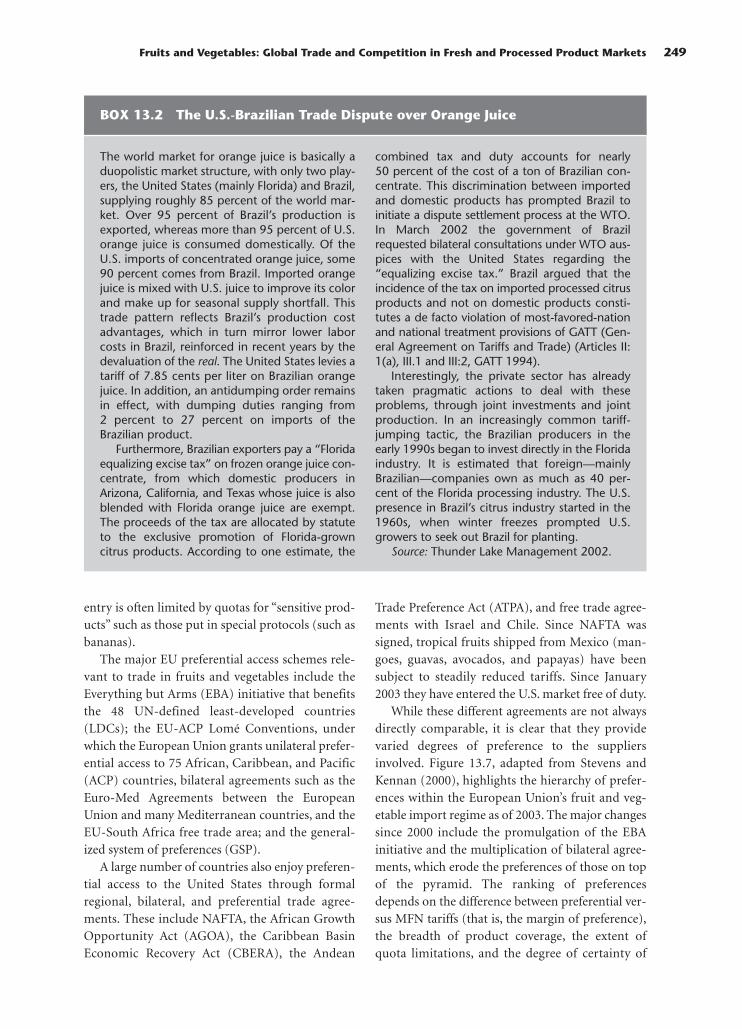
The world market for orange juice is basically aduopolistic market structure, with only two play-ers, the United States (mainly Florida) and Brazil,supplying roughly 85 percent of the world mar-ket. Over 95 percent of Brazil’s production isexported, whereas more than 95 percent of U.S.orange juice is consumed domestically. Of theU.S. imports of concentrated orange juice, some90 percent comes from Brazil. Imported orangejuice is mixed with U.S. juice to improve its colorand make up for seasonal supply shortfall. Thistrade pattern reflects Brazil’s production costadvantages, which in turn mirror lower laborcosts in Brazil, reinforced in recent years by thedevaluation of the real. The United States levies atariff of 7.85 cents per liter on Brazilian orangejuice. In addition, an antidumping order remainsin effect, with dumping duties ranging from2 percent to 27 percent on imports of theBrazilian product.
Furthermore, Brazilian exporters pay a “Floridaequalizing excise tax” on frozen orange juice con-centrate, from which domestic producers inArizona, California, and Texas whose juice is alsoblended with Florida orange juice are exempt.The proceeds of the tax are allocated by statuteto the exclusive promotion of Florida-growncitrus products. According to one estimate, the
combined tax and duty accounts for nearly50 percent of the cost of a ton of Brazilian con-centrate. This discrimination between importedand domestic products has prompted Brazil toinitiate a dispute settlement process at the WTO.In March 2002 the government of Brazilrequested bilateral consultations under WTO aus-pices with the United States regarding the“equalizing excise tax.” Brazil argued that theincidence of the tax on imported processed citrusproducts and not on domestic products consti-tutes a de facto violation of most-favored-nationand national treatment provisions of GATT (Gen-eral Agreement on Tariffs and Trade) (Articles II:1(a), III.1 and III:2, GATT 1994).
Interestingly, the private sector has alreadytaken pragmatic actions to deal with theseproblems, through joint investments and jointproduction. In an increasingly common tariff-jumping tactic, the Brazilian producers in theearly 1990s began to invest directly in the Floridaindustry. It is estimated that foreign—mainlyBrazilian—companies own as much as 40 per-cent of the Florida processing industry. The U.S.presence in Brazil’s citrus industry started in the1960s, when winter freezes prompted U.S.growers to seek out Brazil for planting.
Source: Thunder Lake Management 2002.
BOX 13.2 The U.S.-Brazilian Trade Dispute over Orange Juice

preferences. The key characteristics of the Euro-pean Union’s preference system are:
• Duty-free and quota-free access for LDCs underthe EBA initiative.12 The beneficiary countriesgenerally lack the capacity to provide reliablesupplies, in part because of poor infrastructureand other behind-the-border constraints. Evenwith EBA, they accounted in 2002 for only 1 per-cent of the European Union’s imports of fruitsand vegetables from outside the EU.
• Generous access for ACP countries, account-ing for 8 percent of the European Union’s
third-country imports. Just a few countries—including Cameroon, Côte d’Ivoire, and Kenya—account for the bulk of this trade.
• ACP access for bananas is limited by quotas.ACP countries enjoy, within the allocated quotaof 850,000 tons, duty-free access to the EUbanana market (until 2008), whereas third-country suppliers face a duty of €75/ton.13
• Preferential access for many countries comesthrough bilateral agreements. The concessionsgranted under these agreements are typicallyrestricted to certain tariff quotas or to certainperiods of the year, depending on the EU season.
250 Global Agricultural Trade and Developing Countries
TABLE 13.10 Percentage of Tariff Lines at Different Levels in Selected DevelopingCountries, 2001
Tariff Levels (percent) Brazil India Indonesia Morocco South Africa
Fresh fruitsDuty free 0 0 0 0 151–10 0 0 100 0 4711–20 100 3 0 0 2921–50 0 94 0 0 9Over 50 0 3 0 100 0Specific, compound, 0 0 0 0 0
mixed lines
Fresh vegetablesDuty free 24 0 2 0 461–10 0 0 98 0 611–20 76 85 0 13 3021–50 0 15 0 19 13Over 50 0 0 0 68 0Specific, compound, 0 0 0 0 6
mixed lines
Note: Average applied out-of-quota ad valorem and ad valorem equivalents of non-ad-valorem tariffs forthose equivalent data reported.Source: WTO IDB database.
FIGURE 13.7 The Hierarchy of Preferences in the European Fruits and VegetablesMarket
MFN
GSP (14 percent of EU imports)
Bilateral agreements
ACP countries (8 percent of EU imports)
EBA countries (1 percent of EU imports)
Source: Authors’ calculations using COMTRADE data and based on Stevens and Kennan 2000.
Tensions between opening markets for privi-leged partners and protecting domestic producershave led to a widespread use of tariff rate quotas(TRQs) in fruit and vegetable trade. In 2000 devel-oped countries applied 355 TRQ schemes toimported fruits and vegetables, compared with 56for tropical beverages and processed agriculturalproducts (Jabati 2003). Quotas are typically set atlow levels with low in-quota tariffs and prohibitiveover-the-quota tariffs. A good example is that ofwinter seedless grapes, a product exported by someSouthern Hemisphere suppliers, including SouthAfrica and Namibia. Namibia may export only900 tons per year to the European Union fromNovember to end of January (Jabati 2003). Anyover-the-quota export is subject to an import tariffof 16.4 percent. The tariff and period restrictionsclearly constitute a constraint for Namibia if itwants to increase its exports.
Analysis of the value of ACP and AGOA prefer-ences show heterogeneous situations among ACPcountries, while South Africa stands out as the onlycountry taking significant advantage of the AGOApreference. It has been argued that preferentialtreatment has contributed to the successful pene-tration of some developing countries into the EU
market (Stevens and Kennan 2000). We examinehere the effectiveness of ACP and AGOA prefer-ences for fruits and vegetables exported to theEuropean Union and United States, respectively.These indicators are preferred over changes inMFN tariffs, which do not capture the variety ofspecific trade regimes in the European Union andthe United States that are relevant for many devel-oping countries.
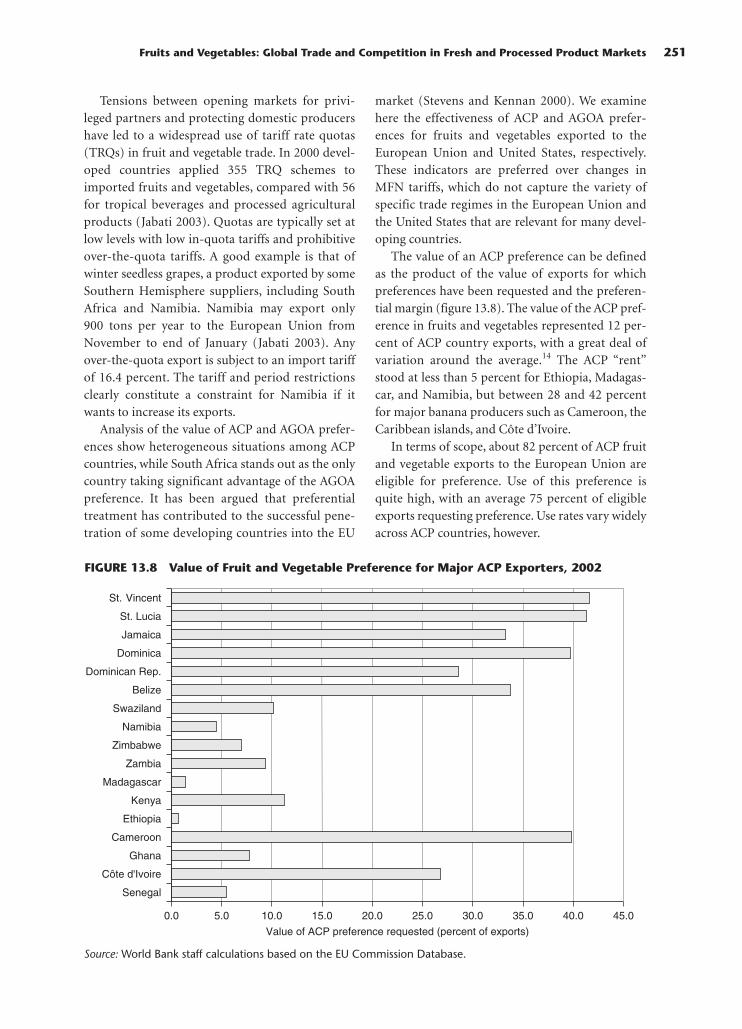
The value of an ACP preference can be definedas the product of the value of exports for whichpreferences have been requested and the preferen-tial margin (figure 13.8). The value of the ACP pref-erence in fruits and vegetables represented 12 per-cent of ACP country exports, with a great deal ofvariation around the average.14 The ACP “rent”stood at less than 5 percent for Ethiopia, Madagas-car, and Namibia, but between 28 and 42 percentfor major banana producers such as Cameroon, theCaribbean islands, and Côte d’Ivoire.
In terms of scope, about 82 percent of ACP fruitand vegetable exports to the European Union areeligible for preference. Use of this preference isquite high, with an average 75 percent of eligibleexports requesting preference. Use rates vary widelyacross ACP countries, however.
Fruits and Vegetables: Global Trade and Competition in Fresh and Processed Product Markets 251
Source: World Bank staff calculations based on the EU Commission Database.
FIGURE 13.8 Value of Fruit and Vegetable Preference for Major ACP Exporters, 2002
0.0 5.0 10.0 15.0 20.0
Value of ACP preference requested (percent of exports)
25.0 30.0 35.0 40.0 45.0
Senegal
Côte d'Ivoire
Ghana
Cameroon
Ethiopia
Kenya
Madagascar
Zambia
Zimbabwe
Namibia
Swaziland
Belize
Dominican Rep.
Dominica
Jamaica
St. Lucia
St. Vincent

In sharp contrast with the ACP scheme, the useof the AGOA preference to export fruits and vegeta-bles to the United States is not yet a widespreadpractice in Africa, since only 14 of 38 AGOA coun-tries exported fruits and vegetables to the UnitedStates in 2002. Among those having done so, how-ever, the use of the AGOA preference was high,averaging 73 percent (see annex table A3). The verysmall number of countries that have exported fruitsand vegetables under AGOA is associated with theconstrained logistics on African–U.S. trade inperishable products, the very limited degree of U.S.private investment in Africa in this field, andstringent U.S. phytosanitary requirements.
Not surprisingly, countries that have moreadvanced logistical systems and stronger inter-national marketing ties (for example, SouthAfrica) are better placed to benefit from AGOA.In fact, South Africa is the only AGOA countryfor which the preference “rent” represents a signifi-cant share of export values (74 percent) (fig-ure 13.9). Few other African countries have a com-parative advantage in servicing the U.S. market and,given comparative freight costs and availability, findthe European market a more attractive outlet. Weanalyze these issues further in the next section.
As more and more countries are enjoying better-than-MFN access to the EU market, preferences areeroding and competition is stiffer—as illustrated bythe experience of large middle-income exporters(figure 13.10). Morocco, South Africa, and Turkeyare large exporters of fruits and vegetables that enterthe European Union under bilateral agreementswith limitations on some products.15 Morocco,among the first countries to sign preferential agree-ments with the European Union in the late 1960s,has lost ground in the EU market to Turkey sinceTurkey’s free-trade agreement with the EuropeanUnion was signed in 1998. South Africa recentlyunseated Turkey in the EU market and is now thelargest third-country supplier of fruits and vegeta-bles to the European Union (with a 31 percentshare). Turkey holds a slightly lower share (29 per-cent), while Morocco lags far behind (22 percent,down from 37 percent in 1980). In several products(citrus fruit, tomato products, dried fruit, and fruitjuice), these suppliers have competed directly.
Determinants of Success in Fruitand Vegetable Export Markets
Many developing countries have sought to takeadvantage of emerging international markets for
252 Global Agricultural Trade and Developing Countries
FIGURE 13.9 Value of Fruit and Vegetable Preference under AGOA
0.0 10.0 20.0 30.0
Value of AGOA preference requested (percent of exports)
40.0 50.0 60.0 70.0 80.0
Côte d'Ivoire
Ethiopia
Ghana
Kenya
Madagascar
Malawi
Mozambique
Nigeria
Sierra Leone
South Africa
Swaziland
Tanzania
Uganda
Zambia
Source: World Bank staff calculations based on USITC Database.

fresh and processed fruit and vegetable products.Yet, as noted above, relatively few have achieveddominance in a range of such products. In Sub-Saharan Africa several dozen countries haveparticipated in this trade, yet just three—Côted’Ivoire, Kenya, South Africa—accounted fornearly 90 percent of the region’s trade in recentdecades. Only a few other countries in the regionhave been able to sustain growth in their horticul-tural trade over time; none has emerged as a majorplayer in the international market.
Success Factors
To succeed in exporting fruits and vegetables, acountry must have important assets that provide aninitial comparative advantage. Among those assetsare favorable agroclimatic conditions and ampleand accessible land and water resources; a physicallocation on the sea or close to a major market;ample and relatively inexpensive labor; and a classof entrepreneurs with commercial experience.Many countries may possess some or even most ofthese assets. But translating them into a competi-tive horticultural industry that maintains or im-proves its competitiveness over time requires adistinctive set of investments and institutionalstructures, a range of facilitative government poli-cies, and, usually, a bit of luck (Jaffee 2003; Gabre-Madhin and Minot 2003; FAO 2003; Huang 2004).
Jaffee (1993) examines the ingredients commonto the initial growth and subsequent maturation of
some of the developing world’s leading fresh andprocessed fruit and vegetable success stories—among them Brazil, Chile, Kenya, Mexico, andTaiwan (China). In each case, the initial take-offoccurred during a period of stable macroeconomicconditions and the presence of a favorable invest-ment climate. Important initial catalysts for exportgrowth included sudden shortfalls in major over-seas markets, new foreign direct investment orstrategic partnerships, and improvements in inter-national logistics capacity. International technicaland marketing partnerships provided a vehicle forthe transfer of technology, for new market penetra-tion, and for creating an identity for the productsfrom the exporting country.
Many countries have experienced short-termspurts in horticultural exports; few have been ableto consolidate their early gains. Those that havedone so invested in research and adopted interna-tional technologies, expanded and upgraded logis-tical facilities, strengthened vertical supply chains,developed industry organizations for collectiveaction, and built credible systems for quality assur-ance and food safety management. Industry expan-sion induced the development of associated indus-tries, such as packaging, equipment supply, andtechnical consulting, which in turn contributed tothe underlying competitiveness of the industries.Further investments were made in the industries’underlying assets, for example, through irriga-tion development and worker and management
Fruits and Vegetables: Global Trade and Competition in Fresh and Processed Product Markets 253
FIGURE 13.10 EU–Third Country Imports and the Share of Key Exporters
0
15
10
5
20
25
30
35
40
1980 1982 1984 1986 1988 1990 19941992 1996 1998 2000 2002
Percent
Morocco South Africa Turkey
Source: COMTRADE.

training. Synergies have generally developedbetween export horticulture and complementaryindustries such as domestic catering and tourism.
With certain historical exceptions, in most of thelong-standing industries the private sector domi-nates the commercial dimensions of the business,while governments play a substantial and multidi-mensional facilitative role. In the early stages ofindustry development, the public sector has beencritical in improving transportation and port/airport infrastructure, investing in research and farmadvisory services, facilitating access by investors andfarmers to suitable land, helping to transfer tech-nologies and skills, and advancing the broad arrayof policies that make for a conducive investmentclimate (box 13.3). Over time, other important func-tions for government have emerged, notably sanitaryand phytosanitary control, promotion of competi-
tion within the industry and in critical support serv-ices, negotiation of favorable international marketaccess, and resolution of trade disputes.
Explaining Intercountry Differences in ExportPerformances
Focusing on the factors identified in the literature asinfluencing export performance, this sectionattempts to quantify their importance in determin-ing the value of fruit and vegetable exports across asample of 45 developing countries. The theoreticalanchor of the empirical investigation is Reddingand Venables’ geographic and trade model (Reddingand Venables 2002).16
The variables assumed to have a significantimpact on the value of fresh and processed fruit andvegetable exports are grouped into supply-capacity
254 Global Agricultural Trade and Developing Countries
Once the leaders of Peru’s asparagus industry andgovernment specialists realized that it was in thebest interest of the country, they worked togetherto bring national standards in line with interna-tional norms. The industry—and Peru—havegreatly benefited as a result. Over the pastdecade, Peru has quickly risen to become one ofthe world’s largest exporters of asparagus. In2002 earnings reached $187 million, represent-ing nearly 25 percent of Peru’s total agriculturalexports. Peru is able to produce quality asparagusyear-round, yet because of high transportationcosts, its exporters are unable to match priceswith inexpensive asparagus from some othercountries. Nonetheless, they have continued toincrease exports and gain market share by grow-ing asparagus of consistently higher quality thatcan be internationally certified. By meeting inter-national standards, Peruvian exporters haveincreased production and worker efficiency,gained access to industrialized country markets,built customer loyalty, and drastically reduced theindustry’s risk of trade disruptions caused by poorquality, food safety hazards, and plant disease.
In 1997 Spanish health authorities assertedthat two cases of botulism had been caused byconsumption of canned Peruvian asparagus.Despite assurances from the Peruvian govern-ment and companies, press coverage of thebotulism scare left an unfavorable impressionamong consumers in European markets, causingsales to slump in Peru’s leading market. The
incident helped motivate the industry and gov-ernment to take action, by reinforcing the factthat one careless exporter could disrupt markets.
Beginning in 1998, officials of the PeruvianCommission for Export Promotion (PROMPEX)convinced the asparagus industry to implementthe Codex code of practice on food hygiene, notbecause it was the easiest but because it was themost appropriate. PROMPEX specialists workedclosely with industry leaders and productionmanagers to ensure proper implementation ofgood hygiene standards. The industry soon sawimproved production methods, greater workerefficiency, and better product quality.
Thus, when the national fresh asparagusnorms were published in early 2001, becausethe industry was already familiar with the con-cept of national standards, producers quicklycomplied with little argument. The first nationalnorms—for fresh asparagus—established a qual-ity and performance baseline for the industrythat allowed many to generate the skills andexperience needed to voluntarily certify undermore stringent international standards, includ-ing HACCP (hazard analysis and critical controlpoint), traceability systems, and Good Agricul-tural Practice (GAP) certification. Many largeexporters have reached the level where theycan now be certified under the even stricterEUREPGAP protocol.
Source: Tim O’Brien, Interamerican Institutefor Cooperation in Agriculture.
BOX 13.3 Peruvian Asparagus Exports—A Standard Success Story?
variables and market-access variables. Supply-capacity variables include:
• Domestic market size, captured by the size ofurban population.
• Infrastructure, proxied by the percentage ofpaved roads and access to telephones.
• Institutional quality and setting, captured bytwo variables: the number of days to enforce acontract and whether or not the country is a sig-natory of the International Plant Variety Protec-tion Convention (a dummy variable).
• Human capital, captured by two separate vari-ables: availability of semi-skilled labor, capturedby the adult literacy rate, and managerial capac-ity, proxied here by the level of manufacturingexports.
Market-access variables include:
• Geographic variables: landlocked status(dummy), which increases distance and cost toreach markets.
• Volume of air transport freight (in millions oftons per kilometer). This variable attempts tocapture freight space availability and theeconomies of scale in international transport(Clark, Dollar, and Micco 2002). The higher thevolume of freight, the higher the economies ofscale realized by shippers and the lower thetransport cost.17
• Existence of a preferential agreement with theEuropean Union or the United States (dummyvariable).
Table 13.A2 (on the accompanying CD-ROM)reports our estimations of the equation for freshfruit and vegetable exports and for processed fruitsand vegetables. Common factors—notably distance(landlocked status) and the level of human capi-tal—explain success in both fresh and processedexport markets.
• Literacy and managerial capabilities exert astrong, robust, and statistically significant impacton export of fresh and processed fruits and veg-etables. This result reflects two facts. First, horti-culture is a knowledge-intensive business. Sec-ond, success in world markets requires theavailability of a skillful class of entrepreneurs.
• Remoteness (that is, being landlocked) has a sig-nificant adverse effect on fruit and vegetableexports, corroborating the literature on geogra-phy and trade—for example, Frankel and Romer(1999), who showed that countries that are land-locked or remote from major markets tend totrade less than those that are not.
• Domestic market size comes out with a negativesign in almost all estimations (although at a sta-tistically insignificant level), apparently contra-dicting the usual argument that exporting fruitsand vegetables requires the prior or paralleldevelopment of domestic markets and experi-ence in brand name merchandising (see, forexample, Jaffee 1993).18
There are sharp differences in the factorsexplaining the intercountry performance in exportsof fresh versus processed fruits and vegetables.Holding all else constant, the economies of scaleobtained through large volumes of air freight are akey success factor for fresh fruit and vegetableexports but do not appear significant for processedhorticultural exports (annex table A4 on theCD-ROM). This is because economies of scaletranslate into lower transportation costs, whichclaim a larger share of final value for fresh productsthan for processed products. Clearly, higherspoilage and handling costs make fresh producemuch more expensive to transport, explaining whymore countries tend to import fresh produce fromthe closest producers (Huang 2004). In contrast,because they are easier to handle and are almostuniversally shipped by sea, transport costs aresmaller for processed products, making the geo-graphical outreach of processed trade much larger.
The other factor that has a differentiated impacton fresh versus processed exports is the level of pro-tection. While preferential access to the EuropeanUnion or the United States has a positive and sig-nificant impact on export of processed horticul-tural products, it is not statistically significant at5 percent for fresh product exports. This result isconsistent with the structure of tariffs analyzedabove, which features a high degree of escalation inOECD countries.
In conclusion, our estimations show the criticalimportance of proximity to major export marketsand availability of human capital as common fac-tors explaining success in exports of both fresh and
Fruits and Vegetables: Global Trade and Competition in Fresh and Processed Product Markets 255

processed horticultural products. They also indi-cate that countries wishing to boost exports of freshproducts should invest in high-quality logistics,whereas those seeking success in processed marketsneed to develop or tie in with leading productbrands and circumvent tariff escalation throughpreferential agreements with major tradingpartners or within the framework of multilateralnegotiations.
Conclusion
This chapter has highlighted the major global,regional, and product-specific trends in fruit andvegetable products trade and examined majorstructural and policy factors that have affected thistrade over the past two decades. Growth in worldimports was 2–3 percent a year in the 1990s, repre-senting a deceleration in the rate of growth fromthe 1980s. This slower growth in world trade in the1990s was strongly affected by the European Union,which experienced relatively low growth in popula-tion and income during the decade and had manymature and saturated product markets. Adverseprice movements for fresh and processed productsfrom the mid-1990s onward also contributed sub-stantially to the overall deceleration in the growthof trade values. Robust growth in trade has contin-ued among NAFTA countries, for sales to high-income Asian countries, and between developingcountries.
For developing countries, fresh and processedfruits and vegetables is now one of the most impor-tant categories for agro-food trade, accounting forabout 22 percent of their exports in 2000–01. Thisis far larger than their current level of trade in manytraditional commodities. Still, although manydeveloping-country suppliers have entered thisfield, relatively few countries have achieved sus-tained success at a high level—testimony that theindustry is highly competitive and rapidly chang-ing, and that it requires sustained investments ininfrastructure, human capital, technology, andgood governance.
Unlike the situation in many other agriculturalsectors, production and export subsidies are notcommon in horticulture. Instead, domestic fruitand vegetable producers are protected through reg-ulation of market access. The European Union,Japan, and the United States use, to varying
degrees, complex protection tools—among themhighly dispersed ad valorem tariffs, specific duties,seasonal tariffs, tariff escalation, and preferentialaccess along with tariff-rate quotas. A complex sys-tem of preferential access in many rich countriesprovides privileged partners with favorable entrywithout undermining protection of domestic pro-ducers. The product coverage of preferential accessschemes is wide but quotas for “sensitive products”often limit entry. Tariff escalation for processedfruit and vegetable products is widespread,although its extent varies significantly betweenregions.
Because horticultural sectors throughout theworld have traditionally seen a low level of directgovernment interventions, changes in domesticsupport cannot affect the sector broadly or signifi-cantly. Reductions in tariffs and other importrestrictions, however, are critical in determining theimpact of trade agreements and policies on worldhorticultural trade. Further tariff liberalizationefforts would need to reduce tariff peaks, especiallyin the European Union and the Republic of Korea.Past trends suggest that the main beneficiaries fromsuch reforms will be a limited number of middle-income countries that have developed strong pro-duction, postharvest processing, logistical market-ing, and sanitary and phytosanitary managementsystems over the years and that continue to attractnew investment. With only a few exceptions, low-income countries still face enormous supply-sidechallenges in taking advantage of existing andfuture international market opportunities.
Notes
1. More detailed tables on trade flows and tariffs are pre-sented on the attached CD-ROM.
2. “Statistics on Foreign Trade of Vegetables.” Vegetable Sup-ply Stabilization Fund. Tokyo. October 2002.
3. This reflects the heavy influence of Spain, which is theglobal leader in fresh fruit exports (mainly oranges and clemen-tines). Italy is also a significant exporter of grapes, apples, andpeaches.
4. Bananas accounted for more than 80 percent of the freshfruit imported by the European Union from these countries(Huang 2004).
5. Between 1993 and 2003, gross domestic product growth inGermany averaged 1.4 percent, the lowest among EU memberstates.
6. See box A1 in annex to this chapter in the CD-ROM.7. Lacking a better alternative, food prices are considered
here as a proxy for the prices of fruits and vegetables. The maincaveat associated with this is that the range of goods covered in
256 Global Agricultural Trade and Developing Countries

the food-price index is wider than what a proper (and exoge-nous) fruits and vegetables import price index would cover.
8. Mexico remains the world’s top exporter of many smallervegetable products—among them asparagus, eggplant, andonions.
9. The bulk of Syria’s trade is with other Middle Easterncountries; Argentina’s is targeted primarily to other LatinAmerican countries.
10. The aggregate measure of support was defined in theUruguay Round Agreement on Agriculture as an aggregate sub-sidy measure, designed to quantify and compare countries’annual levels of domestic support. It aggregates the effects of alltrade-distorting policies (direct subsidies plus implicit subsidiesfrom border measures) into a single measure of support.
11. An importer can choose one of the three following meth-ods to calculate entry price: the standard import value (SIV),calculated daily by product and by origin and published in EU’sOfficial Journal; the f.o.b. price of the product in the country oforigin; the effective resale value of the shipment concerned.
12. Bananas are the only exception in the fruit and vegetablecategory. For this product, duty-free access is phased in between2002 and 2006 by a 20 percent yearly tariff reduction. This isunlikely to have a significant impact in the short run, however,as all LDCs producing bananas of export quality belong to theACP group, which enjoys duty-free access.
13. This preferential access has allowed countries likeCameroon, Côte d’Ivoire, and Dominican Republic to competewith lower-cost Latin American suppliers (Costa Rica, Ecuador).
14. For more details regarding the definitions and estima-tions of these indicators, see chapter 4 of this volume.
15. A recent study has identified three categories of productsthat receive different treatments under the European Union andMediterranean countries trade agreements: first, the productsfor which the preferential margin (tariff difference with MFN) isgranted without quantitative restriction but with seasonalrestrictions (such as tomatoes); second, the products for whichthe tariff reduction applies solely if the entry price is higher thana reference price in EU; and a third group for which the impactof tariff reductions are severely limited by quota restrictions(such as bananas and olives). Chahed and Drogué (2002).
16. The empirical model and its derivation from the Reddingand Venables’ theoretical model is described in box A2 of theannex to this chapter in the attached CD-ROM.
17. Lack of data prevented us from using the volume of mar-itime freight.
18. As noted earlier, a large and rapidly growing urban pop-ulation (as in China and India) can absorb very large quantitiesof fruit and vegetables and lead entrepreneurs to focus on serv-icing the domestic market.
References
Chahed, Y., and S. Drogué. 2002. “Echanges agricoles et AccordsEuromed, l’érosion des préférences en question.” Depart-ment of Public Economics, INRA-INAPG, Paris-Grignon.
Clark, X., D. Dollar, and A. Micco. 2002. “Port Efficiency, Mar-itime Transport Costs and Bilateral Trade,” NBER workingpaper 10353. National Bureau of Economic Research, Inc,Cambridge, MA.
FAO (United Nations Food and Agriculture Organization).2003. “The Market for Nontraditional Agricultural Exports.”Commodity and Trade Division. Rome.
FAOSTAT 2003. FAO Statistical Databases. Accessible athttp://apps.fao.org/default.jsp.
Frankel, J., and D. Romer. 1999. “Does Trade Cause Growth?”American Economic Review 89(3), June, 379–399.
Gabre-Madhin, E., and N. Minot. 2003. “Successes and Chal-lenges for Promoting African Horticulture Exports.” WorldBank, Washington, D.C. August.
Goldstein, M., and M. S. Khan. 1985. “Income and Price Effectsin Foreign Trade.” In R. W. Jones and P. B. Kenen, eds., Hand-book of International Economics, vol. 2. New York: ElsevierScience Publications.
Huang, S. W., ed. 2004. “Global Trade Patterns in Fruits and Veg-etables.” Agriculture and Trade Report WRS-04-06. U.S.Department of Agriculture, Washington, D.C.
Jabati, M.C. 2003. “Market Access for Developing Countries ofAfrica: The Reality.” AGSF Occasional Paper No. 1. UnitedNations Food and Agriculture Organization. Rome.
Jaffee, S. 1993. “Exporting High-Value Food Commodity: Suc-cess Stories From Developing Countries.” World Bank Dis-cussion Paper 198. Washington, D.C.
———. 2003. “From Challenge to Opportunity: TransformingKenya’s Fresh Vegetable Trade in the Context of EmergingFood Safety and Other Standards in Europe.” Agricultureand Rural Development Discussion Paper 1. World Bank,Washington, D.C.
Redding, Stephen, and A. Venables. 2002. “The Economics ofIsolation and Distance.” Nordic Journal of Political Economy28, Conference Volume, no. 2, pp. 93–108.
Sallyards, M. 2001. “European Union Agricultural Situation: EUFruits and Vegetables Regime.” GAIN Report E21058. U.S.Department of Agriculture, Washington, D.C.
Stevens, C., and Jane Kennan. 2000. “Will Africa’s Participationin Horticulture Chains Survive Liberalization?” WorkingPaper 106. University of Sussex, Institute for DevelopmentStudies, Brighton, U.K.
Thunder Lake Management, Inc. 2002. “Florida-Brazil CitrusCase.” Trade Policy Monitor. April. Online: http://www.thunderlake.com/brazil_oj.html.
Vegetable Supply Stabilization Fund. 2002. “Statistics on ForeignTrade of Vegetables.” Tokyo.
WTO (World Trade Organization). 2000a. “Domestic Support:Background Paper by the Secretariat.” G/AG/NG/8. May 26.
———. 2000b. “Export Subsidies: Background Paper by theSecretariat.” G/AF/NG/S/1. April.
Fruits and Vegetables: Global Trade and Competition in Fresh and Processed Product Markets 257