glen echo creek post-spill restoration and monitoring plan post-spill restoration and monitoring...
TRANSCRIPT

Glen Echo Creek
Post-spill Restoration and Monitoring Plan
Prepared for:
East Bay Municipal Utility District
Prepared by:
Horizon Water and Environment With
Matthew Cover, PhD. Waterways Consulting
November 2015


Horizon Water and Environment November 2015 1
1. INTRODUCTION 1.1 BACKGROUND On April 8, 2015 a contractor working for the East Bay Municipal Utility District (EBMUD) inadvertently
discharged 170 cubic yards of cellular concrete to a storm drain system that connects to the Rockridge
Branch of Glen Echo Creek. Cellular concrete was distributed for approximately 0.5 miles in the creek.
Other water quality effects related to the release such as elevated pH and visible concrete fines in the
creek channel were observed almost one mile from the point of origin. EBMUD initiated containment
and response activities immediately following the spill and coordinated with the California Department
of Fish and Wildlife (CDFW) and the Regional Water Quality Control Board (RWQCB) regarding clean‐up
activities.
To date, spill response activities by EBMUD have included: jetting and flushing culverts; removing
concrete from the open channel with shovels, dig bars, powered chisels, jackhammers, and vacuum
equipment; removal of vegetation splashed with concrete; and instream pebble/gravel replacement. A
summary of the response activities is provided in a communication from EBMUD to the California’s
Office of Emergency Services (Appendix A). Subsequent to the initial response activities, EBMUD has
coordinated with the City of Oakland to allow the City to repair a wastewater pipe that was discovered
during response activities to be leaking sewage into the creek. EBMUD is also investigating the source of
a possible potable water leak that may be discharging a small volume of treated water to the stream.
1.2 PURPOSE AND OBJECTIVES In July 2015, EBMUD contracted Horizon Water and Environment (Horizon) to conduct an assessment of
the affected area and develop a Restoration and Monitoring Plan (RMP). The objectives of the
assessment were to evaluate the site carefully, characterize site conditions, and identify any residual
effects from the concrete spill and clean‐up response. This report presents the finding from the site
assessment, recommends actions to restore the stream to the pre‐spill condition, and provides a plan to
continue monitoring stream recovery from residual spill‐related effects.
1.3 SETTING The release of cellular concrete took place in the headwaters of the Rockridge Branch of Glen Echo
Creek (Figure 1). This branch of Glen Echo Creek drains mostly residential areas in the Broadway
Terrace/Hillcrest neighborhood in Oakland. Other notable land uses in the Rockridge Branch watershed
include the Claremont County Club golf course, St. Mary and Mountain View cemeteries, schools and
churches, and a small commercial center at the intersection of Broadway Terrace and Clarewood Drive.
The drainage area of the Rockridge Branch at the downstream end of the assessment area is 0.5 square
mile and land cover is approximately 60% impervious (USGS 2015). The Rockridge Branch of Glen Echo
Creek joins the main branch of Glen Echo Creek (aka Cemetery Creek) near 30th Street and Broadway in
central Oakland. Glen Echo Creek discharges to Lake Merritt approximately 2,500 feet downstream of
the confluence with the Rockridge Branch.

Glen Echo Creek Post-Spill Restoration and Monitoring Plan
Horizon Water and Environment November 2015 2
2.0 SITE EVALUATION There are three primary sections or “reaches” of open channel in the spill-affected portion of Glen Echo Creek. For the purposes of this assessment, the open channel sections are designated Reaches 1 through 3, with Reach 2 further sub-divided into Reaches 2a and 2b (Figure 1). Much of Glen Echo Creek flows underground in culverts in the spill-affected area. The culverted sections of the creek were not evaluated as part of this assessment.
2.1 METHODS
The site evaluation included an assessment of: (1) physical conditions in the channel and adjacent areas, (2) riparian habitat, (3) the benthic macroinvertebrate (BMI) community, and (4) water quality. The site evaluation focused on assessing current conditions in light of the concrete spill, response activities, and what residual effects remained. The site evaluation was conducted over several days in August and September 2015. Table 1 lists the personnel that participated in the site evaluation along with their affiliation and experience.
Table 1. Personnel Involved in the Site Evaluation Name Area of Expertise Affiliation Years of Experience
Ken Schwarz, PhD. Geomorphology Horizon Water and Environment 22 Kevin Fisher, MS, PWS Riparian Ecology, Wetlands Horizon Water and Environment 18 Matthew Weld, PE. Civil Engineering, River
Restoration Waterways Consulting 18
Matthew Cover, PhD. Stream Ecology, Freshwater Invertebrates, Geomorphology
Independent/CSU Stanislaus 13
Brian Piontek, MS Environmental Science Horizon Water and Environment 5 Robin Hunter Botany Horizon Water and Environment 3 Kathleen Harris Freshwater Invertebrates Independent 5 EBMUD System Water Quality Inspectors
Water Quality Testing EBMUD N/A
This section continues with a description of the methods used for evaluating the spill-affected areas.
Physical Conditions This portion of the evaluation assessed channel form and structure, channel stability, geomorphic processes, and the distribution of cellular concrete. Geomorphic structure was documented by surveying channel slope (longitudinal profile) and representative cross-sections in each reach. Bedrock exposures and channel bed conditions were noted. Unstable portions of the channel (e.g., headcuts, streambank erosion) were mapped with a Trimble GeoXT Global Positioning System. At each point of instability a qualitative assessment was made as to whether the concrete spill or response activities may have contributed to the unstable conditions, or if they are unrelated. Any residual cellular concrete or cleanup materials that were not removed during the response phase were mapped and documented.
Glen Echo Creek Post-Spill Restoration and Monitoring Plan
Horizon Water and Environment November 2015 3
Riparian Habitat The habitat assessment included an inventory of plant species in the affected areas. Areas that had been trampled or compacted during spill response activities were mapped. An attempt was made to identify vegetation that may have been directly affected by the concrete spill or response activities.
Benthic Macroinvertebrates A rapid assessment of the BMI community based on the methods of Herbst et al. (2001) was conducted in all reaches. Sampling by this method includes selecting a sampling location, kicking and rubbing the substrates in a 1 ft2 sampling area and collecting the dislodged organisms. Collected organisms are collected into a bucket and then placed into a shallow pan. A subsample is then placed in a clean pan for identification. Sampling stations were established at locations representative of the reach conditions. In Reach 1 all standing water and intermittent pools were sampled, and Reach 2a was comprehensively sampled. No permanent sampling locations were established in these reaches. Sampling included field identification and abundance estimates of dominant taxa (generally to the family taxonomic level) and rapid visual habitat survey (substrate conditions, organic matter, overall habitat quality). Additionally, identifications of voucher specimens were performed in the laboratory (usually to the genus level).
Water Quality Water quality data have been collected by EBMUD at six locations within the affected area. Data were collected daily from April 8 or April 10 through April 30, 2015. Weekly and then monthly sampling continued at one location in each Reach and is currently being done monthly as of November 2015. In addition, more extensive soil and leachate pH sampling was conducted in a 75-foot section of the stream within Reach 2B on June 15, 2015 by AECOM. EBMUD also monitored leachate pH in this area for about six weeks after the AECOM work.
2.2 RESULTS
Physical Conditions Figures 2 through 5 depict the results of the physical channel assessment. The topographic survey of the channel profile and cross-sections are provided in Appendix B.
Reach 1 (~300 linear feet) Reach 1 has an average channel slope of approximately 7%, which is characteristic of a relatively steep headwater channel. The streambed includes a heterogeneous range of sediment from mud to small boulders. A bedrock exposure near the footbridge at the upstream end of Reach 1 and the culvert at the downstream end of the reach establish grade control for the channel. Between these two points, several headcuts were identified (Figure 2). These headcuts were present before the spill. There is evidence of substrate removal in the vicinity of the headcuts (Figure 2, Photo 3). It is not known if the substrate removal will affect the stability of the headcuts. Medium to coarse sized pebble (10-30mm) gravel was added to portions of this reach under EBMUD wildlife biologists supervision during the initial emergency response and clean up.

Glen Echo Creek Post-Spill Restoration and Monitoring Plan
Horizon Water and Environment November 2015 4
Residual cellular concrete noted in Reach 1 includes splatter on the banks (Figure 2, Photos 1 and 3). All of the splatter was observed on banks or rocks at or below bankfull1 elevation. The area covered by residual concrete splatter, coating or staining is estimated to be 250 square feet (ft2). In all locations the coating of concrete appeared to be on the order of several millimeters thick.
Reach 2a (~120 linear feet) Reach 2a has an average channel slope of approximately 2.5%, characteristic of a moderate gradient alluvial stream. The gravel streambed is composed primarily of pebbles and small cobbles with some small boulders; medium to coarse sized pebble (10-30 mm) gravel was added to this reach as part of the post spill-response activities. Bedrock near the upstream end of the reach and the culvert at the downstream end establish grade control for the channel. No instability in the channel profile was noted between these two points. Some minor bank excavation (approximately 4-6 inches) was noted along approximately 30 ft of the left bank and 20 ft of the right bank (Figure 3). This excavation is assumed to be the result of concrete removal during the spill response.
Residual cellular concrete noted in Reach 2 included intermittent concrete splatter and some fragments of concrete foam (Figure 3, Photos 1 and 2). All of the splatter was observed on banks or rocks at or below bankfull elevation. The area covered by residual concrete splatter, coating or staining was estimated to be 80 to 110 ft2.
Reach 2b (~500 linear feet) The upper portion of Reach 2b has a moderate bed slope of approximately 1.6%. This upper section of the channel has an earthen bed composed of fines and coarse sand to fine pebble-sized gravel. This upper section is followed by a 65-foot section that is a constructed concrete box channel (Figure 4). Downstream of the concrete box channel the majority of the streambanks are constructed concrete revetments or retaining walls. Approximately 30 ft downstream of the footbridge the channel bed transitions to concrete and the stream then flows over a 20-foot tall rock cascade (waterfall) (Figure 4). The waterfall has been grouted with concrete which is presumably underlain by bedrock. Downstream of the waterfall, there is a short, relatively steep section (6% slope) with a bed composed primarily of large riprap boulders.
No instability in the channel profile was noted in this reach. Some minor undermining or excavation was noted at the base of the waterfall and on the left bank below the waterfall. Some gravel bags had been placed in these areas to fill voids in the banks (Figure 4).
Residual cellular concrete noted in Reach 2b included intermittent concrete splatter on the banks. (Figure 4, Photos 1 and 2). The area covered by residual concrete splatter, coating, or staining was estimated to be 500 ft2. In nearly all locations the coating of concrete appeared to be on the order of several millimeters thick. It is important to note that some of the residual concrete staining was observed on pre-existing concrete retaining walls or revetments in the channel. Medium to coarse
1 Bankfull refers to the water level, or stage, at which a stream is near or at the top of its banks, further rise would result in water moving over or beyond the bank. In some alluvial channels the bankfull stage is marked by the presence of a bench or other geomorphic feature inset within a larger multi-stage channel. Bankfull flow has a recurrence interval of approximately 1-2 years.

Glen Echo Creek Post-Spill Restoration and Monitoring Plan
Horizon Water and Environment November 2015 5
sized pebble (10-30mm) gravel was added to portions of this reach under EBMUD Wildlife Biologists supervision during the initial emergency response and clean up.
Reach 3 (~1,000 linear feet) Reach 3 has an average channel slope of approximately 2.4%, which is relatively uniform throughout the reach. The channel is relatively straight throughout the reach; there is some sinuosity and a small inset bench (floodplain) in the upstream portion of the reach. The channel has a significant amount of pre-existing concrete rubble in the bed, and some banks are vertical concrete walls. A single point of instability was noted in the channel profile (Figure 5), but the abundance of concrete rubble in the stream makes it unlikely that the channel would downcut significantly. There are many areas of bank instability, most notable in failed sections of concrete walls. No residual cellular concrete or other evidence of the spill and response were observed in Reach 3.
Riparian Habitat
Riparian habitat conditions observed in each reach are described below. A plant species list for each reach is provided in Appendix C.
Reach 1 The vegetation community in Reach 1 is dominated by coast redwood (Sequoia sempervirens), California buckeye (Aesculus californica), black oak (Quercus kelloggii), and domestic plum trees (Prunus sp.) in the canopy and mid-story. The understory is dominated by non-native plants, including English ivy (Hedera helix), Himalayan blackberry (Rubus armeniacus) and various escaped herbaceous ornamental plants and weed species. Vegetation trampling and soil compaction was observed along narrow footpaths (approximately 3 to 4 ft wide) and a roughly 700 ft2 area at the downstream end of the reach. Some of the vegetation trampling and compaction along footpaths may have been present prior to the spill. Adjacent vegetation and inspection of spill response photos suggest these areas were monocultures of English ivy prior to the disturbance.
Reach 2a Reach 2a is dominated by coast redwood, coast live oak (Quercus agrifolia), and California bay laurel (Umbellularia californica) in the canopy and mid-story. The understory is similar to Reach 1, and is dominated by English ivy, Himalayan blackberry, as well as native thimbleberry (Rubus parviflorus) and native California blackberry (Rubus ursinus). Trampling and soil compaction appears to mainly have affected English ivy and Himalayan blackberry in a 450 ft2 area on a slope above the channel.
Reach 2b Reach 2b has a canopy and mid-story similar to Reach 2a, with the addition of plum trees and other escaped small ornamental trees. The understory is dominated by English ivy, and the native species horsetail (Equisetum arvense) and tall nutsedge (Cyperus eragrostis). Horsetail and tall nutsedge appeared to be recolonizing gravel bars in the channel. Trampling and soil compaction mainly affected English ivy and horsetail in a 500 ft2 area in the upstream portion of the reach and a 200 ft2 area below the waterfall. Horsetail and tall nutsedge may also have been abundant in the channel.

Glen Echo Creek Post-Spill Restoration and Monitoring Plan
Horizon Water and Environment November 2015 6
Reach 3 Reach 3 has canopy of mature redwoods throughout most of the reach. The understory is dominated by non-native turf grasses such as Kentucky bluegrass (Poa pratensis), Bermuda grass (Cynodon dactylon), and ryegrass (Festuca sp.). No compaction or trampling was noted. It is possible that some aquatic plants in the channel may have been affected by the spill.
Benthic Macroinvertebrates
Benthic macroinvertebrate taxa richness (i.e., the number of different types of organisms) was greatest in Reach 3, followed by Reach 2b, and Reach 1 (Table 2). No BMI were observed in Reach 2a, despite extensive sampling. The BMI community in Reach 3 was similar to that observed in other urban streams of the Bay Area. The community in Reach 2b had lower taxa richness than Reach 1, but the presence of long-lived taxa (i.e., mature larval insects with ~1 year life cycles) indicates that this community was somewhat resilient to recent disturbances. The Reach 1 community was indicative of isolated, stagnant pools with recent discharge of sewage effluent (Note: the City of Oakland informed EBMUD that the sewage leak was repaired subsequent to the sampling event, but later reported that the repairs did not stop the entire leak and some sewage was still present in the creek as of October 2015). In Reach 2a no BMI were detected, although the physical habitat appeared suitable. Based on water quality testing for chlorine residual conducted by EBMUD after learning of these results, potable water has been identified in the upstream end of this reach, which is the likely explanation for the lack of BMI detected in this reach. EBMUD is currently investigating the source of the potable water leaks by using leak detectors on the distribution system in the area and by field observations upstream of the location.
Table 2. Summary of Benthic Macroinvertebrate Taxa Richness by Reach (Shaded boxes indicate taxa were observed in the reach)
Class Taxon Common Name 1 2a 2b 3
Insecta Baetis sp. Mayfly
Insecta Argia sp. Damselfly
Insecta Chironomidae Midge
Insecta Simuliidae Blackfly
Insecta Agabus sp. Water Beetle
Insecta Tipula sp. Cranefly
Insecta Psychoda sp. Drain fly
Malacostraca Amphipoda Scud
Oligochaeta Oligochaeta Aquatic worm
Gastropoda Physella sp. Aquatic snail
Turbellaria Turbellaria Flatworm
Taxa Richness 2 0 6 10

Glen Echo Creek Post-Spill Restoration and Monitoring Plan
Horizon Water and Environment November 2015 7
Water Quality Data from water quality sampling by EBMUD to date are provided in Appendix D, and data from soil and leachate sampling by AECOM are provided in Appendix B. In Reach 1 (5000 Clarewood site), pH was high (11.07-11.76) for about a week following the spill. The pH gradually declined through the month of April, and was consistently below 8 by early May. In Reach 2b (4530 Clarewood site), pH has fluctuated in the high 7s mid 8s range since April 10, 2015, when sampling began in this reach. In Reach 3 (golf course culvert), pH was elevated for several days following the spill and then returned to the mid 8s range. On June 15, 2015, AECOM found elevated leachate pit pH (10.3) in their sampling site GEC-L2, which is close to EBMUD and CDFW leachate sampling locations. However, water quality in the leach pit in the same location has since stabilized with pH levels between 8.04 and 8.20 after August 6, 2015 (Appendix D).
3.0 SUMMARY OF RESIDUAL IMPACTS Residual impacts of the concrete spill and response were observed in Reaches 1, 2a, and 2b; no residual impacts were observed in Reach 3. The residual impacts of the concrete spill and response activities are summarized in Table 3.
Table 3. Summary of Residual Impacts from Concrete Spill and Response
Reach Physical Channel Form
Residual Concrete Impacted Vegetation
Trampling/ Compaction
Reach 1 Substrate removal. Evidence of digging marks.
Staining/Splatter over ~250 ft2
Predominantly English ivy
~750 ft2 of trampling and compaction
Reach 2a Chiseling or digging marks on banks. Substrate removal.
80 – 110 ft2 of intermittent staining/splatter on both sides of channel
Predominantly English ivy and Himalayan blackberry
~450 ft2 of trampling and light compaction
Reach 2b Minor undercut banks at downstream end of reach. Substrate removal.
500 ft2 of intermittent staining/splatter on both sides of channel
Predominantly English ivy, horsetail, and nutsedge
~700 ft2 of trampling and compaction
Reach 3 None related to spill or response
None found
Possibly some aquatic plants
None noted
Concrete staining and splatter was observed in Reaches 1, 2a, and 2b. The concrete was observed primarily on rocks in the channel and on banks below the bankfull elevation. In general, the concrete staining and splatter appeared to be several millimeters thick. Minimal concrete foam was observed, but small fragments were present in these reaches. The residual cellular concrete in the channel was completely cured. At present, the concrete is chemically inert and not likely to cause a long-term biological response. However, further monitoring is needed, particularly BMI community recovery, to verify this assertion.
Spill response activities involved substrate removal with a vacuum truck and required chiseling or excavation with hand tools in the bed and bank. Evidence of this disturbance was observed in some

Glen Echo Creek Post-Spill Restoration and Monitoring Plan
Horizon Water and Environment November 2015 8
location in Reaches 1, 2a, and 2b. Removal of the stream’s natural armoring layer could contribute to channel degradation, but at this stage it is not clear whether this will cause or contribute to instability of the channel bed or banks prior to the channel re-armoring. Monitoring the affected area is recommended to assess channel stability (See Section 5).
The vegetation community in the affected area includes native mature trees with an understory dominated by non-native, invasive species. The riparian habitat has relatively low wildlife value because of the narrow or non-existent buffer with adjacent development, but species habituated to human activity do use this area. Spill response activities resulted in removal and trampling of vegetation (Table 3). Most of the areas disturbed by response activities are dominated by English ivy, which is an invasive non-native species. Rehabilitation of disturbed vegetation and compacted soils is discussed in Section 4.3.
4.0 RECOMMENDED RESTORATION ACTIONS This section provides recommendations to restore the affected areas to pre-disturbance conditions.
4.1 SITE CLEAN-UP
The vast majority of cellular concrete and spill response materials (including gravel bags) have been removed from the affected area, but a small amount of debris remains in the channel. Reaches 1 through 2b would benefit from a final round of detailed clean-up to remove any remaining materials in the channel. Cleaning of staining or concrete splatter on earthen banks and rocks is not recommended because the disturbance caused by this would outweigh the benefits.
4.2 STREAM BED GRAVEL AUGMENTATION
As mentioned previously, spill response activities involved channel bed and substrate removal with a vacuum truck. This was necessary to clean the bed of cellular concrete, but resulted in the removal of some higher quality benthic habitat (e.g., pebble and cobble) and possible disturbance of a natural armoring layer on the channel bed surface. During the response phase, EBMUD added a total of two cubic yards (CY) of medium to course sized pebble (10-30 mm) gravel to Reaches 1, 2a, and 2b. In the site evaluation it was determined that placing additional bed material in Reaches 1 and 2b would likely benefit BMI recovery and help protect the channel bed from erosion. Streambed conditions observed in Reaches 2a and 3 did not warrant placement of additional material.
Figures 6 and 8 show the proposed areas for adding channel bed gravel. In Reach 1, a 4-inch layer of medium to very course pebble and cobble gravel (50-150 mm) will be placed over 50% of the streambed for 180 linear feet. In Reach 2b, a 4-inch layer of course to very course pebble gravel (25-75 mm) will be placed over 75% of 70 linear feet of streambed. It is estimated that approximately five and three cubic yards of bed gravel will be added to Reaches 1 and 2b, respectively. The material will be placed in the channel by hand using buckets and wheelbarrows to carry the material from an upland staging area to the stream. The recommended size distribution is provided in Tables 4a and 4b. The size of the material was based on site observations of existing material in the channel and target habitat conditions. It is

Glen Echo Creek Post-Spill Restoration and Monitoring Plan
Horizon Water and Environment November 2015 9
anticipated that this material will be mobile in the streambed at flows approximating a bankfull event. It is expected that some material will be naturally redistributed in the affected area and some will be transported further downstream. The redistribution of the gravel placed in the channel will be monitored (See Section 5).
Table 4a: Reach 1 Recommended Gravel Augmentation Percent of Mix
(by weight) Size Range
(mm) Size Range
(inches) 10 150-200 6-8 50 100-150 4-6 30 50-100 2-4 10 2-50 0.08-2 <1 <2 < 0.08
Table 4b: Reach 2b Recommended Gravel Augmentation Percent of Mix
(by weight) Size Range
(mm) Size Range
(inches) 25 75-100 3-4 65 25-75 1-3 10 2-25 0.08-1 <1 <2 < 0.08
4.3 VEGETATION REHABILITATION
Vegetation and soil rehabilitation is proposed for areas that were disturbed during the spill and response. Soils in affected areas will be de-compacted and lightly scarified with rakes and hand tools such as picks. Native plant seed will be applied to the scarified areas at 84 pounds per acre (lbs/acre) (Table 5). The seed mix will also include a sterile wheat grass to stabilize soils and provide additional erosion control. Weed-free straw mulch will be applied to affected areas at 2,000 lbs/acre. The mulch will be crimped into soil or a tacifier will be applied to stabilize mulch. The treatment would cover approximately 1,900 ft2, including 700 ft2 in both Reaches 1 and 2b and 500 ft2 in Reach 2a (Figures 6 through 8).
The goal of rehabilitating the disturbed areas is to provide erosion control and facilitate revegetation. However, the site’s shaded conditions and steep slopes are difficult to revegetate. In a similar undisturbed setting a considerable amount of bare ground would be expected. While the performance of the rehabilitation is uncertain, it is likely to aid in the recovery of the disturbed areas.

Glen Echo Creek Post-Spill Restoration and Monitoring Plan
Horizon Water and Environment November 2015 10
Table 5. Seed Mix for Vegetation Rehabilitation Scientific Name Common Name lbs/acre Grasses: Bromus carinatus California brome 15
Leymus triticoides creeping wildrye 15
Muhlenbergia rigens deergrass 8
Poa secunda – may be best one-sided bluegrass 15
25% sterile cover grasses (e.g., Regreen™) 20
Forbs/Vines:1 Claytonia perfoliata miner's lettuce 2
Claytonia sibirica candy flower 1
Clarkia gracilis elegant clarkia 1
Dicentra formosa Pacific bleeding heart 1
Lonicera hispidula pink honeysuckle 1
Vicia americana American vetch 5
Total 84
1. include these species as available from commercial suppliers
5. MONITORING Monitoring of the spill-affected area will take place for an additional 2 years to assess the stream’s recovery from the spill and evaluate the performance of restoration actions. The following monitoring activities and performance standards are proposed. Table 6 provides the frequency and schedule for monitoring activities.
5.1 MONITORING METHODS
Water Quality: quarterly sampling will include measurements of pH and dissolved oxygen (DO) at stations located in Reach 1 (immediately behind 5000 Clarewood), Reach 2b (below 4530 Clarewood), and Reach 3 (First Footbridge within Golf Course). Ammonia (NH3) and chlorine (CL2) will be tested on an as-needed basis for tracking sewage and potable water presence.
Benthic Macroinvertebrates: Rapid sampling in all reaches for presence and species richness. Qualitative assessment of habitat quality (semi-annual monitoring).
Channel Stability: Annual re-survey of channel longitudinal profile and three cross-sections per reach for Reaches 1, 2a and 2b. The cross-sections will be located in areas with evidence of bank erosion or instability.
Stream Bed Material: Annual estimate of the volume of added bed gravel that remains in the affected area and photo-documentation. Representative sediment clasts for a range of grain sizes (e.g., 2- 10”) will be painted to serve as tracer particles. Recovery of these painted clasts will allow for assessment of sediment mobility.

Glen Echo Creek Post-Spill Restoration and Monitoring Plan
Horizon Water and Environment November 2015 11
Vegetation Rehabilitation: Annual visual estimate of plant cover in treated areas and photo-documentation.
5.2 PERFORMANCE STANDARDS
Water Quality:
pH: Within normal range for streams (6.5 – 8.5)
Dissolved oxygen (DO): >5.0 mg/L when water is flowing 5 gallons per minute or greater
Benthic Macroinvertebrates: Stable or increased BMI abundance and diversity
Channel Stability: Minimal of degradation (less than 0.2 ft) or lateral erosion (less than 0.5 ft). Channel adjustments may be more dynamic if a large flood event occurs)
Stream Bed Material: Some portion of the added bed gravel is retained in the channel
Vegetation Rehabilitation: Increased plant cover with no rilling/gullying or other erosional features developing in the rehabilitation areas
Table 6. Monitoring Schedule and Frequency
Activity 2015 2016 2017 Q4 Q1 Q2 Q3 Q4 Q1 Q2 Q3 Q4
Water Quality Monitoring X X X X X X X X X BMI Monitoring X X X X Channel Stability X X
Stream Bed Material X X Vegetation Rehabilitation X X
6. IMPLEMENTATION SCHEDULE The proposed schedule for implementing the RMP is provided in Table 7. The schedule assumes that resource agencies or other interested parties will provide feedback or guidance on the RMP by December 2016.
Table 7. Schedule for Implementing the Restoration and Monitoring Plan Task Date Obtain preliminary approval of RMP from resource agencies January 2016 Implement bed gravel augmentation and vegetation rehabilitation March 2016 Initial BMI, channel stability, bed gravel, vegetation rehabilitation monitoring Spring 2016 Implement additional restoration or adaptive management measures. Additional BMI monitoring.
Summer/Fall 2016
Continue stream recovery monitoring Winter 2016- Fall 2017
Complete RMP and report 12/31/2017

Glen Echo Creek Post-Spill Restoration and Monitoring Plan
Horizon Water and Environment November 2015 12
7. REFERENCES Herbst, D.B., Feng, A.Y., and Gregorio, D.E. 2001. The California Streamside Biosurvey. State Water
Resources Control Board, Sacramento, CA.
U.S. Geological Survey (USGS). 2015. StreamStats Version 3 Beta. Drainage analysis for the affected area. http://streamstatsags.cr.usgs.gov/v3_beta/BCreport.htm

Figures

Base Map Sources:: Source: Esri, DigitalGlobe, GeoEye, i-cubed, Earthstar Geographics, CNES/Airbus DS,USDA, USGS, AEX, Getmapping, Aerogrid, IGN, IGP, swisstopo, and the GIS User CommunityContent may not reflect National Geographic's current map policy. Sources: National Geographic, Esri,DeLorme, HERE, UNEP-WCMC, USGS, NASA, ESA, METI, NRCAN, GEBCO, NOAA, increment P Corp.
REACH 2a
REACH 2bREACH 3
REACH 1
Area of Interest
Broadway Terrace
Figure 1Assessment Area
0 0.125 0.25
Miles
Clarewood Drive
24
Broadway Terrace

Concretesplatter onof banks
Headcut with largeunstable boulders
Bank erosion,evidence of
digging marks,concrete splatterStairs
SmallHeadcut
RebarRevetment
MainHeadcut
Footbridge1
23
4
0 50 10025Feet
Channel (approximate)Residual Cellular ConcreteBank ErosionPoint of Bed Instability
Figure 2Reach 1 Site Evaluation
4. Main headcut 3. Digging marks and splatter 2. Bank erosion and headcutwith large boulders
Centerfor
SpiritualLiving
1. Splatter on banks
Note: Sampling for bethic macroinvertebrates was conducted in all standing water and intermittent pools in Reach 1. No permanent sampling locations were established.

Concrete splatter/debrison banks and in channel
4" to 6" of minor bankexcavation, some
staining/coating/splatterof concrete
12
3
4
0 50 10025Feet
Clarewood Drive
Channel (approximate)Residual Cellular Concrete
Figure 3Reach 2a Site Evaluation
4. Minor bank excavation 3. Trampling and compaction 2. Concrete fragments 1. Concrete in bankNote: Reach 2a was comprehensively sampled for bethic macroinvertebrates. No permanent sampling locations were established.

4" to
6" of
minor b
ank
excava
tion. S
ome
stainin
g/coat
ing/sp
latter
of conc
rete.
0 50 10025Feet
Channel (approximate)Residual Cellular ConcreteResidual Foam Concrete or Response Materials
Figure 4Reach 2b Site Evaluation
Foamin Channel
ConcreteSplatter
ConcreteBox Channel
BMI SampleStation
FootbridgeWaterfall
6' x 3' Patch ofGravel Bags
Boulder riprap channel,intermittent concrete
and earthen banks
BMI SampleStation
ConcreteChannel Bed
12
3
4
ResidualGravel Bags
4. Residual gravel bags 3. Base of waterfall 2. Upstream compaction 1. Staining

0 100 20050Feet
Channel (approximate)Point of Bed Instability
Figure 5Reach 3 Site Evaluation
CMPCulvert
SmallHeadcut
ConcreteWall
FootbridgeBMI SampleStation
Footbridge
ConcreteWall
BMI SampleStation
1. Looking downstream from the top of R32. Looking downstream3. Looking upstream at
small headcut4. Benthic invertebrate sampling station
1
23
4

0 50 10025Feet
Channel (approximate)
Point of Bed Instability
Vegetation Rehabilitation
Substrate Addition
Figure 6Reach 1 Restoration Activities
Reach 1 Vegetation Rehabilitation:Scarify soil; apply seed and mulch,
approximately 700 sq ft
Reach 1 Substrate Addition:2 to 6 inch gravel and cobble over 50% of the streambed,
approximately 4 to 5 cubic yards
Rebar Revetment
FootbridgeStairs
4 32 1
4. Vegetation Rehabilitation 3. Monitor Headcut 2. Substrate Addition 1. Substrate Addition

1
3 2
0 50 10025Feet
Clarewood Drive
Channel (approximate)
Vegetation Rehabilitation
Figure 7Reach 2a Restoration Activities
Reach 2a Vegetation Rehabilitation:Scarify soil; apply seed and mulch.
Approximately 500 sq ft.
2. Vegetation Rehabilitation 1. Existing streambed condition3. Monitor bank stability

4" to
6" of
minor b
ank
excava
tion. S
ome
stainin
g/coat
ing/sp
latter
of conc
rete.
0 50 10025Feet
Figure 8Reach 2b Restoration Activities
ConcreteBox Channel
BMI SampleStation
Footbridge
Waterfall
BMI SampleStation
ConcreteChannel Bed
1
34
Channel (approximate)Vegetation Rehabilitation
Substrate Addition
Reach 2b Vegetation Rehabilitation/Erosion Protection:Scarify soil; apply seed and mulch
Approximately 500 sq ftReach 2b Vegetation Rehabilitation/Erosion Protection:
Scarify soil; apply seed and mulchApproximately 200 sq ft
Reach 2b Substrate Addition:1 to 3 inch gravel, 3 inches deepover 75% of 70 ft of streambed.
Approximately 3 cubic yards.
2
4. VegetationRehabilitation
3. SubstrateAddition
2. SubstrateAddition
1. VegetationRehabilitation


Appendix A
EBMUD May 2015 Report to California Governor's Office
of Emergency Services

E3 EAST BAY MUNICIPAL UTILITY DISTRICT
May 7, 2015
Mr. Mark Ghilarducci, Director California Governor's Office of Emergency Services 3650 Schriever Avenue Mather, CA 95655
Re: Follow-up Notice and Report on Release of Cellular Concrete into Glen Echo Creek (Rockridge Branch), Oakland, CA on April 8, 2015, OES Control No. 15-1951
Dear Mr. Ghilarducci:
We are providing this letter and the Emergency Release Follow-up Notice Reporting Form in Attachment 1 (and copying several other regulatory agencies) in response to the cellular concrete spill into the Rockridge Branch of Glen Echo Creek that occurred and was initially reported on April 8, 2015 in Oakland, CA.
Description of Incident On April 8, 2015, from approximately 9:30am-11:30am, up to 170 cubic yards of cellular concrete was accidentally released into a storm drain located at the intersection of Harbord Drive and Florence Avenue in Oakland, CA. The cellular concrete flowed through enclosed storm drain pipes and open creek channels following the release. Flowing cellular concrete was observed in the creek channel approximately 1/2 mile downstream from the point of origin during the initial response. Other water quality effects related to the release such as elevated pH and visible concrete fines in the creek channel were observed almost one mile from the point of origin. Based on subsequent water quality testing and visual observations, no water quality effects were noted more than one mile from the point of origin. Attachment 2 contains a map showing the location of the spill.
The cellular concrete batch recipe involved in this spill is a mixture of 37.5% (by weight) potable water, 55% Portland cement (CAS 65997-15-1), and 7.5% Elastizell JLE Foam Concentrate, a proprietary mixture of protein hydrolyzate and anionic surfactants. The material safety data sheet for the Foam Concentrate states that there are no hazardous ingredients in it as defined by the OSHA Hazard Communication Standard.
Cause and Preventive Actions The incident occurred when cellular concrete was being added to a 1,500 foot segment of an abandoned 24 inch water main along Harbord Drive in Oakland. A valve near the bottom of this water main was accidentally left open, causing the cellular concrete to escape through an underground "blow-off' drain pipe and enter the storm drain system. The release was first reported to the contractor filling the pipe at 11:20am and the open valve was closed shortly after

Mr. Mark Ghilarducci, Director California Governor's Office of Emergency Services May 7, 2015 Page 2 of 6
that time. An investigation into how the valve was left open — and how to prevent this from occurring again — is currently underway.
Initial Notifications and Regulatory Involvement The following agencies were notified by East Bay Municipal Utility District (District) shortly after the spill occurred on April 8, 2015.
• California Office of Emergency Services (OES) (Control No. 15-1951) • San Francisco Regional Water Quality Control Board (RWQCB) • California Department of Fish and Wildlife (CDFW)
CDFW was present at all times through the first nine days of the response (April 8-16) and provided periodic onsite oversight after that time. The response was managed under Joint Incident Command by CDFW and the District from April 10-April 16 and then the District only through April 29. The City of Oakland Public Works Department, Alameda County Department of Environmental Health, and RWQCB were also present at the site during various parts of the cleanup. US EPA Region IX telephoned the District to request information and has been provided with updates via telephone and e-mail regarding the spill. The District also directly notified the Army Corp of Engineers as the initial emergency cleanup actions were nearing completion.
Response Activities The response effort was managed in six distinct areas for ease of keeping track of status and managing the work crews. Response activities by section are summarized below starting at the point of origin and moving downstream.
Upper Pipe Section — Point of Origin to First Creek "Daylight" Geographically, this section runs from the storm drain at Harbord Drive and Florence Avenue to the back yard property line of 4987 Harbord Drive. This section consists of approximately 720 feet of clay storm drain pipe ranging from approximately 6 to 18 inches in diameter that were partially filled with cellular concrete. In some cases the pipes were more than half blocked. All of the impacted pipes in this section, except the last 100 feet, were jetted using high pressure water to clear as much cellular concrete as possible. The last 100 feet of this pipe, from Harbord Court to the creek "daylight", was only flushed with water (not jetted) due to preexisting damage to the pipe (cracks, root intrusion) to avoid the risk of further damage. All jetting and flush water was captured, pumped out of the system and disposed offsite.
Upper Creek Section — First Creek "Daylight" to Spiritual Center Geographically, this section runs from the first "daylight" into the open creek behind 4987 Harbord Drive and ends behind the Spiritual Center at 5000 Clarewood Drive, where it reenters the storm drain pipe system. This section consists of approximately 265 feet of open creek, with typical dry weather flows of approximately 5 gallons per minute. In this section, cellular concrete was removed by shovels, dig bars, powered chisels, jackhammers, and vacuum truck. Several additional passes to remove smaller chunks of concrete and vegetation coated with concrete dust were made as well to clean this section of creek. All wash water and some creek

Mr. Mark Ghilarducci, Director California Governor's Office of Emergency Services May 7, 2015 Page 3 of 6
water were also pumped out to facilitate cleaning and was disposed offsite. Some replacement rock was placed in portions of this creek bed under District biologist supervision at the suggestion of the CDFW.
Middle Pipe Section — Spiritual Center to Condos Geographically, this section runs from behind the Spiritual Center at 5000 Clarewood Drive to the next "daylighted" creek section behind the condominium at 4650 Clarewood Drive. This section consists of approximately 1,325 feet of primarily concrete pipe, most around 18 to 30 inch diameter. At least two areas of pipe in this section were observed by camera to be 80 to 90 percent blocked by cellular concrete after the spill. All of the pipes in this section were jetted and flushed using the same techniques as in the upper section. Rodding equipment (consisting of a rodding machine, cables and a cutting head) was also used to break up material in some pipes within this section. Jetting and flush water was captured and sent off site for disposal during these operations. One of two diversions of creek/storm water to the sanitary sewer was done in this section to reduce impacts to the creek and to facilitate cleaning since the creek downstream was easier to clean when it was dewatered.
Middle Creek Section — Clarewood Condos Geographically, this section runs from 4650 Clarewood Drive to 4480 Clarewood Drive. The creek is located behind all of the condominiums along Clarewood Drive, about 50 feet down an embankment. This section consists of approximately 465 feet of open creek split into two segments by a 120 foot, 30 inch concrete pipe that runs under Clarewood Mall. The 120 foot pipe was pressure washed and flushed using a fetter to remove any chunks of concrete and residue adhered to the pipe walls. The open creek areas were cleaned using techniques similar to those used in the upper creek — vacuum truck removal of liquid and solid cellular concrete and breaking up the hardened concrete using powered chisels, dig bars, and other equipment. Some concrete was left in place along the banks in the last 50 feet of this creek section, below the waterfall feature, due to slope stability concerns and safety reasons since retaining walls and at least one condominium foundation were in the immediate area which could be damaged if disturbed. Some replacement rock was placed in portions of this creek bed, upstream of the waterfall feature, under District biologist supervision at the suggestion of the CDFW.
Lower Pipe Section — Clarewood Condos to Golf Course Outfall Geographically, this section runs from 4480 Clarewood Drive to the outfall within the Claremont Country Club golf course. The golf course culvert outfall is about 150 feet west of the intersection of Broadway Terrace and Clarewood Drive. This section consists of approximately 1,330 feet of concrete storm drain pipe with diameters of 30 inches or greater, except for the last 50-100 feet which is a large, arched culvert that empties into the golf course creek. These pipes were not significantly blocked by concrete after the spill but contained residue adhered to the pipe walls about 4 to 6 inches above the pipe invert. These pipes were flushed and jetted to remove as much concrete residue as possible. As above, jetting and flush water was captured and disposed offsite. The second diversion of creek/storm water to the sanitary sewer was near the bottom of this section.

Mr. Mark Ghilarducci, Director California Governor's Office of Emergency Services May 7, 2015 Page 4 of 6
Lower Creek Section — Golf Course Geographically, this section runs from the Claremont Country Club golf course outfall about 1,000 feet downstream within the golf course property. This section of creek is contained within old retaining walls defining the creek channel, and the creek bottom is very rocky. No cellular concrete flowed into this section of creek, however cement fines were noted along the bottom of the creek and foam particles were noted floating in the water. A large cofferdam was built downstream of all visible fines early in the response as a sediment control measure and left in place until water quality had been stable for several days in this section of creek. The open creek area was cleaned by hand removal of material and by using a vacuum truck to remove the fines. No concrete needed to be chipped out of the creek bed, so less aggressive techniques were sufficient.
Materials Recovered and Waste Disposal Up to 170 cubic yards of cellular concrete was released and approximately 164 cubic yards was recovered. Attachment 3 contains a list of all cellular concrete loads disposed of offsite and is the basis of the estimate of materials recovered along with field observations. Some concrete remains adhered to storm drain pipes, but nearly all known concrete that could be recovered was removed. In addition to removing concrete, approximately 120,000 gallons of water from creek cleaning and jetting/flushing operations was removed, stored in rental tanks, characterized, and disposed offsite at the District Main Wastewater Treatment Plant as non-hazardous waste. Approximately 670,000 gallons of water was diverted from the creek to the sanitary sewer during the cleanup as well. Attachment 3 also outlines volume estimates for the liquid wastes noted above. Lastly, two 20-cubic-yard dumpsters were used to collect sand bags, straw wattle, and other solid wastes generated during the cleanup and will be disposed in May 2015.
Water Quality Testing The District conducted daily water quality monitoring in the affected sections of creek described above during response operations. District staff did the monitoring using calibrated field meters. All monitoring results are summarized in Attachment 4. Monitoring data from just upstream of the spill and in Temescal Creek (similar watershed) established the baseline water quality of pH 8.5 and dissolved oxygen in the 8 to 9 mg/L range. The upper creek section experienced elevated pH levels for about 20 days (pH 9-11) after the spill and returned to background levels around April 29. Dissolved oxygen readings in the upper creek section have varied between normal and lower than background levels since the spill and remain depressed as of May 4. The middle creek section pH and dissolved oxygen readings have been very close to background since April 10, when sampling started at this location. The lower creek section on the golf course experienced elevated pH levels for about 3 days after the spill, and returned to normal after that time. One notable exception to this is the culvert sample point on the golf course where the sample location was in a stagnant pool where a lot of cement fines had settled. This sample point is not representative of water flowing in the creek due to hydrology and cement fines contamination in the pool in the initial response. Once the cement fines stopped settling in the pool and were vacuumed out, the pH quickly returned to normal.

Mr. Mark Ghilarducci, Director California Governor's Office of Emergency Services May 7, 2015 Page 5 of 6
Oil Sheen Report On April 11, 2015, at 10:15am, a faint oil sheen totaling an estimated size of 25 square feet was discovered in Glen Echo Creek behind 4987 Harbord Drive during the clean-up, emerging from the upstream storm drain. The sheen was reported to the US National Response Center (Report 1113323) and OES (Control No. 15-2026). Absorbent pads were placed on the sheen after it was discovered. An investigation was done at the site and it was determined that none of the vehicles and equipment involved in the response were leaking oil and that the oil was likely present from an unknown source upstream of the spill response site. The sheen was not observed later during the response activities.
Next Steps The response is currently transitioning from emergency response measures to longer term creek restoration evaluation and planning. The District intends to evaluate the scope and necessary measures to further restore the creek. Some specific issues that will be evaluated are erosion control, slope stabilization (if needed), habitat enhancement, and whether additional concrete removal in the middle creek waterfall section will be needed around the undermined slopes. The District is also continuing water quality monitoring and observations for at least two more weeks.
Please contact Chandra Johannesson, Manager of Environmental Compliance at (510) 287-0412 or cjohannegebmud.com if you have any questions regarding this letter.
Sincerely,
Michael R. Ambrose Manager of Regulatory Compliance
Attachments
MRA:CD:cd
Cc: California Department of Fish and Wildlife Attn. Sheree Christensen, Fish and Wildlife Patrol Lieutenant 7329 Silverado Trail Napa, CA 94558
Army Corp of Engineers Regulatory Division Attn. Katerina Galacatos, South Branch Chief 1455 Market Street, 16 th Floor San Francisco, CA 94103-1398

Mr. Mark Ghilarducci, Director California Governor's Office of Emergency Services May 7, 2015 Page 6 of 6
San Francisco Regional Water Quality Control Board Attn. Benjamin Martin, Environmental Specialist 1515 Clay Street, Suite 1400 Oakland, CA 94612
City of Oakland Public Works Department Attn. Lesley Estes, Program Manager Watershed, Stormwater and Measure DD 250 Frank Ogawa Plaza, Suite 4314 Oakland, CA 94612
Alameda County Department of Environmental Health Attn. Chris Tougeron, Senior Hazardous Materials Specialist 1131 Harbor Bay Parkway Alameda, CA 94502

CITY/ COMMUNITY COUNTY ZIP Alameda 94618
INCIDENT ADDRESS LOCATION Clarewood Drive and Harbord Drive Oakland
I CHECK IF CHEMICAL IS LISTED IN 40 CFR 355, APPENDIX A
CHECK IF RELEASE REQUIRES NO11FI - n CATION UNDER 42 U.S.C. Section 9603 (a)
BUSINESS NAME FACILITY EMERGENCY CONTACT & PHONE NUMBER East Bay Municipal Utility District Chandra Johannesson ( 510 ) 287 - 0412
INCIDENT MO DAY YR I -nm E
1 0 1 4 1 0 1 8 1 115 Il NO°TIEFSIFDI 11 314 17
OES DATE I (use 24 hr time) CONTROL NO. 1 1 1 5 1119 15 11
CHEMICAL OR TRADE NAME (print or type) CAS Number
Cellular concrete (see cover letter for mixture information) 65997-15-1 (Portland Cement)
1 ENVIRONMENTAL CONTAMINATION 'TIME OF RELEASE DURATION OF RELEASE FIAIR is WATER I IGROUNDFIOTHERI 0930 ° DAYS HOURSL.) .MINUTES
I PHYSICAL STATE CONTAINED PHYSICAL STATE RELEASED QUANTITY RELEASED SOLID ii LIQUID F1GAS FISOLID El LIQUID r7 GAS up to 170 cubic yards lis
A
B
C
C
ACTIONS TAKEN
Clean-up actions detailed in cover letter. E
EMERGENCY RELEASE FOLLOW-UP NOTICE REPORTING FORM
F
KNOWN OR ANTICIPATED HEALTH EFFECTS (Use the comments section for addition information)
X ACUTE OR IMMEDIATE (explain) wet cement is an irritant to eyes and skin
CHRONIC OR DELAYED (explain)
NOTKNOWN (explain)
C
ADVICE REGARDING MEDICAL ATTENTION NECESSARY FOR EXPOSED INDIVIDUALS
Not applicable
h
COMMENTS (INDICATE SECTION (A- G)AND ITEM WITH COMMENTS OR ADDITIONAL INFORMATION)
The cover letter accompanying this report contains more details.
CERTIFICATION: I certify under penalty of law that I have personally examined and I an familiar with the information submitted and believe the submitted information is true, accurate, and complete. 'RD 65 (LT Ne;woq 4 /1/4/ reg REPORTING FACILITY REPRESENTATIVE (print or type) Ch ndra ohannesson SIGNATURE OF REPORTING FACILITY REPRESENTATIVE DATE: 5/ 7/ ES"
ATTACHMENT 1

Broa
dway
Broadway Terrace
Moraga Ave
Park Blvd580980
24
13
Piedmont
Oakland
Berkeley
Lake Merrit
Grand Ave Gran
d
Av
e
Harbord Dr
Clarewood Dr
MAP 519 • 04/13/15
Clarewood Dr
Florence Ave
Harbord D
r
Harb ord Dr
Clarewood Dr
Broadway Terrace
Harbord Dr
Discharge Point
Injection Point
Harbord Dr
Broadway Terrace
Cellular concrete spill, April 8, 2015
Vicinity Map
1000 ft.
Glen Echo Creek - above ground
Glen Echo Creek - below ground
A�ected above ground areas
Storm drain
1931 Dingee pipeline
Oakland Centerfor Spiritual Living
Clarewood Ln
ClarewoodMall
Truitt
Ln
ClarewoodTownhomeAssociation
Mountain ViewCemetery
ClaremontCountry Club
St TheresaSchool
1,000 ft.a�ected area 400 ft.
a�ected area
300 ft.a�ected area
ATTACHMENT 2

ATTACHMENT 3 Glen Echo Creek Cellular Concrete Spill Wastes
Table 1— Recovered Cellular Concrete
Date Facility Tag No. Quantity Note
4/8/15 Bay Area Concrete Recycling 32714 11 CY* Vacuum truck
4/8/15 Bay Area Concrete Recycling 32713 11 CY* Vacuum truck
4/8/15 Bay Area Concrete Recycling 32712 11 CY* Vacuum truck
4/8/15 Bay Area Concrete Recycling 31934 11 CY* Vacuum truck
4/9/15 Bay Area Concrete Recycling 32718 11 CY* Vacuum truck
4/9/15 Bay Area Concrete Recycling 32715 11 CY* Vacuum truck
4/10/15 Bay Area Concrete Recycling 32719 6 CY* Vacuum truck
4/11/15 Bay Area Concrete Recycling 32724 load 1 6 CY* Vacuum truck
4/11/15 Bay Area Concrete Recycling 32724 load 2 6 CY* Vacuum truck
4/11/15 Bay Area Concrete Recycling 32724 load 3 6 CY* Vacuum truck
4/11/15 Bay Area Concrete Recycling 32724 load 4 6 CY* Vacuum truck
4/12/15 Bay Area Concrete Recycling 32730 6 CY* Vacuum truck
4/13/15 Bay Area Concrete Recycling 33095 6 CY* Vacuum truck
4/14/15 Bay Area Concrete Recycling 32599 6 CY* Vacuum truck
4/15/15 Bay Area Concrete Recycling 32731 6 CY* Vacuum truck
4/16/15 Bay Area Concrete Recycling 33218 6 CY* Vacuum truck
4/21/15 Bay Area Concrete Recycling 33096 6 CY* Vacuum truck
4/22/15 Bay Area Concrete Recycling 31712 6 CY* Vacuum truck
4/10/15 County Quarry Products 384810 17 CY** Large concrete chunks
4/13/15 County Quarry Products 384959 9 CY** Large concrete chunks
TOTAL: 164 CY
*Bay Area Concrete Recycling tags do not have weights but Badger trucks are 12 CY. Volume estimates
are based on the following assumptions:
4/8 to 4/9: trucks had 11 CY of concrete - were primarily pumping slurry from creeks
4/10 to 4/22: trucks had 6 CY of concrete — some of these trucks were partial loads and rocks and dirt
from the creek bed were also present in the load
**County Quarry Products tags have weights but not volumes. Volume estimates are based on
conversion of 1 CY=1ton for recovered concrete from the creeks. This material was primarily the
heavier, bottom portion of the cellular concrete that sunk in the creek beds, not the lighter foam.
Table 2 — Other Wastes
Type of Waste Disposal Facility Quantity Notes
Flush water from jetting,
creek cleaning
EBMUD Main
WWTP
120,000 gallons 24 loads, 5,000 gal per load, hauled
by truck to EBMUD Main WWTP
Creek water diverted to
sanitary sewer***
City of Oakland,
EBMUD
675,900 gallons Two diversions to sanitary sewer
Other solid waste — gravel
bags, straw wattle, etc.
To be determined Estimated 40
yards
Two 20-yard bins are being used at
the site as of 5/6/15
***Upper Diversion started 4/8/15 1500 and ended 4/22/15 1200, estimated flow is 5 gpm. Total
quantity discharged 19,980 min x 5 gal/min = 99,900 gallons
***Lower Diversion started 4/8/15 1500 and ended 4/24/15 1500, estimated flow is 25 gpm. Total
quantity discharged 23,040 min x 25 gal/min = 576,000 gallons

ATTACHMENT 4 GLEN ECHO CREEK WATER QUALITY DATA
ALL SAMPLES TAKEN IN FIELD WITH CALIBRATED PROBES
Date Time Site 0 DO, mg/L Notes UPPER CREEK (behind Spiritual Center)
Not sampled due to response work
No water flowing
Not sampled due to response work
New DO meter on 4/17/2015
rain night before
Additional DO readings scheduled 5/4
2x/week sampling begins
by treehouse
by footbridge
between straw wattles
Location moved to 4530 for safer access
DO meter not functioning properly
water diverted for cleanup so no sample
water diverted for cleanup so no sample
4/10/2015
4/11/2015
NA 5000 Clarewood
NA 5000 Clarewood
NA
NA
NA
NA
4/12/2015 11:40 5000 Clarewood 11.76
4/13/2015 10:15 5000 Clarewood 11.21 8.90
4/14/2015 N/A 5000 Clarewood N/A N/A
4/15/2015 13:55 5000 Clarewood 60' upstream 10.28 7.82
4/15/2015 13:50 5000 Clarewood normal site 11.07 7.72
4/16/2015 14:00 5000 Clarewood 9.83 9.30
4/17/2015 12:10 5000 Clarewood 9.63 7.06
4/18/2015 14:28 5000 Clarewood 9.23 4.78
4/19/2015 10:15 5000 Clarewood 9.08 6.46
4/20/2015 11:50 5000 Clarewood 8.99 6.68
4/21/2015 11:10 5000 Clarewood 8.79 5.33
4/22/2015 13:27 5000 Clarewood 9.40 5.38
4/23/2015 11:52 5000 Clarewood 8.75 5.80
4/24/2015 12:05 5000 Clarewood 9.28 5.71
4/25/2015 12:20 5000 Clarewood 9.80 7.05
4/26/2015 9:50 5000 Clarewood 9.43 6.73
4/27/2015 12:32 5000 Clarewood 9.10 5.67
4/28/2015 14:03 5000 Clarewood 8.94 4.70
4/29/2015 14:33 5000 Clarewood 8.75 4.54
4/30/2015 14:25 5000 Clarewood 8.74 2.36
5/4/2015 12:07 5000 Clarewood 8.45 6.75
5/4/2015 12:18 5000 Clarewood 30' upstream 8.43 6.56
5/4/2015 12:23 5000 Clarewood 75' upstream 8.32 6.06
5/4/2015 12:27 5000 Clarewood 200' upstream 7.62 4.66
5/4/2015 12:30 5000 Clarewood 250' upstream 7.86 8.33
5/4/2015 12:37 5000 Clarewood upper section 7.37 3.17
MIDDLE CREEK (Condo Section)
4/10/2015 14:20 4640 Clarewood 8.14 8.59
4/11/2015 9:45 4640 Clarewood 7.97 9.89
4/12/2015 10:55 4640 Clarewood 8.43 8.26
4/13/2015 10:34 4640 Clarewood 8.41 9.41
4/14/2015 11:05 4640 Clarewood 7.88 9.40
4/15/2015 14:22 4640 Clarewood 8.28 8.80
4/16/2015 14:23 4530 Clarewood 8.27
4/17/2015 12:40 4530 Clarewood 8.95 8.09
4/18/2015 14:42 4530 Clarewood 8.92 8.70
4/19/2015 10:35 4530 Clarewood 8.52 8.44
4/20/2015 12:13 4530 Clarewood 8.04 8.83
4/21/2015 11:40 4530 Clarewood 8.91 8.52
4/22/2015 4530 Clarewood N/A N/A
4/23/2015 4350 Clarewood N/A N/A
4/24/2015 12:15 4530 Clarewood 8.50 8.97

Date Time Site plj DO, mat. Notes
4/25/2015 12:30 4530 Clarewood 8.65 8.92 rain night before
4/26/2015 10:00 4530 Clarewood 8.42 9.28
4/27/2015 12:45 4530 Clarewood 7.97 8.58
4/28/2015 14:20 4530 Clarewood 8.29 9.16
4/29/2015 14:46 4530 Clarewood 8.05 8.95
4/30/2015 14:37 4530 Clarewood 8.02 8.82
5/4/2015 13:12 4530 Clarewood 8.02 9.35 2x/week sampling begins
LOWER CREEK (Golf Course Culvert where Creek Daylights)
4/8/2015 19:45 Culvert 12.63 7.73 stagnant pool with cement dust settled
4/9/2015 13:35 Culvert 12.51 6.86
4/10/2015 10:41 Culvert 8.25 6.60
4/11/2015 9:10 Culvert 12.58 6.40
4/12/2015 10:15 Culvert 12.63 6.10
4/13/2015 10:50 Culvert 12.63 7.68 sediment vacuumed fm pool on 4/13 PM
4/14/2015 10:10 Culvert 9.18 8.32
4/15/2015 Culvert N/A N/A Not sampled due to contractor work
4/16/2015 15:05 Culvert 9.00 5.26 DO meter wouldn't stablize
4/17/2015 12:50 Culvert 8.86 8.91
4/18/2015 14:52 Culvert 8.64 8.80
4/19/2015 11:00 Culvert 8.37 8.37
4/20/2015 12:42 Culvert 8.60 8.84
4/21/2015 12:10 Culvert 8.51 8.87
4/22/2015 13:56 Culvert 8.44 8.85
4/23/2015 12:18 Culvert 8.42 8.77
4/24/2015 12:30 Culvert 8.47 9.06
4/25/2015 12:40 Culvert 8.38 9.41 rain night before
4/26/2015 10:12 Culvert 8.25 9.90
4/27/2015 13:02 Culvert 8.29 9.08
4/28/2015 14:35 Culvert 8.30 9.28
4/29/2015 15:02 Culvert 8.14 9.14
4/30/2015 14:53 Culvert 8.35 8.83 Stop sampling at location
LOWER CREEK (Golf Course First Footbridge)
4/8/2015 19:30 First footbridge 10.29 9.03
4/9/2015 13:25 First footbridge 9.44 7.96
4/10/2015 10:30 First footbridge 8.25 7.64
4/11/2015 9:20 First footbridge 8.32 6.87
4/12/2015 10:30 First footbridge 8.48 7.42
4/13/2015 11:00 First footbridge 8.41 7.24
4/14/2015 10:18 First footbridge 7.83 7.82
4/15/2015 14:48 First footbridge 7.24 7.17
4/17/2015 13:00 First footbridge 7.45 0.27 DO questionable reading
4/18/2015 15:00 First footbridge 7.27 7.27
4/19/2015 11:07 First footbridge 7.97 6.30
4/20/2015 12:51 First footbridge 7.23 7.55
4/21/2015 12:15 First footbridge 7.29 2.60
4/22/2015 14:03 First footbridge 7.67 8.35

Date Time Site pH DO, mg/L Notes
4/23/2015 12:27 First footbridge 7.49 5.50
4/24/2015 12:35 First footbridge 7.34 0.64 DO questionable reading
4/25/2015 12:45 First footbridge 8.00 9.04 rain night before
4/26/2015 10:17 First footbridge 8.24 9.40
4/27/2015 13:08 First footbridge 8.15 8.43
4/28/2015 14:42 First footbridge 8.32 9.19
4/29/2015 15:09 First footbridge 8.20 9.26
4/30/2015 14:59 First footbridge 8.25 9.30
5/4/2014 13:27 First footbridge 8.58 12.26
LOWER CREEK (Golf Course Cofferdam past Second Footbridge) 4/11/2015 9:30 Coffer Dam (downstream) 8.03 5.01
4/12/2015 10;35 Coffer Dam (downstream) 8.08 7.90
4/13/2015 11:05 Coffer Dam (downstream) 8.05 8.05
4/14/2015 10:29 Coffer Dam (downstream) 7.93 8.70
4/15/2015 15:00 Coffer Dam (downstream) 7.91 7.89
4/17/2015 13:07 Coffer Dam 8.00 8.76
4/18/2015 15:10 Coffer Dam 8.05 9.26
4/19/2015 11:13 Coffer Dam 8.16 14.47
4/20/2015 13:00 Coffer Dam 7.93 8.89
4/21/2015 12:20 Coffer Dam 8.05 8.93
4/22/2015 14:10 Coffer Dam 8.08 12.24
4/23/2015 12:37 Coffer Dam 7.98 10.85
4/24/2015 12:40 Coffer Dam 8.15 10.85
4/25/2015 12:50 Coffer Dam 8.26 9.46 rain night before
4/26/2015 10:23 Coffer Dam 8.21 10.13
4/27/2015 13:18 Coffer Dam 8.16 9.60
4/28/2015 14:49 Coffer Dam 8.34 9.94 Coffer dam removed on 4/27
4/29/2015 15:17 Coffer Dam (former site) 8.17 9.74
4/30/2015 15:07 Coffer Dam (former site) 8.21 9.73 Stop sampling at location
LOWER CREEK (Golf Course past Cofferdam past Second Footbridge) 4/11/2015 9:40 150' below Coffer Dam 9.19 10.43
4/12/2015 10:45 150' below Coffer Dam 8.10 8.22
4/13/2015 11:10 150' below Coffer Dam 8.08 9.90
4/14/2015 10:35 150' below Coffer Dam 7.95 10.46
4/15/2015 15:04 150' below Coffer Dam 8.07 13.14
4/16/2015 150' below Coffer Dam N/A N/A water diverted upstream, no sample
4/17/2015 13:12 150' below Coffer Dam 8.02 21.57
4/18/2015 15:20 150' below Coffer Dam 8.67 19.56
4/19/2015 11:20 150' below Coffer Dam 8.38 16.94
4/20/2015 13:04 150' below Coffer Dam 8.36 15.68
4/21/2015 12:25 150' below Coffer Dam 8.01 10.20
4/22/2015 14:17 150' below Coffer Dam 8.39 20.20
4/23/2015 12:43 150' below Coffer Dam 8.44 15.59
4/24/2015 12:45 150' below Coffer Dam 8.24 13.45
4/25/2015 12:55 150' below Coffer Dam 8.30 10.25 rain night before
4/26/2015 10:30 150' below Coffer Dam 8.23 10.65
4/27/2015 13:23 150' below Coffer Dam 8.34 0.48 DO questionable reading

Date Time Site pH DO, mg/L Notes
4/28/2015 14:57 150' below Coffer Dam 8.58 11.71 Coffer dam removed from creek
4/29/2015 15:22 150' below former Coffer Dam 8.42 12.17
4/30/2015 15:11 150' below former Coffer Dam 8.50 12.63 Stop sampling at location
UPPER DIVERSION TO SANITARY SEWER
4/12/2015 11:30 Construction Site 8.76 7.44 Sample at 2" hose draining into manhole
4/13/2015 10:28 Construction Site 9.44 8.97
4/14/2015 11:20 Construction Site 9.23 10.43
4/15/2015 14:04 Construction Site 12.17 8.86 jetting above location, minimal flow
4/16/2015 Construction Site N/A N/A jetting above locatior, no flow to sample
4/17/2015 12:30 Construction Site 11.90 9.84
4/18/2015 Construction Site N/A N/A
4/19/2015 10:25 Construction Site 9.42 9.75
4/20/2015 Construction Site N/A N/A pumping directly into trucks, no sample
4/21/2015 11:25 Construction Site 11.85 9.58 Upper Sanitary diversion removed 4/22
LOWER DIVERSION TO SANITARY SEWER
4/12/2015 11;15 Adler Tank Discharge into SS 8.48 8.25 Sample green hose discharging to manhole
4/12/2015 11;10 Direct Discharge into SS 8.42 8.09 Sample grey hose discharging to manhole
4/13/2015 10:40 Adler Tank Discharge into SS 8.50 8.90
4/13/2015 10:45 Direct Discharge into SS 8.25 9.47
4/14/2015 N/A Adler Tank Discharge into SS N/A N/A Not sampled - water not discharging
4/14/2015 11:35 Direct Discharge into SS 8.28 10.84
4/15/2015 Adler Tank Discharge into SS N/A N/A
4/15/2015 14:35 Direct Discharge into SS 8.26 9.93
4/16/2015 14:45 Direct Discharge into SS 8.12 12 ? DO meter wouldn't stablize
4/17/2015 Adler Tank Discharge into SS N/A N/A not running
4/17/2015 13:27 Direct Discharge into SS 8.84 9.87
4/18/2015 15:36 Direct Discharge into SS 8.35 9.70
4/19/2015 Adler Tank Discharge into SS N/A N/A
4/19/2015 10:50 Direct Discharge into SS 8.29 10.48
4/20/2015 12:27 Direct Discharge into SS 8.28 9.99
4/21/2015 12:00 Direct Discharge into SS 8.29 12.30
4/22/2015 13:42 Direct Discharge into SS 8.07 9.71
4/23/2015 12:06 Direct Discharge into SS 8.22 10.23 Lower sanitary diversion ended 4/24/15
OTHER SAMPLES
From storm drain for baseline (just
4/10/2015 14:50 492 Florence 8.58 8.47 upstream of point of origin)
4/12/2015 11:00 Adler Tank (waste profile in tank) 8.77 9.35 Taken 6" below surface
4/12/2015 11:05 Hose into Adler Tank 8.93 9.71 Sampling at lower sanitary diversion
4/18/2015 15:46 Adler Tank (waste profile in tank) 8.62 8.45 Tank Full
4/20/2015 11:32 Adler Tank at 4640 Clarewood 12.00 N/A Waste profile sample 4/28/2015 15:38 Temescal Creek before Lk Merritt 8.42 9.56 Comparison creek sample for baseline

EXHIBIT D
REPORT ON SEDIMENT AND SOIL pH
Exhibit C –No. ECS 132 Page 1

AECOM 1333 Broadway Suite 800 Oakland, CA 94612 www.aecom.com
510 893 3600 tel 510 874 3268 fax
June 19, 2015 East Bay Municipal Utility District Attn: Chris Dembiczak, CHMM Senior EH&S Specialist 2020 Wake Avenue Oakland, CA 94607 Re: Sampling Glen Echo Creek site located at 4480 Clarewood Drive in Oakland, California Mr. Dembiczak, On Thursday, June 4, 2015, Mr. Jeremy Quick and Mr. Joe Morgan, III of AECOM met with Mr. Chris Dembiczak of EBMUD at the Glen Echo Creek site located at 4480 Clarewood Drive in Oakland, California (Site). Following that Site visit, AECOM prepared and submitted a proposal for soil and leachate pH evaluation along the visited portion of the creek. The pH evaluation was performed on behalf of EBMUD to provide additional information to the California Department of Fish and Wildlife (CADFW), following a concrete spill into the creek from an upstream EBMUD project and subsequent limited pH leachate testing. EBMUD identified a 75-foot length of the segment of Glen Echo Creek to be evaluated; the segment is defined by the bar gate at the downstream end and the waterfall at the upstream end (Project Area). CADFW and EBMUD previously measured a maximum pH of approximately 12.2 in leachate water near the downstream end of the Project Area. This report summarizes the results from the leachate water testing and the soil sample collection performed by AECOM staff. Background pH and Leachate Water Testing: AECOM staff measured the pH value of the water flowing down the creek by using a calibrated direct-read pH meter in the stream of flowing water. To test leachate water, AECOM followed the method utilized by the CADFW, which includes advancing an approximately 1- to 2-inch wide and 5-inch deep boring in the soil immediately adjacent to the creek, allowing it to fill with water, and then measuring the pH of the water fill using a calibrated direct-read pH meter. AECOM completed leachate water testing at five locations along the 75-foot length of creek segment. AECOM also advanced four step-out leachate testing locations at distances perpendicular to the stream to evaluate the pH impacts to groundwater farther away from the streambed. Due to the limited work area, these borings were approximately 1 to 2 feet from the edge of the stream. These locations are shown in Figure 1.
Soil samples: AECOM staff collected 11 soil samples to be analyzed by a subcontracted laboratory for pH. AECOM collected soil samples at six locations along the length of the creek segment identified during the June 4 site visit: from the waterfall to the bar gate, utilizing the same locations that were used to perform leachate water testing. These locations are shown in Figure 1.To establish a vertical profile, AECOM collected discrete soil samples from depths of approximately 6, 12, and

Mr. Chris Dembiczak Glen Echo Creek
June 19, 2015 Page 2 of 4
18 inches below ground surface. Based on the rocky surface, AECOM anticipates refusal and will likely be unable to collect all planned samples.
Sample analysis: All collected soil samples were submitted to Curtis & Tompkins Laboratories, a California-Certified Laboratory in Berkeley, California, for expedited analysis of pH. Laboratory reports are included in Attachment A.
Field Activities On Monday, June 15, 2015, two AECOM staff completed the above scope of work at the Site. During that visit, the following activities were completed.
Creek water background pH: AECOM staff measured the pH value of the water flowing down the creek by using a calibrated direct-read pH meter in the stream of flowing water. The measured pH of the creek water towards the downstream end of the evaluated creek segment was 7.61. The measured pH of the creek towards the upstream end of the creek segment was 8.32.
Leachate water testing: AECOM staff conducted leachate water testing according to the method outlined in the above scope, at five locations along the approximate 75-foot length of the Project Area. Leachate testing locations were situated immediately adjacent to the flowing portion of the creek, and assigned the designations GEC-L1 through GEC-L5. GEC-2 is the closest location to EBMUD and CADFW’s leachate water testing locations.
Step-out leachate testing locations were conducted, where possible, approximately 1 to 2 feet away from the primary location and perpendicular to the creek. Step-out leachate testing was not conducted near GEC-L4 due to the rocky slope adjacent to the primary location. Step-out leachate testing locations were assigned the same designation as its associated primary leachate testing location, followed by “-S1”. The following leachate testing was conducted:
• GEC-L1: Approximately 9 feet upstream of the bar gate, east side of the creek; pH = 7.61
• GEC-L1-S1: Step-out from GEC-L1, approximately 1-2 feet further east; pH = 7.61
• GEC-L2: Approximately 6 feet upstream from GEC-L1, east side of the creek; pH = 10.30
• GEC-L2-S1: Step-out from GEC-L2, approximately 1-2 feet further east; pH = 9.88 – 10.34
• GEC-L3: Approximately 16 feet upstream of GEC-L2, wet bank on west side of the creek; pH = 7.05
• GEC-L3-S1: Step-out from GEC-L3, approximately 1-2 feet further west; pH = 7.04
• GEC-L4: Approximately 6 feet upstream of GEC-L3, west side of creek; pH = 7.93
• GEC-L5: Approximately 25 feet upstream of GEC-L4, east side of creek; pH = 10.44
• GEC-L5-S1: Step-out from GEC-L5, approximately 1-2 feet further east; pH = 9.94
Leachate testing data is summarized in Table 1. Approximate positions of leachate testing locations are indicated on Figure 1. Photographs of leachate and soil sample locations are shown in Attachment B (Photographic Log).

Mr. Chris Dembiczak Glen Echo Creek
June 19, 2015Page 3 of 4
Figure 1.
Leachate & Soil Sample Locations along Glen Echo Creek Segment
Soil sample collection: AECOM staff collected soil samples for pH analysis at each of the above-referenced leachate water testing locations, and one additional location (GEC-S5). Soil sampling locations co-located with leachate water testing locations are shown in the figure above (e.g. GEC-L1/GEC-S1). Soil samples were collected by hand auger and were collected at 6, 12, and 18 inches below ground surface (bgs) or until first refusal on rock. Soil samples were assigned the designation GEC-SX-Z, where “X” is the location number 1 through 6, and “Z” is the sample depth in inches bgs. Refusal was encountered at all but one location, as summarized in the bullet list below. The hand auger bucket was scrubbed free of soil and rinsed in the flowing creek water between each sample. The following soil samples were collected:
• GEC-S1-6 & GEC-S1-12 (refusal at 12 inches bgs); pH = 7.8 & 7.9, respectively
• GEC-S2-6 & GEC-S2-12 (refusal at 12 inches bgs); pH = 9.7 & 8.3, respectively
• GEC-S3-6, GEC-S3-12, & GEC-S3-18; pH = 7.5, 7.4, & 7.2, respectively
• GEC-S4-6 (refusal at 6 inches bgs); pH = 7.5
• GEC-S5-6 & GEC-S5-10 (refusal at 10 inches bgs) ; pH = 8.8 & 8.3, respectively
• GEC-S6-6 (refusal at 6 inches bgs); pH = 9.9
Soil sample analytical data are presented in Table 1, and the analytical laboratory report is included as Attachment A. Soil sample locations are indicated in the above Figure 1. Photographs of leachate and soil sample locations are shown in Attachment B.
ConclusionsAccording to field leachate testing data, the location previously tested by CADFW and EBMUD staff (GEC-L2) continues to exhibit elevated pH, though slightly lower than previously recorded pH value of
Bar GateWaterfall
GEC-L1/GEC-S1
Note: Not to Scale
GEC-L2/GEC-S2
GEC-L3/GEC-S3
GEC-L4/GEC-S4
GEC-S5
GEC-L5/GEC-S6
GEC-L1-S1
GEC-L2-S1
GEC-L3-S1
GEC-L5-S1

Mr. Chris Dembiczak Glen Echo Creek
June 19, 2015Page 4 of 4
approximately 12.2. The eastern portions of the creek segment evaluated (GEC-L2/S2, GEC-S5 andGEC-L5/S6) exhibited pH values greater than background pH values, while the central and western portions of the creek segment (GEC-L3/S3 and GEC-L4/S4) exhibited more neutral pH.
Soil sample data is consistent with field leachate readings, though not elevated to the same degree.
Based on a comparison of the previously recorded pH value of approximately 12.2 to pH values recorded during this evaluation, there are still some residual effects of the cement spill in the creek, and pH along the Project Area of Glen Echo Creek appears to be approaching the background range.As the large majority of cement source material appears to have been removed from the creek segment evaluated, it is reasonable to expect pH values will continue to approach the background range without further intervention by EBMUD.
Please contact Jeremy Quick at (510) 874-3224 with any comments or questions regarding this letter report.
Sincerely,AECOM
Jeremy Quick, P.G. Christine Pilachowski, P.G.Geologist Project Manager
Encl. Table 1: Field Leachate Readings and Soil Analytical Results – pHAttachment A. Laboratory Analytical ReportAttachment B. Photographic Log
cc: Terry Cooke, AECOMMaureen Dunn, AECOMJoe Morgan, III, AECOM

Table 1

Table 1Field Leachate Readings and Soil Analytical Results - pHGlen Echo Creek pH Evaluation
AECOM Page 1 of 1
Sample ID Sample Type Sample Location Sample Depth (inches bgs) Sample Date pH
GEC-L1 Leachate S1/L1 5 6/15/2015 7.61GEC-L1-S1 Leachate S1/L1 5 6/15/2015 7.61GEC-S1-6 Soil S1/L1 6 6/15/2015 7.8GEC-S1-12 Soil S1/L1 12 6/15/2015 7.9
GEC-L2 Leachate S2/L2 5 6/15/2015 10.30GEC-L2-S1 Leachate S2/L2 5 6/15/2015 9.88-10.34GEC-S2-6 Soil S2/L2 6 6/15/2015 9.7GEC-S2-12 Soil S2/L2 12 6/15/2015 8.3
GEC-L3 Leachate S3/L3 5 6/15/2015 7.05GEC-L3-S1 Leachate S3/L3 5 6/15/2015 7.04GEC-S3-6 Soil S3/L3 6 6/15/2015 7.5GEC-S3-12 Soil S3/L3 12 6/15/2015 7.4GEC-S3-18 Soil S3/L3 18 6/15/2015 7.2
GEC-L4 Leachate S4/L4 5 6/15/2015 7.93GEC-S4-6 Soil S4/L4 6 6/15/2015 7.5
GEC-S5-6 Soil S5 6 6/15/2015 8.8GEC-S5-10 Soil S5 10 6/15/2015 8.3
GEC-L5 Leachate S6/L5 5 6/15/2015 10.44GEC-L5-S1 Leachate S6/L5 5 6/15/2015 9.94GEC-S6-6 Soil S6/L5 6 6/15/2015 9.9
Background Water near S1/L1 in stream 6/15/2015, AM 7.61Background Water near S5 in stream 6/15/2015, PM 8.32
Notes and Abbreviations
GEC-L Glen Echo Creek leachate
GEC-S Glen Echo Creek soil
bgs below ground surface
Soil and leachate samples were co-located.
Leachate sample readings collected from YSI Professional Plus Quatro water quality meter placed in water-filled hole.
Soil samples analyzed by EPA method 9045D.
Sample Naming Convention:
Soil Samples: GEC-S(sample #)-Depth (in inches)
Leachate Samples: GEC-L(sample #)-S(step out number #)

Attachment A
Laboratory Analytical Report

Laboratory Job Number 267496ANALYTICAL REPORT
URS Corporation Project : 26817754.2051 1333 Broadway Location : GEC-S1-6 Oakland, CA 94612 Level : II
Sample ID Lab IDGEC-S1-6 267496-001GEC-S1-12 267496-002GEC-S2-6 267496-003GEC-S2-12 267496-004GEC-S3-6 267496-005GEC-S3-12 267496-006GEC-S3-18 267496-007GEC-S4-6 267496-008GEC-S5-6 267496-009GEC-S5-10 267496-010GEC-S6-6 267496-011
This data package has been reviewed for technical correctness and completeness.Release of this data has been authorized by the Laboratory Manager or theManager's designee, as verified by the following signature. The resultscontained in this report meet all requirements of NELAC and pertain only tothose samples which were submitted for analysis. This report may be reproducedonly in its entirety.
Signature: Date: 06/16/2015 Tracy BabjarProject Manager
[email protected](510) 204-2226
CA ELAP# 2896, NELAP# 4044-001
1 of 8

CASE NARRATIVE
Laboratory number: 267496Client: URS CorporationProject: 26817754.2051Location: GEC-S1-6Request Date: 06/15/15Samples Received: 06/15/15
This data package contains sample and QC results for eleven soil samples,requested for the above referenced project on 06/15/15. The samples werereceived cold and intact.
pH (EPA 9045D):No analytical problems were encountered.
Page 1 of 15.0
2 of 8

3 of 8

4 of 8

Detections Summary for 267496
Results for any subcontracted analyses are not included in this summary.
Client : URS Corporation Project : 26817754.2051 Location : GEC-S1-6
Client Sample ID : GEC-S1-6 Laboratory Sample ID : 267496-001
Analyte Result Flags RL Units Basis IDF Method Prep Method pH 7.8 1.0 SU As Recd 1.000 EPA 9045D METHOD
Client Sample ID : GEC-S1-12 Laboratory Sample ID : 267496-002
Analyte Result Flags RL Units Basis IDF Method Prep Method pH 7.9 1.0 SU As Recd 1.000 EPA 9045D METHOD
Client Sample ID : GEC-S2-6 Laboratory Sample ID : 267496-003
Analyte Result Flags RL Units Basis IDF Method Prep Method pH 9.7 1.0 SU As Recd 1.000 EPA 9045D METHOD
Client Sample ID : GEC-S2-12 Laboratory Sample ID : 267496-004
Analyte Result Flags RL Units Basis IDF Method Prep Method pH 8.3 1.0 SU As Recd 1.000 EPA 9045D METHOD
Client Sample ID : GEC-S3-6 Laboratory Sample ID : 267496-005
Analyte Result Flags RL Units Basis IDF Method Prep Method pH 7.5 1.0 SU As Recd 1.000 EPA 9045D METHOD
Client Sample ID : GEC-S3-12 Laboratory Sample ID : 267496-006
Analyte Result Flags RL Units Basis IDF Method Prep Method pH 7.4 1.0 SU As Recd 1.000 EPA 9045D METHOD
Client Sample ID : GEC-S3-18 Laboratory Sample ID : 267496-007
Analyte Result Flags RL Units Basis IDF Method Prep Method pH 7.2 1.0 SU As Recd 1.000 EPA 9045D METHOD
Page 1 of 2 8.0
5 of 8

Client Sample ID : GEC-S4-6 Laboratory Sample ID : 267496-008
Analyte Result Flags RL Units Basis IDF Method Prep Method pH 7.5 1.0 SU As Recd 1.000 EPA 9045D METHOD
Client Sample ID : GEC-S5-6 Laboratory Sample ID : 267496-009
Analyte Result Flags RL Units Basis IDF Method Prep Method pH 8.8 1.0 SU As Recd 1.000 EPA 9045D METHOD
Client Sample ID : GEC-S5-10 Laboratory Sample ID : 267496-010
Analyte Result Flags RL Units Basis IDF Method Prep Method pH 8.3 1.0 SU As Recd 1.000 EPA 9045D METHOD
Client Sample ID : GEC-S6-6 Laboratory Sample ID : 267496-011
Analyte Result Flags RL Units Basis IDF Method Prep Method pH 9.9 1.0 SU As Recd 1.000 EPA 9045D METHOD
Page 2 of 2 8.0
6 of 8

pH
Lab #: 267496 Location: GEC-S1-6 Client: URS Corporation Prep: METHOD Project#: 26817754.2051 Analysis: EPA 9045D Analyte: pH Batch#: 224116 Matrix: Soil Received: 06/15/15 Units: SU Prepared: 06/15/15 12:27 Diln Fac: 1.000 Analyzed: 06/15/15 17:55
Field ID Lab ID Result RL Sampled GEC-S1-6 267496-001 7.8 1.0 06/15/15 09:53 GEC-S1-12 267496-002 7.9 1.0 06/15/15 10:01 GEC-S2-6 267496-003 9.7 1.0 06/15/15 10:15 GEC-S2-12 267496-004 8.3 1.0 06/15/15 10:21 GEC-S3-6 267496-005 7.5 1.0 06/15/15 10:50 GEC-S3-12 267496-006 7.4 1.0 06/15/15 10:55 GEC-S3-18 267496-007 7.2 1.0 06/15/15 10:59 GEC-S4-6 267496-008 7.5 1.0 06/15/15 11:10 GEC-S5-6 267496-009 8.8 1.0 06/15/15 11:20 GEC-S5-10 267496-010 8.3 1.0 06/15/15 11:25 GEC-S6-6 267496-011 9.9 1.0 06/15/15 11:40
RL= Reporting LimitPage 1 of 1 2.0
7 of 8

Batch QC Report
pH
Lab #: 267496 Location: GEC-S1-6 Client: URS Corporation Prep: METHOD Project#: 26817754.2051 Analysis: EPA 9045D Analyte: pH Diln Fac: 1.000 Field ID: ZZZZZZZZZZ Batch#: 224116 Type: SDUP Sampled: 06/10/15 14:40 MSS Lab ID: 267401-001 Received: 06/11/15 Lab ID: QC791747 Prepared: 06/15/15 12:27 Matrix: Soil Analyzed: 06/15/15 12:40 Units: SU
MSS Result Result RL RPD Lim9.600 9.800 1.000 2 20
RL= Reporting LimitRPD= Relative Percent DifferencePage 1 of 1 3.0
8 of 8

Attachment B
Photographic Log

Project Name
EBMUD On-Call
Photo Number / File Name: 1 / IMG_3048.JPG Date / Time: 2015-06-15 / 12:26
Direction Facing
Southeast
CaptionOverview of evaluated
segment of Glen Echo Creek; waterfall at south end.
Photo Number / File Name: 2 / IMG_3050.JPG Date / Time: 2015-06-15 / 12:26
Direction Facing
East & Down
CaptionOverview of evaluated
segment of Glen Echo Creek; base of waterfall at south end.
PHOTOGRAPHIC LOG
EBMUD: Glen Echo CreekEvaluation of pH in Leachate & Soil
4480 Clarewood DriveOakland, CA 94618
AECOM Project Number
60422561.26817754.2051
\\s021emc2\2010GenEnv\5000 Task Orders Working Folders\TO 2051 Glen Echo Creek pH Evaluation\Photographs\Photo Log_EBMUD Glen Echo Creek pH Evaluation.xls Page 1 of 6

Project Name
EBMUD On-Call
PHOTOGRAPHIC LOG
EBMUD: Glen Echo CreekEvaluation of pH in Leachate & Soil
4480 Clarewood DriveOakland, CA 94618
AECOM Project Number
60422561.26817754.2051
Photo Number / File Name: 3 / IMG_3051.JPG Date / Time: 2015-06-15 / 12:26
Direction Facing
Northeast & Down
CaptionOverview of evaluated
segment of Glen Echo Creek; southern portion of creek
segment.
Photo Number / File Name: 4 / IMG_3052.JPG Date / Time: 2015-06-15 / 12:27
Direction Facing
North & Down
CaptionOverview of evaluated
segment of Glen Echo Creek; middle portion of creek
segment with retaining wall along east bank.
\\s021emc2\2010GenEnv\5000 Task Orders Working Folders\TO 2051 Glen Echo Creek pH Evaluation\Photographs\Photo Log_EBMUD Glen Echo Creek pH Evaluation.xls Page 2 of 6

Project Name
EBMUD On-Call
PHOTOGRAPHIC LOG
EBMUD: Glen Echo CreekEvaluation of pH in Leachate & Soil
4480 Clarewood DriveOakland, CA 94618
AECOM Project Number
60422561.26817754.2051
Photo Number / File Name: 5 / IMG_3053.JPG Date / Time: 2015-06-15 / 12:27
Direction Facing
Northwest
CaptionOverview of evaluated
segment of Glen Echo Creek; northern portion of creek segment and bar gate.
Photo Number / File Name: 6 / IMG_3030.JPG Date / Time: 2015-06-15 / 09:56
Direction Facing
Northwest
CaptionLeachate and soil sample
location "GEC-L1/S1", indicated by flag and pH probe
at location.
\\s021emc2\2010GenEnv\5000 Task Orders Working Folders\TO 2051 Glen Echo Creek pH Evaluation\Photographs\Photo Log_EBMUD Glen Echo Creek pH Evaluation.xls Page 3 of 6

Project Name
EBMUD On-Call
PHOTOGRAPHIC LOG
EBMUD: Glen Echo CreekEvaluation of pH in Leachate & Soil
4480 Clarewood DriveOakland, CA 94618
AECOM Project Number
60422561.26817754.2051
Photo Number / File Name: 7 / IMG_3032.JPG Date / Time: 2015-06-15 / 10:08
Direction Facing
Northeast & Down
CaptionLeachate step-out location
"GEC-L1-S1", approximately 1-2 feet away from leachate
location "GEC-L1".
Photo Number / File Name: 8 / IMG_3036.JPG Date / Time: 2015-06-15 / 10:22
Direction Facing
Northwest
CaptionLeachate and soil sample location "GEC-L2/S2", at approximate location of
previous CADFW and EBMUD pH leachate tests.
\\s021emc2\2010GenEnv\5000 Task Orders Working Folders\TO 2051 Glen Echo Creek pH Evaluation\Photographs\Photo Log_EBMUD Glen Echo Creek pH Evaluation.xls Page 4 of 6

Project Name
EBMUD On-Call
PHOTOGRAPHIC LOG
EBMUD: Glen Echo CreekEvaluation of pH in Leachate & Soil
4480 Clarewood DriveOakland, CA 94618
AECOM Project Number
60422561.26817754.2051
Photo Number / File Name: 9 / IMG_3038.JPG Date / Time: 2015-06-15 / 10:55
Direction Facing
Southeast
CaptionLeachate and soil sample
location "GEC-L3/S3", in a wet zone on the west bank of the
creek.
Photo Number / File Name: 10 / IMG_3042.JPG Date / Time: 2015-06-15 / 11:14
Direction Facing
Southeast
CaptionLeachate and soil sample
location "GEC-L4/S4".
\\s021emc2\2010GenEnv\5000 Task Orders Working Folders\TO 2051 Glen Echo Creek pH Evaluation\Photographs\Photo Log_EBMUD Glen Echo Creek pH Evaluation.xls Page 5 of 6

Project Name
EBMUD On-Call
PHOTOGRAPHIC LOG
EBMUD: Glen Echo CreekEvaluation of pH in Leachate & Soil
4480 Clarewood DriveOakland, CA 94618
AECOM Project Number
60422561.26817754.2051
Photo Number / File Name: 11 / IMG_3044.JPG Date / Time: 2015-06-15 / 11:26
Direction Facing
East
CaptionSoil sample location "GEC-S5" (left flag) and leachate and soil sample location "GEC-L5/S6"
(right flag).
Photo Number / File Name: 12 / IMG_3055.JPG Date / Time: 2015-06-15 / 13:40
Direction Facing
Southeast
CaptionLeachate step-out location
"GEC-L5-S1" (at flag), approximately 1-2 feet away
from leachate and soil sample location "GEC-L5/S6" (visible
near bottom center of photograph).
\\s021emc2\2010GenEnv\5000 Task Orders Working Folders\TO 2051 Glen Echo Creek pH Evaluation\Photographs\Photo Log_EBMUD Glen Echo Creek pH Evaluation.xls Page 6 of 6

Appendix B
Longitudinal and Cross-section Survey
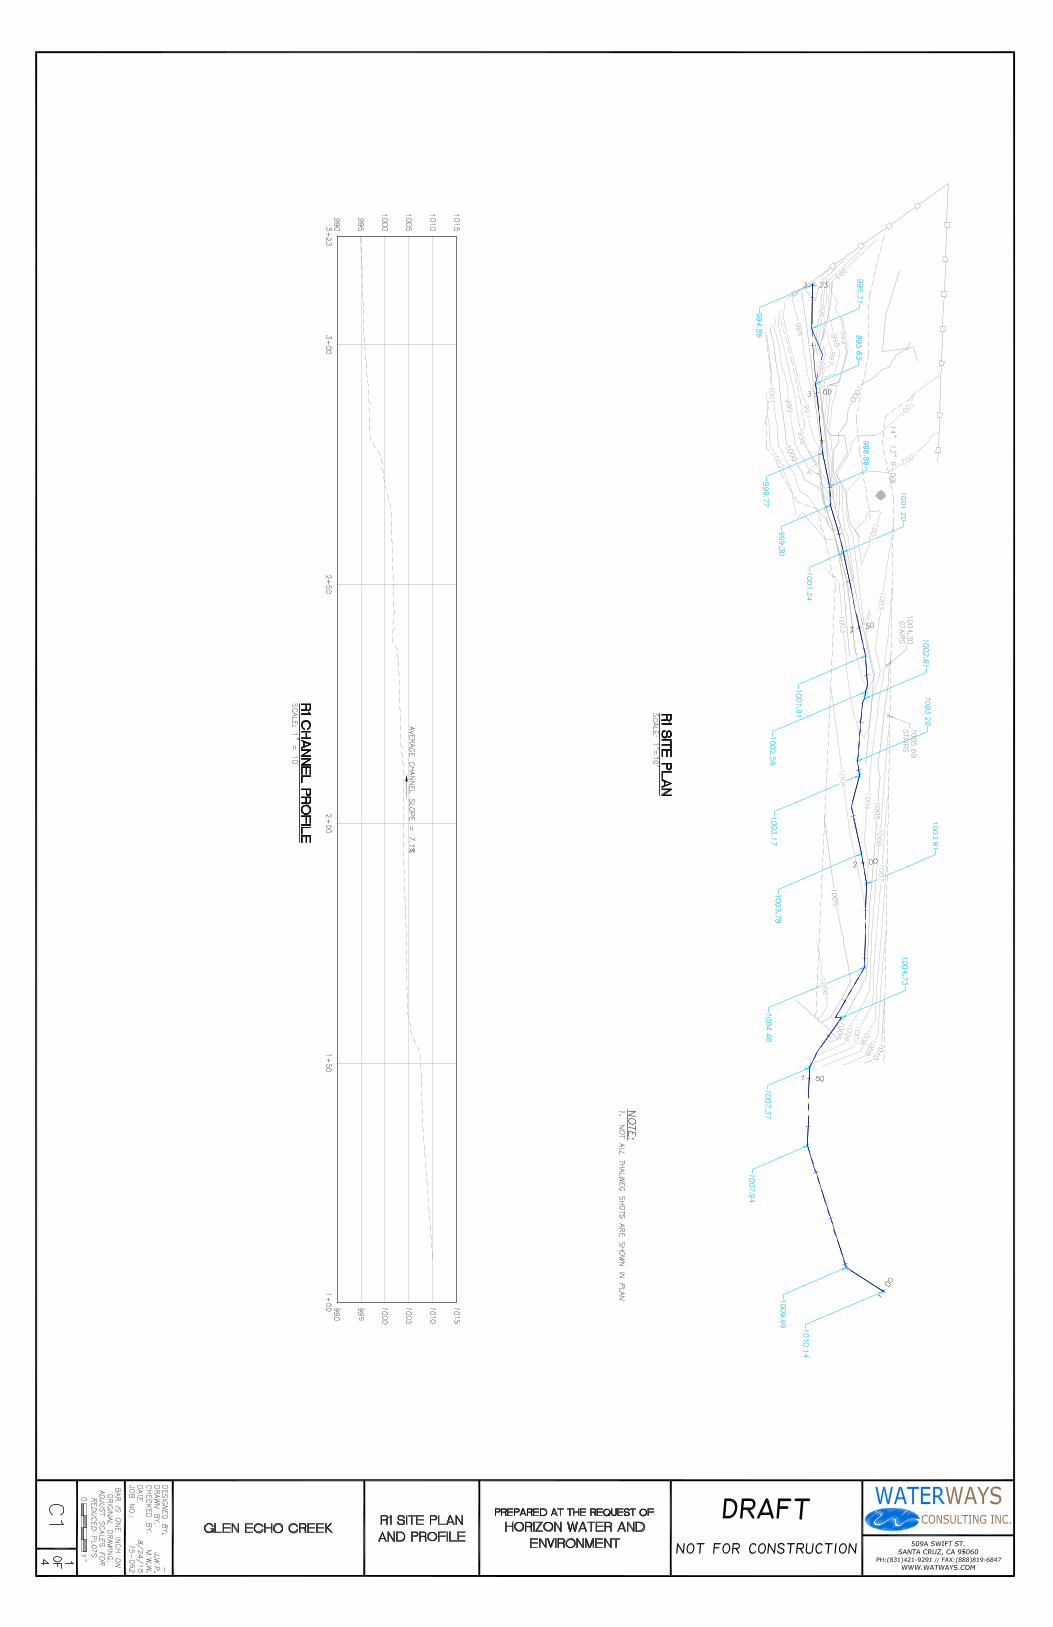


Appendix C
Plant Species List

Scientific Name Common NameNative or Non-Native Reach 1 Reach 2a Reach 2b Reach 3
Acacia sp. acacia Non-Native xAcanthus mollis bear's breech Non-Native xAesculus californica California buckeye Native xAgrostis stolonifera creeping bentgrass Non-Native xAloe vera aloe vera Non-Native xAmaryllis belladonna belladonna lilly Non-Native xAnagallis arvensis scarlet pimpernel Non-Native xAthyrium filix-femina western lady fern Native x xBacharis pilularis coyotebrush Native xBambusa sp. bamboo Non-Native xCarex praegracilis clustered field sedge Native xChloris verticillata tumble windmill grass Non-Native xCirsium vulgare bull thistle Non-Native x xCyatheas sp. tree fern Non-Native xCynodon dactylon Bermuda grass Non-Native xCyperus eragrostis tall nutsedge Native x xDelairea odorata cape ivy Non-Native xEhrharta erecta panic veldtgrass Non-Native x xEplilobium cilatum fringed willow herb Native x x xEquisetum arvense common horsetail Native xEuphorbia peplus petty spurge Non-Native x x xFicus sp. ornamental fig Non-Native xGenista monspessulana French broom Non-Native xHedera helix English ivy Non-Native x x xHelminthotheca echiodes bristly ox-tongue Non-Native x xIlex aquifolium holly Non-Native xJuncus patens common rush Native xLobelia maritima sweet alyssum Non-Native xLolium spp. ryegrass Non-Native xLonicera japonica Japanese honeysuckle Non-Native xLyonothamnus floribundus Catalina ironwood Native xMelilotus indicus yellow sweetclover Non-Native xNotholithocarpus densiflorus tanoak Native
x
Phoenix sp. date palm Non-Native xPoa pratensis Kentucky bluegrass Non-Native xPolystichum munitum western sword fern Native x xPrunus spp. ornamental plum Non-Native x x xPseudognaphalium luteoalbum cudweed Non-Native
x
Quercus agrifolia coast live oak Native xQuercus kelloggii black oak Native xRubus armeniacus Himalayan blackberry Non-Native x x xRubus parviflorus thimbleberry Native x x
Appendix C: Glen Echo Creek Assessment Area Plant Species List - September 2015

Rubus ursinus California blackberry Native x x xRumex sp. dock Non-Native xSalix sp. ornamental willow Non-Native xSalvia sp. salvia ? xSenecio vulgaris common groundsel Non-Native xSequoia sempervirens coast redwood Native x x x xSolanum nigrum black nightshade Non-Native x xTaraxacum officinale common dandelion Non-Native xTrifolium repens white clover Non-Native xTropaeolum majus nasturtium Non-Native x xUmbellularia californica California bay laurel Native x xVicia americana American vetch Native x xZantedeschia aethiopica calla lilly Non-Native x

Appendix D
Water Quality Sampling Data

GLEN ECHO CREEK WATER QUALITY DATAALL SAMPLES TAKEN IN FIELD WITH CALIBRATED PROBESDate Time No Site pH DO, mg/L Notes WSI
4/10/2015 NA 1 5000 Clarewood NA NA Not sampled due to response work E. Baker4/11/2015 NA 1 5000 Clarewood NA NA No water flowing J.M. Allan4/12/2015 11:40 1 5000 Clarewood 11.76 J.M. Allan4/13/2015 10:15 1 5000 Clarewood 11.21 8.90 J.M. Allan4/14/2015 N/A 1 5000 Clarewood N/A N/A Not sampled due to response work E. Baker4/15/2015 13:55 1 5000 Clarewood 60' upstream 10.28 7.82 T. DaLomba4/15/2015 13:50 1 5000 Clarewood normal site 11.07 7.72 T. DaLomba4/16/2015 14:00 1 5000 Clarewood 9.83 9.30 T. DaLomba4/17/2015 12:10 1 5000 Clarewood 9.63 7.06 New DO meter on 4/17/2015 E. Baker4/18/2015 14:28 1 5000 Clarewood 9.23 4.78 E. Baker4/19/2015 10:15 1 5000 Clarewood 9.08 6.46 W. Mar4/20/2015 11:50 1 5000 Clarewood 8.99 6.68 T. DaLomba4/21/2015 11:10 1 5000 Clarewood 8.79 5.33 E. Baker4/22/2015 13:27 1 5000 Clarewood 9.40 5.38 T. DaLomba4/23/2015 11:52 1 5000 Clarewood 8.75 5.80 T. DaLomba4/24/2015 12:05 1 5000 Clarewood 9.28 5.71 E. Baker4/25/2015 12:20 1 5000 Clarewood 9.80 7.05 rain night before E. Baker4/26/2015 9:50 1 5000 Clarewood 9.43 6.73 E. Baker4/27/2015 12:32 1 5000 Clarewood 9.10 5.67 T. DaLomba4/28/2015 14:03 1 5000 Clarewood 8.94 4.70 T. DaLomba4/29/2015 14:33 1 5000 Clarewood 8.75 4.54 T. DaLomba4/30/2015 14:25 1 5000 Clarewood 8.74 2.36 Additional DO readings scheduled 5/4 T. DaLomba5/4/2015 12:07 1 5000 Clarewood 8.45 6.75 2x/week sampling begins T. DaLomba5/4/2015 12:18 1 5000 Clarewood 30' upstream 8.43 6.56 T. DaLomba5/4/2015 12:23 1 5000 Clarewood 75' upstream 8.32 6.06 T. DaLomba5/4/2015 12:27 1 5000 Clarewood 200' upstream 7.62 4.66 by treehouse T. DaLomba5/4/2015 12:30 1 5000 Clarewood 250' upstream 7.86 8.33 by footbridge T. DaLomba5/4/2015 12:37 1 5000 Clarewood upper section 7.37 3.17 between straw wattles, wattles removed 5/5 T. DaLomba5/7/2015 11:10 1 5000 Clarewood 8.45 6.84 T. DaLomba5/7/2015 11:47 1 5000 Clarewood 100' upstream 7.97 6.02 3 ppm ammonia test strip; notified city of NH3 T. DaLomba
UPPER CREEK (behind Spiritual Center)

5/7/2015 11:38 1 5000 Clarewood 200' upstream 7.83 5.10 by treehouse ‐ 3 ppm ammonia test strip T. DaLomba5/7/2015 11:30 1 5000 Clarewood 250' upstream 7.88 8.24 by footbridge ‐ 3 ppm ammonia test strip T. DaLomba5/7/2015 11:25 1 5000 Clarewood upper section 7.85 7.39 former straw wattle location T. DaLomba5/11/2015 13:55 1 5000 Clarewood ‐‐ 8.46 sewage/flush water present T. DaLomba5/11/2015 13:50 1 5000 Clarewood 200' upstream ‐‐ 6.87 by treehouse ‐ sewage/flush water present T. DaLomba5/11/2015 13:45 1 5000 Clarewood 250' upstream ‐‐ 9.48 by footbridge ‐ sewage/flush water present T. DaLomba5/14/2015 13:47 1 5000 Clarewood 7.96 7.34 sewage/flush water present T. DaLomba5/18/2015 1 5000 Clarewood WQ sampling suspended due to sewage release7/8/2015 16:25 1 5000 Clarewood 7.70 5.35 NH3 strip positive (sewage) ‐ told City ‐ very low flow T. DaLomba7/13/2015 15:30 1 5000 Clarewood 7.66 5.07 NH3 strip 1‐3 ppm; 3‐6ppm further upstream T. DaLomba7/20/2015 10:45 1 5000 Clarewood 7.65 3.50 NH3 strip >3, very low flow in creek T. DaLomba7/27/2015 12:03 1 5000 Clarewood 7.31 2.51 NH3 strip <3, very low flow in creek L. Patton8/6/2015 11:15 1 5000 Clarewood 7.77 3.49 NH3 strip >3, very low flow in creek E. Baker8/14/2015 13:50 1 5000 Clarewood 7.91 1.27 NH3 strip 3, almost no flow in creek E. Baker8/20/2015 13:30 1 5000 Clarewood 7.79 5.30 NH3 strip 3, very slight flow in creek E. Baker8/27/2015 13:05 1 5000 Clarewood 7.94 7.82 NH3 strip 0.5, ~5gpm flow, city sewer repair/flush E. Baker9/1/2015 10:15 1 5000 Clarewood 7.81 5.07 NH3 strip 0.5, ~5gpm flow E. Baker
4/10/2015 14:20 2 4640 Clarewood 8.14 8.59 E. Baker4/11/2015 9:45 2 4640 Clarewood 7.97 9.89 J.M. Allan4/12/2015 10:55 2 4640 Clarewood 8.43 8.26 J.M. Allan4/13/2015 10:34 2 4640 Clarewood 8.41 9.41 J.M. Allan4/14/2015 11:05 2 4640 Clarewood 7.88 9.40 E. Baker4/15/2015 14:22 2 4640 Clarewood 8.28 8.80 Sample point moved to 4530 for safer access T. DaLomba4/16/2015 14:23 2 4530 Clarewood 8.27 DO meter not functioning properly T. DaLomba4/17/2015 12:40 2 4530 Clarewood 8.95 8.09 E. Baker4/18/2015 14:42 2 4530 Clarewood 8.92 8.70 L. Wolff4/19/2015 10:35 2 4530 Clarewood 8.52 8.44 W. Mar4/20/2015 12:13 2 4530 Clarewood 8.04 8.83 T. DaLomba4/21/2015 11:40 2 4530 Clarewood 8.91 8.52 E. Baker4/22/2015 2 4530 Clarewood N/A N/A water diverted for cleanup so no sample T. DaLomba4/23/2015 2 4350 Clarewood N/A N/A water diverted for cleanup so no sample T. DaLomba4/24/2015 12:15 2 4530 Clarewood 8.50 8.97 E. Baker
MIDDLE CREEK (Condo Section)

4/25/2015 12:30 2 4530 Clarewood 8.65 8.92 rain night before E. Baker4/26/2015 10:00 2 4530 Clarewood 8.42 9.28 E. Baker4/27/2015 12:45 2 4530 Clarewood 7.97 8.58 T. DaLomba4/28/2015 14:20 2 4530 Clarewood 8.29 9.16 T. DaLomba4/29/2015 14:46 2 4530 Clarewood 8.05 8.95 T. DaLomba4/30/2015 14:37 2 4530 Clarewood 8.02 8.82 T. DaLomba5/4/2015 13:12 2 4530 Clarewood 8.02 9.35 2x/week sampling begins T. DaLomba5/7/2015 11:58 2 4530 Clarewood 8.18 9.31 T. DaLomba5/11/2015 14:17 2 4530 Clarewood 7.93 9.51 creek flushing due to sewage upstream T. DaLomba5/14/2015 14:00 2 4530 Clarewood 7.96 8.66 creek flushing due to sewage upstream T. DaLomba5/18/2015 2 4530 Clarewood WQ sampling suspended due to sewage release7/8/2015 16:45 2 4530 Clarewood 8.35 8.95 T. DaLomba7/13/2015 15:50 2 4530 Clarewood 8.26 8.10 NH3 strips 0.25‐1.0 ppm T. DaLomba7/20/2015 10:55 2 4530 Clarewood 8.22 8.54 NH3 strip >0.25 ppm T. DaLomba7/27/2015 12:52 2 4530 Clarewood 8.17 8.80 NH3 strip 0.25ppm L. Patton8/6/2015 11:30 2 4530 Clarewood 8.25 9.40 NH3 strip negative E. Baker8/14/2015 14:05 2 4530 Clarewood 8.26 9.31 NH3 strip negative E. Baker8/20/2015 13:45 2 4530 Clarewood 8.20 9.41 NH3 strip negative E. Baker8/27/2015 13:20 2 4530 Clarewood 8.03 8.57 NH3 strip negative, city sewer repair/flush upstream E. Baker9/1/2015 10:30 2 4530 Clarewood 8.24 9.13 NH3 strip negative E. Baker
4/8/2015 19:45 3 Culvert 12.63 7.73 location is a stagnant pool with cement dust present E. Baker4/9/2015 13:35 3 Culvert 12.51 6.86 E. Baker4/10/2015 10:41 3 Culvert 8.25 6.60 E. Baker4/11/2015 9:10 3 Culvert 12.58 6.40 J.M. Allan4/12/2015 10:15 3 Culvert 12.63 6.10 J.M. Allan4/13/2015 10:50 3 Culvert 12.63 7.68 all sediment vacuumed from pool on 4/13 PM J.M. Allan4/14/2015 10:10 3 Culvert 9.18 8.32 E. Baker4/15/2015 3 Culvert N/A N/A Not sampled due to contractor work T. DaLomba4/16/2015 15:05 3 Culvert 9.00 5.26 DO meter wouldn't stablize T. DaLomba4/17/2015 12:50 3 Culvert 8.86 8.91 E. Baker4/18/2015 14:52 3 Culvert 8.64 8.80 L. Wolff4/19/2015 11:00 3 Culvert 8.37 8.37 W. Mar
LOWER CREEK (Golf Course Culvert where Creek Daylights)

4/20/2015 12:42 3 Culvert 8.60 8.84 T. DaLomba4/21/2015 12:10 3 Culvert 8.51 8.87 E. Baker4/22/2015 13:56 3 Culvert 8.44 8.85 T. DaLomba4/23/2015 12:18 3 Culvert 8.42 8.77 T. DaLomba4/24/2015 12:30 3 Culvert 8.47 9.06 E. Baker4/25/2015 12:40 3 Culvert 8.38 9.41 rain night before E. Baker4/26/2015 10:12 3 Culvert 8.25 9.90 E. Baker4/27/2015 13:02 3 Culvert 8.29 9.08 T. DaLomba4/28/2015 14:35 3 Culvert 8.30 9.28 T. DaLomba4/29/2015 15:02 3 Culvert 8.14 9.14 T. DaLomba4/30/2015 14:53 3 Culvert 8.35 8.83 Stop sampling at location T. DaLomba
4/8/2015 19:30 4 First footbridge 10.29 9.03 E. Baker4/9/2015 13:25 4 First footbridge 9.44 7.96 E. Baker4/10/2015 10:30 4 First footbridge 8.25 7.64 E. Baker4/11/2015 9:20 4 First footbridge 8.32 6.87 J.M. Allan4/12/2015 10:30 4 First footbridge 8.48 7.42 J.M. Allan4/13/2015 11:00 4 First footbridge 8.41 7.24 J.M. Allan4/14/2015 10:18 4 First footbridge 7.83 7.82 E. Baker4/15/2015 14:48 4 First footbridge 7.24 7.17 T. DaLomba4/17/2015 13:00 4 First footbridge 7.45 0.27 DO questionable reading E. Baker4/18/2015 15:00 4 First footbridge 7.27 7.27 L. Wolff4/19/2015 11:07 4 First footbridge 7.97 6.30 W. Mar4/20/2015 12:51 4 First footbridge 7.23 7.55 T. DaLomba4/21/2015 12:15 4 First footbridge 7.29 2.60 E. Baker4/22/2015 14:03 4 First footbridge 7.67 8.35 T. DaLomba4/23/2015 12:27 4 First footbridge 7.49 5.50 T. DaLomba4/24/2015 12:35 4 First footbridge 7.34 0.64 DO questionable reading E. Baker4/25/2015 12:45 4 First footbridge 8.00 9.04 rain night before E. Baker4/26/2015 10:17 4 First footbridge 8.24 9.40 E. Baker4/27/2015 13:08 4 First footbridge 8.15 8.43 T. DaLomba4/28/2015 14:42 4 First footbridge 8.32 9.19 T. DaLomba4/29/2015 15:09 4 First footbridge 8.20 9.26 T. DaLomba
LOWER CREEK (Golf Course First Footbridge)

4/30/2015 14:59 4 First footbridge 8.25 9.30 T. DaLomba5/4/2015 13:27 4 First footbridge 8.58 12.26 T. DaLomba5/7/2015 12:25 4 First footbridge 8.58 12.26 T. DaLomba5/11/2015 14:33 4 First footbridge 8.01 9.52 creek flushing due to sewage upstream T. DaLomba5/14/2015 14:14 4 First footbridge 7.97 8.50 creek flushing due to sewage upstream T. DaLomba5/18/2015 4 First footbridge WQ sampling suspended due to sewage release7/8/2015 17:03 4 First footbridge 8.95 12.25 T. DaLomba7/13/2015 16:08 4 First footbridge 8.27 10.49 NH3 strip negative T. DaLomba7/20/2015 11:15 4 First footbridge 7.03 8.08 T. DaLomba7/27/2015 12:38 4 First footbridge 8.13 8.70 NH3 strip 0.25ppm L. Patton8/6/2015 12:07 4 First footbridge 7.13 9.01 NH3 strip negative E. Baker8/14/2015 NA 4 First footbridge 7.36 8.99 NH3 strip negative, time not recorded, likely ~1435 E. Baker8/20/2015 14:15 4 First footbridge 9.14 14.08 NH3 strip negative E. Baker8/27/2015 13:55 4 First footbridge 8.79 12.63 NH3 strip negative, city sewer repair/flush upstream E. Baker9/1/2015 11:15 4 First footbridge 7.18 8.15 NH3 strip negative E. Baker
4/11/2015 9:30 5 Coffer Dam (downstream) 8.03 5.01 J.M. Allan4/12/2015 10;35 5 Coffer Dam (downstream) 8.08 7.90 J.M. Allan4/13/2015 11:05 5 Coffer Dam (downstream) 8.05 8.05 J.M. Allan4/14/2015 10:29 5 Coffer Dam (downstream) 7.93 8.70 E. Baker4/15/2015 15:00 5 Coffer Dam (downstream) 7.91 7.89 T. DaLomba4/17/2015 13:07 5 Coffer Dam 8.00 8.76 E. Baker4/18/2015 15:10 5 Coffer Dam 8.05 9.26 L. Wolff4/19/2015 11:13 5 Coffer Dam 8.16 14.47 W. Mar4/20/2015 13:00 5 Coffer Dam 7.93 8.89 T. DaLomba4/21/2015 12:20 5 Coffer Dam 8.05 8.93 E. Baker4/22/2015 14:10 5 Coffer Dam 8.08 12.24 T. DaLomba4/23/2015 12:37 5 Coffer Dam 7.98 10.85 T. DaLomba4/24/2015 12:40 5 Coffer Dam 8.15 10.85 E. Baker4/25/2015 12:50 5 Coffer Dam 8.26 9.46 rain night before E. Baker4/26/2015 10:23 5 Coffer Dam 8.21 10.13 E. Baker4/27/2015 13:18 5 Coffer Dam 8.16 9.60 T. DaLomba4/28/2015 14:49 5 Coffer Dam 8.34 9.94 Coffer dam removed on 4/27 T. DaLomba
LOWER CREEK (Golf Course Cofferdam past Second Footbridge)

4/29/2015 15:17 5 Coffer Dam (former site) 8.17 9.74 T. DaLomba4/30/2015 15:07 5 Coffer Dam (former site) 8.21 9.73 Stop sampling at location T. DaLomba
4/11/2015 9:40 6 150' below Coffer Dam 9.19 10.43 J.M. Allan4/12/2015 10:45 6 150' below Coffer Dam 8.10 8.22 J.M. Allan4/13/2015 11:10 6 150' below Coffer Dam 8.08 9.90 J.M. Allan4/14/2015 10:35 6 150' below Coffer Dam 7.95 10.46 E. Baker4/15/2015 15:04 6 150' below Coffer Dam 8.07 13.14 T. DaLomba4/16/2015 6 150' below Coffer Dam N/A N/A water diverted upstream, no sample T. DaLomba4/17/2015 13:12 6 150' below Coffer Dam 8.02 21.57 E. Baker4/18/2015 15:20 6 150' below Coffer Dam 8.67 19.56 L. Wolff4/19/2015 11:20 6 150' below Coffer Dam 8.38 16.94 W. Mar4/20/2015 13:04 6 150' below Coffer Dam 8.36 15.68 T. DaLomba4/21/2015 12:25 6 150' below Coffer Dam 8.01 10.20 E. Baker4/22/2015 14:17 6 150' below Coffer Dam 8.39 20.20 T. DaLomba4/23/2015 12:43 6 150' below Coffer Dam 8.44 15.59 T. DaLomba4/24/2015 12:45 6 150' below Coffer Dam 8.24 13.45 E. Baker4/25/2015 12:55 6 150' below Coffer Dam 8.30 10.25 rain night before E. Baker4/26/2015 10:30 6 150' below Coffer Dam 8.23 10.65 E. Baker4/27/2015 13:23 6 150' below Coffer Dam 8.34 0.48 DO questionable reading T. DaLomba4/28/2015 14:57 6 150' below Coffer Dam 8.58 11.71 Coffer dam removed from creek T. DaLomba4/29/2015 15:22 6 150' below former Coffer Dam 8.42 12.17 T. DaLomba4/30/2015 15:11 6 150' below former Coffer Dam 8.50 12.63 Stop sampling at location T. DaLomba
4/12/2015 11:30 7 Construction Site 8.76 7.44 Sample at 2" hose draining into manhole. J.M. Allan4/13/2015 10:28 7 Construction Site 9.44 8.97 J.M. Allan4/14/2015 11:20 7 Construction Site 9.23 10.43 E. Baker4/15/2015 14:04 7 Construction Site 12.17 8.86 jetting above location when sampled, minimal flow T. DaLomba4/16/2015 7 Construction Site N/A N/A jetting at Spiritual Center, no flow to sample T. DaLomba4/17/2015 12:30 7 Construction Site 11.90 9.84 E. Baker4/18/2015 7 Construction Site N/A N/A L. Wolff4/19/2015 10:25 7 Construction Site 9.42 9.75 W. Mar
LOWER CREEK (Golf Course past Cofferdam past Second Footbridge)
UPPER DIVERSION TO SANITARY SEWER

4/20/2015 7 Construction Site N/A N/A pumping directly into trucks, no sample T. DaLomba4/21/2015 11:25 7 Construction Site 11.85 9.58 Upper Sanitary diversion removed 4/22 E. Baker
4/12/2015 11;15 8 Adler Tank Discharge into SS 8.48 8.25 Sample at green hose discharging into manhole J.M. Allan4/12/2015 11;10 8 Direct Discharge into SS 8.42 8.09 Sample at grey hose discharging into manhole. J.M. Allan4/13/2015 10:40 8 Adler Tank Discharge into SS 8.50 8.90 J.M. Allan4/13/2015 10:45 8 Direct Discharge into SS 8.25 9.47 J.M. Allan4/14/2015 N/A 8 Adler Tank Discharge into SS N/A N/A Not sampled ‐ water not discharging from tank E. Baker4/14/2015 11:35 8 Direct Discharge into SS 8.28 10.84 E. Baker4/15/2015 8 Adler Tank Discharge into SS N/A N/A T. DaLomba4/15/2015 14:35 8 Direct Discharge into SS 8.26 9.93 T. DaLomba4/16/2015 14:45 8 Direct Discharge into SS 8.12 12 ? DO meter wouldn't stablize T. DaLomba4/17/2015 8 Adler Tank Discharge into SS N/A N/A not running E. Baker4/17/2015 13:27 8 Direct Discharge into SS 8.84 9.87 E. Baker4/18/2015 15:36 8 Direct Discharge into SS 8.35 9.70 L. Wolff4/19/2015 8 Adler Tank Discharge into SS N/A N/A W. Mar4/19/2015 10:50 8 Direct Discharge into SS 8.29 10.48 W. Mar4/20/2015 12:27 8 Direct Discharge into SS 8.28 9.99 T. DaLomba4/21/2015 12:00 8 Direct Discharge into SS 8.29 12.30 E. Baker4/22/2015 13:42 8 Direct Discharge into SS 8.07 9.71 T. DaLomba4/23/2015 12:06 8 Direct Discharge into SS 8.22 10.23 Lower sanitary diversion ended on 4/24/15 T. DaLomba
4/10/2015 14:50 9 492 Florence 8.58 8.47Sample from storm drain for baseline (just upstream of point of origin) E. Baker
4/12/2015 11:00 9 Adler Tank (waste profile in tank) 8.77 9.35 Taken 6" below surface J.M. Allan4/12/2015 11:05 9 Hose into Adler Tank 8.93 9.71 Sampling at lower sanitary diversion J.M. Allan4/18/2015 15:46 9 Adler Tank (waste profile in tank) 8.62 8.45 Tank Full L. Wolff4/20/2015 11:32 9 Adler Tank at 4640 Clarewood 12.00 N/A Waste profile sample T. DaLomba4/28/2015 15:38 9 Temescal Creek before Lk Merritt 8.42 9.56 Comparison creek sample for baseline purposes T. DaLomba7/8/2015 16:50 9 Leach Pit under waterfall 9.07 Leach Pit Sample near DFW Sample Location T. DaLomba7/13/2015 15:55 9 Leach Pit under waterfall 8.02 Leach Pit Sample near DFW Sample Location T. DaLomba7/20/2015 10:57 9 Leach Pit under waterfall 8.62 Leach Pit Sample near DFW Sample Location T. DaLomba
LOWER DIVERSION TO SANITARY SEWER
OTHER SAMPLES

8/6/2015 11:45 9 Leach Pit under waterfall 8.09 Leach Pit Sample near DFW Sample Location #1 E. Baker8/6/2015 11:50 9 Leach Pit under waterfall 8.05 Leach Pit Sample near DFW Sample Location #2 E. Baker8/14/2015 14:20 9 Leach Pit under waterfall 8.20 Leach Pit Sample near DFW Sample Location E. Baker8/20/2015 14:00 9 Leach Pit under waterfall 8.04 Leach Pit Sample near DFW Sample Location E. Baker8/27/2015 14:35 9 Leach Pit under waterfall 8.04 Leach Pit Sample near DFW Sample Location E. Baker9/1/2015 11:00 9 Leach Pit under waterfall 8.14 Leach Pit Sample near DFW Sample Location E. Baker