gis mapping for mendenhall wetland state game refugegis mapping for mendenhall wetland state game...
TRANSCRIPT

ContentsIntroduction ...................................................................................................... 3Previous work .................................................................................................. 3
Methods ........................................................................................................... 4 Current vegetation ........................................................................................ 5 Historical vegetation .................................................................................... 7 Future vegetation ......................................................................................... 8 Layers for property boundaries .................................................................... 8
Interpreting map layers ................................................................................... 9 Lower Mendenhall River oxbow ................................................................... 9 Changes on the central refuge .................................................................... 9 Refuge overview: past, present, and future ............................................... 11
Recommended research ..............................................................................14
Acknowledgments .........................................................................................15
References ....................................................................................................15
Appendix A Common and scientific names ................................................16Appendix B Property layers .........................................................................17Appendix C Vegetation 2003 and contours .................................................18
Final Report
GIS Mapping for MendenhallWetland State Game Refuge
Vegetation types, tidal elevations, property boundaries, and their relation toglacial rebound and the conservation of accreted land.
by Discovery Southeastfor the Southeast Alaska Land Trust
March 2004
Discovery SoutheastLarry West, Executive Director
P.O. Box 21867, Juneau, AK 99802(907) 463-1500 / 463-1587fax

2
This report was prepared under a Competitive Coastal Impact Assistance Program (CIAP) grantawarded by the Alaska Coastal Policy Council. The grant supports the Southeast Alaska LandTrust’s initiative to conserve accreted lands adjoining the Mendenhall State Game Refuge. TheCIAP grant covered 100% of the costs for this report, which was prepared under contract byDiscovery Southeast for $10,968.
The Southeast Alaska Land Trust is grateful to the Alaska Coastal Management Program and theDepartment of Community and Economic Development, Division of Community Advocacy for theirassistance in administering this project.
SEALTrustThe Southeast Alaska Land Trust cooperates with communities and landowners to ensure that vitalnatural areas remain in place for the well being of each generation.
(907) 586-3100fax 586-3125
[email protected] Seward St, Suite 15
Juneau, AK 99801
Discovery SoutheastFounded in 1989 in Juneau and serving communities throughout Southeast Alaska, DiscoverySoutheast is a nonprofit organization that promotes direct, hands-on learning from nature throughnatural science and outdoor education programs for youth and adults, students and teachers.Discovery Southeast naturalists aim to deepen the bonds between people and nature.
(907) 463-1500fax 463-1587
PO Box 21867Juneau, AK 99802
SEAWEADSoutheast Alaska Wilderness Exploration, Analysis & Discovery (SEAWEAD) is comprised of asmall group of naturalists and educators. SEAWEAD’s mission is to facilitate research-basedcooperative stewardship of wild lands in Southeast Alaska.
www.seawead.org

3
GIS Mapping for Mendenhall Wetland State Game RefugeVegetation types, tidal elevations, property boundaries, and their relation to
glacial rebound and the conservation of accreted land.
Richard Carstensen • Discovery Southeast • for the Southeast Alaska Land Trust
The Mendenhall Wetlands complex has the secondgreatest acreage of vegetated tidal salt marsh of allestuaries in Southeast Alaska (exceeded only by the StikineRiver marshes). It ranks 7th in extent of unvegetated tidalflats. It is widely acknowledged to be one of the keymigratory waterbird stopover locations of coastal Alaska.Recreational value is very high, and will continue to grow.
Estuaries are among the world’s most dynamichabitats, and nowhere is this more true than in northernSoutheast Alaska. As land here rises from glacial rebound,tidal salt marshes change dramatically. Vegetation commu-nities migrate perceptibly seaward from decade to decade.And where property boundaries are based upon tidalelevation, land may also change ownership.
The Southeast Alaska Land Trust (SEALTrust) hasembarked upon a project entitled Conserving accretedland adjoining the Mendenhall State Game Refuge. Theproject goal is to identify challenges and opportunities inconservation of this critically important estuary complex.SEALTrust subcontracted with Discovery Southeast (DSE)and Southeast AlaskaWilderness Exploration,Analysis and Discovery(SEAWEAD) to provide
Fig 1 View south overGastineau Channel toJohnson Creek estuary onDouglas Island, April 29,2002. Photo taken about anhour after tide peaked at16.5 feet. Arrows showdarker, recently wettedborder along the channelwhere this tide had reached.
Small spruces in “upliftmeadow” in left distance arecolonizing former tideland.Most of the vegetationbetween Johnson Creek andGastineau Channel is grass-dominated high marsh,extending from extreme highwater out to about the 16.5foot elevation.
maps and GIS* analysis of the Refuge, to be used in theconservation assessment. SEALTrust’s primary focus is onthe belt of private properties along the refuge boundary.
In addition to compiling air photography and GIScoverages from several sources, Discovery Southeastnaturalists conducted field surveys in late summer, 2003, togather data for a complete vegetation map of the refuge. Anunderstanding of refuge vegetation, the wildlife it sup-ports, and changes to vegetation over time, is a first step insetting conservation priorities. We hope that this reportand the accompanying GIS project will be useful not onlyto SEALTrust, but to ADF&G refuge managers, otherregulatory agencies, advisory groups, consultants,researchers, and recreational users of the MendenhallWetland State Game Refuge.
Recent advances in ArcMap allow us to share theGIS project electronically, even with those lacking accessto the full ArcMap program. A read-only “ArcReader”document containing all of the essential components of therefuge project is available on CD, along with the applica-
*GIS stands for Geographic Information Systems - computerized mapping and spatial analysis. The most widely used GIS application isArcMap. Until recently this expensive suite of programs was only available to specially-trained professionals. But the advent of thefree program ArcReader makes it possible to prepare maps, overlays and data sets that anyone can examine on a home computer.Similar in concept to .pdf files created for Adobe Acrobat, ArcReader .pmf documents allow users with no GIS experience to turn maplayers on and off, zoom in and out, measure distances, query data layers, and print anything viewable on screen.

4
tion itself. Those not trained in GIS will find ArcReaderintuitive and useful. Others with access to ArcMap (orearlier versions of ArcView version 3) will of course preferthe full refuge project.
Previous workMany related investigations have been conducted
throughout the Mendenhall Refuge, and some are espe-cially valuable for their historical context.
John Crow, currently at Rutgers University, installedpermanent vegetation plots on the Mendenhall Wetlandsin the 1960s. In 2001, he returned to Juneau on contractwith the Alaska Dept of Fish and Game for repeat measure-ments on these plots.
Sarah Watson did graduate studies of birds andhabitats of the Mendenhall Wetlands in the mid 1970s, andproduced a large scale vegetation map. (Watson, 1979)
Cathy Stone conducted doctoral studies of coastalmarsh vegetation on the Mendenhall and Eagle Riverwetlands, also in the mid-1970s. Her delineation of commu-nity types has proven useful in subsequent mappingefforts on the wetlands by SWCA, described below.(Stone, 1993)
Paul Adamus came to Juneau in the mid 1980s toconduct wetland assessments for the CBJ. A particularstrength of the Adamus protocol was the integration ofbird surveys with vegetational descriptions. Focus wasprimarily on freshwater wetlands, but as part of the fieldcrew I conducted combined bird/vegetational surveys onthe upper margins of the refuge, and at uplifted formertidelands at Brotherhood Park. (Adamus 1987)
Ed Cain, Jack Hodges, and Everett Robinson-Wilsonsurveyed birds on the wetlands for the US Fish andWildlife Service throughout 1986. Their report (Cain et al.
1987) provided a baseline for our subsequent bird“hotspot” study, described below.
Dan Bishop (Environaid), Bob Armstrong and Istudied the area around Temsco and the east end of therunway in 1986 on contract with Isbul Associates, whoprepared the EIS for an extension of the taxiway. Wecreated detailed vegetation maps for parts of the wetlandsthat have since been filled or altered by barriers to tidalflow. (Bishop et al. 1987)
R&M Engineers studied potential realignment oflower Duck Creek in the mid 1990s. For that study Iprepared a detailed vegetation map of “Duck CreekTriangle” and a short environmental report (Carstensen,1995).
SWCA Inc. has completed fine-scale habitat mappingfor the Juneau International Airport property, and morecoarse-scale mapping based largely on photo-interpreta-tion for the greater refuge. Their final EIS has not beenpublished at time of this report, but maps can be down-loaded from their website at www.jnu-eis.org.
Bob Armstrong, Mary Willson and I conducted ayearlong study of bird “hotspots” on the MendenhallRefuge on contract with the USFWS, beginning in spring2002. (Armstrong et al. 2004). The full study was publishedthrough the Juneau Audubon Society and Taku Conserva-tion Society. We feel that this is the most completesynthesis of Mendenhall Wetlands natural history. Chapter4 of that report – Glacial rebound, vegetation and birds –describes vegetational types on the refuge. Copies havebeen provided to SEALTrust and others concerned withmanagement issues on the refuge. Rather than repeatingthe information and illustrations in Chapter 4 for the currentSEALTrust summary, the reader is referred to the“hotspots” report. Copies are available on CD, and will also
be available on the JuneauAudubon website for down-loading. (www.juneau-audubon-society.org)
MethodsThe base imagery for our
project is 9-inch-pixel colorinfrared (CIR) digitalorthophotography commis-sioned in August 2001 by theairport EIS consultants, SWCAInc, along with the City and
Fig 2 August 2001 color infraredphoto. Runway on left, LemonCreek at center right. Dots showdownloaded GPS waypoints –each color from a different day’svisit. (“Waypoints” are positionsdetermined by satellitetriangulation using a GlobalPositioning Systems unit, or GPS.)

5
Borough of Juneau.Bruce Simonsen, GISmanager for CBJ,provided us with theseimages, and subse-quently, additional datalayers. All images andcovers are in NAD 83, Alaska state plane, zone 1 (USsurvey feet).
The Mendenhall Refuge requires 50 of these veryhigh resolution 3700-foot-square tiles. At high magnifica-tions, this photography shows details such as the rootwads of drift logs. Color infrared reveals some differencesin vegetation communities that are not visible in true colorphotography. However, one of the key community bound-aries on the refuge, between high marsh and low marsh(see Armstrong et al., 2004, p. 10-16), was not readilyapparent from either color or texture on the SWCA photos.To map vegetation on the tidal marsh, we clearly neededground surveys.
Current vegetation. In early September, 2003, I made7 visits to the refuge to collect plant community data,sometimes with the help of Discovery naturalist TerrySchwartz. We took GPS waypoints that were later down-loaded onto the CIR imagery. At each point we recorded
plant community, dominantspecies, and additional
comments on substrate,successional
trends, wildlife sign, etc. The notes were taken on taperecorder in order to cover as much ground as possible.Special effort was made to collect waypoints on bordersbetween community types. At times, we would follow thesecommunity breaks, recording strings of waypoints.
Figure 2 shows examples of the waypoints. Fieldnotes were transcribed from tape recorder directly into thewaypoint database in GIS, so that the waypoint positioncould be viewed on the monitor while entering data,allowing correlations between photo and ground-basedobservations to emerge. Next, waypoints were labelled withcommunity type (Fig 3), and polygons were drawn repre-senting the key salt marsh vegetation types. Although thephotography used in delineation was taken in August,2001, the vegetation layer in our ArcMap project is calledveg2003, because it reflects the more recently acquiredground data.
The color infrared images are particularly good forpicking up the lower contact of vascular and algal matvegetation with bare sediments. Distinguishing vascularfrom algal communities, however, was not always easy onthe photos.
The most challenging part of the mapping wasfinding the high marsh/low marsh break (HMLM on Figure3, 4 and 5). In some parts of the 2001 imagery this boundary
is signalled by a subtle color shift. However, thesecolors vary from one part of the refuge to the
other. In some areas high marsh may be palerthan low marsh, and in other areas it may bedarker.
Fortunately, we acquired an additionalresource in this high marsh/low marsh delinea-tion. During the Hotspots study (Armstrong et
Fig 3 Also from Aug 2001CIRs. This sample from ourvegetation layer showsspoil islands (fromdredging of GastineauChannel) in center of Fig 2.Waypoints are labeled withcommunity type. HM = highmarsh. LM = low marsh.LL = lower low marsh(also called succulentmarsh). AL = algal matcommunity. NV =nonvegetated. WA = water.Combined types, eg.HMLM, show communityboundaries.
Fig 4 Salt marsh zonation

6
Fig 5 October 10, 2002.True-color digital phototaken on flight with JackHodges, USFWS. EganDrive crosses LemonCreek at center. At thistime, the sedges of the lowmarsh had wilted, whilegrass blades remainederect and retained some oftheir green color.
al., 2004), we wereinitially limited by thelack of low-tide aerialphotography formapping of the criticallyimportant mussel/barnacle/rockweedcommunities. OnOctober 10, 2002, I flewover the refuge withJack Hodges of USFWSto take vertical airphotos. The 20-minuteflight was centered around a zero tide. Photo coverage ofthe refuge was not continuous, but I captured most of thekey areas of mussel/barnacle/rockweed beds, and enoughof the zero-foot waterline to create an approximate contour
for that elevation. The great unanticipated benefit of theOctober photography, however, was the clear distinctionbetween grasses of the high marsh and sedges of the lowmarsh (Fig 5).
supratidal communitiesWD wooded – Young stands of spruce, alder, willow orcottonwood on former tideland. (Older mature conifer on refugeborder is not delineated). Where colonizing trees are dispersed,they are not individually mapped, but included with MD.MD meadow – Diverse forb or graminoid meadow on raisedformer salt marsh. Includes fireweed, cow parsnip, lupine, etc.SD seeded or mowed - human-altered communities such asrunway margin, highway median, golf fairway, etc.
tidal communitiesHM, LM and NV form nearly continuous elevational belts. LL,AL and MS are patchier in distribution.HM high marsh – Grass-dominated upper portions of the saltmarsh. Typically from Extreme High Water Spring (EHWS)down to about the 16 or 17-foot tide level. Includes rye grass,*hair grass and foxtail barley. With glacial rebound this type isdisplacing the low marsh .LM low marsh – Lyngbye sedge-dominated lower portions ofthe salt marsh. Flooded almost daily. Extremely important tograzing waterfowl and mammals, as well as to invertebrate
* Common names for selected tidal marsh plants follow Pojar and MacKinnon, 1994). For scientific names, see Appendix A)
Vegetation types mapped on the Mendenhall WetlandsThis classification matches that of SWCA for the Airport EIS project. I have used roughly similar color codes for easy comparison.Both systems are based on Stone(1993) for salt marsh (tidal) communities. In the lower tidal reaches I have added 3 communitytypes (LL, AL, MS) important to fish and birds. See Armstrong et al. (2004) for discussion of ecology and succession. The full refugecoverage of the veg2003 layer is shown in Appendix C
communities supporting rearing salmonids and other marinefish.LL lower low (or succulent) marsh – Dominant species suchas goosetongue, sea milkwort and arrow-grass (not a truegrass, as indicated by the hyphen) are shorter in stature andless fibrous than grasses or even sedges. Many are eaten bygrazers. An exception to the general succulence of the LLcommunity is alkali grass, more tolerant of salinity than thetaller high marsh grasses.AL algal mat – Carpet-like, interwoven filaments of algaeincluding Vaucheria sp.MS mussel/barnacle/rockweed – Variable dominance. Needscoarse material in the sediment mix for anchorage. Because thistype is only briefly exposed, and we have only partial refugecoverage of low-tide photography, my map may have missedsome patches of this very important type.NV non-vegetated – mostly bare sediments, fine to coarse.WA water – mapped from the mid-stage of tide shown on the2001 CIR photography. Level of course changes hourly.
7
Lyngbye sedge superficially resembles a grass, evenat close quarters. Sedges are generally more palatable thangrasses to grazers, however, because they are less fibrous.Throughout most of the growing season this difference isnot visually apparent. But during fall senescence, Lyngbyesedges quickly wilt and lie prostrate, while high-marshgrasses remain erect. The sedges lose their green color andfade to a pinkish tan. Grass colors also fade, but they holdtheir green coloration longer. It turned out that October10th was an ideal time to photograph the HMLM break.
In ArcMap, I georeferenced 26 of the October 2002true-color aerials and arranged them sequentially over theaccretion.mxd project. These images could be toggled onand off as I drew polygons for high marsh and low marshcommunities. While my October shots do not cover theentire refuge, I feel confident that the HMLM break isgenerally accurate on the veg2003 layer. The Octoberimagery also helped in some areas to separate algal matcommunities (AL) from the vascular “lower low” marsh(LL).
On the veg2003 layer, as well as for historical andfuture projected veg layers, I have included two areas ofsalt marsh on private lands contiguous with the refuge:
1) golf course and other properties north to CrazyHorse Drive.
2) estuaries of Switzer, Lemon and Vanderbilt Creeks.These wetlands, although privately owned, and in
many cases altered or impaired, are functionally a part ofthe greater Mendenhall Wetlands, and are thereforeincluded in the total acreages reported for wetland commu-nity types, past, present and future. By making them part ofthe assessment, we hope to offer a more comprehensivepicture of historical and future change. They may also beconsidered as potential mitigation purchases, for eventualinclusion in the Mendenhall Refuge.
The ArcMap layer called veg2003 is a snapshot intime. By the end of this decade, it will be obsolete. Saltmarsh communities respond closely to duration of tidalsubmergence and exposure, water currents, and sedimentcomposition, and all of these physical features are chang-ing with glacial rebound and with human alterations tomarsh topography. Refuge management and conservationstrategies depend on understanding of successionaltrajectories. Veg2003 should be only one layer in a “movingpicture” of salt-marsh vegetation that includes past,present and future.
To create this moving picture, a key step in ourrefuge mapping plan was correlation of vegetation commu-nities with tidal elevation. The CBJ has been developingLIDAR-generated contours for the refuge, but because oftechnical problems, these were not available at time of ourproject completion.
As an interim solution, Bruce Simonsen has given usa “provisional” 15.4-foot (mean high water) contour(Appendix B). In some places, “mean high water” definesthe boundary between refuge and private lands. It is alsohelpful in understanding vegetational distribution. Thecurrent “15.4tideline” layer in our ArcMap project will bereplaced eventually by a more extensive set of contours,and even the 15.4 line will no doubt be revised.
Our “15.4tideline” layer has no legal standing, willbe revised, and is to be used strictly for initial discussionsamong SEALTrust and other groups considering wetlandconservation issues.
Historical vegetation To create maps of vegetationcommunities in the past, we collected, scanned andgeoreferenced air photography from 1948, 1962, 1967, 1979and 1984. Of these coverages, only 1962 and 1979 wereacquired for the entire refuge. The earliest photography inmy personal collection–the 1948 SEA series–extends westonly to the mouth of Fish Creek, and is missing the mouthof Mendenhall River and Penninsula. Even earlier photog-raphy, from 1929, does exist for portions of the Mendenhallwetlands, but we were unable to locate copies. Theseearliest photo series–1929 and 1948–are useful for mappingobvious features like roads and streams, but both arecoarse in resolution compared to subsequent photography,and would be inadequate for salt-marsh vegetationdelineations.
The best of the older photography for vegetationmapping is the NASA 1979 CIR series. Although taken fromvery high elevation at a scale of only one inch to the mile,resolution is high enough to permit considerable enlarge-ment. More importantly, only on this photography cangrassy high marsh be distinguished from sedge low marsh.In this regard it is even better than the much higherresolution 2001 CIRs.
Tracing over the georeferenced 1979 CIRs, I created ashapefile showing extent of meadow, high marsh and lowmarsh (MD, HM and LM, respectively) for that period.Other marsh communities are much harder to map, and
would requireground-truthedinformation, aswas true for the2001 imagery.These threewetland types,however, arethe most criticalfor an under-standing of
year agency scale type georef. % refuge covered % acquired resolution1929 Navy 1:20,000 B&W no portions none coarse1948 ? 1:40,000 B&W yes/RC complete missing west end coarse1962 USFS 1:23,000 B&W yes/RC complete complete fine1967 ? 1:4,800 B&W yes/RC airport area airport area very fine1979 NASA 1:60,000 CIR yes/RC complete complete medium1984 USFS 1:15,840 true color yes/RC complete west end only fine1996 NASA 1:60,000 CIR no complete complete medium1996 NASA 6-ft pixel B&W DOQ yes/USFS complete complete medium2001 SWCA 9-in pixel CIR DOQ yes/SWCA complete complete very fine
Table 1 Historical photography for Mendenhall Wetlands

8
ecologically important changes over time.I scanned and georeferenced Sarah Watson’s
vegetation map of the refuge (Watson, 1979) for compari-son to my 1979 vegetation layer. Communities depicted onthe Watson map–upland marsh transition, sedge dominant,and plantago–roughly correspond to my high marsh, lowmarsh and lower low (succulent) marsh, respectively, butthe breaks were drawn somewhat differently. Some of thelower limits of my “sedge low marsh” were typed byWatson as “plantago.” On the other hand, areas that Imapped as high marsh in the upper limits of the wetlandswere often typed as “sedge dominant” by Watson, so thetotal extent of low marsh sedge is roughly similar on thetwo maps.
The 1962 photos are impressively sharp. But blackand white photography offers less information than doestrue or infrared color. There was a greater degree ofspeculation in my interpretation of these 1962 photos thanfor the 1979s. This is especially true of the high marsh/lowmarsh break. The tide was also fairly high in the 1962s, andwater may have covered the lower portions of some of thelow marsh. I think, however, that by working backwards intime, mapping 2003 and 1979 first before proceeding to1962, I learned enough to locate the 1962 community breaksin roughly the correct position. My estimates of acreage inmeadow, high marsh and low marsh for 1962 should beconsidered “ball park.”
Although the georeferenced photography from 1948,1967 and 1984 was not used to create “vegtype” shapefilesfor those years, the images were very useful for specificpurposes. The 1967 shots, for example, are extremelydetailed, and were used to double-check my interpretationsfor the 1962 layer in the airport area. The 1984s couldsimilarly be used to verify interpretations from the 1979susing different color spectrum and greater resolution. The1948 aerials show the Mendenhall wetlands before the
dredging of Gastineau Channel, and give an indication ofthe original tidal flow dynamics.
Future vegetation The fourth vegetation layer inaccretion.mxd is for the future year 2025. At 0.6 inches peryear of glacial rebound (Hicks and Shofnos, 1965, RomanMotyka, pers. comm.) the land will have risen approxi-mately one foot in 2025. Other assumptions used in myfuture projection are:
1) The current high marsh/low marsh break (HMLM)occurs at approximately 16.5 feet. (this assumption may bealtered when we have more complete topographic mappingfor the refuge).
2) With one foot of rebound by the year 2025,today’s 15.4-foot contour will become the ~16.5-footcontour. The HMLM break should migrate out to roughlythat position.
3) The lower edge of the low marsh should migrateout to about the position of the current lower margins ofthe lower low (succulent) marsh (LL), and/or the algal matcommunities (AL).
4) Uplift meadow (MD) will continue its advance intothe upper reaches of the high marsh as the position ofExtreme High Water changes. I have no contour lines orlower community positions to reference for the futureMDHM break, and here relied on best judgement, fromexperience with current vegetation and apparent rates ofadvance in different parts of the refuge.
5) No further development will take place on therefuge or adjoining private wetland parcels. (If it were tooccur, loss would be primarily to acreage of uplift meadowand high marsh types.)
In addition to the provisional 15.4-foot tide lineprovided by CBJ, I made use of the approximate zero-footline mapped from the October 2002 low-tide photography(Appendix C). Although the low marsh will not approach
even close to today’s zero foot lineelevationally by the year 2025, therelative separation of 15.4 and zerolines gives a crude indication ofslope of the terrain. In some places,such as the dredged portions ofGastineau channel, the 15.4 andzero lines are actually very closetogether on the horizontal dimen-sion.
Terrain-slope will of course bemuch better established by futureLIDAR-generated contours, andwill allow more sophisticatedmodelling of future vegetationalchange.
Fig 6 Sample from parcels layer forthe Wigeon Ponds area nearMendenhall Penninsula. Private parcelsare labelled with the “owner” field.

9
Layers for property boundaries Theaccretion.mxd project includes layers showing theairport and refuge boundaries, and another forprivate parcels adjoining the refuge. As with the15.4 contour, these are to be used only bySEALTrust and collaborators for initial scopingpurposes. Property boundaries (Fig 6) are notsurvey-grade accuracy on these layers. Theyshould be useful, however, in identifying landowners in areas of conservation concern.
Interpreting map layersMany patterns and trends emerge from an
examination of the layers in this GIS project. We willdescribe a few, to demonstrate potential applica-tions of the project. Each user will hopefullydevelop additional applications. “Accretion.mxd”is best considered an evolving analytical tool,rather than a final product.Lower Mendenhall River oxbow
The impending cutoff of the tight oxbow loopon Mendenhall River above Brotherhood Bridgehas received considerable attention recently,perhaps because of uncertainties about its signifi-cance to down-river development. Less attentionhas been given to a similarly narrow-necked oxbowjust west of the airport (Fig 7).
In 1967 the dominant vegetation throughoutthe scene was Lyngbye sedge, which probablyresulted in more frequent goose activity. Note alsothe dredging activity in the floatplane approachpath. This would probably not be permitted todayin light of what is known about attractiveness ofdredge ponds to birds dangerous to aircraft.
By 1984, high marsh grasses (darker green)had extended out onto the oxbow neck, which haderoded on both sides, to only 200 feet across. Lowmarsh sedges (paler blotchy grey-green) occupiedthe lower river terraces)
In 2001 the neck was only 60 feet across.Sedge cover expanded on the muddy river terraces
Fig 7 Historical series and predicted lagoon morphology, lower Mendenhall River oxbow. Lagoon will still connect on ~ 15 foot tides.
Table 2 Oxbow neck erosion rate infeet per year, calculated for intervalsbetween photography. Rates held fairlysteady except for 1984 to 1996. At themost recent rates, the neck would bebreached in 2005.
width loss timespan ft/year1948 8001962 540 260 14 191967 440 100 5 201979 280 160 12 131984 200 80 5 161996 150 50 12 42001 60 90 5 18

10
Fig 8 Five-part historical series for central refuge.At extreme lower left is a meander loop of NinemileCreek, Douglas Island. Bedrock Island in upperright. Gastineau Channel in center.
but was replaced by grasses in the upper center.When the neck is breached, a tidal lagoon
will form. This brackish pond, if no longerheavily scoured by river currents, could supportditch-grass and develop into exceptional fishand bird habitat. Unfortunately it is in the wronglocation. Enhanced bird foraging opportunitieswill not be acceptable to the FAA.
Changes on the central refuge Figure 8 shows 5 stages in the evolution
of channel morphology and vegetationalcommunities in the heart of Mendenhallwetlands. An examination of each photo willintroduce some interpretive clues that can alsobe applied to other portions of the refuge in theaccretion.mxd project.
1948 At first glance, the 1948 photoappears devoid of human influences. No roadexisted on Douglas Island. The right edge of thescene was the approximate tidal divide ofGastineau Channel. Tidal sloughs brancheddendritically from left to right, but to the east ofBedrock Island (off the photo), they began tocoalesce again.
Relative sea level was about 3 feet higherthan today in 1948. The sea washed daily up tothe forest edge, where today it visits rarely. Theupper half of the scene was mostly bare tide flattransected by sloughs. Because there were fewanthropogenic impediments to tidal flow(runway extensions, dikes, spoil islands, EganDrive, etc), currents were likely stronger thantoday, scouring the flats and in many placespreventing vascular plant establishment evenwhere tidal elevations might have permitted it,given a bit more protection.
The mottled patterns on the flats justnorth of the forest were incipient sedge lowmarsh. White patches in the upper portion weretopographically higher and thus drier than thedarker wetted portions of the flats. They wereprobably a combination of natural berms createdby tidal currents, and sidecast from earlydredging activities. In the ArcMap (orArcReader) project, examine the area eastwardfrom this scene. A very narrow E-W precursorto the 1962 channel dredging operation isevident there and the white berms are morereadily recognized as dredging spoils.
1962 Tide was higher in this scene,possibly covering the lowest portions of the

11
vegetated marsh. Completely whiteareas were recent, unvegetatedspoil piles from the deepening andbroadening of Gastineau Channelto enhance small boat passagebetween downtown Juneau andFritz Cove.
Relative sea level was 2 feethigher than today. The smoothgrey portions of the flats weresedge low marsh, with morecomplete coverage than in themottled 1948 photo. A road hadbeen put in (but compare the 1979alignment). No residential develop-ment had yet occurred.
1979 Tide was very low forthis photography, and sloughthalwegs (deepest part of channel)were clearly outlined. Peach tintsshowed the first colonization ofgrassy high marsh, which hadreplaced half of the former sedgelow marsh on the Douglas side ofthe channel. High marsh waspatchier on the north side,primarily invading the spoilislands. Low marsh was indicatedby the paler pink tints, closer tothe sloughs.
Five homes had been built in1979. Fill intruded into the marsh inthe lower left corner. This musthave occurred shortly after the1962 photos because it wasalready well colonized by alder in1979.
1984 Relative sea level wasonly one foot higher than today.High marsh had almost finished itsreplacement of sedges south ofGastineau Channel. Darkest greencircular patches were clones of ryegrass invading the remnants ofsedge communities. Pale greyareas on spoil islands showed retarded succession,probably because of substrate coarseness These patcheswere washed by high storm tides, excessively drained, andhostile to seedlings during dry spells.
2001 Spruces invaded the spoil islands along thenorthern edge, but a few white patches showed areas thatstill resisted colonization. As in the 1984 true color photo,darker circular patches showed grass clones establishing insedge low marsh. Generally, however, the colors are hard tointerpret in this photo, and ground-truthing was necessaryfor us to draw the high marsh/low marsh break shown inthe veg2003 layer. The last substantial patches of low
marsh were in the upper left, lower left and upper center.Because sedge low marsh is disappearing from the DouglasIsland side of the refuge, avian grazers like geese now makelittle use of this area (Armstrong et al. 2004)
Sixteen houses appeared in this scene. The currentCBJ parcels layer shows 25 lots north of the highway.Refuge overview: past, present, and future
Direct examination of the georeferenced historicalphotos reveals details of change and trend for specificareas. But to analyze refuge-wide patterns, it is also usefulto have GIS shapefiles that identify key community types.From these layers, total acreages can be tallied by type and
12
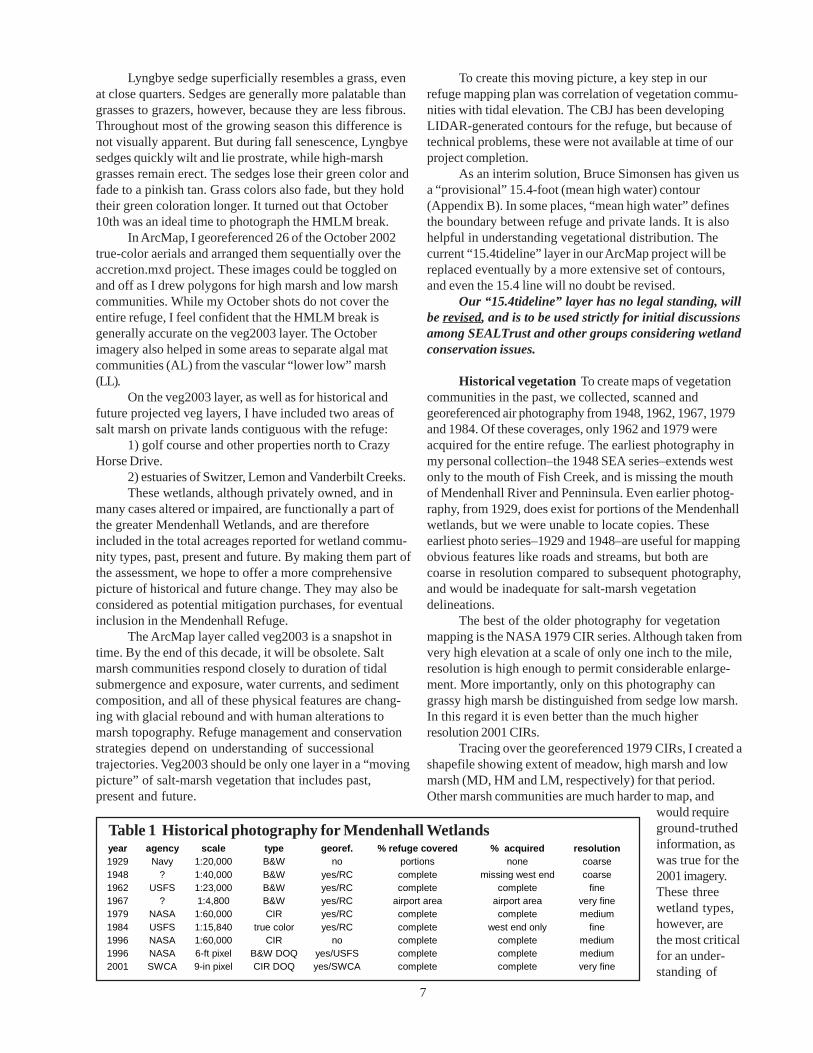
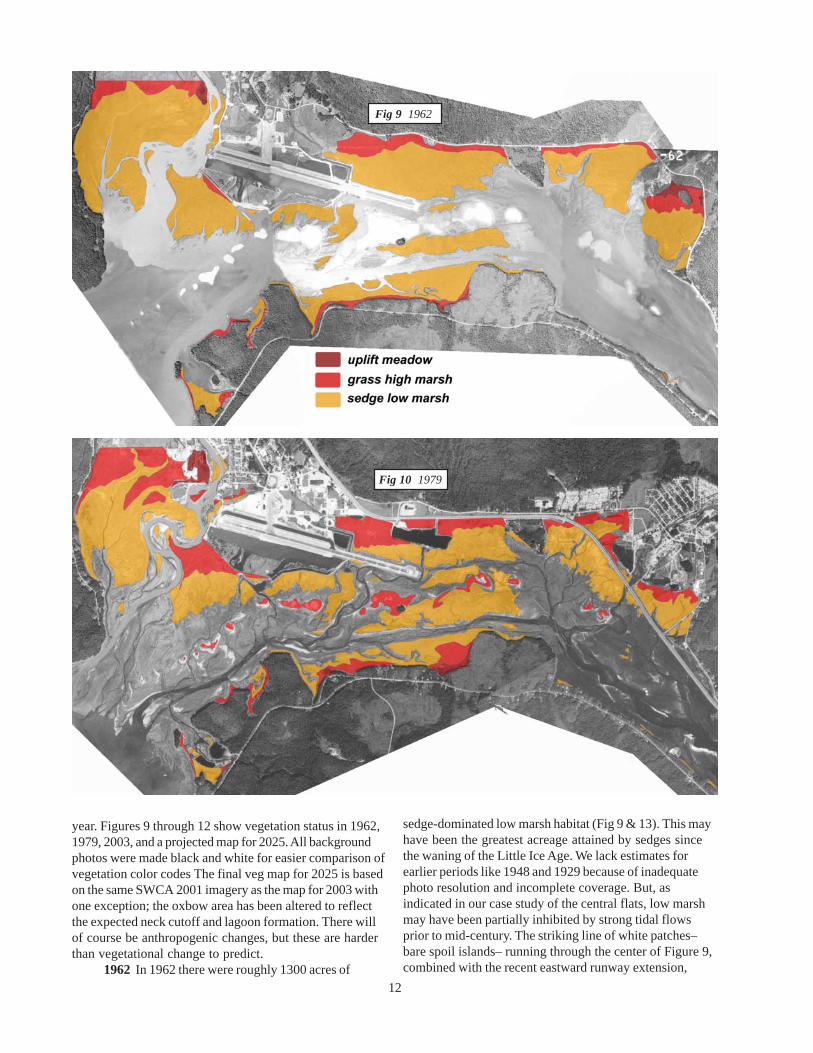
year. Figures 9 through 12 show vegetation status in 1962,1979, 2003, and a projected map for 2025. All backgroundphotos were made black and white for easier comparison ofvegetation color codes The final veg map for 2025 is basedon the same SWCA 2001 imagery as the map for 2003 withone exception; the oxbow area has been altered to reflectthe expected neck cutoff and lagoon formation. There willof course be anthropogenic changes, but these are harderthan vegetational change to predict.
1962 In 1962 there were roughly 1300 acres of
Fig 9 1962
Fig 10 1979
sedge-dominated low marsh habitat (Fig 9 & 13). This mayhave been the greatest acreage attained by sedges sincethe waning of the Little Ice Age. We lack estimates forearlier periods like 1948 and 1929 because of inadequatephoto resolution and incomplete coverage. But, asindicated in our case study of the central flats, low marshmay have been partially inhibited by strong tidal flowsprior to mid-century. The striking line of white patches–bare spoil islands– running through the center of Figure 9,combined with the recent eastward runway extension,

13
Fig 11 2003
Fig 12 2025
Fig 13 Acreages of three vegetation types shown in Figures 9 through 12.severely altered the original tidal flow patterns.There was only a relatively thin belt of high
marsh grasses along the borders of the MendenhallWetlands, and little of it was within the refuge ascurrently defined. Relative proportion of low marsh tohigh marsh in 1962 would be even higher if non-refuge lands were excluded from our acreage totals.
1979 By this time, grassy high marsh hadadvanced well out into the refuge in some areas,doubling in acreage over the 1962 levels, while sedgelow marsh declined commensurately. Advance of lowmarsh into former bare mudflat did occur, but not to
0
300
600
900
1200
1500
1962 1979 2003 2025
acre
s
md
hm
lm

14
the degree that it was lost to grass invasion from above.Construction of Egan Drive heavily impacted fish
and wildlife habitat in the Lemon Creek area. Dredge pondsand landfill proliferated, and what remained of the once-richtidal marshes northeast of the new expressway was nowwashed only via culverts.
2003 The period between 1979 and 2003 saw thegreatest losses in low marsh acreage: from 1123 down to727 acres. At the same time, grassy high marsh roughlydoubled, from 465 to 941 acres. In the area betweenTemsco and Sunny Point, low marsh sedges do occur, butthey are mostly confined to the inner terraces of branchingsloughs.
While greatly reduced from former times in terms ofacreage, these linear sedge habitats are extremely importantto birds and fish. Although no studies have addressed thephenomenon, it is possible that the terrace sedges maypersist longer than might be expected from rates of glacialrebound. Tidal scour could potentially grade the sloughsdownward as surrounding flats rise. Because these narrowbelts of low marsh sedges may eventually be all we haveleft on the refuge, more investigations of succession andtidal dynamics along slough systems are warranted.
For the first time in the historical series, substantialcoverage of uplift meadow–234 acres– appears on the 2003vegetation map. In 1962 and 1979, uplift meadow wasalmost non-existent on the mapped portions of Mendenhallwetlands. But it had formerly been widespread to the northof the mapped area, in both the lower Mendenhall Valleyand at Lemon Creek. For about a century following thewaning of the Little Ice Age, glacial rebound had beenshifting former tidal salt marsh into supratidal elevations.The result was a rich herbaceous meadow of very highvalue to grazing mammals like deer and bear. Theseunforested but well-drained coastal habitats made idealbuilding sites, and were quickly replaced by industrial andresidential development, as can be seen by a comparison ofFigures 9 and 10 north of the airport and in Lemon Creek.
Uplift meadow is a globally rare habitat (see discus-sion in our report to SEALTrust on the Amalga-Eagle area,Carstensen, 2003). Certainly it is less important than thefrequently flooded tidal habitats to migratory waterfowland shorebirds, but it offers superb foraging habitat forresident mammals and nesting songbirds. The MendenhallRefuge may be poorly situated to retain substantial acreageof low marsh communities, given continued glacial reboundand human barriers to tidal flow. But it is ideally situated to“capture” increasing acreage of uplift meadow (Figs 11, 12and 13). Managers may want to plan for this shift in habitatvalues by maintaining or enhancing access corridors intothe refuge for deer, bear, and other mammals, especially onDouglas Island and off Mendenhall Peninsula.
2025 During the next quarter century, our low marshsedge habitat will again be reduced, perhaps by as much asin the preceding 25 years. The amount and configuration ofloss will vary throughout the refuge. In the central por-tions, only thin belts of sedge will remain along sloughs.Along Mendenhall River, and southeast of Sunny Point,prospects are brighter for retaining enough acreage tosupport grazing and seed-gleaning waterfowl, and otherwetland functions such as maintenance of the invertebrateprey base for summering salmonids, sculpin and flounder.
The southward migration of low marsh habitats mayhelp to draw waterfowl–probably the most dangerous ofthe groups of “birds of concern”– away from the airportarea. Currently, Canada Geese are disproportionatelyconcentrated near airport facilities for both foraging andresting (Armstrong et al. 2004). Redistribution of birds inresponse to vegetational changes could therefore improveairport safety to some degree.
On my predicted vegetation map for 2025, acreage ofuplift meadow is projected to double over the currentamount, from 234 to 432 acres. A large percentage of thegain, however, will be on unprotected private lands, and sothese areas may well be developed instead. Much of thepredicted meadow habitat north of the runway is slated forairport expansion. And although the northwest corner ofthe 2025 map is shown as potential uplift meadow, indus-trial expansion or further golf course development willlikely prevent that.
Recommended researchThe following list of research needs for the
Mendenhall Wetlands is limited to those most directlyrelated to this mapping project. For more research andmanagement recommendations concerning the refuge, seeArmstrong et al. (2004), chapter 10.
• John Crow research The historic and repeatvegetational measurements conducted by John Crowshould be summarized and made available. The Crow sitelocations and associated data would be valuable additionsto this and other GIS projects.
• Substrate composition explains much about marshcommunity distribution and successional trajectories. Thesucculent low marsh and barnacle/mussel/rockweedcommunities, for example, seem to require coarser substratethan does sedge low marsh. It would be valuable to have acomprehensive “sediment-size” layer for this GIS project.Data should be keyed to GPS waypoints. Unlike vegetationmapping, sediment-size surveys would be most efficientduring plant senescence.
• Vegetation communities and fish The Auke BayLaboratories (NMFS) have a great deal of data on distribu-tion and phenology of marine and anadromous fish on theMendenhall Wetlands. These data should be integratedwith this GIS project, to examine correlations between fishdistribution and vegetational communities.
• Slough incision Study should be conducted on
1962 1979 2003 2025uplift meadow 26 35 234 432high marsh 219 465 941 1349low marsh 1353 1123 727 413
Table 3Change inacreage overtime
15
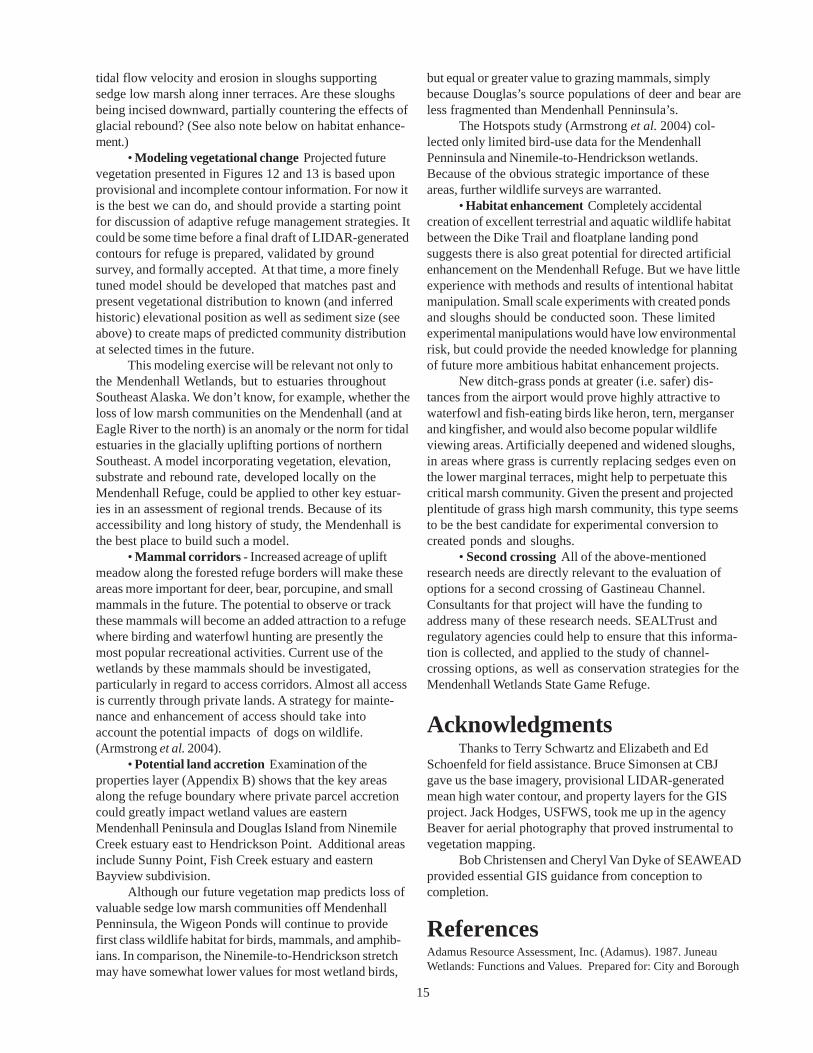
tidal flow velocity and erosion in sloughs supportingsedge low marsh along inner terraces. Are these sloughsbeing incised downward, partially countering the effects ofglacial rebound? (See also note below on habitat enhance-ment.)
• Modeling vegetational change Projected futurevegetation presented in Figures 12 and 13 is based uponprovisional and incomplete contour information. For now itis the best we can do, and should provide a starting pointfor discussion of adaptive refuge management strategies. Itcould be some time before a final draft of LIDAR-generatedcontours for refuge is prepared, validated by groundsurvey, and formally accepted. At that time, a more finelytuned model should be developed that matches past andpresent vegetational distribution to known (and inferredhistoric) elevational position as well as sediment size (seeabove) to create maps of predicted community distributionat selected times in the future.
This modeling exercise will be relevant not only tothe Mendenhall Wetlands, but to estuaries throughoutSoutheast Alaska. We don’t know, for example, whether theloss of low marsh communities on the Mendenhall (and atEagle River to the north) is an anomaly or the norm for tidalestuaries in the glacially uplifting portions of northernSoutheast. A model incorporating vegetation, elevation,substrate and rebound rate, developed locally on theMendenhall Refuge, could be applied to other key estuar-ies in an assessment of regional trends. Because of itsaccessibility and long history of study, the Mendenhall isthe best place to build such a model.
• Mammal corridors - Increased acreage of upliftmeadow along the forested refuge borders will make theseareas more important for deer, bear, porcupine, and smallmammals in the future. The potential to observe or trackthese mammals will become an added attraction to a refugewhere birding and waterfowl hunting are presently themost popular recreational activities. Current use of thewetlands by these mammals should be investigated,particularly in regard to access corridors. Almost all accessis currently through private lands. A strategy for mainte-nance and enhancement of access should take intoaccount the potential impacts of dogs on wildlife.(Armstrong et al. 2004).
• Potential land accretion Examination of theproperties layer (Appendix B) shows that the key areasalong the refuge boundary where private parcel accretioncould greatly impact wetland values are easternMendenhall Peninsula and Douglas Island from NinemileCreek estuary east to Hendrickson Point. Additional areasinclude Sunny Point, Fish Creek estuary and easternBayview subdivision.
Although our future vegetation map predicts loss ofvaluable sedge low marsh communities off MendenhallPenninsula, the Wigeon Ponds will continue to providefirst class wildlife habitat for birds, mammals, and amphib-ians. In comparison, the Ninemile-to-Hendrickson stretchmay have somewhat lower values for most wetland birds,
but equal or greater value to grazing mammals, simplybecause Douglas’s source populations of deer and bear areless fragmented than Mendenhall Penninsula’s.
The Hotspots study (Armstrong et al. 2004) col-lected only limited bird-use data for the MendenhallPenninsula and Ninemile-to-Hendrickson wetlands.Because of the obvious strategic importance of theseareas, further wildlife surveys are warranted.
• Habitat enhancement Completely accidentalcreation of excellent terrestrial and aquatic wildlife habitatbetween the Dike Trail and floatplane landing pondsuggests there is also great potential for directed artificialenhancement on the Mendenhall Refuge. But we have littleexperience with methods and results of intentional habitatmanipulation. Small scale experiments with created pondsand sloughs should be conducted soon. These limitedexperimental manipulations would have low environmentalrisk, but could provide the needed knowledge for planningof future more ambitious habitat enhancement projects.
New ditch-grass ponds at greater (i.e. safer) dis-tances from the airport would prove highly attractive towaterfowl and fish-eating birds like heron, tern, merganserand kingfisher, and would also become popular wildlifeviewing areas. Artificially deepened and widened sloughs,in areas where grass is currently replacing sedges even onthe lower marginal terraces, might help to perpetuate thiscritical marsh community. Given the present and projectedplentitude of grass high marsh community, this type seemsto be the best candidate for experimental conversion tocreated ponds and sloughs.
• Second crossing All of the above-mentionedresearch needs are directly relevant to the evaluation ofoptions for a second crossing of Gastineau Channel.Consultants for that project will have the funding toaddress many of these research needs. SEALTrust andregulatory agencies could help to ensure that this informa-tion is collected, and applied to the study of channel-crossing options, as well as conservation strategies for theMendenhall Wetlands State Game Refuge.
AcknowledgmentsThanks to Terry Schwartz and Elizabeth and Ed
Schoenfeld for field assistance. Bruce Simonsen at CBJgave us the base imagery, provisional LIDAR-generatedmean high water contour, and property layers for the GISproject. Jack Hodges, USFWS, took me up in the agencyBeaver for aerial photography that proved instrumental tovegetation mapping.
Bob Christensen and Cheryl Van Dyke of SEAWEADprovided essential GIS guidance from conception tocompletion.
ReferencesAdamus Resource Assessment, Inc. (Adamus). 1987. JuneauWetlands: Functions and Values. Prepared for: City and Borough

16
of Juneau, Alaska, Department of Community Development.216 pp + map appendix.
Alaska Department of Fish and Game (ADF&G). 1990.Mendenhall wetlands state game refuge management plan.
Alder House students, 2003. Tides, toads and topography; thenatural and human history of the Lemon Creek watershed.Discovery Southeast student publication, 24pp
Armstrong, R, and R. Gordon, 2002. Birds of MendenhallWetlands, checklist, Juneau Audubon Society.
Armstrong, R.H., R.L. Carstensen and M.F. Willson. 2004.Hotspots: bird survey of Mendenhall Wetlands, April 2002 toMay 2003. Juneau Audubon Society and Taku ConservationCouncil, 75pp.
Bishop, D., R. Armstrong, and R. Carstensen. 1987. Environ-mental analysis of lower Jordan Creek and nearby wetlands inregard to planned airport taxiway extension. 67 pp.
Cain, S. L., J. I. Hodges and E. Robinson-Wilson. 1988. Bird useof the Mendenhall Wetlands in Juneau, Alaska. U.S. Fish andWildlife Service.
Carstensen, R. 1995. Vegetation mapping on lower Duck Creek,and comments on proposed channel relocation. Prepared forR&M Engineering, Juneau, AK. 12 pp.
Carstensen, R. and R. Armstrong. 2002. Bird surveys of the floatpond woodland, lower Duck Creek, and lower Jordan Creekareas. Data sheets prepared for SWCA Environmental Consult-ants, December 2001 - August
Carstensen, R. 2003. Wildlife “out the road:” habitats ofJuneau’s premier natural area – 24- to 29-mile, Glacier Highway.Discovery Southeast report to the Southeast Alaska Land Trust.
Federal Aviation Administration, 2002. Wildlife Hazard Manage-ment Plan for Juneau International Airport, Juneau Alaska.
Hicks, S., and W. Shofnos. 1965. Determination of land emer-gence from sea level observations in Southeast Alaska. Journal ofGeophysical Research. 70(14): 3315-20.
Levings, C. and M. Pomeroy 1979. Marsh restoration project atthe Fraser River estuary. Salmonid enhancement program.Province of British Columbia. Fish and Wildlife Branch. AnnualReport 1978. p 13
O’Clair, R. M., R. H. Armstrong, and R. Carstensen. 1998. TheNature of Southeast Alaska, A Guide to Plants, Animals, andHabitats. Alaska Northwest Books. Anchorage, AK. 254pp.
Pojar, J., and A. MacKinnon. 1994. Plants of the PacificNorthwest Coast: Washington, Oregon, British Columbia, andAlaska. Lone Pine Publishing, Vancouver, British Columbia,Canada. 526pp.
Stone, C. S. 1993. Vegetation of Coastal Marshes near Juneau,Alasksa. Northwest Science 67(4):215-230.
Watson, S. 1979. Avian Habitats and Use of the MendenhallWetlands Wildlife Refuge. Prepared in partial fulfillment ofgraduate degree from Utah State University.
Wilmuth, W. R., R. Rossi and M. Linnell, 2001, Wildlife HazardAssessment for Juneau International Airport, Juneau, Alaska,USDA Wildlife Services.
Willson, M.F. and A. Baldwin, 2003. Invertebrate surveys on theMendenhall Wetlands. Report to the USFWS.
Appendix ACommon and scientific names for selectedplants of the tidal marsh.
Common names for plants used in text follow Pojar andMacKinnon. 1994
Vascular plantsalkali grass Puccinellia nutkaensisarrow-grass Triglochin maritimaditch-grass Ruppia maritimafoxtail barley Hordeum jubatumgoosetongue Plantago maritimahair grass Deschampsia caespitosaLyngbye sedge Carex lyngbyeirye grass Elymus arenariussea milkwort Glaux maritimaSitka spruce Picea sitchensis
Algaerockweed Fucus distichus“mat algae” Vaucheria sp

Property boundariesAppendix B
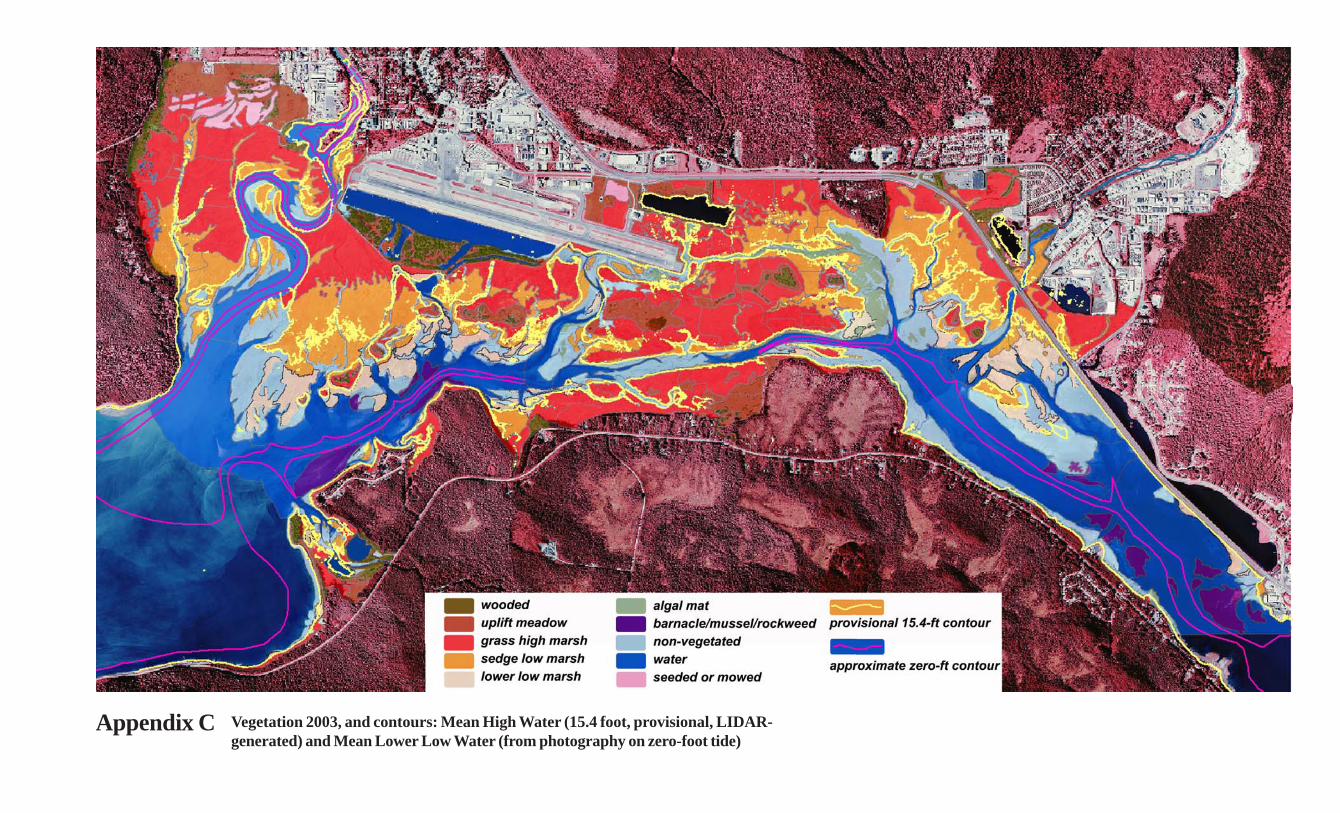
Vegetation 2003, and contours: Mean High Water (15.4 foot, provisional, LIDAR-generated) and Mean Lower Low Water (from photography on zero-foot tide)
Appendix C