gis in prevention, county profiles, series 4 6. risk factors: community risk factors –...
TRANSCRIPT

1 GIS in Prevention, County Profiles, Series 4
6. Risk Factors: Community Risk Factors – Availability of Drugs
Indiana Prevention Resource Center GIS in Prevention
County Profiles Series, No. 4
Montgomery County, Indiana
Barbara Seitz de Martinez, PhD, MLS, CPP, Project Director
The Indiana Prevention Resource Center at Indiana University is funded, in part, by a contract with the Indiana Family and Social Services Administration, Division of Mental Health and Addiction, financially supported through HHS/Substance Abuse Mental Health Services Administration, Center for Substance Abuse Prevention, Substance Abuse Prevention and Treatment Block Grant. The IPRC is operated by the Department of Applied Health Science and The School of Health, Physical Education and Recreation.
GIS in Prevention, County Profiles, Series 4
6. Risk Factors: Community Risk Factors – Availability of DrugsGIS in Prevention
County Profile Series, No. 4
Montgomery County, Indiana
Barbara Seitz de Martinez, PhD, MLS, CPPProject Director
Project Staff:
Indiana Prevention Resource Center
Opinions expressed herein are those of the authors, and not necessarily those of the Trustees of Indiana University or the Division of Mental Health and Addiction. Indiana University accepts full Responsibility for the content of this publication. ©2005 The Trustees of Indiana University. Permission is extended to reproduce this County Profile for non-profit educational purposes. All other rights reserved.
Ritika Bhawal, MPHRyan Chopra, MPHKyoungsun Heo, MPATuba M. Pervin Altay, MPH
GIS in Prevention, County Profiles, Series 4
6. Risk Factors: Community Risk Factors – Availability of Drugs
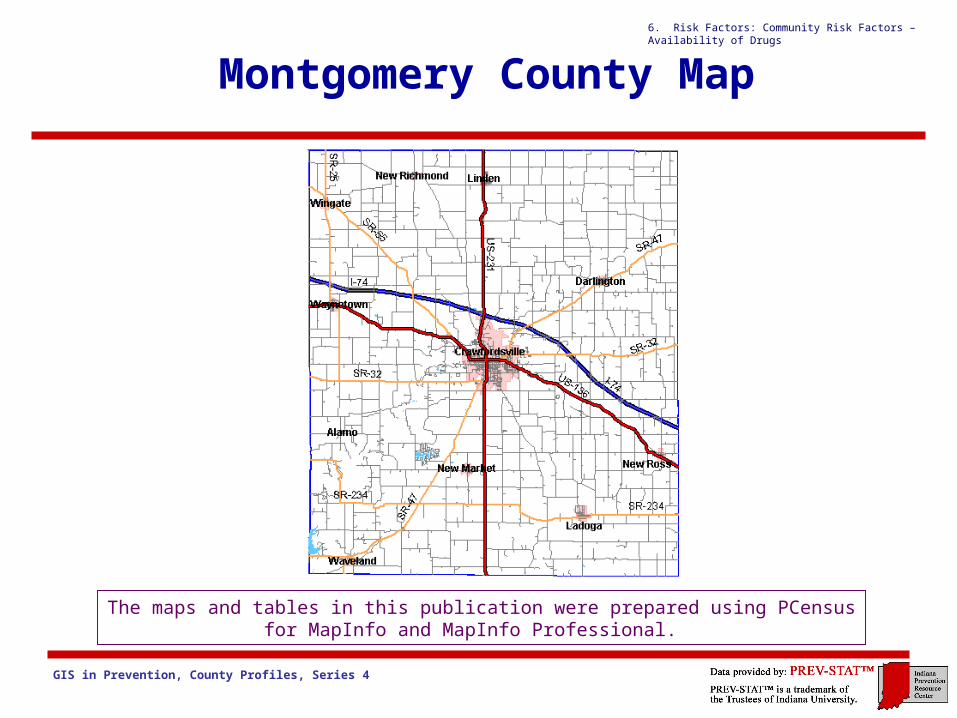
Montgomery County Map
The maps and tables in this publication were prepared using PCensusfor MapInfo and MapInfo Professional.
GIS in Prevention, County Profiles, Series 4
6. Risk Factors: Community Risk Factors – Availability of Drugs
6.0 – 6.5 Archival Risk Factors: Overview
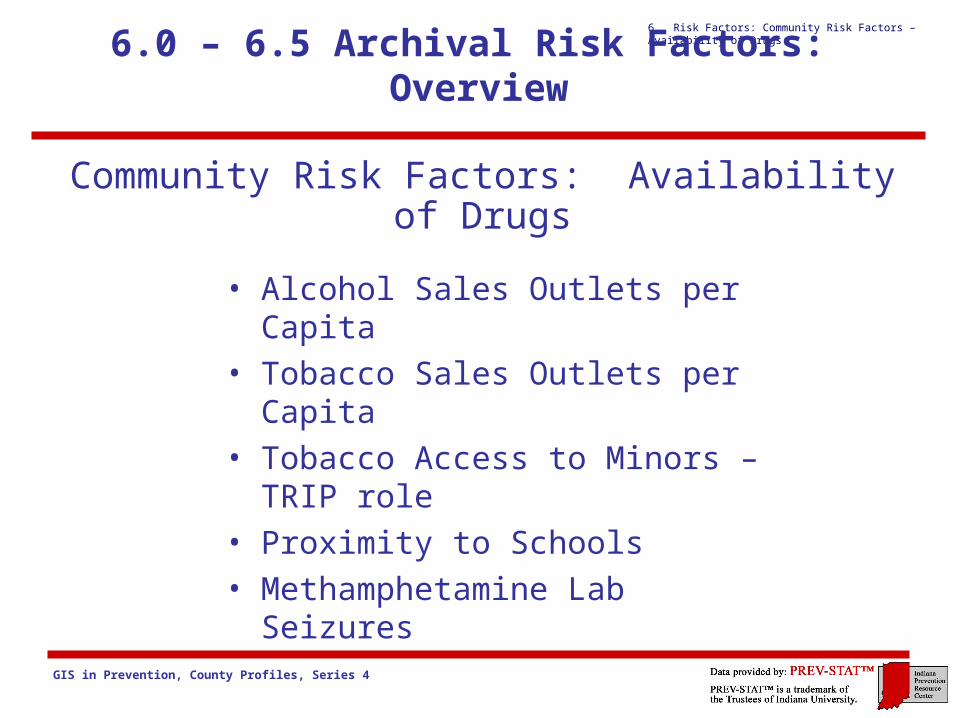
Community Risk Factors: Availability of Drugs
• Alcohol Sales Outlets per Capita
• Tobacco Sales Outlets per Capita
• Tobacco Access to Minors – TRIP role
• Proximity to Schools
• Methamphetamine Lab Seizures
GIS in Prevention, County Profiles, Series 4
6. Risk Factors: Community Risk Factors – Availability of Drugs
6.0 Introduction to Community Risk Factors
Section 6 explores variables found to be associated with elevated risk for alcohol, tobacco, and other drug problems. This analysis of risk factors is based on the Center for Substance Abuse Prevention (CSAP)’s list of archival indicators as described in “Building a Successful Prevention Program” published on the Western Center for the Application of Prevention Technology (CAPT) web site. CSAP outlines four major categories of risk indicators: community, family, school and individual/peer. A full listing of archival indicators can be found in the Appendix. The Indiana Prevention Resource Center (IPRC) is aggressively pursuing the collection of data for all the archival indicators and offers here additional indicators beyond those suggested by CSAP.
Children form their opinions of human nature and the world based on their experiences and observations. For children the family is the most important institutional influence upon their socialization. (Allison and Lerner 1993) The norms of the child’s domain are critical. Children growing up in a home where parents abuse drugs (Biederman, et al. 2001), in a school where non-drug use policies are not clearly communicated and firmly enforced (CSAP 2004:7), in a community where drug use is tolerated or encouraged (Hogan, et al 2004:43) are at higher risk of becoming involved in substance use. Parenting practices are key to reducing and preventing problem behaviors in youth. (Bigan and Cody 2004:131) An important part of the family and parenting picture is parent role modeling. Parents involved in community service, parents who vote, parents who participate in their child’s life -- do make a difference. Not only do they model what it means to be a parent and an adult, they also communicate norms of behavior through example. This modeling, together with parental monitoring of children’s behaviors and the establishment of high expectations, creates a powerful influence. (Perkins 2004:9) By confronting misperceptions about norms, the social norms approach to prevention strengthens cultures by correcting misunderstandings about the beliefs and values of its members. Several of CSAP’s six prevention strategies aim to change norms and/or to correct misperceptions about them.
This section discusses those CSAP archival indicators for which Indiana data is available and adds several additional related indicators. This report presents data for the following archival indicators:
Category: CommunityAvailability of DrugsCommunity Laws/NormsTransitions and MobilityExtreme Economic & Social Deprivation
Category: FamilyFamily Management ProblemsFamily ConflictFavorable Parental Attitudes and Involvement

GIS in Prevention, County Profiles, Series 4
6. Risk Factors: Community Risk Factors – Availability of Drugs
6.0 Introduction, cont. (Bibliography)
Allison, Kevin W., and Richard M. Lerner1993 “Integrating Research, Policy, and Programs for Adolescents and Their Families.”
In Early Adolescence: Perspectives on Research, Policy and Intervention. Richard M. Lerner, ed. Hillsdale, NJ: Lawrence Erlbaum Associates.
Biederman, J., Faraone, S.F., Monuteaux M. C., and Feighner, J.A.2001 “Patterns of Alcohol and Drug Use in Adolescents Can be Predicted by Parental
Substance Use Disorders,” Pediatrics 106, 792-797.
Bigan, Anthony, and Christine Cody2004 “Preventing Multiple Problem Behaviors in Adolescence.” In Reducing
Adolescent Risk: Towards and Integrated Approach. Daniel Romer, ed. Thousand Oaks, CA: Sage. Pp. 125-131
Center for Substance Abuse Prevention2004 Science-Based Prevention Programs and Principles 2003. Rockville, MD.
Hogan, Julie A., Kristen Reed Gabrielsen, Nora Luna, and Denise Grothaus.2003 Substance Abuse Prevention: The Intersection of Science and Practice.
Boston: Allyn and Bacon.
Perkins, H. Wesley2003 “The Emergence and Evolution of the Social Norms Approach to Substance Abuse
Prevention.” In The Social Norms Approach to Prevention School and College Age Substance Abuse. H. Wesley Perkins, ed. San Francisco: Jossey-Bass.
Western CAPT2003 Building a Successful Prevention Program Reno: Univ. of Nevada.

GIS in Prevention, County Profiles, Series 4
6. Risk Factors: Community Risk Factors – Availability of Drugs
6.1 Alcohol Sales Outlets per Capita
CSAP defines this indicator as the number of alcohol sales outlets in relation to the total population. The following table shows the number of outlets, the total population, the number of outlets per capita, and the approximate number of outlets per every 1,000 residents of this county, with comparisons to the state.
Table 6.1: Alcohol Sales Outlets Per Capita, 2005 (Population from AGS 2005, 2006; Number of Outlets from ATC, 2006)
Alcohol Sales Outlets Per Capita, (IN ATC, 2005)
Montgomery Co. Indiana
Total Population (2004 est.) 38,008 6,230,346
Number of Outlets (March 2005) 63 11,011
Outlets Per Capita 0.0017 0.0018
Outlets Per 1,000 Persons 1.66 1.77

GIS in Prevention, County Profiles, Series 4
6. Risk Factors: Community Risk Factors – Availability of Drugs
6.2 Tobacco Outlet Density
The Center for Substance Abuse Prevention (CSAP) defines this indicator as the number of tobacco sales outlets in relation to the total population. The following table shows the number of outlets in the county compared to the State. It also reveals the density of outlets per capita for the county by stating the number of outlets for every 1,000 residents and for every 1,000 youth in the county.
Table 6.2: Tobacco Sales Outlets, 2005 (ATC, 2006)
Tobacco Sales Outlet Density per 1,000, Sept. 2005, ATC 2006
Montgomery Indiana
Total No. of Tobacco Retail Outlets 2005 53 6,401
Total Population 37,958 6,270,352
Tobacco Outlets per 1,000 Persons 1.38 1.02
Population 10-17 4,549 726,218
Tobacco Outlets per 1,000 Youth 10-17 11.54 8.81

GIS in Prevention, County Profiles, Series 4
6. Risk Factors: Community Risk Factors – Availability of Drugs
6.2 Tobacco Outlet Density (Ranking 1-92)

GIS in Prevention, County Profiles, Series 4
6. Risk Factors: Community Risk Factors – Availability of Drugs
6.2 Tobacco Outlet Density (Ranking, A-Z)

GIS in Prevention, County Profiles, Series 4
6. Risk Factors: Community Risk Factors – Availability of Drugs
Map: Vulnerable Youth, 10-17
Equal Ranges
Indiana Prevention Resource Center
Source: AGS 2005 est., 2006
Indiana Prevention Resource Center
Source: AGS 2005 est., 2006

GIS in Prevention, County Profiles, Series 4
6. Risk Factors: Community Risk Factors – Availability of Drugs
Map: Vulnerable Youth, 10-17
Equal Ranges
Indiana Prevention Resource Center
Source: AGS 2005 est., 2006
Indiana Prevention Resource Center
Source: AGS 2005 est., 2006

GIS in Prevention, County Profiles, Series 4
6. Risk Factors: Community Risk Factors – Availability of Drugs
Map: Vulnerable Youth, 10-17
Equal Ranges
Indiana Prevention Resource Center Source: AGS 2005 est., 2006

GIS in Prevention, County Profiles, Series 4
6. Risk Factors: Community Risk Factors – Availability of Drugs
Map: Underage Youth, 18-20
Equal Ranges
Indiana Prevention Resource CenterIndiana Prevention Resource Center
Source: Claritas 2005 est., 2006

GIS in Prevention, County Profiles, Series 4
6. Risk Factors: Community Risk Factors – Availability of Drugs
Map: Failed TRIP Inspections
Indiana Prevention Resource Center
Source: IN State Excise Police, TRIP
GIS in Prevention, County Profiles, Series 4
6. Risk Factors: Community Risk Factors – Availability of Drugs
6.3 Availability of Drugs to Youth: Failed TRIP Inspections
The sale of tobacco to youth is a clear indicator of the availability of drugs to youth and of the attitude of at least some members of the community with regard to the seriousness of the issue. Therefore we have included some aspects of the TRIP data here and some aspects under “Community Norms.” The use of compliance checks has been found to be an effective environmental strategy. (Howard, et al. 2001) CASP names “ready access to tobacco” a factor that increases the likelihood of drug use by youth and “active enforcement of youth access laws using unannounced compliance checks” a prevention strategy shown to successfully reduce such sales. (CSAP 2004:8-9) Therefore, CSAP promotes increased levels of enforcement as part of a larger effort to reduce youth smoking. (CSAP 2004:8-9)
Thanks to the outstanding work of the Tobacco Retailer Inspection Program (TRIP), we have additional data concerning the availability of tobacco products to youth, such as the locations of outlets that sold to youth and the number of total inspections and of failed inspections in each county where inspections were held. Since the TRIP was established in 2000, the non-compliance rate has decreased each year. For more information on this program, please consult the IPRC’s November 2004’s newsletter, “Prevention Newsline.”
Center for Substance Abuse Prevention2003 Science-Based Prevention Programs and Principles 2003. Rockville, MD.
Howard, K. A., K.N. Ribisl, B. Howard-Pitney, G.J. Norman, L.A. Rohrback 2001 “What Factors Are Associated with Local Enforcement of Laws Banning Illegal Tobacco Sales to Minors?”
Preventive Medicine 33, 63-70.
Goetze, D.D. 2004. “Effectiveness of Compliance Programs.” Prevention Newsline 17, 1, 1-6.
GIS in Prevention, County Profiles, Series 4
6. Risk Factors: Community Risk Factors – Availability of Drugs
6.4 Proximity of Failed TRIP Inspections to Schools
Where drugs are available in areas heavily trafficked by children, the environmental risk is increased (CSAP 2003:8). In addition to the above statistics for TRIP, PREV-STAT has geocoded the locations of schools and of failed tobacco inspections to facilitate yet another level of analysis by showing, via maps, the proximity to schools of tobacco outlets that failed TRIP inspections. For the counties that did participate in the TRIP Program, this County Profiles series presents maps for the county with some close-ups. These maps are intended to give a very general picture of the situation in the county and to encourage people to pursue obtaining similar information at the neighborhood level. (The power of PREV-STAT is greatest for neighborhood analysis!)
It should be noted that whereas the scale of a map showing the entire county makes it difficult to see much detail, studies of neighborhoods offer great potential for representing the environmental risks and assets. The greatest power of PREV-STAT lies in its ability to give extensive data and insights for the very small geographic area. To have a customized study of your neighborhood, call the IPRC and ask for the PREV-STAT service.
Center for Substance Abuse Prevention2003 Science-Based Prevention Programs and Principles 2002. Rockville, MD.

GIS in Prevention, County Profiles, Series 4
6. Risk Factors: Community Risk Factors – Availability of DrugsSchools in Proximity to
Failed Trip Inspections – Close-up
Montgomery County -- Crawfordsville
Tobacco Outlets That Failed TRIP Inspections in 2005Children at School
GIS in Prevention, County Profiles, Series 4
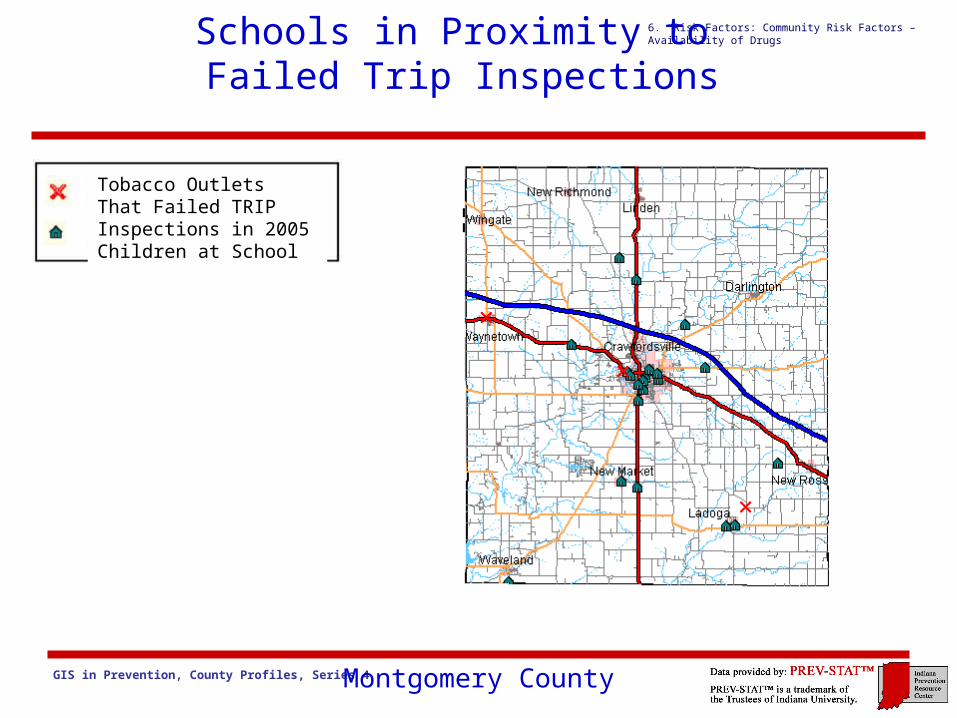
6. Risk Factors: Community Risk Factors – Availability of DrugsSchools in Proximity to
Failed Trip Inspections
Montgomery County
Tobacco Outlets That Failed TRIP Inspections in 2005Children at School

GIS in Prevention, County Profiles, Series 4
6. Risk Factors: Community Risk Factors – Availability of Drugs
6.5 Clandestine Meth Labs Seizures
The following table presents the number of methamphetamine laboratory seizures for each year as reported by the Indiana State Police (Sergeant Kastenschmidt, Indiana State Police, 2007).
Table 6.5: Clandestine Methamphetamine Lab Seizures, (ISP, 2007)
The discovery of clandestine methamphetamine labs attests to the presence of crystal methamphetamine in the area. Law enforcement officers in Indiana have found that the primary motivation of those individuals mounting methamphetamine labs in this state has been to support their personal addiction rather than to create a market for sales. Nonetheless, the presence of the labs creates the impetus for selling the drug and creates sources for obtaining the drug in the community.
Methamphetamine Laboratory Seizures, 1998-2005 (ISP, 2006)
County: Montgomery Indiana
1998 (Any Agency) 13 43
1999 (Any Agency) 11 129
2000 (Any Agency) 11 314
2001 (Any Agency) 6 542
2002 (Any Agency) 12 988
2003 (Any Agency) 14 1,278
2004 (Any Agency) 18 1,549
2005 (IPS) 18 989
2005 (Any Agency) 18 1,303
GIS in Prevention, County Profiles, Series 4
6. Risk Factors: Community Risk Factors – Availability of Drugs
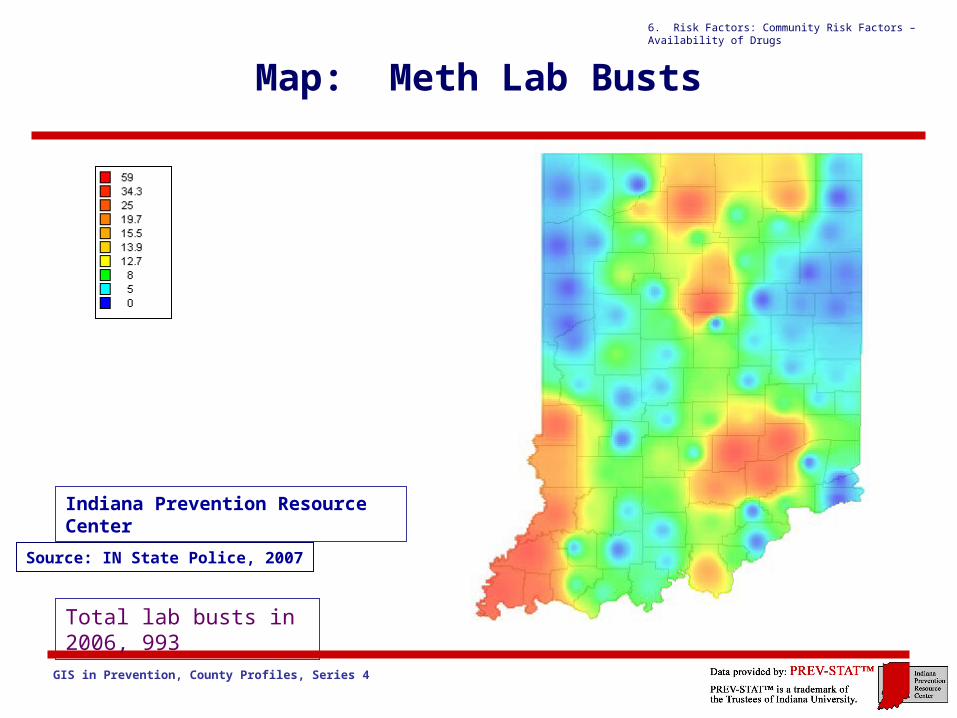
Map: Meth Lab Busts
Indiana Prevention Resource Center
Source: IN State Police, 2007
Total lab busts in 2006, 993
GIS in Prevention, County Profiles, Series 4
6. Risk Factors: Community Risk Factors – Availability of Drugs
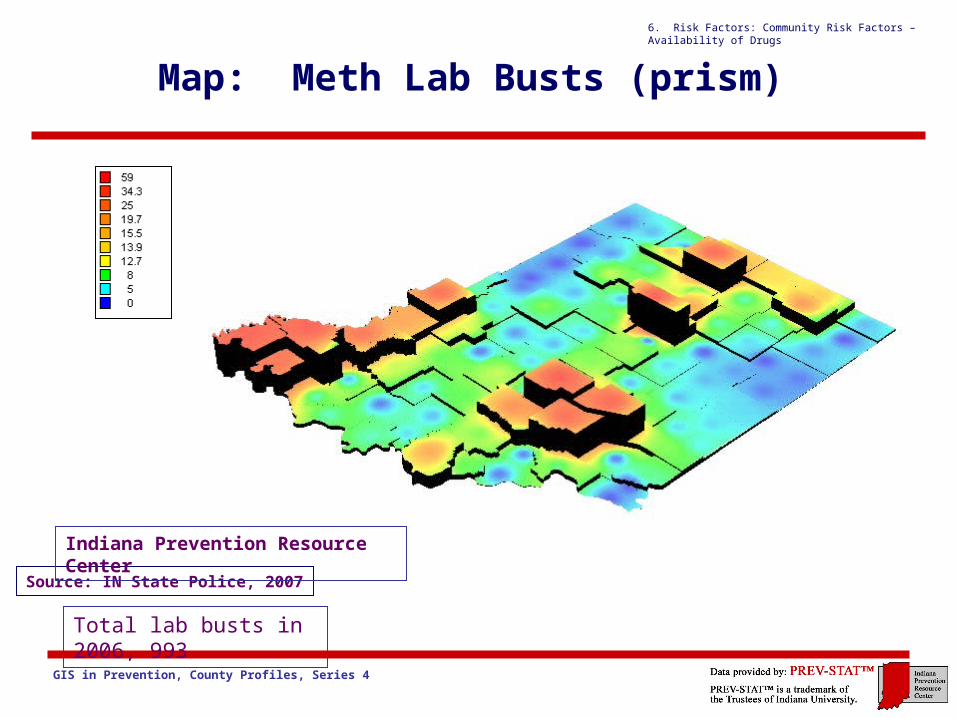
Map: Meth Lab Busts (prism)
Source: IN State Police, 2007
Total lab busts in 2006, 993
Indiana Prevention Resource Center