gis-based approach for optimized siting of municipal solid waste
TRANSCRIPT

Available online at www.sciencedirect.com
www.elsevier.com/locate/wasman
Waste Management 28 (2008) 2146–2160
Review
GIS-based approach for optimized siting of municipal solidwaste landfill
V.R. Sumathi a,*, Usha Natesan a, Chinmoy Sarkar b
a Centre for Environmental Studies, Department of Civil Engineering, Anna University, Chennai 600 025, Indiab Centre for Pollution Control and Energy Technology, Pondicherry University, Pondicherry 605 014, India
Accepted 25 September 2007Available online 3 December 2007
Abstract
The exponential rise in the urban population of the developing countries in the past few decades and the resulting accelerated urban-ization phenomenon has brought to the fore the necessity to develop environmentally sustainable and efficient waste management sys-tems. Sanitary landfill constitutes one of the primary methods of municipal solid waste disposal. Optimized siting decisions have gainedconsiderable importance in order to ensure minimum damage to the various environmental sub-components as well as reduce the stigmaassociated with the residents living in its vicinity, thereby enhancing the overall sustainability associated with the life cycle of a landfill.
This paper addresses the siting of a new landfill using a multi-criteria decision analysis (MCDA) and overlay analysis using a geo-graphic information system (GIS). The proposed system can accommodate new information on the landfill site selection by updatingits knowledge base. Several factors are considered in the siting process including geology, water supply resources, land use, sensitive sites,air quality and groundwater quality. Weightings were assigned to each criterion depending upon their relative importance and ratings inaccordance with the relative magnitude of impact. The results from testing the system using different sites show the effectiveness of thesystem in the selection process.� 2007 Elsevier Ltd. All rights reserved.
Contents
1. Introduction . . . . . . . . . . . . . . . . . . . . . . . . . . . . . . . . . . . . . . . . . . . . . . . . . . . . . . . . . . . . . . . . . . . . . . . . . . . . . . 21472. Landfill siting and the potential application of GIS . . . . . . . . . . . . . . . . . . . . . . . . . . . . . . . . . . . . . . . . . . . . . . . . . . 21473. Geographical extent and background information about the study. . . . . . . . . . . . . . . . . . . . . . . . . . . . . . . . . . . . . . . . 21494. Site selection criteria . . . . . . . . . . . . . . . . . . . . . . . . . . . . . . . . . . . . . . . . . . . . . . . . . . . . . . . . . . . . . . . . . . . . . . . . 2150
0956-0
doi:10.
* CoE-m
4.1. Thematic maps preparation and GIS analysis . . . . . . . . . . . . . . . . . . . . . . . . . . . . . . . . . . . . . . . . . . . . . . . . . 2150
4.1.1. Water bodies map . . . . . . . . . . . . . . . . . . . . . . . . . . . . . . . . . . . . . . . . . . . . . . . . . . . . . . . . . . . . . . . 21504.1.2. Road network map. . . . . . . . . . . . . . . . . . . . . . . . . . . . . . . . . . . . . . . . . . . . . . . . . . . . . . . . . . . . . . . 21514.1.3. Land use map . . . . . . . . . . . . . . . . . . . . . . . . . . . . . . . . . . . . . . . . . . . . . . . . . . . . . . . . . . . . . . . . . . 21514.1.4. Sensitive sites map . . . . . . . . . . . . . . . . . . . . . . . . . . . . . . . . . . . . . . . . . . . . . . . . . . . . . . . . . . . . . . . 21514.1.5. Infiltration map . . . . . . . . . . . . . . . . . . . . . . . . . . . . . . . . . . . . . . . . . . . . . . . . . . . . . . . . . . . . . . . . . 21524.1.6. Geology map . . . . . . . . . . . . . . . . . . . . . . . . . . . . . . . . . . . . . . . . . . . . . . . . . . . . . . . . . . . . . . . . . . . 21534.1.7. Elevation map . . . . . . . . . . . . . . . . . . . . . . . . . . . . . . . . . . . . . . . . . . . . . . . . . . . . . . . . . . . . . . . . . . 21534.1.8. Waste land map . . . . . . . . . . . . . . . . . . . . . . . . . . . . . . . . . . . . . . . . . . . . . . . . . . . . . . . . . . . . . . . . . 21534.1.9. Groundwater table map . . . . . . . . . . . . . . . . . . . . . . . . . . . . . . . . . . . . . . . . . . . . . . . . . . . . . . . . . . . 215353X/$ - see front matter � 2007 Elsevier Ltd. All rights reserved.
1016/j.wasman.2007.09.032
rresponding author. Tel.: +91 9442243232, +91 0413 2622105; fax: +91 0413 2243494.ail address: [email protected] (V.R. Sumathi).

V.R. Sumathi et al. / Waste Management 28 (2008) 2146–2160 2147
4.1.10. Groundwater quality map . . . . . . . . . . . . . . . . . . . . . . . . . . . . . . . . . . . . . . . . . . . . . . . . . . . . . . . . . 21534.1.11. Air quality index map . . . . . . . . . . . . . . . . . . . . . . . . . . . . . . . . . . . . . . . . . . . . . . . . . . . . . . . . . . . . 21554.1.12. Buffer maps . . . . . . . . . . . . . . . . . . . . . . . . . . . . . . . . . . . . . . . . . . . . . . . . . . . . . . . . . . . . . . . . . . . 2155
4.2. Importance ranking and rating for each criterion and the governing algorithm . . . . . . . . . . . . . . . . . . . . . . . . . . 21554.3. Identification of optimum site for landfill localization . . . . . . . . . . . . . . . . . . . . . . . . . . . . . . . . . . . . . . . . . . . 2156
5. Results and conclusion . . . . . . . . . . . . . . . . . . . . . . . . . . . . . . . . . . . . . . . . . . . . . . . . . . . . . . . . . . . . . . . . . . . . . . . 2158Acknowledgement . . . . . . . . . . . . . . . . . . . . . . . . . . . . . . . . . . . . . . . . . . . . . . . . . . . . . . . . . . . . . . . . . . . . . . . . . . 2159References . . . . . . . . . . . . . . . . . . . . . . . . . . . . . . . . . . . . . . . . . . . . . . . . . . . . . . . . . . . . . . . . . . . . . . . . . . . . . . . 2159
1. Introduction
In developing countries, the ever increasing human pop-ulation and the associated anthropogenic activities haveaccelerated the phenomenon of urbanization in the pastdecade. In India, the rate of increase of urban populationshot from 11% in 1901 to about 26% in 2001. The censusof 2001 indicates the fact that presently 25.73% of the totalpopulation resides in the urban centers, which has beenforecast to rise to 33% in the next 15 years. The rapidgrowth rates of the cities, combined with their huge popu-lation base, has left many Indian cities lacking in basicinfrastructure services like water supply, sanitation andsewerage, and solid waste management. With the risingpopulation and the associated unsustainable practices,there has been an enormous increase in the quantum aswell as the in diversity of the solid waste being generated.The problem of solid waste has assumed significant dimen-sion especially in the urban centers. Domestic, industrialand other wastes, whether these are of low or medium level,have become a perennial problem as they continue to causeenvironmental pollution and degradation. Poor wastemanagement systems coupled with hot climatic conditionsresults in increasing environmental problems with signifi-cant local as well as global dimensions. The need of thehour is to devise an efficient solid waste management sys-tem wherein decision-makers and waste management plan-ners can deal with the increase in complexity, uncertainty,multi-objectivity, and subjectivity associated with thisproblem.
In spite of the increasing stress towards the waste reduc-tion at the source, as well as recovery and recycling of thesolid waste, disposal of solid waste by landfilling remainthe most commonly employed method. Landfill incorpo-rates an engineered method of disposal of solid waste onland in a manner that minimizes environmental hazardsby spreading the solid waste in thin layers, compactingthe solid waste to the smallest practical volume and apply-ing a cover at the end of the operating day. However, withthe increased population density and urban infrastructure,several key considerations are required to be taken intoaccount to ensure its overall sustainability, especially thoseassociated with its economics, optimized siting and opera-tion. The development of a municipal solid waste landfillrequires the acquisition of large tracts of land and its suit-able siting in a pre-existing urban matrix comprised of
diverse competing land uses. Siting decisions are governedby the pre-existing land use dynamics of the urban area aswell as the nature of potential interactions of the landfillwith the pre-existing environmental, geologic, hydrologi-cal, and socio-economic parameters of the area. In thedomain of the science of solid waste management, identifi-cation of landfill sites for solid waste disposal remains acritical management issue wherein the selection should bebased on a number of considerations (Dipanjan et al.,1997; CPCB, 1999). Siting a sanitary landfill requires anextensive evaluation process in order to identify the bestavailable disposal location. This location must comply withthe requirements of governmental regulations and at thesame time must minimize economic, environmental, healthand social costs. The site selection procedure, however,should make maximum use of the available informationand ensure that the outcome of the process is acceptableby most stakeholders. Therefore, landfill siting generallyrequires processing of a variety of spatial data.
The present study focuses on an optimized land use siteselection based on multi-criteria decision analysis and geo-graphic information system based (GIS) overlay analysis.The most appropriate landfill site has been identified forPondicherry, a typical urbanizing city of India. Severalimportant factors and criteria were considered to arriveat the optimum siting decision including the pre-existingland use, location of sensitive sites, infiltration, waterbodies, water supply sources, groundwater quality, airquality, fault line and geology. Thematic maps of theselected criteria were developed within the paradigm ofstandard GIS software. Subsequently, weightings wereassigned to each criterion depending upon their relativeimportance, and ratings in accordance with the relativemagnitude of impact. A GIS-based overlay analysis wasperformed to identify the optimum site for the landfill,one which fulfilled all of the desired attributes.
2. Landfill siting and the potential application of GIS
The evaluation of a new waste disposal site is a compli-cated process as it requires considerable expertise in diversesocial and environmental fields, such as soil science, engi-neering, hydro-geology, topography, land use, sociology,and economics. Methods of evaluating new landfill sitestake into consideration parameters such as distance toroads, habitation, key infrastructure elements and the pro-

2148 V.R. Sumathi et al. / Waste Management 28 (2008) 2146–2160
pensity of soil to leach contaminants. Therefore, the sitingof a solid waste landfill must also involve processing of asignificant amount of spatial data, regulations and accep-tance criteria, as well as an efficient correlation betweenthem. Some of the promising methods for landfill site eval-uation have been discussed by Gebhardt and Jankowski(1987), Swallow et al. (1992), Chen and Kao (1997) andSasao (2004).
In recent years, GIS has emerged as a very importanttool for land use suitability analysis. GIS can recognize,correlate and analyze the spatial relationship betweenmapped phenomena, thereby enabling policy-makers tolink disparate sources of information, perform sophisti-cated analysis, visualize trends, project outcomes and strat-egize long-term planning goals (Malczewski, 2004). GIShas often been employed for the siting and placement offacilities (Church, 2002). The pioneering work in this fieldwas initiated by McHarg (1969) who enunciated the basicmapping ideas for site suitability analysis; especially thosethat involve delineating the best route connecting twopoints or identifying the best location for a specific func-tion. His idea involved the preparation of thematic mapsand superimposing them on top of one another to viewthe composite configuration so as to decide upon the mostsuitable location in relation to the pre-existing set of inter-acting factors. With the evolution of GIS and the subse-quent developments in the field of location science,considerable focus was placed upon its potential applica-tion for optimized siting. The earliest application of GISin this direction included the analysis conducted in the1970s, especially those by Kiefer and Robbins (1973), Dur-fee (1974), Voelker (1976) and Dobson (1979). At about thesame time, Clark (1970), Helms and Clark (1971) andEsmaili (1972) generated models to determine facility loca-tions, capacities and expansion patterns. Several realisticsolid waste management models were formulated by apply-ing and refining various optimization techniques. Fuertes(1974) included social equity issues in choosing the sitefor the facilities. The landfill selection problems have oftenbeen tackled using MCDA.
GIS has been found to play a significant role in thedomain of siting of waste disposal sites. The potentialadvantage of a GIS-based approach for siting arises fromthe fact that it not only reduces time and cost of site selec-tion, but also provides a digital data bank for long-termmonitoring of the site. GIS may also play a key role inmaintaining account data to facilitate collection operationand provide customer service, analyzing optimal locationsfor transfer stations, planning routes for vehicles transport-ing waste to transfer stations and from transfer stations tolandfills, as well as long-term monitoring of landfills. Otheradvantages of applying GIS in the landfill siting processmay include:
� Selection of objective zone exclusion process accordingto the set of provided screening criteria.� Zoning and buffering.
� Performing ‘what if’ data analysis and investigating dif-ferent potential scenarios related to population growthand area development, as well as checking the impor-tance of the various influencing factors etc.� Handling and correlating large amounts of complex
geographical data� Visualization of the results through graphical represen-
tation.
Some of the important applications of GIS for identify-ing potential waste disposal sites include the ones by Mutt-iah et al. (1996), Charnpratheep et al. (1997), Kao (1996),Kao et al. (1997), Lin and Kao (1998), Sarah and Susan(2000), Leao et al. (2001) and Sadek et al. (2001).
Along with the proliferation of GIS technology, eversince the 1950s, multiple criteria decision making methods(MCDM) have evolved as a major tool to assist decisionmakers with analyzing and solving multiple criteria deci-sion problems. MCDM methods have been developed toassist decision makers in either ranking a known set ofalternatives for a problem or making a choice among thisset while considering the conflicting criteria. Generally,the alternatives are compared against each other basedon how they perform relative to each criterion. Similarly,some methods require comparison of the criteria to arriveat the relative importance of each criterion. Thereafter,MCDM methods utilize this information to assign ranksto the alternatives. Some of the important methods ofMCDM have been summarized by Keeney and Raiffa(1976), Zeleny (1982), Yoon and Hwang (1995), Galet al. (1999) and Figueira et al. (2005). In recent years,the integration of MCDM techniques with GIS has consid-erably advanced the map overlay approaches to site suit-ability analysis (Carver, 1991; Banai, 1993; Eastman,1997; Malczewski, 1999). A GIS-based MCDA integratesand transforms spatial and aspatial data into a decision.It involves the utilization of geographical data, the decisionmaker’s preferences and the manipulation of data and pref-erences to arrive at uni-dimensional values of alternatives.
The siting of a new landfill in a given urban matrixrequires a multitude of considerations. Consequently, itmay be considered as a rather complex multi-criteria deci-sion making process involving numerous stakeholders andpublic interest groups. Hipel (1982) proposed an earlierversion of multi-criteria modeling incorporating fuzzy settheory to solve solid waste disposal problems in Canada.MCDA have primarily been employed to solve site selec-tion problems in solid waste management (Vuk et al.,1991; Pereira and Duckstein, 1993; Hokkanen and Salmi-nen, 1994, 1997). Kontos et al. (2005) described a method-ology which comprises several methods from differentscientific fields such as multiple criteria analysis, geo-graphic information systems, spatial analysis and spatialstatistics to evaluate the suitability of the study region inorder to optimally site a landfill. Padmaja et al. (2006) iden-tified a solid waste disposal site in Hyderabad city using ananalytical hierarchy process and GIS.

V.R. Sumathi et al. / Waste Management 28 (2008) 2146–2160 2149
An integrated approach incorporating the application ofGIS and MCDA methods have been employed for the suit-ability analysis of landfills in an urban matrix (Minor andJacobs, 1994; Kao and Lin, 1996; Siddiqui et al., 1996; Linand Kao, 1998; Allen et al., 2002; Kontos et al., 2005).
3. Geographical extent and background information about
the study
The Union Territory of Pondicherry comprises of fourinterspersed geographical entities namely Pondicherry,Karaikal, Mahe and Yanam, having a total area of492 km2, located in southern India. The study area is thedistrict of Pondicherry which is the first largest amongthe four regions. It has an area of 293 km2 located betweenlatitudes 11� 46 0 N and 12� 03 0 N and longitudes 79� 36 0
and 79� 53 0 E. It is located along the Coramandal coastof India, being limited on its east by the Bay of Bengaland on the other three sides by the Cuddalore district ofTamil Nadu State (Fig. 1). As per the census of India,2001, the total population of the Pondicherry is 735,004and it is rising at an annual rate of 2% (PPCC, 2005). Itis one of the fast growing urbanizing regions of southernIndia with increasing investments being made for theindustrial and tourism sector. The urban population standsat 505,715 which is 68.8% of the total population.
The built-up area of Pondicherry has shown a consider-able growth in the past decade. The core urban area consti-tuting the city occupies an area of 25.5 km2. Settlementscomprising of housing, towns, villages currently occupy5.37%, while with plantations it occupies 21.30% of thetotal geographical area. The areas occupied by industrieshave also shown an increasing trend rising from 0.22 km2
Fig. 1. Study
in 1990 to 0.34 km2 in 1998 and 0.70 km2 in the year2002. The region has shown all the potential attributes todevelop in to a major urban centre in the next few years.
A closer look at the scenario of municipal solid wastegeneration indicates that major generation sources inPondicherry are households, markets, bus stands, hotels,restaurants, marriage halls, Government offices, parks, cat-tle and hospitals. The total quantity of waste generated inPondicherry averages 300 tons/day. Average per capitasolid waste generation in Pondicherry town is approxi-mately 450 g/day. A qualitative analysis indicates that thesolid waste generated in Pondicherry contains a fairly highpercentage of organic matter, as high as 70–80% dryweight, and has a low calorific value ranges between 1900and 2600 kJ/kg. Currently, the management of solid wasteis being looked after by Local Administration Departmentthrough municipalities. However, any organized method ofwaste disposal is yet to be practiced; solid waste is disposedof by open dumping. The present system of primary collec-tion of garbage is through bins; about 500 dust bins arekept in residential areas for the collection of wastes. How-ever, no systematically organized method of waste disposalis being practiced in the district.
In recent years, there has been consensus amongst thedecision makers and town planners towards the evolutionof mechanisms to reorganize the primary and secondarywaste collection system at Pondicherry, as well as to theestablishment of a centralized landfill at an appropriatelocation to cater to the needs of the entire district. Thepresent study has been an effort towards this direction, pri-marily focusing towards the selection of an optimized landuse site for the municipal solid waste landfill. Multi-criteriadecision analysis has been employed to identify the key
area map.

Table 1Classification of air quality index
Air quality index Description of ambient air quality
<10 Very clean10–25 Clean25–50 Fairly clean50–75 Moderately polluted75–100 Polluted100–125 Heavily polluted>125 Severely polluted
2150 V.R. Sumathi et al. / Waste Management 28 (2008) 2146–2160
governing factors affecting landfill siting and subsequentlyoperating within the paradigm of GIS, an optimized sitewas identified through an overlay analysis of the map lay-ers characterizing the thematic factors.
4. Site selection criteria
Siting a sanitary landfill requires an extensive evaluationprocess in order to identify the optimum available disposallocation. This location must comply with the requirementsof the existing governmental regulations and at the sametime must minimize economic, environmental, health, andsocial costs (Siddiqui et al., 1996). In assessing a site as apossible location for solid waste landfilling, many factorscould be considered (Savage et al., 1998; UNEP, 1994).These factors may be presented in many ways; however,the most useful way is the one that may be easily under-stood by the community (Tchobanoglous et al., 1993).
In the present study, the guidelines of Central PollutionControl Board, India (CPCB, 2003) and that of CentralPublic Health and Environmental Engineering Organiza-tion (CPHEEO, 2000) were considered for landfill site iden-tification. The selection of disposal sites was carried outthrough a multi-level screening process. Subsequently, aGIS-based constraint mapping was employed to eliminatethe environmentally unsuitable sites and to narrow downthe number of sites for further consideration. The list offactors considered for selecting the disposal sites (Sumathi,2006) are as indicated
� lake and ponds,� rivers,� water supply sources,� groundwater table,� groundwater quality,� infiltration,� air quality index,� geology,� fault line,� elevation,� land use,� habitation,� highways,� sensitive sites.
4.1. Thematic maps preparation and GIS analysis
The primary data sources for the study included thetoposheets of Pondicherry viz., 58 M/13, 58 M/9, 57 P/16and 57 P/12 of the scale 1:50,000, which were used to pre-pare the base map for the study. Water bodies, road net-work and elevation maps were prepared based on theSurvey of India map by digitization. Geology, soil, faultline, water supply sources, and groundwater maps werecollected from departments and subsequently digitized.The land use map was generated through the image inter-
pretation and classification of the Indian Remote Sensingsatellite IRS1D imagery of Pondicherry of 22.8 m resolu-tion. Subsequently, the thematic maps of habitation, sensi-tive sites and waste lands were derived from land use mapusing standard procedures. Secondary data was collectedby ground truth and surveys conducted at the concernedsites. The digitization and analysis of the thematic mapswere performed within the framework of the well knowndesktop GIS software; Arc GIS Desktop 9.0 available atthe Department of Civil Engineering, Anna University.Digital thematic maps were generated by employing thefollowing procedures:
� Scanning of the available primary paper maps.� Geo referencing the scanned maps to earth coordinates.� On screen digitizing of the primary maps, thereby gener-
ating the digital thematic maps, each characterizing theinfluencing factor for landfill site selection.� Locating the GPS coordinates and entering in the data-
base as latitude and longitude.� Conversion of the latitude and longitude data into the
point data using the software.� Addition of the attribute data to the locations.
The air quality index map was generated from the airquality data collected by the Department of Science, Tech-nology and Environment, Pondicherry. Thereafter, the airquality index (AQI) was computed and classified basedon the model prepared by Tiwari and Manzoor (1987).The geometric mean of ‘n’ no. of parameters was takenas air quality index and then AQI was categorized into dif-ferent classes as shown in Table 1.
AQI ¼ ðObs=StdÞSO2� ðObs=StdÞNO2
� ðObs=StdÞSPM
h i1=3
� 100
Buffer maps indicating regions encompassing appropriateareas from lakes, ponds, rivers, water supply sources, hab-itation, highways and fault line were also generated to actas ‘areas of constraints’, i.e., where a landfill can not besited.
4.1.1. Water bodies map
A water bodies map (Fig. 2) indicating the ponds, lakesand rivers located in the Pondicherry region was prepared

Fig. 2. Water bodies map.
V.R. Sumathi et al. / Waste Management 28 (2008) 2146–2160 2151
through digitization of the Survey of India map. There aretwo major lakes, viz. Bahour and Ousteri, which are usedfor agriculture. The region is also drained by two rivers,namely Sankaraparani and Pennaiyar, which along withtheir tributaries drain into the Bay of Bengal.
4.1.2. Road network map
The road network map (Fig. 3) delineating the nationalhighways and other major roads in the Pondicherry regionwas prepared. There are three NH 45 A and one NH 66highways in the Pondicherry region.
4.1.3. Land use map
The land use map (Fig. 4) displays the land utilized bythe human and the natural cover in the Pondicherry region.
Fig. 3. Road ne
It is the basic map of the study and helps in generatingmany thematic maps required for overlay analysis. It wasdeveloped by image interpretation and classification ofthe IRS satellite imagery. The land use map indicates theareas of settlements, double crop land, single crop land,waste land, water bodies and rivers. The majority of theregions occupied by double crops include cultivation ofpaddy and groundnut while single crops include mainlysugar cane and tapioca. Waste lands are scattered moretowards the northern part of the region. The majority ofthe settlement areas occur along the coast.
4.1.4. Sensitive sites map
A sensitive sites map (Fig. 5) was developed by the dig-itization of the major cultural, archaeological and histori-
twork map.

Fig. 4. Land use map.
Fig. 5. Sensitive sites map.
2152 V.R. Sumathi et al. / Waste Management 28 (2008) 2146–2160
cal sites; these sites are restricted from the development oflandfill. About 280 years of French rule had left a uniqueurban form within Boulevard town; the invaluable heritageneeds to be conserved in its special ambience and thereforethe Boulevard area has been identified as a heritage zone.The Archaeological Survey of India has identified the fol-lowing four temples in the Pondicherry region as nationalmonuments:
� Sri Moolanathar Swami Temple at Bahour,� Sri Panchadeeshwara Swami Temple at Thiruvan-
darkoil,� Sri Varadharaja Perumal Temple at Thirubhuvanai and� Sri Thirukandeshwara Temple at Nallur.
Arikkamedu, an historical place and an ancient exca-vated site, is situated on the southern bank of the river Ari-
yankuppam and has also been included as a sensitive site.The site was a port during the Chola and Pallava periodand trade flourished during that time with Greeks andRomans.
4.1.5. Infiltration map
An infiltration map (Fig. 6) was also developed by tak-ing into account the key soil types and their properties.The infiltration rate plays an important role in determin-ing potential risk of contamination of the groundwaterand hence is a key criterion for the development of alandfill at a particular site. Depending on the infiltrationrate, the region has been divided into high/medium/lowzones. The coastal area has been shown to possess a highinfiltration rate. The central and southern part of theregion has thick clayey soils with predominantly low infil-tration rate.
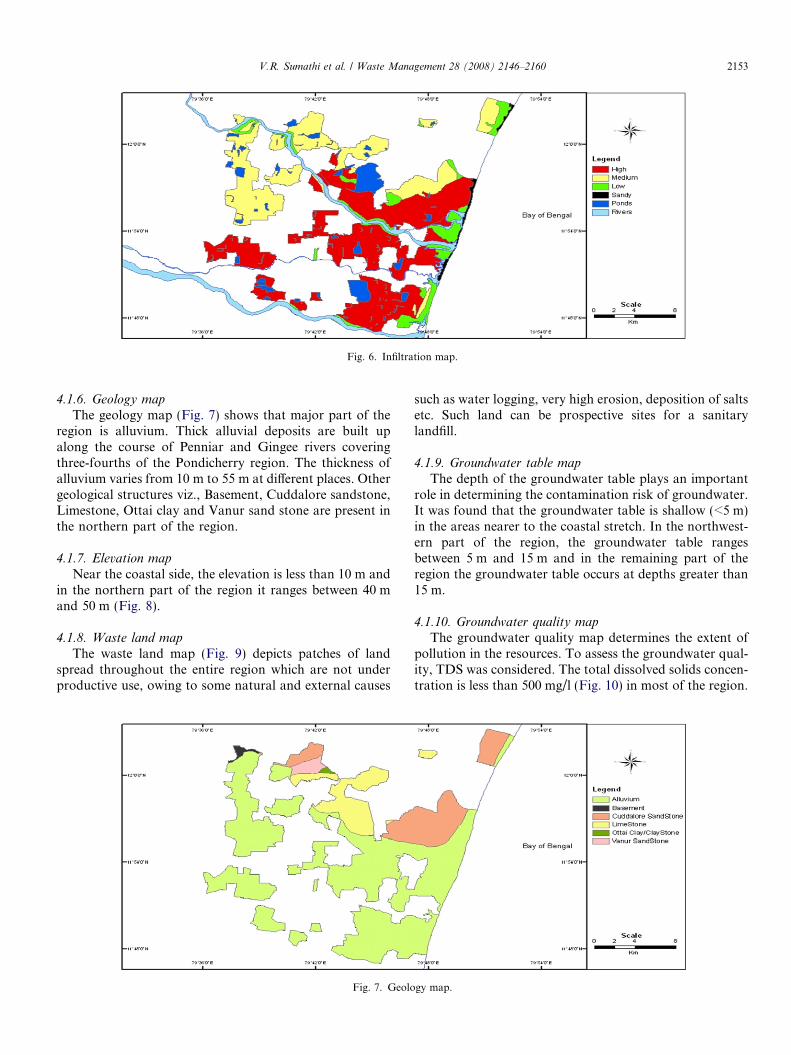
Fig. 6. Infiltration map.
V.R. Sumathi et al. / Waste Management 28 (2008) 2146–2160 2153
4.1.6. Geology map
The geology map (Fig. 7) shows that major part of theregion is alluvium. Thick alluvial deposits are built upalong the course of Penniar and Gingee rivers coveringthree-fourths of the Pondicherry region. The thickness ofalluvium varies from 10 m to 55 m at different places. Othergeological structures viz., Basement, Cuddalore sandstone,Limestone, Ottai clay and Vanur sand stone are present inthe northern part of the region.
4.1.7. Elevation map
Near the coastal side, the elevation is less than 10 m andin the northern part of the region it ranges between 40 mand 50 m (Fig. 8).
4.1.8. Waste land map
The waste land map (Fig. 9) depicts patches of landspread throughout the entire region which are not underproductive use, owing to some natural and external causes
Fig. 7. Geolo
such as water logging, very high erosion, deposition of saltsetc. Such land can be prospective sites for a sanitarylandfill.
4.1.9. Groundwater table map
The depth of the groundwater table plays an importantrole in determining the contamination risk of groundwater.It was found that the groundwater table is shallow (<5 m)in the areas nearer to the coastal stretch. In the northwest-ern part of the region, the groundwater table rangesbetween 5 m and 15 m and in the remaining part of theregion the groundwater table occurs at depths greater than15 m.
4.1.10. Groundwater quality mapThe groundwater quality map determines the extent of
pollution in the resources. To assess the groundwater qual-ity, TDS was considered. The total dissolved solids concen-tration is less than 500 mg/l (Fig. 10) in most of the region.
gy map.

Fig. 8. Elevation map.
Fig. 9. Waste land map.
Fig. 10. Groundwater quality map.
2154 V.R. Sumathi et al. / Waste Management 28 (2008) 2146–2160

V.R. Sumathi et al. / Waste Management 28 (2008) 2146–2160 2155
In the southern part of the region nearer to the coast, totaldissolved solids are above 2500 mg/l.
4.1.11. Air quality index map
Assessment of air quality reveals that in the major por-tion of the study area, SO2 concentration is less than 50 lg/m3 and in very few patches the concentration is between 50and 80 lg/m3. NOx concentration in the Pondicherryregion is less than 50 lg/m3. Except for a small area inthe northern part, where SPM concentration >200 lg/m3,the majority of the study area has an SPM concentrationin the range between 100 and 200 lg/m3. A composite airquality index map was developed (Fig. 11) and it showsthat the Boulevard area is comprised of polluted, moder-ately polluted, heavily polluted and severely polluted areas.
4.1.12. Buffer maps
Maps with buffer zones for ponds, rivers, roads, habita-tion, water supply sources and fault lines exhibit the permis-sible distance beyond which the landfill can be sited forvarious criteria using the buffer option in ArcGIS, i.e., theareas within the buffer are unsuitable for landfill develop-ment for solid waste disposal. They were generated on thebasis of pre-existing published landfill criteria, existing stan-dards and regulatory requirements, as well as the prevailinglocal conditions. For example, to generate the buffer for riv-ers, the three rivers in the study area viz., Penniar, Chun-nambar and Ariankuppam, were considered and a bufferdistance of 100 m was applied around each of them. Simi-larly, buffer zones for ponds, rivers, roads, habitation, watersupply source and fault lines were created at a distance of200 m, 100 m, 200 m, 500 m, 500 m and 500 m, respectively.
4.2. Importance ranking and rating for each criterion and the
governing algorithm
After the preparation of thematic maps characterizingthe influencing factors and the preparation of the GIS
Fig. 11. Air quali
database for landfill siting, the next step involved the iden-tification, importance ranking of each of the influencingfactors, and the preparation of a relative rating schemefor each influencing factor based on the relative magnitudeof impact. In the present study, the technique of Delphiwas employed for identifying the key governing criteriafor landfill site selection. A set of questionnaires was pre-pared and sent to the policy makers of key governmentdepartments of Pondicherry.
Based upon the inputs of the key policy makers of thedifferent sections of the local government, guidelines ofCentral Pollution Control Board, India (CPCB, 2003)and that of the Central Public Health and EnvironmentalEngineering Organization (CPHEEO, 2000), as well asthe review of the scientific literature on previous work con-ducted, four categories of criteria were identified, namely,the land use criteria, hydro-geologic criteria, air quality cri-teria and the constraint parameterization. Each categorywas further divided into sub-categories. A sequential hier-archy of the multi-criteria problem was developed; analytichierarchy process was employed wherein a consistentweight set was extracted through the pair-wise comparisonby decision makers in their consideration of each factoragainst one another. Feedback from a team with expertisein multi-disciplinary fields of local environmental manage-ment of the Pondicherry was sought in the process. Associ-ated with each thematic map (TM) characterizing a givencriteria, once the importance weighting (Wc) of the criteria,as well as the ratings (Rc), were associated with each crite-rion depending on their relative magnitude, a sub-indexscore (Isub) for that particular criteria was evaluated. Thesame process was followed for each of the sets of sub-cat-egories of criteria. A weighted sum aggregation functionwas employed to arrive at a Composite Suitability Index(CSI).
CSI ¼Xn
c¼1
ðI subÞTM ¼Xn
c¼1
ðW c � RcÞTM
ty index map.

Land use criterion
Hydro-geologic criterion
Air quality criterion
Constraint parameterization • Identification of key features indicating constraints and
generation of thematic buffer maps• GIS overlay of buffer maps to identify areas of constraints
Proximity to water body
Proximity to road network
Proximity to agricultural land
Proximity to settlement
Proximity to wasteland
Proximity to sensitive sites
Evaluate important weighting (WW), ratings (RW) at distances of 0-200m, 200-400m, 400-600m, 600-800m, and 800-1000m
Evaluate important weighting (WR), ratings (RR) at distances of 0-200m, 200-300m, 300-400m, 400-500m, and 500-1000m
Evaluate important weighting (WAg), ratings (RAg) at distances of 0-200m, 200-300m, 300-400m, 400-500m, and 500-1000m
Evaluate important weighting (Wsettl), ratings (Rsettl) at distances of 0-200m, 200-300m, 300-400m, 400-500m, and 500-1000m
Evaluate important weighting (Wwaste), ratings (Rwaste) at distances of 0-200m, 200-300m, 300-400m, 400-500m, and 500-1000m
Evaluate important weighting (Wsen), ratings (Rsen) at distances of 0-100m, 100-200m, 200-300m, 300-400m, and 400-500m
Index score for Land use criteria (ILU) = (Isub)W+(Isub)R+(Isub)Ag+(Isub)settl+(Isub)waste+(Isub)sen
Proximity to water table
Degree of elevation
Nature of geologic strata
Degree of infiltration
Nature of groundwater quality
Evaluate important weighting (WWT), ratings (RWT) at distances of 0-5m, 5-15m, and >15m
Evaluate important weighting (Wel), ratings (Rel) at 0-10m, 10-20m, 20-30m, 30-40m, and 40-50m
Evaluate important weighting (Wgeo), ratings (Rgeo) according to the nature of the geologic strata
Evaluate important weighting (Winfil), ratings (Rinfil) according to the infiltration levels – very high, high, medium, low
Evaluate important weighting (WGW), ratings (RGW) according to the TDS levels – <500, 500-1000, 1000-1500, 1500-2000, 2000-2500, >2500 mg/l
Index score for Hydro-geologic criteria (IHG) = (Isub)WT+(Isub)el+(Isub)geo+(Isub)infil+(Isub)GW
Air quality index - Evaluate the AQI score
OPTIMIZED
LANDFILL
SITING
Fig. 12. The hierarchy of the multi-criteria approach employed to evaluate the composite suitability index for optimized landfill siting.
2156 V.R. Sumathi et al. / Waste Management 28 (2008) 2146–2160
The process of employing weights and ratings to each set ofcriteria has been indicated in Fig. 12.
The Analytic Hierarchy Process (AHP) developed bySaaty (1980) has been employed to derive the relativeimportance weighting of each criterion. Pairwise compari-sons were conducted among the criteria to determine therelative importance of each criterion among others. A com-parison matrix among the criteria was developed, whichwas subsequently used to compute an eigen vector, whichultimately represented the ranking of the criteria. For thecalculation of ratings associated with each criterion, a pairwise comparison of alternatives on the basis of each crite-rion was conducted. An intensity of importance was asso-ciated for all possible alternatives and a comparisonmatrix arrived at by repeating the process for each crite-rion. Using the comparison matrix among the alternativesand the information on the ranking of the criteria, AHPgenerated an overall ranking of the solutions. The alterna-tive with the highest eigenvector value was considered to bethe first choice.
4.3. Identification of optimum site for landfill localization
The overall algorithms employed for the optimized sit-ing of a landfill site has been indicated in Fig. 13. Firstly,key sets of criteria which govern the siting of a landfillare identified. They have been broadly categorized intoland use criteria, hydro-geologic criteria and air quality cri-
teria. Another important factor is the constraint parame-terization indicating the areas of constraint in the givenland use configuration where a landfill cannot be devel-oped. This is based on a set of buffer zones constitutedon the basis of some key influencing factors. The bufferswere set in ArcGIS based upon the existing scientificknowledge of the cause-impact relationship of a specificinfluencing factor upon a receptor. The next step involvesthe development of a GIS database for the above men-tioned governing criteria. Separate thematic maps charac-terizing each sub-criteria are developed and the attributedata associated. In the study, the land use map constitutesthe base map. In the next step, all of the buffer maps areoverlaid on the base map and the regions of constraintwhere a landfill cannot be constructed are identified. Sub-sequently, each of the thematic maps characterizing a gov-erning criterion is overlaid on the base map. For each pixeli, j of the base map, the cumulative suitability index (CSI)for landfill siting is evaluated through the aggregation ofthe sub-index values calculated from each of the overlaidthematic maps characterizing a governing criterion. Themulti-criteria analysis was performed using the SpatialModeler of ArcGIS. Thereafter, the algorithm performs aGIS-based constraint mapping technique to eliminate thepotentially unsuitable sites. The algorithm thus ends witha final map indicating the best suitable sites for the devel-opment of a municipal solid waste landfill, based on a setof identified key criteria.

Identify the set of key criteria for landfill siting
Hydro-geologic criteria Level of infiltration Geologic strata Degree of slope and elevation Depth of the groundwater table Nature of groundwater quality (TDS conc.)
Air quality criteria Nature of ambient air quality
Land use criteria: Distance to a surface water body (ponds, rivers)Distance to a road network Distance to agricultural land Distance to settlement Distance to wasteland Distance to sensitive sites
Constraints Parameterization
200 m buffer for ponds 100 m buffer for rivers 200 m buffer for major highways 500 m buffer for areas of habitation 500 m buffer for water supply sources 500 m buffer for major fault lines
Start
GIS analysis through overlaying of the various
thematic layers characterizing a set of
identified criteria
For each thematic map (TM) characterizing an identified criterion ‘c’: Associate Importance Weighting based on the significance of the criterion (Wc)Decide upon the Rating Score based on the range of magnitude of the parameter value (Rc)Aggregate the sub-index score by simple additive weighing
ISub = (Wc. Rc)TM
Have the ImportanceWeighting and RatingScore been decided upon for all of the thematic criteria?
For each pixel (i, j) of the base map, calculate the sub-index scores associated with each thematic criteria and thereby evaluate the Composite Suitability Index of that pixel CSU = ∑ ((Wc. Rc)TM
Evaluate the Composite Suitability Index scores for all of the pixels in the base map
GIS-based constraint mapping approach to eliminate the environmentally unsuitable sites Stop
Yes
No
GIS-based multi-criteria analysis for optimized landfill site selection
Identification of optimized site for
land use siting
Primary data sources ToposheetsAvailable paper maps
Primary data sources IRS 1D satellite image
ScanningGeo-referencing to earth coordinates
system
On-screen digitization & generation of thematic maps characterizing the identified
criteria
Image interpretation, classification and generation
of the primary land use map
Secondary data sources Ground truth studies Locating coordinates
Development of GIS database for municipal landfill sitingcomprising of following layers:
Land use layer (base map) Road network map layer Water bodies map layer Sensitive sites map layer Waste land map layer Infiltration map layer Geologic map layer Elevation map layer Groundwater table map layer Groundwater quality map layer Air quality index layer Set of layers indicating the various constraints (Buffer layer)
Development of a GIS database for optimized landfill siting
Overlay the generated buffer maps to identify the sites where the constraints parameterization may be employed – sites where the siting of landfill is ‘not permissible’
Fig. 13. Algorithm for the identification of the optimized landfill site in an urban location.
V.R. Sumathi et al. / Waste Management 28 (2008) 2146–2160 2157

Fig. 14. Optimum sites for solid waste disposal.
Table 2Identified sites for landfill
Siteno.
Rank Description of the site Areain km2
1 1 Waste land, large area and soil suitability 0.362 2 Area located in the path of HT power lines 0.193 3 Land located in the dip zone of main water
source of Pondicherry0.14
4 4 Land situated around the new habitationarea
0.12
5 5 Waste land and soil suitability 0.116 6 Site not recommended by the geologists due
to sandy soil0.09
7 7 Land situated around the new school zone 0.088 8 Land located in the dip zone of main water
source of Pondicherry0.08
9 9 Located 10 km or more away from themunicipal boundary
0.08
10 10 Land situated around the new habitationarea
0.07
11 11 Located 10 km or more away from themunicipal boundary
0.06
12 12 Land located in the dip zone of main watersource of Pondicherry
0.06
13 13 Waste land and soil suitability 0.0614 14 Small single site 0.0515 15 Land located in the dip zone of main water
source of Pondicherry0.05
16 16 Land situated around the new habitationarea
0.04
17 17 Located 10 km or more away from themunicipal boundary
0.04
2158 V.R. Sumathi et al. / Waste Management 28 (2008) 2146–2160
In this study, the Pondicherry region has been taken asthe study area. The thematic maps were generated, overlaidupon one another and the above proposed algorithm wasrun on them and GIS based analysis performed. TheGIS-based constraint mapping technique was employedfor the entire study area and subsequently 17 potential siteswere identified for landfill development on the basis of theselected criteria. Thereafter, the immediate local conditionsprevailing at the present moment were assessed and the 17potential sites were further screened to 3 sites that were themost optimum ones. Most of the sites were eliminated dueto their proximity to high tension power lines, location indip zone, location near upcoming habitation areas, aschool zone and away from the municipal boundary. The3 most optimum sites have been indicated in Fig. 14.
5. Results and conclusion
This paper examines an approach for identifying theoptimum site for the construction of a landfill in a typicallyurbanizing city. A multi-criteria approach was employed inconjunction with GIS-based overlay analysis to identify themost suitable site for landfill development in the Pondi-cherry region. The study was based upon a set of key crite-ria, which were selected based upon the already availableknowledge from research literature as well as the pre-exist-ing local level factors of the area. A set of 17 potential siteswere identified (Table 2) in the first level of analysis whilesubsequent screening and refinement on the basis of exist-ing microscopic factors led to optimized selection of the 3most suitable sites for landfill construction. The sites wereranked on the basis of area availability. Sites 1, 5, and 13covering areas of 0.36 km2, 0.11 km2 and 0.06 km2, respec-tively, were chosen as the most suitable for landfill con-struction. They are located in areas comprised ofwasteland, the physicochemical characteristic of the soilare optimum, and they also fulfill all of the selected criteria.
Site 2 was eliminated from consideration, as it is located inthe path of high-tension power lines. Sites 3, 8, 12 and 15were also eliminated, as they are located in the dip zoneof main water source of Pondicherry. Although sites 4,10 and 16 satisfied the selected criteria, they were alsoscreened out as they are located where new habitation areashave been proposed according to the Pondicherry MasterPlan. Site 6 has sandy soil and a high infiltration rate, while

V.R. Sumathi et al. / Waste Management 28 (2008) 2146–2160 2159
site 7 is located in the school zone; hence neither was con-sidered suitable. Sites 9, 11 and 17 were also eliminated asthey are located too far from the Pondicherry municipalboundary (more than 10 km).
The superiority of the proposed approach stems from itsinherent flexibility in its application to different sites withdiverse local conditions. Although the basic factors to beassessed for a landfill development are universally thesame, different sites may have different sets of local condi-tions. Hence the sets of important criteria, as well as theimportant ranking and weighting values, have to be opti-mized on the basis of site-specific conditions. The govern-ing algorithm was suitably calibrated for the Pondicherryregion through the iterations of the weightings and ratingsin AHP based on inputs from local policy makers. Expertopinions from key local government policy makers weregathered through Delphi for inputs to the model.
Furthermore, the uniqueness of the present approachstems from the fact that the environmental factors weredeemed as the primary governing factors in the study. Ithas been identified that the impacts produced to the neigh-boring environment as a result of development of a sani-tary landfill causes secondary impacts upon the healthand socio-economic conditions. A detailed study of thepre-existing groundwater and air quality was conductedin this regard. In addition, pre-existing land uses anddemographics was also given due importance.
Acknowledgement
The author (VRS) wishes to acknowledge the aid of theacademic research infrastructure available at the Centre forEnvironmental Studies, Department of Civil Engineering,Anna University for the research work conducted.
References
Allen, A., Brito, G., Caetano, P., Costa, C., Cummins, V., Donelly, J.,
Fernades, C., Kukupas, S., O_Donell, V., Robalo, C., Vendas, D.,
2002. Procedure for the location of landfill sites using a GIS model. In:
9th Congress of the International Association of Engineering Geology
and the Environment, Durban, South Africa, p. 100.
Banai, R., 1993. Fuzziness in geographic information systems: contribu-
tions from the analytic hierarchy process. International Journal of
Geographical Information Systems 7, 315–329.
Carver, S.J., 1991. Integrating multi-criteria evaluation with geographical
information systems. International Journal of Geographical Informa-
tion Systems 5 (3), 321–339.
Charnpratheep, K., Zhou, Q., Garner, B., 1997. Preliminary landfill site
screening using fuzzy geographical information systems. Waste Man-
agement and Research 15, 197–215.
Chen, W.Y., Kao, J.J., 1997. Fuzzy drastic for landfill siting. In:
Proceedings of the 13th International Conference on Solid Waste
Technology and Management, Philadelphia, PA, USA.
Church, R.L., 2002. Geographic information system and location science.
Computers and Operation Research 29, 541–562.
Clark, R.M., 1970. Economics of solid waste investment decisions.
Journal of Urban Planning and Development Division, 65–79.
Central Pollution Control Board (CPCB), New Delhi, 1999. Development
of site selection methodology for land filling – A case study for
Bangalore, Hazardous Waste Management Series, HAZWAMS/22/
2002–03, 12.
Central Pollution Control Board, New Delhi, 2003. Guidelines for the
selection of site for land filling, Hazardous Waste Management series,
HAZWAMS/23/2002–03, 1–11.
Central Public Health and Environmental Engineering Organization,
2000. Manual on Municipal Solid Waste Management, First Edition,
418–438.
Dipanjan, S., Vinod, T., Onkar, D., 1997. Ranking potential solid wastes
disposal sites using geographic information system techniques and
AHP, National Seminar on Applications of GIS for Solving Environ-
mental Problems, Chennai, 98–106.
Dobson, J., 1979. A regional screening procedure for land use suitability
analysis. The Geographical review 69, 224–234.
Durfee, R.C., 1974. Oak Ridge regional modeling information system,
Part 1. ORNL-NSF-EP-73. Oak Ridge National Laboratory, Oak
Ridge, TN.
Eastman, J.R., 1997. Idrisi for Windows, Version 2.0: Tutorial Exercises,
Graduate School of Geography—Clark University, Worcester, MA.
Esmaili, H., 1972. Facility selection and haul optimization model. Journal
of the Sanitary Engineering Division, 1005–1021.
Figueira, J., Greco, S., Ehrogott, M. (Eds.), 2005. Multiple criteria
decision analysis: State of the art surveys International series in
operations research and management science. Springer New York,
New York.
Fuertes, L., 1974. Solid waste management: equity trade-off models.
Journal of the Urban Planning and Development, 155–171.
Gal, T., Stewart, T .J., Hanne, T. (Eds.), 1999. Multicriteria Decision
Making: Advances in MCDM Models, Algorithms, Theory, and
Applications.. International series in operations research and man-
agement science. Kluwer Academic Publishers, Boston.
Gebhardt, K., Jankowski, J., 1987. Preliminary landfill siting and related
analysis using simple modeling techniques. Journal of Engineering
Geology 23, 291–306.
Helms, B., Clark, R., 1971. Locational models for solid waste manage-
ment. Journal of the Urban Planning and Development Division, 1–13.
Hipel, K.W., 1982. Fuzzy set methodologies in multicriteria modeling. In:
Gupta, M.M., Sanchez, E. (Eds.), Fuzzy Information and Decision
Processes. North-Holland, New York, pp. 79–287.
Hokkanen, J., Salminen, P., 1994. The choice of a solid waste management
system by using the ELECTRE III decision-aid method. In: Paruccini,
M. (Ed.), Applying Multiple Criteria Aid for Decision to Environ-
mental Management. Kluwer, Dordrecht, pp. 111–153.
Hokkanen, J., Salminen, P., 1997. Choosing a solid waste management
system using multicriteria decision analysis. European Journal of
Operational Research 98 (1), 19–36.
Kao, Jehng-jung, 1996. A raster-based C program for siting a landfill with
optimal compactness. Journal of Computers and Geosciences 22 (8),
837–847.
Kao, J.J., Lin, H.Y., 1996. Multifactor spatial analysis for landfill siting.
Journal of Environmental Engineering 122 (10), 902–908.
Kao, J.J., Lin, H., Chen, W., 1997. Network geographic information
system for landfill siting. Waste Management and Research 15 (3),
239–253.
Keeney, R.L., Raiffa, H., 1976. Decisions with Multiple Objectives.
Cambridge University Press, Cambridge.
Kiefer, R.W., Robbins, M.L., 1973. Computer-based land use suitability
maps. Journal of the Surveying and Mapping Division-ASCE 99, 39–
62.
Kontos, T.D., Komilis, D.P., Halvadakis, C.P., 2005. Siting MSW
landfills with a spatial multiple criteria analysis methodology. Waste
Management 25, 818–832.
Leao, S., Bishop, I., Evans, D., 2001. Assessing the demand of solid
waste disposal in urban region by urban dynamics modeling in a
GIS environment. Resources Conservation and Recycling 33, 289–
313.
Lin, H., Kao, J., 1998. Enhanced spatial model for landfill siting analysis.
Journal of Environmental Engineering 125 (9), 845–851.

2160 V.R. Sumathi et al. / Waste Management 28 (2008) 2146–2160
Malczewski, J., 1999. GIS and Multicriteria Decision Analysis. Wiley,
New York.
Malczewski, J., 2004. GIS-based land-use suitability analysis: a critical
overview. Progress in Planning 62 (1), 3–65.
McHarg, I.L., 1969. Design with nature. The Natural History Press,
Garden City, NY.
Minor, D., Jacobs, T., 1994. Optimal land allocation for solid and
hazardous waste landfill siting. Journal of Environmental Engineering
120 (5), 1095–1108.
Muttiah, R.S., Engel, B.A., Jones, D.D., 1996. Waste disposal site
selection using GIS-based simulated annealing. Computers & Geo-
sciences 22 (9), 1013–1017.
Padmaja, V., Asadf, S.S., Anji, M.R., 2006. Solid waste disposal site
selection using analytical hierarchy process and GIS. Pollution
Research 25 (1), 73–76.
Pereira, J.M.C., Duckstein, L., 1993. A multiple criteria decision making
approach to GIS-based land suitability evaluation. International
Journal of Geographical Information Systems 7, 407–424.
PPCC , 2005. State of the environment report – Pondicherry. Pondicherry
Pollution Control Committee, Government of Pondicherry, Pondi-
cherry.
Saaty, T., 1980. The Analytic Hierarchy Process. McGraw-Hill, New
York, USA.
Sadek, S., El-Fadel, M., El-Hougeiri, N., 2001. Optimizing lansfill siting
through GIS application. In: Seventeenth International Conference on
Solid Waste Technology and Management, Philadelphia, USA,
October 21–24, 2001.
Sarah, W., Susan, J.E., 2000. Environmental risk perception and well
being: Effects of the landfill siting process in two Southern Ontario
Communities. Social Science and Medicine 50 (7–8), 1139–1154.
Sasao, T., 2004. An estimation of the social costs of landfill siting using a
choice experiment. Waste Management 24, 753–762.
Savage, G.M., Diaz, L.F., Golueke, G.C., 1998. Guidance for landfilling
waste in economically developing countries. In: EPA 600/R-98-040,
US Environmental Protection Agency. National Risk Management
Research Laboratory, Cincinnati, OH.
Siddiqui, M.Z., Everett, J.W., Vieux, B.E., 1996. Landfill siting using
geographic information systems: a demonstration. Journal of Envi-
ronmental Engineering 122, 515–523.
Sumathi, V.R., 2006. Perspective development plan for solid waste
management in Pondicherry. Ph.D. Thesis, Centre for Environmental
Studies, Anna University, Chennai, India.
Swallow, S.K., Opaluch, J.J., Weaver, T.F., 1992. Siting noxious facilities:
an approach that integrates technical, economics, and political
consideration. Land Economics 68 (3), 283–301.
Tchobanoglous, G., Theisen, H., Vigil, S.A., 1993. Integrated Solid Waste
Management, Engineering Principles and Management Issues.
McGraw Hill, New York, USA, 377.
Tiwari, T.N., Manzoor, A., 1987. Air quality index for Calcutta and its
monthly variation for various localities. Indian Journal of Environ-
mental Protection 7 (3), 172–176.
UNEP, 1994. Landfill for hazardous industrial wastes: a training manual.
Training Report No. 17, UNEP.
Voelker, A.H., 1976. Indices, a technique for using large spatial data
bases. ORNL/RUS-15. Oak Ridge National Laboratory, Oak Ridge,
TN.
Vuk, D., Kozelj, B., Mladineo, N., 1991. Application of multicri-
teria analysis on the selection of the location for disposal of
communal waste. European Journal of Operational Research 55,
211–217.
Yoon, K.P., Hwang, C.-L., 1995. Multi Attribute Decision Making: An
Introduction. In: Thousand Oaks. Sage Publications, Inc.
Zeleny, M., 1982. Multiple Criteria Decision Making. McGraw-Hill, Inc.,
New York.