gifted education in orange county schools
TRANSCRIPT

Gifted Education in Orange County Schools
Cate Auerbach
Undergraduate Honors Thesis Sanford School of Public Policy
Duke University December 7, 2012, Durham, NC
Professors Kenneth Rogerson and Clara Muschkin

Auerbach 1
Abstract
Underachievement is defined as a discrepancy between a student’s ability and performance.
Underachievement in gifted children, namely those one to two years above grade level, is
especially concerning. Gifted children of high potential require additional nurturing and
motivation to fulfill this potential, a task for parents, teachers, and school administrators alike. In
Orange County Schools, a public school district in Orange County, North Carolina, these
stakeholders care about the achievement of students in the Academically and Intellectually
Gifted (AIG) program. This study explores test score growth among Orange County Schools’
AIG students in the fifth through eighth grade in order to assess underachievement for this group.
By examining the quantitative and qualitative factors contributing to gifted student learning, it
finds that test score growth does not accurately reflect gifted student achievement, and instead
suggests that other measurements be used to assess Orange County Schools’ gifted program.
Introduction
Gifted students are defined here as those who “learn well beyond the expected level of
one’s age peers” (Orange County Board of Education, 2010). If high potential children aren’t
engaged in school from an early age, they often lose interest and have difficulty meeting
challenges later in life (Cleaver, 2008). Studies suggest that 10-50% of all gifted students can be
classified as underachieving (Hoffman, Wasson, & Christianson, 1985; Richert, 1991). The term
underachievement describes the discrepancy between a child’s performance in school and his or
her actual ability (Rimm, 1998). Underachievement may take the form of lower class grades,
lower test scores, or a general lack of engagement with school material (Reiss, 2000). One
potential metric of underachievement is a lack of growth from year to year.

Auerbach 2
The North Carolina Department of Public Instruction calculates a test score growth index
for each student in grades three through eight using a baseline and the student’s previous
standardized test scores. Data from the Orange County Schools’ Department of Testing and
Accountability show that 34% of students in grades five through eight identified as gifted in
math and 35% of those gifted in reading showed negative growth in the 2010-2011 school year
using this metric.1 Approximately 54% of the students in the sample were identified as gifted in
both reading and math, though they were counted separately in the data analysis. There was little
difference between the elementary and middle schools in regards to the impact of various factors
on performance. Out of the measures analyzed, only the percentage of students showing negative
growth in reading was significant, though this may be due to the small sample size.2 Teachers
and administrators alike expressed concern over this trend of negative growth and sought
additional information about the assessment of negative growth and its causes.
Orange County Schools can be used as a case study in addressing an overarching
question: What factors impact gifted student learning? This review applies the relevant
literature regarding both gifted underachievement and effective instructional methods for gifted
education to Orange County Schools by incorporating both quantitative data analysis and
qualitative evaluation from teacher interviews. A total of eleven sub-questions are examined in
order to investigate the trend of negative growth and to inform the district’s upcoming review of
its academically and intellectually gifted (AIG) program.
1 Data set provided by Orange County Schools in January 2012 for the purposes of this research. 2 A t-test yielded a correlation of 0.0191 for the percentage of students showing negative growth in reading between elementary and middle schools, 0.1682 for the percentage of students showing negative growth in math, 0.0882 for average growth score in reading, and 0.2827 for average growth score in math. Of these, only the percentage of students showing negative growth in reading is significant.

Auerbach 3
Background on Academically and Intellectually Gifted Students in Orange County
Orange County Schools and the AIG Program
Orange County includes two school districts: Orange County Schools and Chapel Hill –
Carrboro City Schools. Orange County Schools is the 50th largest of the 115 school districts in
North Carolina, with a total population of 50,086 including 8,644 children between the ages of 5
and 17. About 18% of these children come from families in poverty, compared to a mean of 26%
for the state (U.S. Census Bureau, 2010). Orange County Schools has seven elementary schools
and three middle schools, serving a total of 99 and 334 AIG students, respectively. All students
take the state-mandated End-of-Grade (EOG) exams in both math and reading in grades 3-8.
Orange County Schools generally exceeds the state average for percent of students performing at
or above their grade level.3 In reading, students in the district exceeded the state average at all
grade levels. In math, students in the district exceeded the state average in the fifth and seventh
grades, and narrowly fell behind the state average in the sixth and eighth grades (see Table 1).
Table 1. District and State Proficiency Levels. This table shows the difference in proficiency levels between Orange County Schools and the North Carolina state average in reading and math on the 2010-2011 EOG exam. Values show the percent of students at or above grade level.
3 As calculated by the author based on North Carolina Public Schools Testing and Accountability Results, found at http://accrpt.ncpublicschools.org/app/2011/disag/

Auerbach 4
The AIG programs within Orange County Schools vary substantially, both in size and in
specific program offerings. Each school employs a full-time AIG specialist who works with
students and teachers to customize the AIG program. According to Orange County Schools’
2010-2013 AIG strategic plan, schools use some combination of grouping, acceleration, and
collaborative teaching in elementary and middle school programs. Grouping involves teaching
groups of students based on their demonstrated knowledge of a particular subject, and can occur
through either a pull-out model or a push-in model. Pull-out models take students out of their
regular classes for advanced instruction, whereas push-in models engage students within their
regular classroom. Acceleration involves addressing the curriculum at a faster pace, often
involving coursework above the student’s grade level. Collaborative teaching brings the AIG
specialist and the regular classroom teacher together to meet the needs of high achieving students
regardless of formal AIG identification. In middle school, AIG-identified students are enrolled in
advanced math and language arts courses with the AIG specialist and other AIG students.
Differentiated instruction in the general classroom and AIG-specific instruction provided by
gifted specialists are each drawn from the North Carolina Standard Course of Study, and as
compared to normal instruction, both involve “greater depth and sophistication to provide a
challenging, rigorous learning experience” (Orange County Board of Education, 2010).
In 1996, North Carolina reexamined its policies concerning the education of academically
and intellectually gifted children. Article 9B of the North Carolina General Statute provides a
state definition for AIG students (see Reference 1) and requires local education agencies (LEA)
to develop specific AIG plans for local schools. The current mandate for K-12 gifted education
charges schools with meeting the needs of students who require “educational services beyond
those ordinarily provided by the regular education program” (Orange County LEA, 2011). The

Auerbach 5
first standard, student identification, requires procedures that are clear, equitable, and
comprehensive. The practice employs multiple criteria for student identification, including
student aptitude, achievement, and potential to achieve (Orange County LEA, 2011).
Reference 1. Article 9B of the North Carolina General Statute. North Carolina Department of Public Instruction. (2009). North Carolina Academically or Intellectually Gifted Program Standards. Public Schools of North Carolina State Board of Education. Raleigh, NC. Page 1.
Building off the 2008 state assessment as well as a district assessment of the AIG
program, Orange County Schools uses a multi-pronged approach in identifying its AIG students.
Students may be identified at any age, and the process includes input from teachers, parents, and
administrators. Students must achieve at the 95th percentile or higher on the North Carolina EOG
exam, show a probable rating of giftedness on the GATES4 assessment, and be recommended for
gifted services by the school’s needs determination team. The team takes classroom grades as
well as teacher and parent recommendations into account when placing students, and uses a non-
verbal test to reach underserved populations and alternative learners (Orange County Schools,
2012). Orange County Schools’ LEA does not mention the AIG program in its 2010-2011
4 The Gifted and Talented Evaluation Scale (GATES) is a tool used by teachers, parents and others to evaluate the giftedness of a child by rating the presence of evidence-based, norm-referenced characteristics. More information can be found here: http://www.prufrock.com/GATES-Complete-Kit-P87.aspx

Auerbach 6
improvement plan. However, an outline of the School Board’s strategic goals for the AIG
program emphasizes reaching traditionally underserved populations through a comprehensive,
bi-annual AIG talent search (Orange County LEA, 2011; Orange County Board of Education,
2010). Based on conversations with teachers, it is unclear whether schools have consistently
conducted this search.
Definition of Performance in the Orange County AIG Context
The North Carolina Department of Public Instruction (DPI) calculates Academic Change
as part of its school and teacher accountability model (North Carolina Department of Public
Instruction Accountability Services, 2011). This test score growth index computes the growth of
each individual student from one year to the next by subtracting the student’s current scale score
from his or her previous scale scores. Scale scores are computed by comparing the student’s raw
score on the state-wide standardized grade-level achievement exam, End-of-Grade (EOG), to a
baseline set in the exam’s first year of use. Students who score above the baseline in one year are
expected to score above the baseline in consecutive years. In doing so, they receive a growth
score of zero. Students who do not perform as well on the EOG exam as previous years, relative
to the grade level average in the standard-setting year, receive a negative growth score. DPI uses
growth score data to assess school and teacher performance, not individual student performance,
though schools and teachers have access to individual student scores. See Appendix A for a
sample growth score calculation provided by DPI.
Due to the variety of factors that may lead to a gifted student’s low performance in the
classroom, Orange County Schools includes underachievement in the list of characteristics to be
taken into account when identifying students for consideration in the AIG program (Orange

Auerbach 7
County Board of Education, 2010). According to the Orange County LEA 3-year strategic plan
for its AIG program, “Nurturing services are intended to make special efforts to recognize and
support students at all grade levels who demonstrate high intellectual potential to develop skills
for advanced study but do not exceed expected grade level achievement” (Orange County Board
of Education, 2010). Teacher efforts to reach students without AIG identification who
demonstrate subject area mastery further support this endeavor.
Review of the Growth Data for AIG Students in Orange County Schools
Orange County Schools’ measure of achievement in this case is the North Carolina EOG
exam, with expected academic change calculated by the DPI. Regression to the mean, the
tendency for high achieving students to trend towards the average as they reach their potential
over time, is taken into account in DPI’s growth projection formula for North Carolina (North
Carolina Department of Public Instruction Accountability Services, 2011). However, this trend
fails to explain the negative growth for students in all grade levels in the sample. Looking at the
2010-2011 school year, 21% of fifth grade students studied showed negative growth in reading,
while 24% showed negative growth in math. 39% of middle school students studied showed
negative growth in reading, while 36% showed negative growth in math.5 There was no major
difference between students identified in only one subject area versus those identified for both,
and the only noteworthy variance between grade levels was a dip in seventh grade math, a trend
verified anecdotally by teachers and administrators in Orange County Schools. While in some
schools over 50% of AIG students showed negative growth in their area of identification, the
average growth scores for the students in all but two of the programs were positive (see Figures
5 All data analysis is the author’s own based on the information provided by Orange County Schools Testing and Accountability Services.

Auerbach 8
A and B). This would indicate that in general, the students in the sample showing negative
growth were closer to a score of zero than the students showing positive growth.
Figure A. Percentage of AIG Students in Orange County Schools Showing Negative Growth. This figure shows the percentage of students with negative growth scores on the 2010-2011 EOG exam in their area of AIG identification. The 16 programs studied include grades 5-8 for the 10 schools in the sample (names are hidden for confidentiality). Programs 1-7 are elementary schools, and programs 8-16 are middle schools. Negative growth is defined as below 0.
0
10
20
30
40
50
60
1 2 3 4 5 6 7 8 9 10 11 12 13 14 15 16% A
IG S
tude
nts
Show
ing
Neg
ativ
e G
row
th
AIG Program
Reading
Math
Auerbach 9
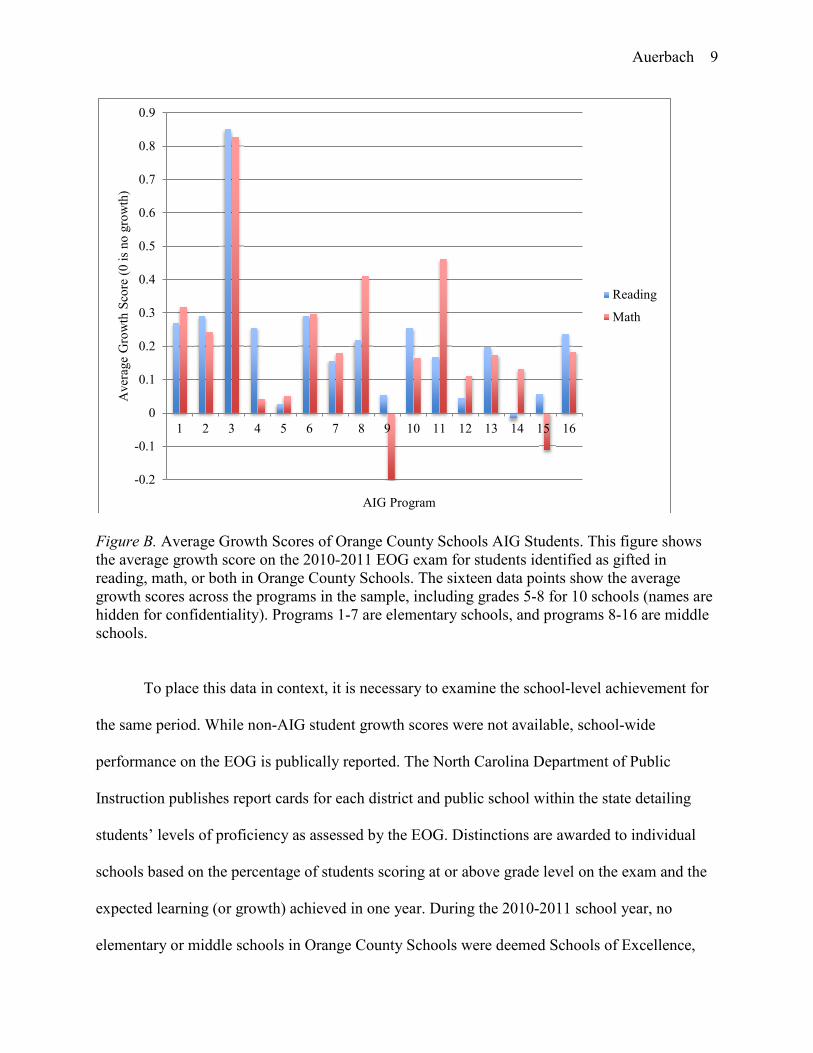
Figure B. Average Growth Scores of Orange County Schools AIG Students. This figure shows the average growth score on the 2010-2011 EOG exam for students identified as gifted in reading, math, or both in Orange County Schools. The sixteen data points show the average growth scores across the programs in the sample, including grades 5-8 for 10 schools (names are hidden for confidentiality). Programs 1-7 are elementary schools, and programs 8-16 are middle schools.
To place this data in context, it is necessary to examine the school-level achievement for
the same period. While non-AIG student growth scores were not available, school-wide
performance on the EOG is publically reported. The North Carolina Department of Public
Instruction publishes report cards for each district and public school within the state detailing
students’ levels of proficiency as assessed by the EOG. Distinctions are awarded to individual
schools based on the percentage of students scoring at or above grade level on the exam and the
expected learning (or growth) achieved in one year. During the 2010-2011 school year, no
elementary or middle schools in Orange County Schools were deemed Schools of Excellence,
-0.2
-0.1
0
0.1
0.2
0.3
0.4
0.5
0.6
0.7
0.8
0.9
1 2 3 4 5 6 7 8 9 10 11 12 13 14 15 16
Ave
rage
Gro
wth
Sco
re (0
is n
o gr
owth
)
AIG Program
Reading
Math

Auerbach 10
defined as having 90% of students at grade level and making expected growth. Nearly 30% of
the district’s elementary schools and 33% of the district’s middle schools were deemed Schools
of Distinction, defined as having 80-89% of students at grade level and making expected growth
(North Carolina Public Schools, 2011). This places Orange County Schools in the middle of its
neighboring school districts, Chapel Hill-Carrboro City Schools and Durham Public Schools,
which respectively had 100% and 0% of elementary and middle schools deemed Schools of
Distinction or higher during the 2010-2011 school year.
Methodology
The following analysis is based on the Orange County Schools AIG growth data on the
2010-2011 EOG exam as reported by the Orange County Schools Division of Testing and
Accountability in Spring 2012. Orange County Schools includes one high school, three middle
schools, and seven elementary schools. This evaluation was based on the elementary and middle
schools’ test score data for AIG students in the fifth through eighth grade. The sample includes
16 programs at 10 different schools, comprising a total of 422 AIG students. The program sizes
by grade level range from less than 10 students to more than 50 students, separated by reading
and math identification.
A total of eleven questions are analyzed in order to address the central question: What
factors impact gifted student learning? Online resources from the Duke Library website,
LexisNexus research database, US Department of Education ERIC clearinghouse, and relevant
print sources informed the literature review. Data for the quantitative analysis came from the
Orange County Schools AIG student test score growth, provided by district administrators, and
Auerbach 11
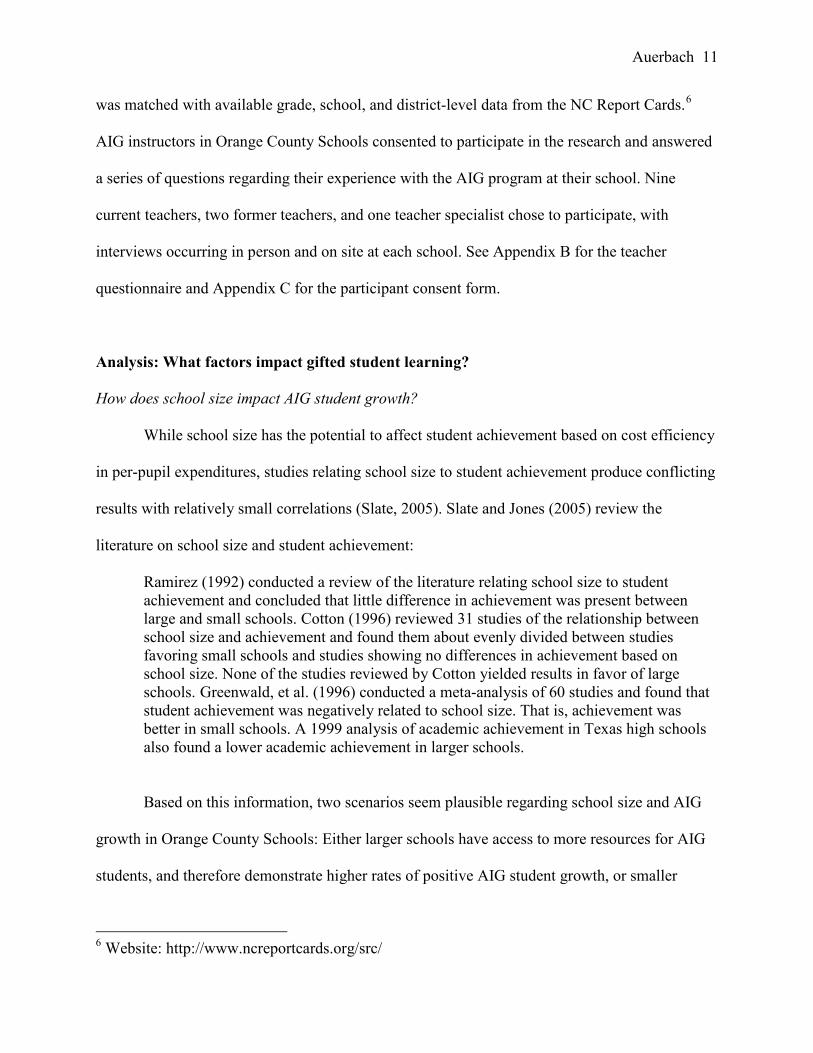
was matched with available grade, school, and district-level data from the NC Report Cards.6
AIG instructors in Orange County Schools consented to participate in the research and answered
a series of questions regarding their experience with the AIG program at their school. Nine
current teachers, two former teachers, and one teacher specialist chose to participate, with
interviews occurring in person and on site at each school. See Appendix B for the teacher
questionnaire and Appendix C for the participant consent form.
Analysis: What factors impact gifted student learning?
How does school size impact AIG student growth?
While school size has the potential to affect student achievement based on cost efficiency
in per-pupil expenditures, studies relating school size to student achievement produce conflicting
results with relatively small correlations (Slate, 2005). Slate and Jones (2005) review the
literature on school size and student achievement:
Ramirez (1992) conducted a review of the literature relating school size to student achievement and concluded that little difference in achievement was present between large and small schools. Cotton (1996) reviewed 31 studies of the relationship between school size and achievement and found them about evenly divided between studies favoring small schools and studies showing no differences in achievement based on school size. None of the studies reviewed by Cotton yielded results in favor of large schools. Greenwald, et al. (1996) conducted a meta-analysis of 60 studies and found that student achievement was negatively related to school size. That is, achievement was better in small schools. A 1999 analysis of academic achievement in Texas high schools also found a lower academic achievement in larger schools.
Based on this information, two scenarios seem plausible regarding school size and AIG
growth in Orange County Schools: Either larger schools have access to more resources for AIG
students, and therefore demonstrate higher rates of positive AIG student growth, or smaller
6 Website: http://www.ncreportcards.org/src/

Auerbach 12
schools are able to pay more attention to AIG students and provide individualized instruction,
and demonstrate higher rates of positive AIG student growth. The data was mixed on the
relationship between school size and test score growth for AIG students (see Appendix D for the
correlations between various factors and achievement). At the elementary school level, school
size was strongly negatively correlated with average AIG test score growth in math, meaning
that larger schools also showed lower average growth scores in this area.7 School size was also
strongly positively correlated with the percentage of students showing negative growth in
reading, corroborating this claim. At the middle school level, however, school size was
negatively correlated with the percentage of students showing negative growth in reading. This
means that for the middle school sample, larger schools had a lower percentage of students
showing negative growth (see Figure C).
The average percentage of students showing negative growth in both reading and math
was higher for schools above the combined median size of 491.5 for both elementary and middle
compared to those below the median size. From teacher interviews, AIG specialists at smaller
schools seemed to have a broader reach across various grade levels within the school compared
to specialists at larger schools, as well as more time to provide professional development and
support to other teachers. Teachers surveyed agreed that both of these factors were of critical
importance to improving gifted services.
7 Strong correlation defined as an r value of 0.4 or greater.

Auerbach 13
Figure C. Negative Growth as a Function of School Size. This figure shows the percentage of AIG students in Orange County Schools with negative growth scores on the 2010-2011 EOG exam in their area of AIG identification as compared to the number of students enrolled in their school during the 2010-2011 academic year. Elementary and middle schools are separated due to the strong correlation between these factors. Trendlines are shown for both reading (blue) and math (red).
How does class size impact AIG student growth?
It is often assumed that smaller class sizes are more conducive to student achievement
(Cho, Glewwe, & Whitler, 2012). A landmark study in Tennessee shows that reduced class size
has a positive impact on student achievement, especially for minority and low-income students
due to increased attention (Krueger, 2001). Since gifted students also benefit from greater
attention, smaller class sizes and smaller program sizes might lead to higher levels of positive
AIG growth. While the literature surrounding this topic does not include specific studies on class
size and gifted student achievement, conflicting evidence exists regarding the effectiveness of
reducing class size in increasing overall student achievement (Southworth, 2010). Gains are
0
10
20
30
40
50
60
200 400 600 800% A
IG S
tude
nts
Show
ing
Neg
ativ
e G
row
th
School Size
Elementary Schools
Reading
Math
20
25
30
35
40
45
50
400 500 600 700
% A
IG S
tude
nts
Show
ing
Neg
ativ
e G
row
th
School Size
Middle Schools
Reading
Math

Auerbach 14
usually very small, and are not likely to persist over time or lead to “sizable increases in student
learning” (Cho, Glewwe, & Whitler, 2012).
The median class size for this sample was 22.5. There was no discernable difference
between the growth rates of AIG students in Orange County Schools with class sizes below the
median and students at schools with class sizes above the median. As seen in Figure D, the
percentage of students showing negative growth on the EOG exam varied between programs
with similar average class sizes, and high percentages of negative growth were found both above
and below the median class size. Overall, the variation in performance among classes of similar
size was greater than the variation between classes of different sizes, indicating that this variable
was likely not the sole determining factor of performance. See Figure E for the plot of class size
versus average AIG growth scores. In data analysis, large class size was strongly negatively
correlated with average math scores in elementary schools, with an r value of -0.7073, and
strongly positively correlated with the percentage of students showing negative growth in both
reading (r = 0.7040) and math (r = 0.5744) at the elementary school level. This suggests that
reduced class sizes may be more beneficial to elementary school AIG students than middle
school AIG students.

Auerbach 15
Figure D. Negative Growth as a Function of Class Size. This figure shows the percentage of AIG students in Orange County Schools with negative growth scores on the 2010-2011 EOG exam in their area of AIG identification as compared to the average class size of their grade that year. For the elementary schools, the percentage of AIG reading students showing negative growth in School X’s fifth grade is shown against School X’s average fifth grade class size in 2010-2011. For the middle schools, each data point represents either the math or reading program for each grade level at each school. For example, the percentage of AIG reading students showing negative growth in School Y’s sixth grade is shown against School Y’s average sixth grade class size in 2010-2011. Trendlines are indicated for both reading (blue) and math (red).
0
10
20
30
40
50
60
15 20 25 30
% A
IG S
tude
nts
Show
ing
Neg
ativ
e G
row
th
Class Size
Elementary
ReadingMath
0
10
20
30
40
50
60
15 20 25 30% A
IG S
tude
nts
Show
ing
Neg
ativ
e G
row
th
Class Size
Middle
ReadingMath

Auerbach 16
Figure E. Average AIG Growth by Class Size. This figure shows the average test score growth of AIG students in Orange County Schools on the 2010-2011 EOG exam in their area of AIG identification as compared to the average class size of their grade that year. Cohorts from each program in the sample, namely grades 3-8 across 10 schools, are included.
Teachers generally stated that smaller class sizes tend to be better for gifted students.
Since AIG specialists are only able to work with high achieving students for a portion of the
school day, it is imperative that all classroom teachers have the resources and support to cater to
the needs of gifted students. Smaller class sizes give teachers more time to do so. Additionally,
gifted students are often called upon to help struggling students in larger classes when the
teachers require assistance to reach everyone. This may have the effect of creating social divides
among students in the class, as well as removing the opportunity for gifted students to experience
enriched material themselves. Lastly, in larger classes the most disruptive students often garner
-0.2
0
0.2
0.4
0.6
0.8
1
16 19 20 21 22 22 22 22 23 23 23 23 23 24 26 26
Ave
rage
AIG
Stu
dent
Gro
wth
Sco
re
Average Class Size
Reading
Math
Auerbach 17
the most teacher attention. Often these students are the ones who struggle with the material,
rather than those who are either on target or above. Therefore, teachers in this study advocate for
reduced class sizes in order to support the needs of teachers and gifted students alike.
How does program size impact AIG student growth?
In general, program size had a similar impact on AIG student achievement as did class
size. For both reading and math, there was a small positive correlation between program size and
the percentage of students showing negative growth (see Figure F). This indicates that larger
program sizes in the sample generally had larger percentages of students showing negative
growth. Additionally, all but one of the programs below the median size of 20 for reading had
less than one third of their students showing negative growth; in contrast, 75% of programs
above the median size had more than one third of AIG students showing negative growth.
Teachers in Orange County Schools commented that smaller programs tend to facilitate growth
for students due to additional attention from the AIG specialist on staff. However, larger
programs are able to both bring more funding and differentiation within AIG than do smaller
programs. It should be noted that none of the correlations for program size were strong,
differentiating it from the other factors (see Appendix D).

Auerbach 18
Figure F. Negative Growth as a Function of AIG Program Size. This figure shows the percentage of Orange County Schools AIG students with negative growth scores on the 2010-2011 EOG exam in their area of AIG identification as compared to the number of students in their AIG program. AIG programs are defined as cohorts of students identified as gifted in a given subject area at a certain school. AIG programs in this sample include grades 5-8 across 10 schools. The median program size, 20, is displayed with a vertical line. The trendlines indicate the trends in the data for both reading (blue) and math (red). Since none of the correlations between program size and achievement were strong, for either reading or math, the elementary and middle school data are shown together.
How does overall school performance impact AIG student growth?
In order to analyze individual student growth levels, achievement must be placed in
context. As mentioned in the background on Orange County Schools, growth scores are not
available for non-AIG identified students. Therefore, school-wide performance on the EOG
exam was used as a proxy for achievement. While not a perfect comparison, this measurement
gave a sense of AIG students’ achievement within their school environment. Overall, the data
0
10
20
30
40
50
60
0 10 20 30 40 50% A
IG S
tude
nts
Show
ing
Neg
ativ
e G
row
th o
n 20
10-2
011
EOG
Exa
m in
Are
a of
Iden
tific
atio
n
Number of Students Identified as AIG in Subject Area
Reading
Math

Auerbach 19
showed a link between school quality and AIG student growth. The two elementary schools of
distinction in the sample showed the two highest overall growth rates for both reading and math,
excluding the smallest programs with 0% negative growth rates. The one middle school of
distinction in the sample had the highest overall math growth rate and second highest for reading.
These schools of distinction also had the largest number of students in their AIG programs. This
correlation could potentially be related to parental choice in schools, as parents interested in
gifted programs for their children have the option to self-select into a school with a well-known
gifted program by moving to that school’s neighborhood. The schools with the lowest number of
students in the AIG program tended to have lower overall growth rates, with the exception of
elementary programs with less than ten AIG students.
As seen in Figure G, there was a small correlation between school-wide achievement in
Orange County Schools and AIG student growth. When the outliers were removed, the trend
lines revealed a positive association between school EOG achievement and AIG growth for both
reading and math (see Figure H). This could mean that higher levels of school performance
encourage higher AIG growth, or rather are indicative of an environment conducive to high
student performance. Teachers did not comment on school-wide performance except to note that
in most cases, AIG-identified students on average out-perform their peers on the EOG exam.
This is related both to the fact that the EOG is used to identify students for the gifted program in
Orange County Schools, and that gifted students are often able to easily master grade-level
material.

Auerbach 20
Figure G. Average AIG Growth versus School-Wide Achievement. This figure shows the average growth score on the 2010-2011 EOG exam for students identified as gifted in reading, math, or both in Orange County Schools as compared to the percentage of students at their school performing at or above grade level on the 2010-2011 EOG exam.
Figure H. Trends in Average AIG Growth versus School-Wide Achievement. Removing two outliers from Figure G, this figure shows the trend lines for the comparison between average AIG growth scores and school EOG performance, defined as the percentage of students performing at or above grade level on the 2010-2011 EOG exam.
0
0.1
0.2
0.3
0.4
0.5
0.6
0.7
0.8
0.9
50 60 70 80 90 100
Ave
rage
AIG
Stu
dent
Gro
wth
Sco
re
School EOG Performance
Reading
Math
0
0.05
0.1
0.15
0.2
0.25
0.3
0.35
50 60 70 80 90 100
Ave
rage
AIG
Stu
dent
Gro
wth
Sco
re
School EOG Performance
Reading
Math

Auerbach 21
How do the demographics of the school, specifically economic disadvantage, impact AIG student
growth?
Student demographics in terms of economic disadvantage can have a great impact on the
learning environment of a school. In a 2010 study of student achievement in North Carolina, the
authors found that the “racial and poverty composition of schools affect student achievement
after factoring in student, family, and other school influences” (Southworth, 2010). Another
study showed that 44% of low-income students who enter first grade in the top 10% do not
maintain their status through fifth grade (Wyner, Bridgeland, & Dilulio, 2007). Poverty
concentrations in schools, defined here as the number of students identified as economically
disadvantaged, impact teacher inputs, resources, and peer achievement. Teachers in low-income
schools are often newer, have fewer credentials such as subject matter scores and teaching exam
scores, and are generally less effective (Clotfelter, Ladd, & Vigdor, 2005). For these reasons,
they may offer less challenging curriculum and have lower expectations of students than teachers
in middle-class schools (Southworth, 2010).
The National Center for Education Statistics found in a 2007 analysis that middle-class
children attending schools with high levels of poverty had, on average, lower achievement levels
than low-income children in middle-class schools (North Carolina Center for Education
Statistics, 2007). Peer spillover effects can reduce the importance of individual poverty level
when low-income students go to school with student from middle-class backgrounds. These
peers are more likely to be academically oriented, respond to pressure to succeed, and have
access to human and social capital not otherwise available to low-income students (Godwin,
2002). This capital includes natural abilities, learned skills, and relationships with others that can

Auerbach 22
be beneficial later in life in regards to information gathering, financial asset building, and job
acquisition (Burt, 1993).
Schools in the district with more students of economic disadvantage, as defined in Figure
I, had a higher percentage of AIG students showing negative growth than did schools with less
students of economic disadvantage (ED). However, this trend only held constant for reading, and
the difference is negligible for math. Teacher turnover, another indicator of unsatisfactory school
conditions, did not appear to be impacted by the number of economically disadvantaged students
in Orange County Schools (see Figure J).

Auerbach 23
Reading
Math
Figure I. Economic Disadvantage in Orange County Schools. These figures show the percentage of AIG students with negative growth scores in their area of identification as compared to the relative proportion of students of economic disadvantage in their school. The number of students identified as economically disadvantaged by the state of North Carolina who took the 2010-2011 EOG exam was divided by the total number of students in the school to arrive at a proportion. The median percentage of economically disadvantaged students within the sample of 10 schools was 27.3%. “More ED” consists of the schools with more than the median percentage of economically disadvantaged students within the sample. “Less ED” consists of the schools with less than the median percentage of economically disadvantaged students within the sample.
32%
68%
More ED
% Negative
% Positive
22%
78%
Less ED
% Negative
% Positive
30%
70%
More ED
% Negative
% Positive
31%
69%
Less ED
% Negative
% Positive

Auerbach 24
Figure J. Impact of Economic Disadvantage on Teacher Turnover. This figure compares the number of economically disadvantaged students taking the 2010-2011 EOG exam in each school with the 2010-2011 teacher turnover rate in that school. A higher rate indicates more teachers leaving the school that year.
Teachers noted in interviews that the mix of students greatly impacts school-wide
achievement, with students from disadvantaged backgrounds often facing additional challenges
at home that inhibit their ability to focus and perform well in school. Additionally, schools with a
higher mix of wealthier students are likely to experience a different culture of achievement,
especially due to parental pressures. Almost all of those interviewed emphasized the need to
increase efforts to include students from traditionally underrepresented groups in gifted
programming. One teacher noted that five percent of any population should be gifted, and yet
less than five percent of many groups (including racial minorities, English language learners, and
students in poverty) are represented in Orange County Schools’ gifted program. It is important
that these students be identified so that they can receive appropriate services and be placed on the
right track for middle and high school courses. These students also benefit from the more
0
50
100
150
200
250
300
0 0.02 0.04 0.06 0.08 0.1 0.12 0.14
Num
ber o
f Eco
nom
ical
ly
Dis
adva
ntag
ed S
tude
nts
Teacher Turnover

Auerbach 25
advanced peer group and teacher expectations that come with AIG identification, possibly even
more so than do students from professional backgrounds with an emphasis on academic
achievement. Potential methods to raise the diversity of Orange County Schools’ gifted program
include more holistic identification practices, increased gifted programming in younger grades,
and a continued emphasis on inclusive push-in models that reach students who are not formally
identified as AIG.
How does teacher quality impact AIG student growth?
While the definition of teacher quality is a highly debated concept, there is no doubt that
quality teachers have a strong impact on students’ learning and achievement (Southworth, 2010).
In fact, one analysis shows that the quality of teachers is “more predictive of academic
achievement than class size, the poverty level of the student, or teacher salaries” (Darling-
Hammond, as cited in Southworth, 2010). In regards to gifted education, the teacher-student
relationship may significantly influence achievement (Baker, 1998).
Some studies show that teacher experience is the most important factor affecting teacher
effectiveness, while others cite level of education or certification status (Clotfelter, Ladd, &
Vigdor, 2005; Godwin, 2002). Research shows that compared to other teacher qualifications,
National Board Certification is one of the best measures of effectiveness (Goldhaber, 2008).
Figure K uses this measure to analyze the correlation between teacher quality and AIG student
performance in Orange County Schools. It is difficult to draw conclusions from this analysis, as
two schools out of the seven in the elementary school sample and one school out of three in the
middle school sample skewed the results. In the elementary school sample, one school with
fewer than the median number of National Board Certified teachers had more than double the
average growth scores, while another school with more than the median number of National
Auerbach 26
Board Certified teachers had less than half of the average growth scores. This led to an overall
negative correlation between the two factors. In the middle school sample, the one school with
the highest number of National Board Certified teachers had the lowest average growth scores.
This led to an overall positive correlation between teacher qualification and the percentage of
students showing negative growth. While it is important to look at the data, most likely these
results are not indicative of a trend.
Another factor to consider is that gifted students meet with teachers who are not AIG
specialists for the majority of their classes, and some teachers are better with gifted students than
others. In interviews, AIG specialists noted that within schools, it is generally well known who is
“good with” gifted students and who is not. Those teachers who differentiate well, are interested
in meeting the needs of high achieving students, and develop the skills to meet these needs are
likely to produce better results for the gifted students in their classes than teachers who do not
exhibit these qualities. Based on this insight, higher quality teachers in both general classrooms
and AIG programs could potentially produce students with higher growth scores.

Auerbach 27
Figure K. Average AIG Growth by Teacher Quality. This figure shows the average growth score on the 2010-2011 EOG exam for students identified as gifted in reading, math, or both in Orange County Schools as compared to the number of National Board Certified teachers in their school as reported in the NC Report Cards for the 2010-2011 school year. Elementary and middle school data are shown separately due to the strong correlation between these factors. How do AIG identification practices impact AIG student growth?
In Orange County Schools, students are considered for the AIG program based on a
variety of factors. All schools in the district use the same methods of identification, which
include both objective and subjective standards. In third grade, all students take the CogAT8
exam. Those scoring in the 99th percentile are automatically identified as gifted, and those
scoring in the 95th percentile may be identified with a teacher recommendation. After third grade,
students scoring in the 95th percentile on the North Carolina EOG exam may be identified with a
teacher recommendation, regardless of the student’s CogAT score. Alternative non-verbal tests
8 The Cognitive Abilities Test (CogAT) is an aptitude test commonly used as part of gifted student identification. The primary goal is to assess students’ reasoning abilities. For more information, see http://www.riverpub.com/products/cogAt/details.html
0
0.1
0.2
0.3
0.4
0.5
0.6
0.7
0.8
0.9
1 2 3 4 5 6 7
Ave
rage
AIG
Stu
dent
Gro
wth
Sco
re
Number of National Board Certified Teachers
Elementary
Reading
Math
0
0.05
0.1
0.15
0.2
0.25
0.3
1 2 3A
vera
ge A
IG S
tude
nt G
row
th S
core
Number of National Board Certified
Teachers
Middle
ReadingMath

Auerbach 28
are given to students when necessary, or when requested by a parent or teacher. These non-
verbal tests aim to capture alternative learners who think outside the box but may not achieve
qualifying scores on standardized tests such as the EOG. To qualify for the AIG program in
middle school, students must score in the 95th percentile on either an achievement (EOG) or
aptitude (CogAT) test and have either a classroom grade of “A” in the subject of desired
identification or a qualifying GATES score. The majority of AIG students in Orange County
Schools are identified as gifted in elementary school, and the district neither retests students nor
differentiates service delivery based on qualifying scores or methods of identification.
Many teachers surveyed in Orange County Schools recommended changes in the AIG
identification process. The most consistent feedback was that giftedness involves above-grade
level thinking skills, which cannot be accurately assessed by a standardized grade-level exam
such as the EOG. Therefore, teachers advocated for the replacement of the EOG with more
appropriate measures of giftedness. Suggestions included: Iowa Test of Basic Skills (ITBS), used
by Wake County; IQ tests, formerly used by Orange County Schools; portfolio assessment and
teacher recommendations, currently used in some but not all cases; and evaluations throughout
the year. In neighboring Durham County, AIG students are identified by either the Woodcock
Johnson III Achievement Battery or the ITBS, in addition to an aptitude assessment (Durham
Public Schools, 2010). These methods provide a more holistic and accurate assessment of true
giftedness, rather than relying on a one-time snapshot from one test day as with Orange County
Schools’ current method.
Teachers expressed concern that some students qualify for the AIG program via a testing
fluke caused by either getting lucky, guessing correctly, or having an extraordinary teacher that
particular year. These students often struggle in the AIG program and would be better served in a

Auerbach 29
different set of courses suited to their skill level. Furthermore, even high achieving students are
not always truly gifted. Academic excellence might be a result of hard work, a nurturing
environment, or high levels of preparation, rather than the higher-order thinking that
characterizes gifted students. Teachers thought it crucial to differentiate between academic high
achievers and gifted students with a consistent, appropriate, and adequate identification process.
How do AIG-specific instructional methods impact AIG student growth?
Ability grouping is a central component of gifted student instruction. Ability grouping
can be broken into three distinct methods: cluster grouping within a general classroom, special
classroom grouping, and tracking. Cluster grouping enables students of similar abilities to
interact within a heterogeneous classroom environment. The key component of a cluster
grouping strategy is that it must be accompanied by differentiated curriculum, which is adapted
to the needs and abilities of each group. Research shows that clusters are only effective in
improving academic achievement for gifted students if the curriculum is sufficiently extended
beyond the material offered to all students, though cluster grouping can benefit students of all
abilities if an appropriate curriculum is provided (Toth, 1999). Several examples of successful
cluster grouping models involve separating students by identified ability, allowing for flexibility
in identification throughout the year, and placing groups of similar ability together in a
heterogeneous classroom. Teachers working in this model are able to more easily focus on
students with special needs when they are grouped, as opposed to being scattered throughout the
classrooms (Toth, 1999). Cluster grouping is an effective intervention when resources are not
available to support a full-time gifted program (Rogers, 1991). Gentry and Owen conducted a
scientific study analyzing the impact of cluster grouping, finding that students at all achievement

Auerbach 30
levels benefited from differentiated instruction and content accompanied by cluster grouping
(Gentry, 1999). Cluster grouping places together several high-ability students within a mixed-
ability classroom, providing differentiated curriculum and instruction to these students (Gentry,
1999). It is important to remember that ability grouping on its own does little to promote gains in
achievement: Gains are only seen when the groups experience differentiated content and pace of
learning (Kulik, 1992).
The Orange County school system relies heavily on cluster grouping to serve its gifted
students throughout the school day. Teachers emphasized the importance of including high-
achieving students who lack formal AIG identification in gifted programming, adding that AIG-
identified students will not always be high-achieving in all areas at all times. Therefore, flexible
grouping models that allow all students demonstrating mastery to participate in extended and
enriched curriculum will be crucial for Orange County Schools moving forward. These models
serve the additional purpose of reaching students from underrepresented populations who for
various reasons are not formally identified as gifted. All schools included in the study used
cluster grouping either in the form of AIG co-teaching, push-in models, or differentiated
instruction. These models make AIG specialists more of a resource for the entire school, rather
than for a select group of students.
Special grouping creates an entire class for students of similar ability for a specific
academic subject. All schools in the district employ a full-time AIG specialist who teaches such
classes as necessary, though it is important to consider that not all schools will have this
capability. Students may be identified with different abilities for different subjects, and served
accordingly. Teachers serving only students identified as gifted can apply certain techniques that
might not be effective in a general ability classroom, such as enrichment groups and off-campus
Auerbach 31
opportunities (Delisle, 1999). Special grouping has the advantage of freeing the instructor to
apply an accelerated approach to the entire classroom, creating a competitive “peer effect”
among the students (Bui, 2012). This effect can be especially substantial for underachievers, who
step out of underachievement when placed with cognitive like peers (Rimm, 1998). However,
this competition may cause negative effects for students who suffer a reduction in their “self-
concept,” or perception of oneself relative to one’s peers. It is possible that the drop in ranking
relative to one’s peers offsets the expected positive impact of more rigorous courses, more
effective teachers, and higher-achieving peers in gifted programs (Bui, 2012). It follows that
reductions in student growth may occur when placed in a higher achieving environment.
In Orange County Schools, special classrooms are used occasionally at the elementary
school level and consistently at the middle school level. Some schools pull students out to special
classrooms if they are part of the AIG program, whereas others include students who “compact
out” based on pre-assessment. Elementary schools often use pull-out models for AIG students in
reading, and compacting models for all high achieving students in math. This is partly due to the
fact that it is generally easier to pre-test in math than in reading. All three middle schools employ
an accelerated sixth grade English language class for AIG students identified in reading, taught
by the AIG specialist. Math courses are also special grouped based on ability, though these may
or may not correlate directly with AIG identification. AIG instructors collaborate with science
and social studies teachers to provide accelerated curriculum for AIG students within those
courses, though separate classes are not available.
Tracking is full-time ability grouping for regular instruction, placing students of different
abilities in separate classrooms for the majority of their academic classes (Toth, 1999). While
studies show that tracking has no discernible impact on the academic achievement of average

Auerbach 32
and low ability students, the gains for gifted students are substantial (Toth, 1999). While some
contend the equity of tracking due to potential bias in teacher and student selection, research
contends that achievement gains are likely due to the interaction of “greater degrees of learning
potential, teachers who are interested in their students and their subject, and the willingness of
gifted students to learn while in a classroom with other interested, high ability learners” (Toth,
1999). Across all forms of ability grouping, what is clear is that the grouping itself does not
cause academic gains; but rather the ability of the teacher to meet the students’ needs through
differentiation does (Toth, 1999). Tracking theoretically should maintain students’ growth over
time by continuing to challenge the student academically and place students of similar ability
together to challenge each other.
In Orange County Schools, tracking is used at the middle school level to place students in
a series of courses that matches their abilities. Tracking is particularly prominent in math,
enabling students to enroll in high school level courses during middle school. Teachers
interviewed expressed concern that some students who qualify for difficult tracks based on
department requirements may experience difficulty in those courses and be unable to catch up
once placed in the accelerated group. Unlike grouping, which provides flexibility on a day-to-
day or unit-by-unit basis, tracking assumes that students who qualify at a certain level will
continue to achieve at that level with even more challenging curriculum. Taking high school
level courses in middle school presents additional hurdles for students, who must adapt to a
different schedule as well as transportation challenges. Middle schools in Orange County
Schools use year-long schedules, whereas the high school uses a semester-long schedule. This
means that middle schoolers attempting to take classes at the high school must condense their

Auerbach 33
learning into a shorter period without the processing time to which they are accustomed, on top
of an already rigorous curriculum.
Enrichment and acceleration are two other methods of AIG-specific instruction.
Enrichment may take many forms in gifted education programs, including classroom pull-out,
curriculum compacting, and independent study. Pull-out programs remove identified students
from the general classroom, providing a specialized environment in which to extend and apply
the class lesson in a different way (Toth, 1999). Enrichment activities may encourage students to
pursue a personal interest arising from the curriculum. Curriculum compacting involves the
elimination of material previously mastered by the student, increasing the challenge level and
allowing for a faster pace of learning (Toth, 1999). This method can have a significant reversal
effect on underachievement by incentivizing students to complete assignments quickly and to the
best of their ability. Once students have demonstrated subject mastery, they are able to extend
their knowledge by applying the concept to a project meeting their own interests (Toth, 1999). A
study conducted by The National Research Center on the Gifted and Talented concluded that
students with a compacted curriculum “significantly outperformed” their counterparts on
standardized tests while also gaining better attitudes and higher preferences for the subject matter
(Toth, 1999).
Acceleration advances a student to a higher grade either by early admission, grade-
skipping, early graduation, or concurrent enrollment in another institution (Toth, 1999). When
appropriate, acceleration can be highly beneficial for students who are well above their age-
peers. Placing these students in a more challenging environment not only encourages academic
engagement, but also provides experience and teaches acceptance of failure. Given the
previously mentioned psychological effects of giftedness, teaching students to meet challenges,

Auerbach 34
including hard work and risk of failure, is a crucial component of gifted education. Gifted
education authors have gone so far as to assert that failing to provide a challenging environment
teaches children to underachieve by allowing them to succeed without trying (Toth, 1999).
Acceleration provides one option for continuing to push students to meet their potential.
Enrichment and academic acceleration can be beneficial to all students (Phillips, 2008).
Continuous progress models accept that students may have different levels of proficiency in
various subjects, and allow flexibility for these students to pursue these subjects at different
speeds. By meeting individual learning needs as necessary, a student’s education is more
relevant and meaningful (Phillips. 2008). Teaching methods such as open-ended assignments,
opportunities for collaboration, tiered assignments, independent projects, books that extend the
curricula, and school-wide enrichment can be beneficial to all students in the classroom
(Renzulli, 2008).
Research shows that acceleration, when used with ability grouping, has stronger effects
on student learning than enrichment alone (Kettler, 2003). Accelerative opportunities have been
shown to enhance learning, motivation, and extracurricular involvement for students learning
above their age-peers (VanTassel-Baska, 2005). Gifted students learn and process new
information faster than their peers, retain information taught at two to three times the normal
pace, and lose content when reviewed more than two or three times (Kettler, 2003).
Differentiated curriculum, sufficiently different from the norm to justify its specialized
implementation, challenges gifted students to think in-depth on multiple levels (VanTassel-
Baska, 2005). Tailoring classroom activities to student strengths and interests can help reverse
academic underachievement and bolster success by acknowledging that students are gifted
during all hours of the day, not just during the times set aside for gifted-specific programs (Reiss,

Auerbach 35
2000). To be successful in this model, teachers should be able to engage in high-level
questioning with their students, demonstrate mastery in subject matter examinations, and manage
multiple learning objectives and demands at the same time (VanTassel-Baska, 2005).
Overall, AIG specialists in Orange County Schools emphasized the importance of
building gifted instruction into general classroom practices. As one teacher stated, “Best
practices in gifted education are really best practices for most learning styles.” Enriching and
extending the curriculum to provide additional levels of depth can benefit all students, not only
the gifted. However, it is especially important to make sure that gifted students’ needs are met
through rigorous, challenging curriculum that encourages independent thinking and reasoning.
Several teachers emphasized the need to prepare gifted students for the real world by focusing on
personal development rather than academic development. Some argue that gifted students need
more emphasis on rigor and persevering through challenges rather than pure academic learning,
especially in elementary school when they are likely to have already mastered the material. In
this way, AIG specialists can take advantage of special classrooms to work on developing skills
that gifted and very high achieving students might not develop in other classrooms.
How do general classroom instructional methods, specifically differentiated instruction, impact
AIG student growth?
Differentiated instruction is an alternative method to gifted-only instruction and is
currently used in North Carolina as a method of reaching diverse student populations (North
Carolina Department of Public Instruction, 2009). Differentiated instruction uses various
instructional methods to meet the needs of all students in the classroom. It is an individual-
centered education in which each student influences both his content and pace of learning.

Auerbach 36
Differentiated instruction relies on an instructor who is familiar with her students and can plan
and deliver customized lessons. Teacher quality and classroom support is crucial to the success
of this system. Pre-assessment is an essential aspect of differentiated instruction, using different
groupings of students to challenge and enhance learning for each student. Pre-assessment helps
determine the baseline for a given course material and identify the speed necessary for the
student to achieve mastery (Willoughby, 2005). Recognizing that all students do not learn at the
same speed, instructors can accelerate or decelerate the standard curriculum based on the pre-
assessment (VanTassel-Baska, 2005). Essentially, instructors determine the objectives for the
given lesson, activities for students at grade level to achieve the objectives, and activities at
various levels above the average for advanced students to achieve the objectives at increasing
levels of complexity (Kettler, 2003). For example, all students may learn the basic grade level
concept of addition. While the basic students work through the concept with several repetitions,
the advanced students apply the concept to above grade-level problems. All students learn the
same concept and achieve the grade-level objectives, though not at the expense of the advanced
students (Kettler, 2003).
An experiment with differentiated instruction in Topsail, North Carolina yielded a 15.8%
increase in student proficiency (Lewis, 2005). Teacher training and administrative support was
needed to adjust the curriculum, teaching strategies, and classroom environment to meet the
needs of students. Educators modified the content, process, and end product for students, and
obtained positive results. Teachers used a combination of the following methods:
• Flexible learning groups: mixing students based on the day’s lesson or activity
• Learning centers: stations individualized to the subject at hand
• Independent contracts: agreements between each student and the teacher

Auerbach 37
• Adjusting questions based on mastery
• Thematic units integrating different disciplines
• Compacting the regular curriculum for students who have achieved mastery
• Independent study for students with special interests
• Tiered assignments: designed at different levels of complexity according to student
readiness
Teachers are embracing the new technique of facilitating rather than lecturing, and student
achievement is rising across all racial and socioeconomic groups. Students identified as gifted
are achieving growth, though at slower rates than other groups (Lewis, 2005).
Orange County Schools has emphasized differentiation as an effective teaching technique
in recent years. AIG specialists aid this process by participating in co-teaching and shifting to
push-in models of instruction. Co-teaching pairs the AIG specialist with another teacher for a
certain class period, enabling instructors to focus on different groups of students. Similarly, AIG
push-in brings the AIG specialist into the classroom to work with all students who have
demonstrated mastery on the material based on pre-testing. In both co-teaching and push-in
models, the AIG specialist provides extended and enriched curriculum for high achieving
students while the general teacher works with struggling students to meet their needs. Teachers
in the district spoke favorably of these methods, as they reduce the stigma associated with
various labels and create a more cohesive classroom environment. Co-teaching and push-in
models also allow for increased flexibility to better serve students who may not have qualified
for the AIG program, yet have the potential to be identified and are achieving at a high level.
Finally, these models keep all students engaged in the same material while at different levels,
reducing the disconnect between gifted and general curriculum and maintaining a continuity of

Auerbach 38
instruction. By doing so, teachers can more easily identify holes in gifted student knowledge and
fill those gaps prior to standardized testing.
What factors outside of school impact AIG student growth?
Gifted students often exhibit several unique characteristics that put them at risk for
underachievement. Gifted students are more likely to receive frequent ability-focused praise,
endure high expectations from parents and teachers, and experience pressures associated with
being identified as gifted (Snyder, 2012). In addition, gifted students tend to consider academics
a primary factor in identity creation. Failure in this area is greatly related to one’s conception of
personal failure under this paradigm. Therefore, gifted students may disengage from academics
in order to protect themselves from the possibility of failure and subsequent loss of self-worth.
Academic acceleration or increased challenge may exacerbate the student’s incentive to
disengage due to the risk of failure (Snyder, 2012). Underachievement is often associated with
perfectionism, stress, and a diminished locus of control by which the student does not feel able to
control the outcomes of personal efforts (Baker, 1998). Multiple studies suggest that the home
environment may influence many of these psychological processes. According to one of these
studies, “families of achievers and underachievers exhibit differences on variables important to
supporting children’s behavior,” such as fostering self-confidence and encouraging risk-taking
(Baker, 1998). Family structures that instill these qualities in gifted children provide a more solid
base upon which the school and AIG program can build.
Underachievement is a function of both the student and the program in which he or she is
participating. Often, underachievement is brought upon by an unchallenging academic
curriculum that in turn reduces gifted students’ academic motivation (Snyder, 2012). Many

Auerbach 39
gifted students develop intense interests outside of school, leading to boredom and a lack of
interest in class. For this reason, it is recommended that gifted programs allow students to
investigate these interests through enrichment to enhance student motivation and reverse
negative attitudes about school (Reiss, 2000). Inflexible curricular requirements, age-grouping
rather than ability-grouping, and lack of acceleration opportunities have also been linked to
underachievement (Fehrenbach, 1993). Students must be able to demonstrate what they already
know and are able to do, and then proceed to be challenged with curriculum that is “slightly
beyond their grasp and requires significant effort to master” (Winebrenner, 2001). When students
are able to learn about areas of high interest using complex methods beyond their age-peers, they
feel an increased sense of connection with the material and are more likely to find real-world
applications (Winebrenner, 2001). Matching the child’s school environment and pedagogical
method with his or her learning style is crucial to engaging the student (Baker, 1998).
In addition to the factors mentioned above, teachers in Orange County Schools noted that
family background, student interest in school, and involvement outside of school have great
impacts on student learning and growth. Middle school students in particular encounter a
plethora of new experiences during their middle school years that impact academic achievement.
Many physical and psychological changes occurring at this time distract students from school,
resulting in stagnated growth. Gifted students are also more likely to take high school level
courses during middle school. These classes present additional challenges and encourage
students to overlook grade-level material tested on the EOG in favor of credit-rendering material
tested in other ways. The seventh grade dip in math achievement (apparent in Figure A) might be
attributed to the fact that seventh grade is the first year students participate in school athletic
teams and encounter in-depth laboratory science classes. Between athletics and new challenges

Auerbach 40
in other courses, such as hands-on laboratory work in science, middle school students simply
might not have the energy to perform up to their usual standards in subjects such as math and
reading. As one teacher noted when interviewed, “Middle schoolers are notorious for being very
tunnel-visioned and focused on certain things, and so if that’s their first time in science
experiencing hands-on dissection, labs, those sorts of things, then between their athletics and
their science, that might be all they’ve got.”
What metrics should be used to assess AIG student learning?
As discussed in the section on AIG identification practices, gifted students by definition
should perform one to two grade levels above their age peers. Therefore, grade-level assessments
are an illogical choice for measuring gifted student learning. Teachers in Orange County Schools
unanimously agreed that state-wide standardized test scores are not an accurate measure of AIG
student learning and that the DPI-calculated test score growth index is not an accurate measure
of AIG student ability and achievement.
With any test, potential errors of measurement include sampling errors, student mood and
health on test day, and discontinuity between classroom experience and material on the exam
(Reiss 2000). In addition, many gifted students lack the motivation to perform to the best of their
abilities on standardized exams for a variety of reasons. Firstly, gifted students are generally
confident enough in their own abilities to know that they will achieve a minimum standard. If
students have no additional incentive to perform beyond this minimum, many will not (Emerick,
1992). Some teachers also suggested that gifted students tend to feel that standard rules do not
apply to them, and will not try their best for this reason. Parents, peers and even teachers may not
emphasize the importance of these exams for gifted students, further decreasing motivation.
Auerbach 41
Many teachers argued that standardized tests in general are an inaccurate portrayal of
gifted student achievement. Gifted students tend to think in unconventional ways that are not
measured by standardized assessments, and gifted programs further encourage thinking styles
more creative and independent than can be displayed on such exams. Reactive assessments that
adjust the difficulty of questions beyond grade level based on student answers provide one
solution to this problem, as do open-ended assessments that involve reasoning and deeper
thinking skills.
Despite these arguments, teachers generally agreed that students who typically perform
well in the classroom tend to perform well on the EOG. Reasons cited include increased
engagement in class and interest in the material, as well as greater social adjustment and support
from home. The personalities of the children also come into play, as those who hold themselves
to very high standards usually perform better than those who only perform well when they deem
necessary. Some variation occurs with cultural or language bias, as well as with perfectionist
students who unintentionally lower their scores by second-guessing their instincts and changing
answers when checking over the exam. Middle school teachers noted that AIG students are often
enrolled in advanced coursework that does not match with the content of the grade-level EOG
exam. Therefore, students might do well in class but not on the EOG, or vice versa. Some
students struggle with the advanced material but continue to retain mastery of grade-level
material, whereas others succeed in the advanced coursework at the expense of retaining the
basics.
In terms of the specific measure analyzed in this study, test score growth, teachers either
felt that it was an inaccurate portrayal of gifted student learning or could not comment due to
confusion regarding the calculation. Representatives from the North Carolina Department of

Auerbach 42
Public Instruction (DPI) agreed that teacher confusion is one reason why the index is not used for
individual student evaluation, though it is used for high stakes teacher and school evaluation.
Both teachers and representatives from DPI argued that it is extremely difficult, and in fact
unexpected, for gifted students to show positive growth on the index. Gifted students are, by
definition, in the top five percent or so of the population. Therefore, it is nearly impossible for
these students to move more than a few percentage points, if at all. While a score of “0,” or
meeting growth, is obviously preferred to showing negative growth, those interviewed felt that as
long as gifted students didn’t show multiple years of negative growth the measure was not
indicative of underperformance. This is because the index is based on performance relative to the
average grade-level performance in the standard-setting year, and students who initially score
very highly relative to the baseline are likely to drop in subsequent years. While the index takes
this trend into account with its regression to the mean adjustment, gifted students may have a
larger regression to the mean that the rest of the population due to their relatively high starting
point. Therefore, some amount of negative growth could be expected for this specific group of
students.
Most teachers saw trends among those students who met their growth targets and those
who did not. Students meeting growth generally were more engaged in class, determined to
succeed in school, and supported by teacher and parent relationships. Students not meeting
growth either failed to exhibit these qualities or started with such high numbers that growth was
nearly impossible. As one teacher noted, students with weaker starting points have an advantage
over initially stronger students when aiming to make growth targets. Therefore, recently
identified students or those receiving gifted services without formal identification tend to show
higher levels of growth. Other teachers asserted that growth scores were “baffling” and did not

Auerbach 43
correlate at all with classroom performance. These teachers felt that not only was the growth
index difficult to interpret, but also failed to accurately represent actual student growth from the
beginning to end of the year.
Conclusion: Implications for Orange County Schools and Beyond
This review highlights the achievement of AIG students in Orange County Schools by
analyzing test score growth data and interpreting teacher comments. Several points can be of use
to both Orange County Schools and other school systems looking to improve gifted education
services. Firstly, it is important to note that the binary categories of AIG and non-AIG are not a
completely accurate division. Some students are on the brink of being identified but do not cross
the threshold, some are identified in one subject but not another, and all students are identified
through different means. While much of the information provided in this research is applicable to
high potential students regardless of formal identification, schools should note the need to be
flexible in service provision. Given this reality, Orange County Schools has shifted its focus
away from exclusive pull-out programs to classroom differentiation, co-teaching, and
compacting based on pre-assessment rather than identification. These inclusive models extend
the reach of gifted services to traditionally underserved populations and create flexible
environments for both identified and non-identified students to receive appropriate instruction.
Teachers are very supportive of this shift, and the literature surrounding gifted student needs also
verifies the importance of adaptable models for different students, classes, and subjects.
The evidence here suggests a revision to Orange County Schools’ AIG identification
methods to include more holistic, teacher-driven, and non-test based evaluations. Since gifted
students have unique qualities that impact standardized test scores, evaluation from teachers and

Auerbach 44
specialists with more contact with the student can provide better information. Both teachers and
representatives from DPI argued that it is extremely difficult, and in fact unexpected, for gifted
students to show positive growth using current measures. Those interviewed felt that as long as
gifted students didn’t show multiple years of negative growth, that statistic was not in fact
indicative of underperformance. Therefore, a shift in the definition of performance for both
gifted identification and overall student achievement is necessary.
Recommendations
For General Classroom Teachers:
• Differentiate curriculum to meet the needs of gifted students in all subjects, every day,
apart from time with AIG specialist
• Increase the use of informal assessment to gauge student learning throughout the unit
• Engage gifted students in schoolwork by connecting the curriculum to their world and
interests
• Recognize gifted qualities in students and provide recommendations for placement
• Provide comprehensive and accurate evaluations for all students to ensure appropriate
identification
For Gifted Specialists:
• Increase focus on general teacher training for gifted service delivery in all classrooms
• Expand reach into younger grade levels to capture underserved populations before gaps
widen
• Differentiate within gifted instruction to meet the needs of the broad spectrum of gifted
students, including those identified through alternative means

Auerbach 45
• Continue to develop push-in and co-teaching methods to create a collaborative
environment between AIG and other programs within the school
• Help teachers and parents understand the qualities and needs of the truly gifted
• Provide instruction of sufficient rigor to enable gifted students to push themselves beyond
grade level achievement and develop the mental capacities to meet challenges
For School Administrators:
• Recognize the limitations of standardized testing, especially in regards to gifted students,
and consider reactive testing that goes beyond grade level material for high scorers
• Reduce the emphasis on the test score growth index for high stakes evaluation
• Adjust AIG identification practices to better reflect holistic student qualities
• Remove the EOG from AIG identification
• Reevaluate AIG students periodically for appropriate service placement
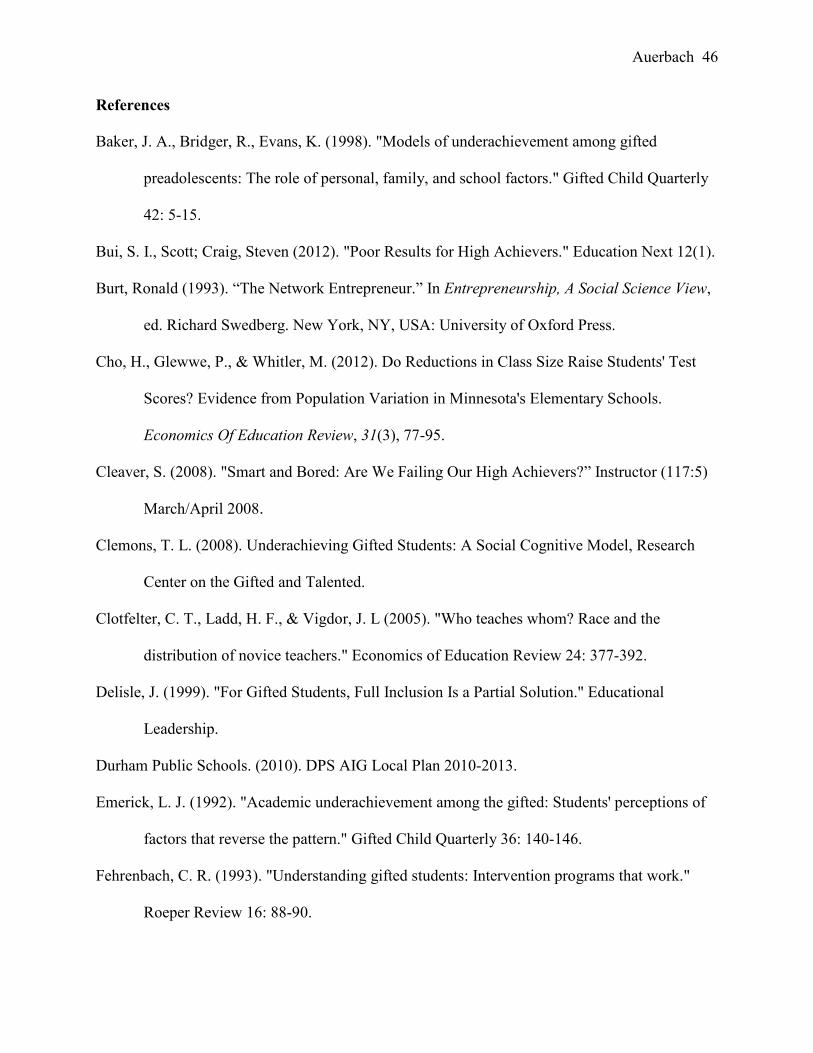
Auerbach 46
References
Baker, J. A., Bridger, R., Evans, K. (1998). "Models of underachievement among gifted
preadolescents: The role of personal, family, and school factors." Gifted Child Quarterly
42: 5-15.
Bui, S. I., Scott; Craig, Steven (2012). "Poor Results for High Achievers." Education Next 12(1).
Burt, Ronald (1993). “The Network Entrepreneur.” In Entrepreneurship, A Social Science View,
ed. Richard Swedberg. New York, NY, USA: University of Oxford Press.
Cho, H., Glewwe, P., & Whitler, M. (2012). Do Reductions in Class Size Raise Students' Test
Scores? Evidence from Population Variation in Minnesota's Elementary Schools.
Economics Of Education Review, 31(3), 77-95.
Cleaver, S. (2008). "Smart and Bored: Are We Failing Our High Achievers?” Instructor (117:5)
March/April 2008.
Clemons, T. L. (2008). Underachieving Gifted Students: A Social Cognitive Model, Research
Center on the Gifted and Talented.
Clotfelter, C. T., Ladd, H. F., & Vigdor, J. L (2005). "Who teaches whom? Race and the
distribution of novice teachers." Economics of Education Review 24: 377-392.
Delisle, J. (1999). "For Gifted Students, Full Inclusion Is a Partial Solution." Educational
Leadership.
Durham Public Schools. (2010). DPS AIG Local Plan 2010-2013.
Emerick, L. J. (1992). "Academic underachievement among the gifted: Students' perceptions of
factors that reverse the pattern." Gifted Child Quarterly 36: 140-146.
Fehrenbach, C. R. (1993). "Understanding gifted students: Intervention programs that work."
Roeper Review 16: 88-90.

Auerbach 47
Gentry, M. and S. V. Owen (1999). "An Investigation of the Effects of Total School Flexible
Cluster Grouping on Identification, Achievement, and Classroom Practices." Gifted Child
Quarterly 43(4): 224-243.
Godwin, R. K. K., F.R. (2002). School choice tradeoffs: liberty, equity and diversity. Austin,
University of Texas Press.
Hoffman, J. L., Wasson, F. R., & Christianson, B. P. (1985). Personal development for the
gifted underachiever. Gifted Child Today, 8(3), 12–14.
Kettler, T. C., Marc (2003). "Mathematical Acceleration in a Mixed-Ability Classroom:
Applying a Tiered Objectives Model." Gifted Child Today 26(1).
Krueger (2001). "The Effect of Attending a Small Class in the Early Grades on College - Test
Taking and Middle School Results: Evidence from the Project STAR." The Economic
Journal 111: 1-28.
Kulik, J. (1992). "An Analysis of the Research on Ability Grouping: Historical and
Contemporary Perspectives."
Lee, J. (2011). Review of "Do High Flyers Maintain Their Altitude? "University at Buffalo,
SUNY.
Lewis, S. B., Kelly (2005). "How to Implement Differentiated Instruction?" Journal of Staff
Development 26(4).
North Carolina Center for Education Statistics. (2007). The Condition of Education. Washington,
DC, U.S. Department of Education.
North Carolina Department of Public Instruction. (2009). North Carolina Academically or
Intellectually Gifted Program Standards. Public Schools of North Carolina State Board of
Education. Raleigh, NC.

Auerbach 48
North Carolina Department of Public Instruction Accountability Services. (2011). The ABCs of
Public Education: Academic Change for Schools 2010-2011.
North Carolina Public Schools. (2011). NC School Report Cards - Orange County Schools 2010-
2011.
Orange County Board of Education. (2010). Orange County Schools 2010-2013 Plan for
Academically or Intellectually Gifted Program.
Orange County LEA. (2011). Local Education Agency Improvement Plan.
Orange County Schools. (2012). Academically or Intellectually Gifted Program - Brochure.
Phillips, S. (2008). "Are We Holding Back Our Students that Possess the Potential to Excel?"
Education 129(1).
Reis, S. M., D. Betsy (2000). "The Underachievement of Gifted Students: What Do We Know
and Where Do We Go?" Gifted Child Quarterly 44(3): 152-170.
Renzulli, J. (2008). "Teach to the Top." Instructor 117(5).
Rimm, S. D., Gary (1998). Education of the Gifted and Talented. Needham Heights, MA, Allyn
and Bacon.
Richert, E. S. (1991). Patterns of underachievement among gifted students. In J. H. Borland
(Series Ed.), M. Bireley, & J. Genshaft (Vol. Eds.), Understanding the gifted adolescent
(pp. 139–162). New York: Teacher College Press.
Rogers, K. (1991). The Relationship of Grouping Practices to the Education of the Gifted and
Talented Learner. Storrs, Connecticut, National Research Center on the Gifted and
Talented.
Slate, J., Jones, C. (2005). "Effects of School Size: A Review of the Literature with
Recommendations." Essays in Education.

Auerbach 49
Snyder, K. L.-G., Lisa (2012). A Dynamic Systems Approach to Exploring Multiple
Motivational Pathways in Gifted Underachievement, Duke University.
Southworth, S. (2010). "Examining the Effects of School Composition on North Carolina
Student Achievement over Time." Education Policy Analysis Archives 1829.
Toth, N. (1993). Gifted Education: A Critical Discussion. Portales, New Mexico, Eastern New
Mexico University.
U. S. Census Bureau. (2010). Small Area Income and Poverty Estimates for North Carolina
School Districts.
VanTassel-Baska, J. (2005). "Gifted Programs and Services: What are the Non-Negotiables?"
Theory Into Practice 44(2): 90-97.
Willoughby, J. (2005). "Differentiating Instruction: Meeting Students Where They Are."
Glencoe Online. http://www.glencoe.com/sec/teachingtoday/subject/di_meeting.phtml
Winebrenner, S. (2001). Teaching Gifted Kids in the Regular Classroom: Strategies and
Techniques Every Teacher Can Use to Meet the Academic Needs of the Gifted and
Talented. Minneapolis, Free Spirit Publishing Co.
Wyner, J. S., Bridgeland, J. M., & Dilulio, J. J., Jr. (2007). “Achievement trap: How America
is failing millions of high-achieving students from lower-income families.”
Xiang, Y. D., Michael; Cronin, John; Theaker, Robert; Durant, Sarah (2011). Do High Flyers
Maintain Their Attitude? Performance Trends of Top Students, Thomas Fordham
Institute.

Auerbach 50
Appendices Appendix A. Sample Growth Score Calculation (from North Carolina Department of Public Instruction, 2010-2011).
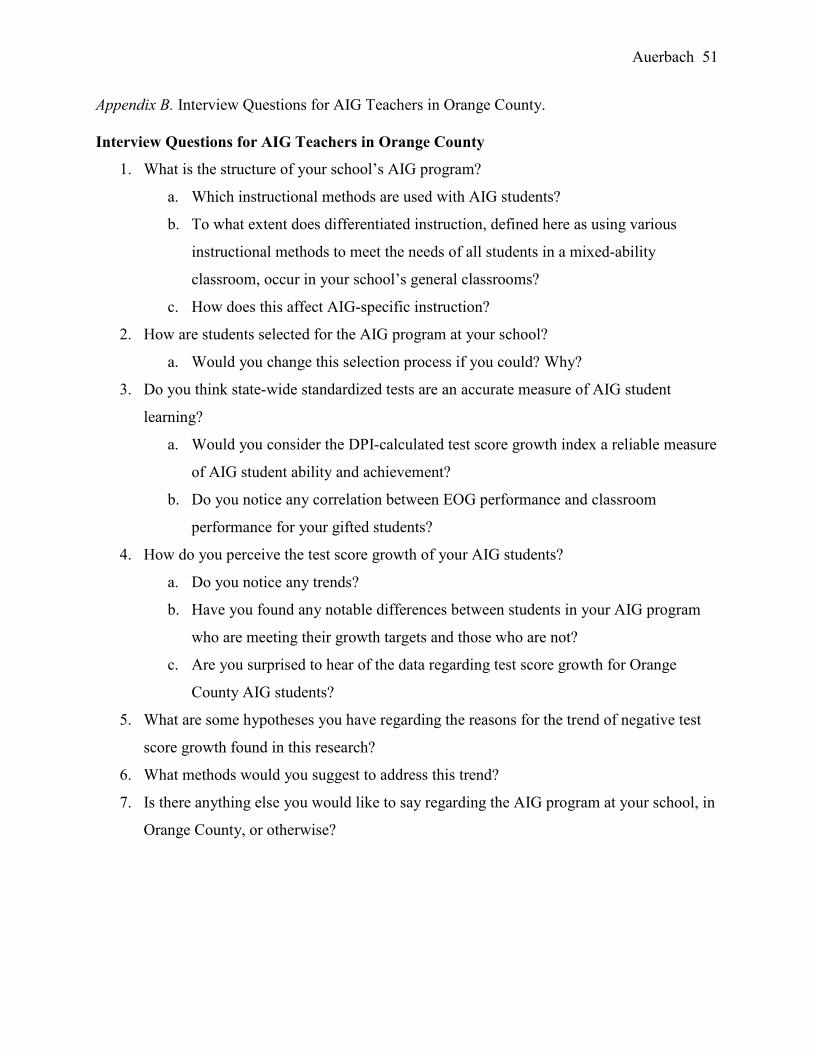
Auerbach 51
Appendix B. Interview Questions for AIG Teachers in Orange County. Interview Questions for AIG Teachers in Orange County
1. What is the structure of your school’s AIG program?
a. Which instructional methods are used with AIG students?
b. To what extent does differentiated instruction, defined here as using various
instructional methods to meet the needs of all students in a mixed-ability
classroom, occur in your school’s general classrooms?
c. How does this affect AIG-specific instruction?
2. How are students selected for the AIG program at your school?
a. Would you change this selection process if you could? Why?
3. Do you think state-wide standardized tests are an accurate measure of AIG student
learning?
a. Would you consider the DPI-calculated test score growth index a reliable measure
of AIG student ability and achievement?
b. Do you notice any correlation between EOG performance and classroom
performance for your gifted students?
4. How do you perceive the test score growth of your AIG students?
a. Do you notice any trends?
b. Have you found any notable differences between students in your AIG program
who are meeting their growth targets and those who are not?
c. Are you surprised to hear of the data regarding test score growth for Orange
County AIG students?
5. What are some hypotheses you have regarding the reasons for the trend of negative test
score growth found in this research?
6. What methods would you suggest to address this trend?
7. Is there anything else you would like to say regarding the AIG program at your school, in
Orange County, or otherwise?

Auerbach 52
Appendix C. Participant Consent Form for AIG Teachers in Orange County.
Thank you for choosing to participate in this research project as an educator of gifted students in
Orange County Schools. As you know, I am a student at Duke University conducting this
research in collaboration with the Orange County Division of Testing and Accountability. This
research seeks to identify the school and program-level factors impacting the performance of
Orange County’s academically and intellectually gifted students on the End of Grade tests.
Given that initial data analysis yielded inconclusive results, the second phase of the research
involves teacher interviews to delve deeper into the Orange County AIG program. The interview
aims to address the central question: How do academically and intellectually gifted identification
practices, instructional methods, and student characteristics in Orange County Schools impact
student growth rates on standardized tests?
The interview consists of 7 questions and should take approximately 20 minutes. Feel free to be
candid in your responses, as your expertise and knowledge of the students in Orange County is
invaluable to our study.
In my report, I will identify the schools where I conducted interviews. Your name will not be
used in the report, though you may be identified through your association with a particular
school. You may choose to keep some information “off the record,” meaning that it will only be
used in general discussion and not linked to a specific school.
If you have any questions about the purpose of the study, the use of the interviews, or
confidentiality, please ask me now. You may also contact either myself or my faculty advisor via
email at [email address removed] or [email address removed].
Signed ______________________________ Date ______________

Auerbach 53
Appendix D. Chart of Correlations between Quantitative Factors and Gifted Growth (r values). AvRe –
E AvMa – E
AvRe – M
AvMa – M
%NRe – E
%NMa – E
%NRe – M
%NMa - M
School size -0.1559 -0.6262 0.3489 0.2186 0.5148 0.3509 -0.4140 -0.2620
Class size 0.0956 -0.7073 0.1014 0.0058 0.7040 0.5744 0.0760 -0.0810 Program size (R/M)
-0.3692 -0.1915 0.2151 0.0289 0.3299 0.3053 -0.0713 -0.0045
SchoolEOG (R/M)
-0.6407 -0.3602 0.0794 0.3425 -0.2885 0.2253 0.1380 -0.2492
NBC Teachers
-0.7352 -0.1090 -0.3341 0.0226 -0.1844 -0.0253 0.5616 0.0754
Key AvRe = Average Growth Score on Reading AvMa = Average Growth Score on Math %NRe = % AIG Students Showing Negative Growth on Reading %NMa = % AIG Students Showing Negative Growth on Math E = Elementary schools M = Middle schools R = Reading M = Math NBC = National Board Certified Bold = Strong correlation (greater than or equal to the absolute value of 0.4)