ghosh 2016 waste management in usa.pdf
TRANSCRIPT

AUTHOR(S):
TITLE:
YEAR:
Publisher citation:
OpenAIR citation:
Publisher copyright statement:
OpenAIR takedown statement:
This publication is made freely available under ________ open access.
This is the ___________________ version of proceedings originally published by _____________________________ and presented at ________________________________________________________________________________ (ISBN __________________; eISBN __________________; ISSN __________).
This publication is distributed under a CC ____________ license.
____________________________________________________
Section 6 of the “Repository policy for OpenAIR @ RGU” (available from http://www.rgu.ac.uk/staff-and-current-students/library/library-policies/repository-policies) provides guidance on the criteria under which RGU will consider withdrawing material from OpenAIR. If you believe that this item is subject to any of these criteria, or for any other reason should not be held on OpenAIR, then please contact [email protected] with the details of the item and the nature of your complaint.

Waste Management in USA through case studies: E-waste recycling and waste to energy
plant
Sadhan Kumar Ghosh1*, Joonheon Lee 2, Achi Chibueze Godwin 3,
Adekunle Oke 4, Reem Al-Rawi 5, Mervat El-Hoz 6
1Professor, Department of Mechanical Engineering, Jadavpur University, Kolkata, India and
President, International Society of Waste Management, Air and Water
2Research Scholar, Energy Resources Processing Lab, Seoul National University,
Korea, [email protected]
3PhD Student, Civil Engineering Dept, University of Ibadan, Nigeria, [email protected],
4Research Scholar, The Robert Gordon University, Aberdeen,
Scotland, UK, [email protected]
5Dams and Water Res. Engg. Dept, Salahaddin University, Erbil –
Iraq, [email protected]
6 Associate Professor, University of Balamand, Lebanon, [email protected]
*Corresponding author. Tel: +919830044464, E-mail: [email protected]
Keywords: WTE plant, WEEE recycling, Sustainability, Supply Chain
Abstract: 512
1. Introduction
Current global MSW generation levels are approximately 1.3 billion tonnes per year,
and are expected to increase to approximately 2.2 billion tonnes per year by 2025. This
represents a significant increase in per capita waste generation rates, from 1.2 to 1.42 kg per
person per day in the next fifteen years. However, global averages are broad estimates only as
rates vary considerably by region, country, city, and even within cities. (Hoornwegand 2012).
In 2014, the global production of e-waste was estimated (see Figure 1) at 41.8 million tonnes
(Mt) with a projection of about 21% increase to 50 million tonnes (Mt) in 2018 (Baldé et al.
2015). India, the fifth biggest producer of e-waste (behind the USA, China, Japan and
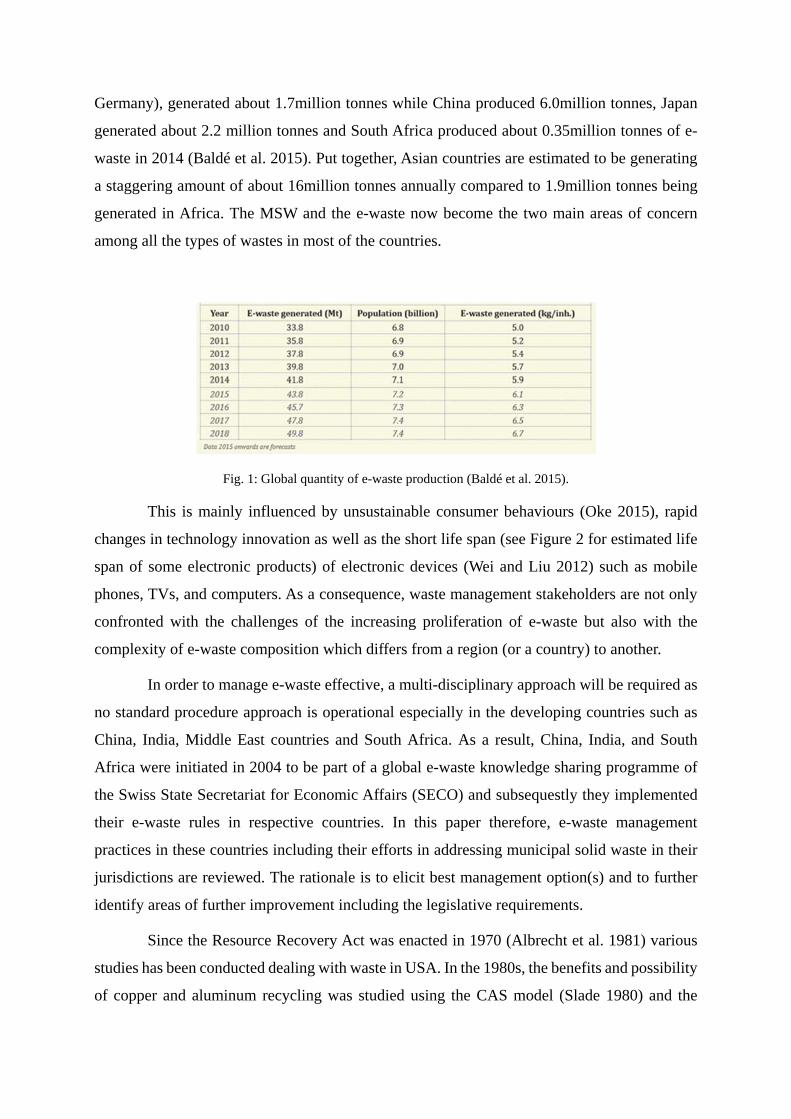
Germany), generated about 1.7million tonnes while China produced 6.0million tonnes, Japan
generated about 2.2 million tonnes and South Africa produced about 0.35million tonnes of e-
waste in 2014 (Baldé et al. 2015). Put together, Asian countries are estimated to be generating
a staggering amount of about 16million tonnes annually compared to 1.9million tonnes being
generated in Africa. The MSW and the e-waste now become the two main areas of concern
among all the types of wastes in most of the countries.
Fig. 1: Global quantity of e-waste production (Baldé et al. 2015).
This is mainly influenced by unsustainable consumer behaviours (Oke 2015), rapid
changes in technology innovation as well as the short life span (see Figure 2 for estimated life
span of some electronic products) of electronic devices (Wei and Liu 2012) such as mobile
phones, TVs, and computers. As a consequence, waste management stakeholders are not only
confronted with the challenges of the increasing proliferation of e-waste but also with the
complexity of e-waste composition which differs from a region (or a country) to another.
In order to manage e-waste effective, a multi-disciplinary approach will be required as
no standard procedure approach is operational especially in the developing countries such as
China, India, Middle East countries and South Africa. As a result, China, India, and South
Africa were initiated in 2004 to be part of a global e-waste knowledge sharing programme of
the Swiss State Secretariat for Economic Affairs (SECO) and subsequestly they implemented
their e-waste rules in respective countries. In this paper therefore, e-waste management
practices in these countries including their efforts in addressing municipal solid waste in their
jurisdictions are reviewed. The rationale is to elicit best management option(s) and to further
identify areas of further improvement including the legislative requirements.
Since the Resource Recovery Act was enacted in 1970 (Albrecht et al. 1981) various
studies has been conducted dealing with waste in USA. In the 1980s, the benefits and possibility
of copper and aluminum recycling was studied using the CAS model (Slade 1980) and the

overall recycling policy, cost, statistical data and vision was analyzed (Albrecht et al. 1981). In
the 1990s, the generation rates of solid wastes were researched (Matsuto and Ham 1990) and
the study concluded that the substitution of 5% of bauxite for aluminum scrap could result in
savings of almost 0.25 billion dollars (Westenbarger et al. 1991). Also the possibility and future
vision of sustainable metal management was shown in 1999 by studying the case of copper in
the USA (Zeltner et al. 1999) and the residential curbside recycling program was examined
(Everett and Peirce 1993). Furthermore, specific materials’ recycling such as reclaimed asphalt
pavement and Portland cement concrete (Robinson 2004) was studied.
After 2010, the range of recycling studies widened. It was observed that there are
various factors influencing the recycling behavior in the workplace such as demographical and
psychological background. Even though the research was limited, results showed that the
combination of factors are important for an efficient workplace waste recycling. Therefore,
holistic strategies including the different contexts are still needed (Oke 2015). Also as the
necessity of recycling grew in the world, the study was conducted comparing several countries.
For example, investigation on the waste classification between China, EU, Japan and the USA
was done (Wen et al. 2014). Currently, these kind of case studies are main stream nowadays.
For example, the non-state e-waste recycling certification (Renckens 2015) or the employment
of waste and recycling in Florida using the Standard Industrial Code and the National
Establishment Time Series database (Park et al. 2015).
Though the e-waste has not been implemented in many countries, the rules pertaining to
management of MSW have been implemented in most of the developed and developing
countries. There are many ways by which the MSW is being managed, e.g., recycling,
composting, energy recovery, pyrolysis, gasification, biogas generation, land filling etc.
Similarly, there are many ways by which the e-waste is being managed, e.g., recycling, reuse,
energy and metal recovery, pyrolysis, trans-boundary business, land filling etc. This paper will
present the status of the WTE and WEEE recycling plants in the US and some other countries
and analyse their sustainability through two case studies, 1) 20 tpd e-waste recycling plant at
48th Street Transfer Station, 2) the 80 MW Covanta waste to energy plant in Philadelphia,
USA based on the study visit in 30th ICSW 2015 in March 2015 by the delegates of the
conference.
Global Waste Generation
Waste generation varies as a function of affluence, however, regional and country

variations can be significant, as can generation rates within the same city. Waste generation in
sub-Saharan Africa is approximately 62 million tonnes per year. Per capita waste generation is
generally low in this region, but spans a wide range, from 0.09 to 3.0 kg per person per day,
with an average of 0.65 kg/capita/day. The countries with the highest per capita rates are islands,
likely due to waste generated by the tourism industry, and a more complete accounting of all
wastes generated. The annual waste generation in East Asia and the Pacific Region is
approximately 270 million tonnes per year. This quantity is mainly influenced by waste
generation in China, which makes up 70% of the regional total. Per capita waste generation
ranges from 0.44 to 4.3 kg per person per day for the region, with an average of 0.95
kg/capita/day (Hoornweg et al. 2005, Debnath et al. 2014). In Eastern and Central Asia, the
waste generated per year is at least 93 million tonnes. Eight countries in this region have no
available data on waste generation in the literature. The per capita waste generation ranges from
0.29 to 2.1 kg per person per day, with an average of 1.1 kg/capita/day. Latin America and the
Caribbean has the most comprehensive and consistent data (e.g. PAHO’s Regional Evaluation
of Solid Waste Management, 2005). The total amount of waste generated per year in this region
is 160 million tonnes, with per capita values ranging from 0.1 to 14 kg/capita/ day, and an
average of 1.1 kg/capita/day. Similar to the high per capita waste generation rates on islands in
Africa, the largest per capita solid waste generation rates are found in the islands of the
Caribbean. In the Middle East and North Africa, solid waste generation is 63 million tonnes per
year. Per capita waste generation is 0.16 to 5.7 kg per person per day, and has an average of 1.1
kg/capita/day. The OECD countries generate 572 million tonnes of solid waste per year. The
per capita values range from 1.1 to 3.7 kg per person per day with an average of 2.2
kg/capita/day.
In South Asia, approximately 70 million tonnes of waste is generated per year, with per
capita values ranging from 0.12 to 5.1 kg per person per day and an average of 0.45
kg/capita/day. The global waste generation per region, where OECD countries make up almost
half of the world’s waste, while Africa and South Asia figure as the regions that produce the
least waste. India is a significant economy in Asia which generates more than 62 million tonnes
per year with an average per capita generation of 560 gms per day.
Municipal Waste Management and E-waste management in India
India generates nearly 62 million tonnes of MSW annually whereas per capita
generation of MSW is nearly 0.560 gms per day. The MSW generation growth is 1.33 %
annually. The MSW rules 2000 is in implementation for last 16 years in the country. There are

several initiatives to curb the problem of MSW in India, namely, composting, recycling, waste
to energy, Biogas generation, Pyrolysis, and many others. There are a few wastes to energy
plants and many biogas plants in the country. The complexity of e-waste scenarios in India
(Figure 3 for e-waste pathway in India) including the reasons for the increase in e-waste is well
documented in literature (Ghosh et al. 2014, Baldé et al. 2015; MPCB 2007; Wath, Dutt and
Chakrabarti 2011). Like many other developing nations, e-waste in India is often conducted in
slums and congested areas, managed by informal sector (Baldé et al. 2015; Robinson 2009;
Wilson et al. 2009) environmental hazards and human health.
Fig. 2: Life spans of electronic products (Source: USEPA 2014).

Fig.3: E-waste pathway in India (source: MPCB 2007; Wath, Dutt and Chakrabarti 2011).
According to Sepúlveda et al. (2010) and Wong et al. (2007), these techniques include,
(1) manual dismantling; (2) heating and manual removal of useful components; (3) open
burning of cables and wires for recovering metals; (4) chipping and melting of plastics; (5)
toner sweeping; (6) acid leaching of e-waste to recover precious metals. India implemented the
E-waste rules 2011 in the year 2012 and approved more than 100 e-waste recyclers in the
country. In addition, India is currently operating a take-back policy as part of Extended Producer
Responsibility (EPR) with participating companies such as Apple, Microsoft, Panasonic, PCS,
Philips, Sharp, Sony, Sony Ericsson and Toshiba. India has a long way to go for a sustainable
waste management.
Municipal Waste Management and E-waste management in China
China generates nearly 300 million tonnes of MSW annually whereas per capita
generation of MSW is nearly 1.12 gms per day. The MSW generation growth is very high in
China that by 2030 the MSW generated is estimated to be double that of USA. However, China
is creating more laws and regulations to reduce and control the quantity of MSW. There are
several initiatives to curb the problem of MSW in India, namely, composting, recycling, and
waste to energy, Biogas generation, Pyrolysis, and many others. There are a few wastes to
energy plants and many biogas plants in the country. According to the current statistics (Baldé
et al. 2015), China is not only the largest consumption of electronic devices but also the biggest
importer of e-waste despite its attempt to outlaw the importation of e-waste or used electronics
in 2002 (Li et al. 2006; Wei and Liu 2012). Like India, the management of e-waste in China is
driven by informal waste recycling sector despite national regulations on hazardous and
especially on e-waste (Ghosh et al. 2015, Sthiannopkao and Wong 2013; Wei and Liu 2012).
The sector is observed to be striven due to high revenue being generated on daily basis and thus
provides daily livelihood for recycling and disposal workers.
In order to enhance formal e-waste recycling and management in China, two separate
pilot projects were introduced by the State Development and Reform Commission and UNEP
(Yu et al. 2010). In addition, take-back (or reclamation) initiatives were introduced by different
companies such as China Mobile, Nokia and Motorola while monetary incentives were
provided by Shenzhen Green Eco-Manufacture (GEM), Dell, HP and Sony in exchange for
obsolete electronic devices (Wei and Liu 2012). In spite of all these initiatives, the management
(recycling and disposal) of e-waste through formal or legal means remain unconvincing and
has met with little success (Yu et al. 2010), partly due to inability of formal sector to compete
economically with informal sector. As a result, regulative framework in the form of laws and
policies has been introduced (Li et al. 2006) to support the on-going economic instruments in
order to instigate reduce, reuse and recycling culture while restricting the importation of e-waste
and also to strengthen the Extended Producer Responsibility initiatives (Wei and Liu 2012; Yu
et al. 2010).
Waste management in South Africa
Contrary to the informal management of e-waste in other developing countries, e-waste
management in South Africa has emerged through a formal sector (Ghosh et al, 2015, Widmer
et al. 2005) although there were informal recyclers operating in South Africa (Finlay and Liechti
2008;Waste Management World 2013; Widmer and Lombard 2005).Various steps including
refurbishment, repair, re-use, dismantling, recycling and disposal as the last resort are
incorporated into the e-waste management approach(see Figure 4) despite a lack of recycling
infrastructure, inadequate funding, poor legislation, lack of awareness, and insufficient market-
based instruments (Schluep et al. 2009). Besides the voluntary agreement, the legislative
instruments include the National Environmental Act 1998 and the National Environmental
Management: Waste Act 2008 which came to force on 1 July 2009 and amended in 2014
through the National Environmental Management Waste Amendment Act 2014 provides
measures to manage general and hazardous (such as e-waste) waste.

Nevertheless, the principle of waste hierarchy and polluter pays principle are being
adopted to manage e-waste in environmentally-sound manner. Based on the premise of law, it
is considered as illegal activities for individuals or corporations to fly-tip (or throw away) any
form of e-waste in South Africa. In order to enhance and formalise e-waste management and
specifically refurbishment and recycling in South Africa, e-WASA was established in 2008 with
a mandate of developing e-waste management system. Accordingly, e-WASA has since been
engaging manufacturers, vendors, distributors and refurbishes including recyclers so as to
ensure that e-waste is managed using environmentally-sound approaches. For example, e-
WASA is collaborating with the Global Digital Solidarity Fund (DSF) and the Swiss Federal
Laboratories for Materials Testing and Research (Empa) to offer support for the start-up of
material dismantling and recovery facilities for the processing of e-waste since 2008 (Schluep
et al. 2009). As at 2012, landfill site owners and recyclers were not required under the law to
keep accurate records of e-waste (Waste Management World 2013) as no legislation is focusing
specifically on e-waste (Finlay and Liechti 2008) although e-waste is transported to dedicated
recycling facilities where the items are dismantled operation into different components so as to
extract valuable materials.
MSW and E-waste Management in USA
Several researches dealt with the current state of waste management in the USA.
According to a study from 2009, the most common methods for waste solid are landfilling,
composting, recycling, mechanical-biological treatment and waste-to-energy (WTE)
(Psomopolos et al. 2009). About 30 million people have been benefited from WTE facilities
while the risk of environmental problems caused by toxic and dangerous substances such as
mercury and dioxins has been reduced. Also the WTE’s recycling rate was 17.8% higher
according to the US Environmental Protection Agency. Other research also showed the aspects
of municipal waste management. There are diverse resources and waste managing approaches
that differ according to culture. However, for the inclusion of new concepts, pragmatic factors
should be considered such as saving cost, compliance issues, laws, agreements, and macro and
micro-economics. Also other factors relating ethics of individuals, groups, and societies should
be included (Kollikkathara et al. 2009).

Fig. 4: e-Waste Pathway in South Africa (source: Finlay and Liechti 2008).
Other studies in 2009 dealt with more practical cases in the USA. For instance, the
State of New Jersey wanted to improve their recycling system. Using a linear programing
model, the optimal routing could be determined and two scenarios were discussed (Otegbeye
et al. 2009). On the other hand, the study about Maine’s program dealt with managing electronic
waste. The program made everyone sharing the responsibility for the cost of environmentally
sound management, while the Maine program showed a successful performance for e-waste
management for other regions (Wagner 2009). Also the material recovery facilities are
important to minimizing solid wastes. The study about Lucas County showed a complete
financial analysis. In this study, sensitivity analysis was conducted mainly focusing on inflation,
recycling levels, and recycling commodity market shifts and could serve as an example for
other regions based on a similar system (Franchetti 2009).
Regarding electronic wastes, it accounts for up to 70 percent of the heavy metal in
landfills in America. However, still there are many issues and challenges for recycling
especially regarding e-waste. Less than 20 percent of waste electric and electronics (WEEE)
are recycled in the U.S.A. One of the main concerns that recyclers face is the cost of collecting
and transporting WEEE. Some electronic equipment such as TV and monitors costs more to
recycle than the materials than can actually be recovered according to Eric Harris, director of
government and international affairs for the Institute for Scrap Recycling Industries, a trade
group representing recyclers. Also since many components which are difficult to be recycled
are contained in electronic products, the products should be designed with “and eye toward
recycling’ according to Harris. The other issue is “If consumers or manufacturers should be

paying for recycling, who should pay the fee?”. There are a lot of arguments for both
perspectives (E-waste Recycling Faces Several Challenges, Critics Say, 2015).
Case Study: 80 MW Covanta waste to energy plant in Philadelphia, USA
A group of delegates visited the 80 MW Covanta waste to energy plant in Philadelphia,
USA at Covanta Delaware Valley, L.P., Chester, Pennsylvania during the study visit in
30th ICSW 2015 in March 2015 by the delegates of the conference. Wastes generated from the
immediate living and working environment has been categorized as MSW. The volume of MSW
generated has continued to increase both in developing and developed countries. This increase
has been attributed to rapid increase in population, rapid economic growth and rise in
community living standards or technological advancement.
Figure 5. Control Room and the 80 MW Covanta waste to energy plant in Philadelphia
Unlike in developed countries, most developing countries are still grappling with the challenges
of managing and harnessing MSW. The Delaware Valley Resource Recovery facility, operating
as Covanta Delaware Valley, L.P., is located in Chester, Pennsylvania and has been in operation
since 1992. Covanta began operating the facility in 2005. In 2012, Covanta became the owner
and operator of the facility when the company purchased the facility from GE Energy Financial
Services. The plant processes up to 3,510 tons of municipal and commercial solid waste each
day.
At maximum output, the plant generates approximately 80 megawatts of electricity, 90
percent of which is sold to the local utility. The plant not only meets the municipal solid waste
disposal and energy production needs of Delaware County, but also provides capacity for up to
500,000 tons of additional waste each year from surrounding counties. Advanced control
systems constantly monitor combustion performance, energy output and emissions at the
Delaware Valley facility. The six-combustor plant provides an effective and environmentally
safe solution to the county's solid waste disposal needs as well as those of communities and
industries throughout the Delaware Valley region
Technical Data
Facility Address: 10 Highland Avenue, Chester, PA 19013, (610) 497-8100
Primary Service Area: Chester, Pennsylvania region
Waste Supply: Participating municipalities and private haulers deliver up to 1.2 million tons per
year.
Energy Market: Electricity generation for plant use and export to Atlantic City Electric
Company
Capacity: 3,510 tons per day; Number of Process Lines: Six @ 585 tons per day
Type of Stoker Grate: O'Connor Rotary Combustor
Steam Conditions at Boiler Outlet: 140,000 lbs/hr @ 690 pounds per square inch absolute
(psia)/8000°F
Turbine-Generators: 90-megawatt condensing unit
Air Quality Control: 6 dry scrubbers followed by 6 fabric filter (baghouse) systems
Stack Height: 245 feet; Tipping Floor Capacity: 10,000 tons
Secondary Materials Recovery: Recovery of ferrous (steel) and non-ferrous (aluminum) metals.
For the growing need of sustainable solutions, Covanta established ECOvanta, which
is utilize for safe and secure recycling of e-waste (Covanta Electronic Waste Recycling 2015).
Covanta recycle every e-waste that they receive and break it down into reusable resources to
make new products. The equipment separates the electronic components and make sure
everything is recycled. Then the downstream processors carefully selected raw materials and
will turn them back into the feedstock for the production of new products. Every process is
carefully administrated in order to be environmentally sound (Understanding E-Waste 2015).
Currently waste management is experiencing major developments. As seen in the case of
Covanta Holding Corporation, one of the most effective stream nowadays is Energy-from-
Waste (EfW). There are various advantages of EfW such as (1) replacing landfills as primary
disposal for post-recycled waste; (2) reducing greenhouse gases and combating global
warming, for example, every ton of waste processed reduces one ton of CO2 equivalent; (3)
reducing the volume of waste by 90% and (4) generating up to 9 times more electricity from
trash than a landfill (Delaware Valley Combined Presentation 2015). Therefore, energy-from-
waste is a specially designed energy generation facility that uses household waste as fuel and
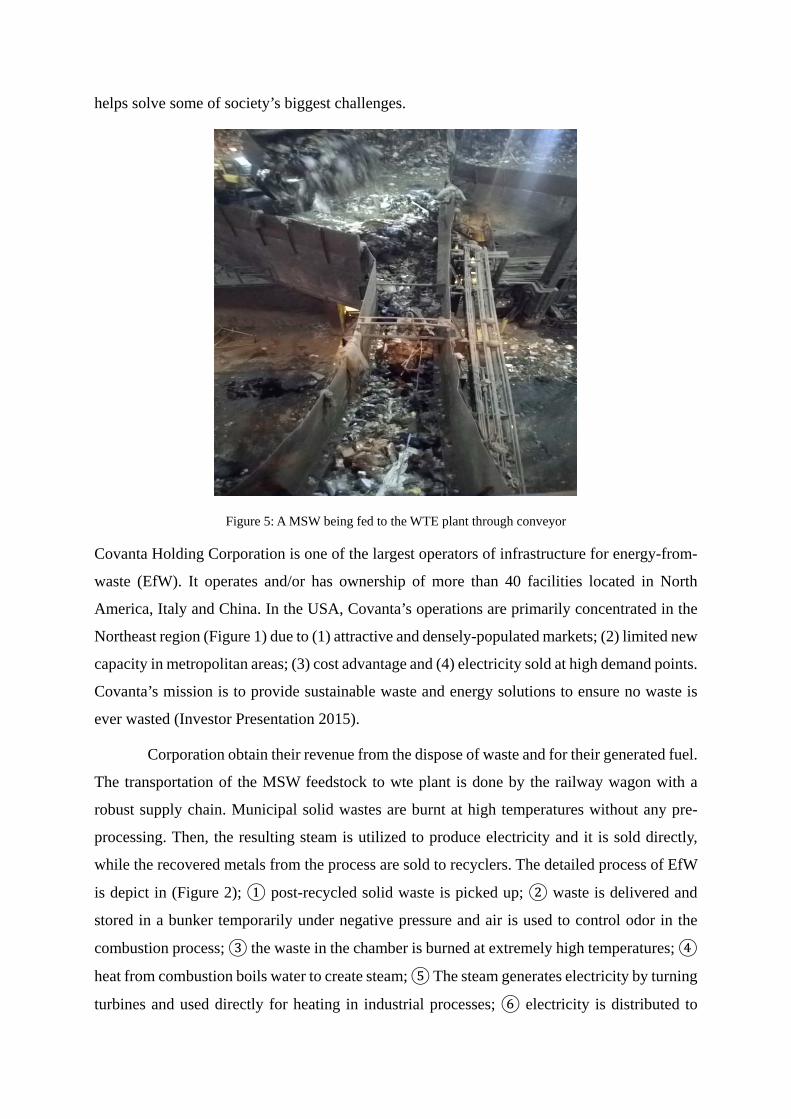
helps solve some of society’s biggest challenges.
Figure 5: A MSW being fed to the WTE plant through conveyor
Covanta Holding Corporation is one of the largest operators of infrastructure for energy-from-
waste (EfW). It operates and/or has ownership of more than 40 facilities located in North
America, Italy and China. In the USA, Covanta’s operations are primarily concentrated in the
Northeast region (Figure 1) due to (1) attractive and densely-populated markets; (2) limited new
capacity in metropolitan areas; (3) cost advantage and (4) electricity sold at high demand points.
Covanta’s mission is to provide sustainable waste and energy solutions to ensure no waste is
ever wasted (Investor Presentation 2015).
Corporation obtain their revenue from the dispose of waste and for their generated fuel.
The transportation of the MSW feedstock to wte plant is done by the railway wagon with a
robust supply chain. Municipal solid wastes are burnt at high temperatures without any pre-
processing. Then, the resulting steam is utilized to produce electricity and it is sold directly,
while the recovered metals from the process are sold to recyclers. The detailed process of EfW
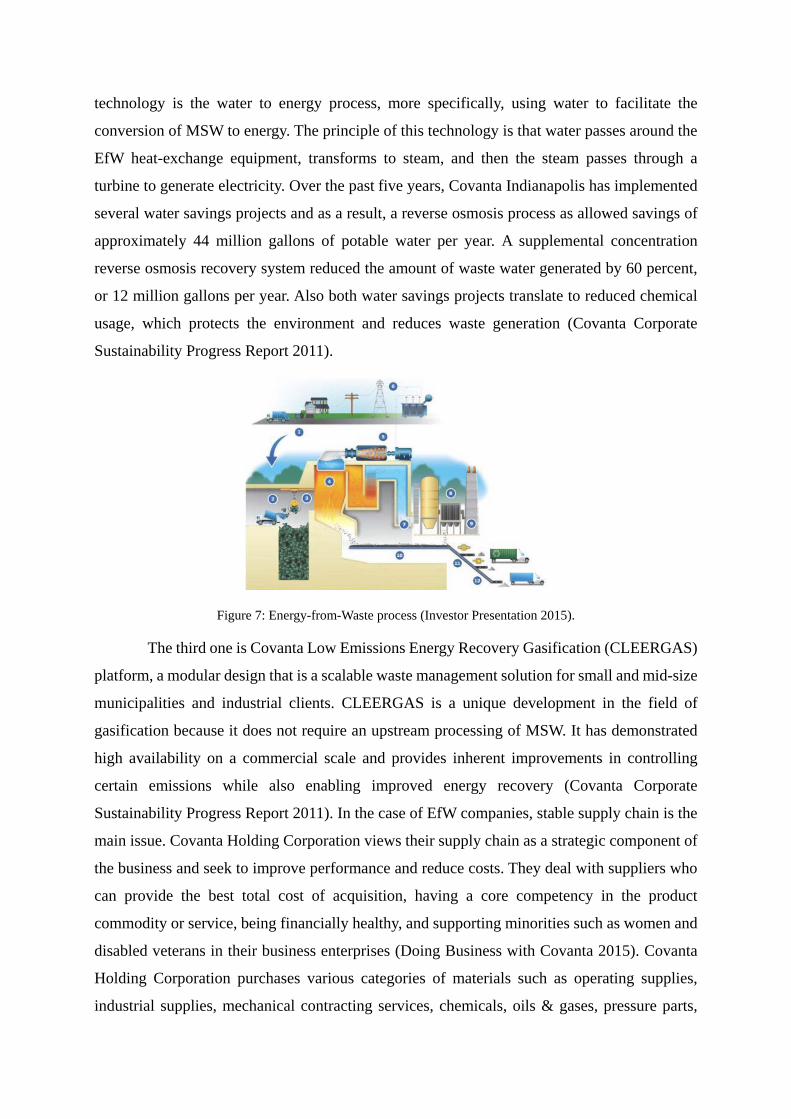
is depict in (Figure 2); ① post-recycled solid waste is picked up; ② waste is delivered and
stored in a bunker temporarily under negative pressure and air is used to control odor in the
combustion process; ③ the waste in the chamber is burned at extremely high temperatures; ④
heat from combustion boils water to create steam; ⑤ The steam generates electricity by turning
turbines and used directly for heating in industrial processes; ⑥ electricity is distributed to

homes and businesses; ⑦ state-of-the art air pollution control equipment is used to cool,
collect, and clean combustion gases under stringent state and federal standards; ⑧ particulate
matter emissions are controlled; ⑨ emissions and other operating parameters are continuously
monitored to ensure compliance with state and federal standards; ⑩ combustion process’
residual material is collected; ⑪ ferrous and non-ferrous metals are extracted for recycling and
⑫ remained materials are reused or disposed in a landfills. As a result, using one ton of
municipal solid waste Covanta produce 500~650 kWh of Power and about 50 pounds of metal
and the volume of ash is reduces to 10% of its original (Investor Presentation 2015). According
to the materials by Covanta Holding Corporation, the number of EfW facilities is 44 and the
MSW processed was 20.6 million tons in 2012. Also they generated 8.9 million of MW hours
of net electricity and exported 8.7 billion pounds of steam. The gross metals recovery was 432
thousand tons and 18.1 million metric tonnes of greenhouse gases were avoided. The amount
of E-waste recycled was 0.4 and 2.0 million pounds in 2011 and 2012 (Covanta Corporate
Sustainability Progress Report (2012)). Additionally, they have recycled about 500 kilo tonnes
of ferrous and nonferrous metal annually (Investor Presentation, 2015).
Figure 6. ICSW 2015 delegate meeting in the seminar room at the Covanta WTE plant
Covanta Holding Corporations possess three major technologies that allows them to
optimize their processes. The first one is recovering metals and materials. Most recently,
facilities have been adding nonferrous metals such as aluminum, copper, brass, etc. Since the
mining and production of steel is a very carbon intensive process, Covanta’s current metals
recycling efforts prevent over 800,000 tons of CO2 from being released annually. The second
technology is the water to energy process, more specifically, using water to facilitate the
conversion of MSW to energy. The principle of this technology is that water passes around the
EfW heat-exchange equipment, transforms to steam, and then the steam passes through a
turbine to generate electricity. Over the past five years, Covanta Indianapolis has implemented
several water savings projects and as a result, a reverse osmosis process as allowed savings of
approximately 44 million gallons of potable water per year. A supplemental concentration
reverse osmosis recovery system reduced the amount of waste water generated by 60 percent,
or 12 million gallons per year. Also both water savings projects translate to reduced chemical
usage, which protects the environment and reduces waste generation (Covanta Corporate
Sustainability Progress Report 2011).
Figure 7: Energy-from-Waste process (Investor Presentation 2015).
The third one is Covanta Low Emissions Energy Recovery Gasification (CLEERGAS)
platform, a modular design that is a scalable waste management solution for small and mid-size
municipalities and industrial clients. CLEERGAS is a unique development in the field of
gasification because it does not require an upstream processing of MSW. It has demonstrated
high availability on a commercial scale and provides inherent improvements in controlling
certain emissions while also enabling improved energy recovery (Covanta Corporate
Sustainability Progress Report 2011). In the case of EfW companies, stable supply chain is the
main issue. Covanta Holding Corporation views their supply chain as a strategic component of
the business and seek to improve performance and reduce costs. They deal with suppliers who
can provide the best total cost of acquisition, having a core competency in the product
commodity or service, being financially healthy, and supporting minorities such as women and
disabled veterans in their business enterprises (Doing Business with Covanta 2015). Covanta
Holding Corporation purchases various categories of materials such as operating supplies,
industrial supplies, mechanical contracting services, chemicals, oils & gases, pressure parts,
information systems and so on (What we buy 2015). Also e-Supplier Connection is used to
provide online real time delivery schedules and purchase order acknowledgements (Supplier
Self-Serving Training 2015).
Overall, the USA’s economic, legislative and regulatory environment is not
satisfactory. Prices for natural gas and waste disposal are low. A national energy policy is
nonexistent in the USA, and it seems that there will not be any significant energy reform or
major change in the near future. Nevertheless, the United States’ economic and regulatory
environment has been improved. Therefore, the benefits of EfW and the reduction in the
dependence on landfilling for waste disposal should be discussed actively amongthe current
policy makers. At the same time, as shown in the case of Covanta Holding Corporation, since
most existing plants are running at full capacity, each company should see opportunities to
pursue innovations that maximize the efficiency of their facilities, such as focusing on reducing
their energy and water consumption. (Covanta Corporate Sustainability Progress Report 2011).
In the case of Covanta’s EfW facilities, they are continuously improving their existing metal
recovery systems and plan to start up three new non-ferrous systems and upgrade four more
and additionally continue to explore new opportunities for recovering metals from ash
monofills.
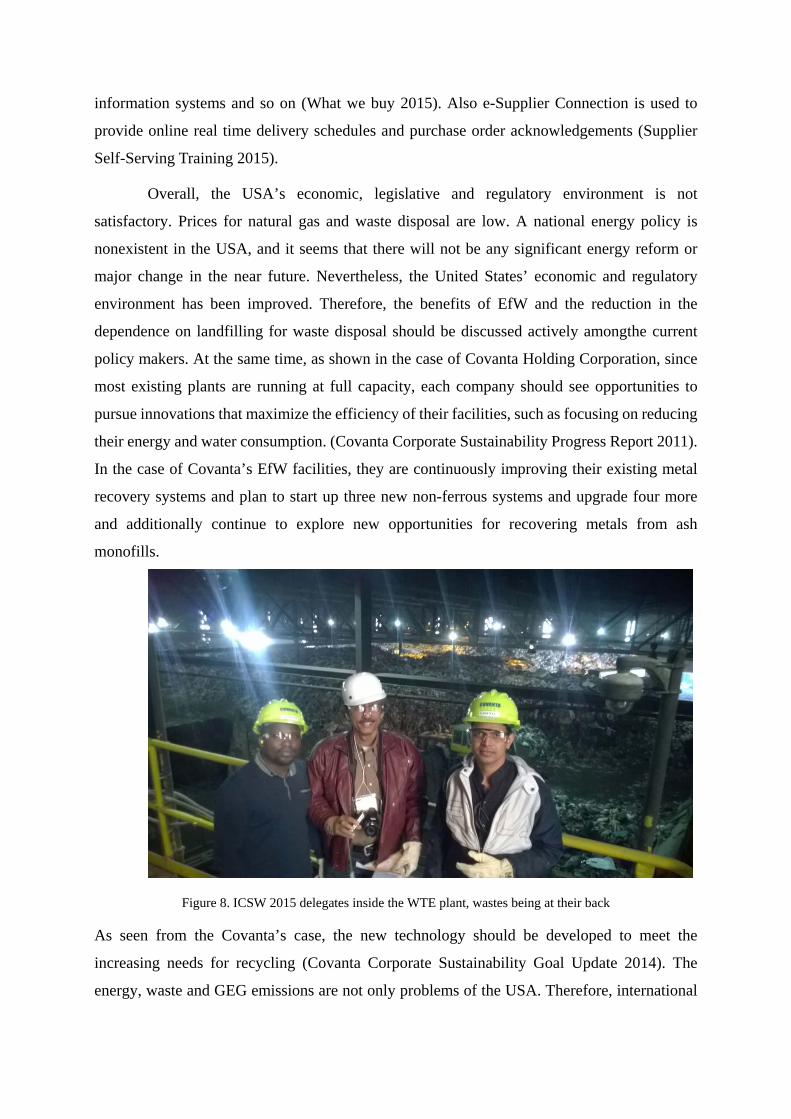
Figure 8. ICSW 2015 delegates inside the WTE plant, wastes being at their back
As seen from the Covanta’s case, the new technology should be developed to meet the
increasing needs for recycling (Covanta Corporate Sustainability Goal Update 2014). The
energy, waste and GEG emissions are not only problems of the USA. Therefore, international
markets are fruitful regarding the building of new EfW plants, such as in Europe and Asia. Over
the long term, waste reduction and clean energy production will be essential to build a
sustainable future. Being ready to respond to positive developments in the clean energy
regulations and policy space across the globe is an important strategy (Covanta Corporate
Sustainability Progress Report 2011).
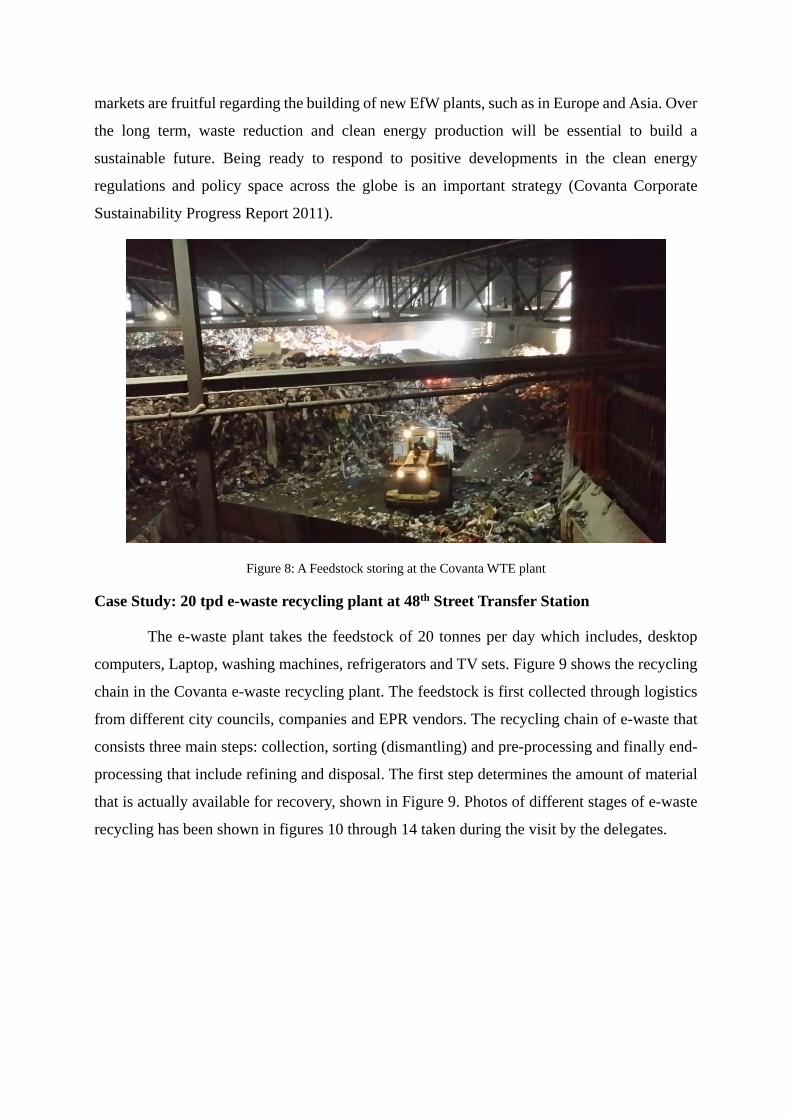
Figure 8: A Feedstock storing at the Covanta WTE plant
Case Study: 20 tpd e-waste recycling plant at 48th Street Transfer Station
The e-waste plant takes the feedstock of 20 tonnes per day which includes, desktop
computers, Laptop, washing machines, refrigerators and TV sets. Figure 9 shows the recycling
chain in the Covanta e-waste recycling plant. The feedstock is first collected through logistics
from different city councils, companies and EPR vendors. The recycling chain of e-waste that
consists three main steps: collection, sorting (dismantling) and pre-processing and finally end-
processing that include refining and disposal. The first step determines the amount of material
that is actually available for recovery, shown in Figure 9. Photos of different stages of e-waste
recycling has been shown in figures 10 through 14 taken during the visit by the delegates.
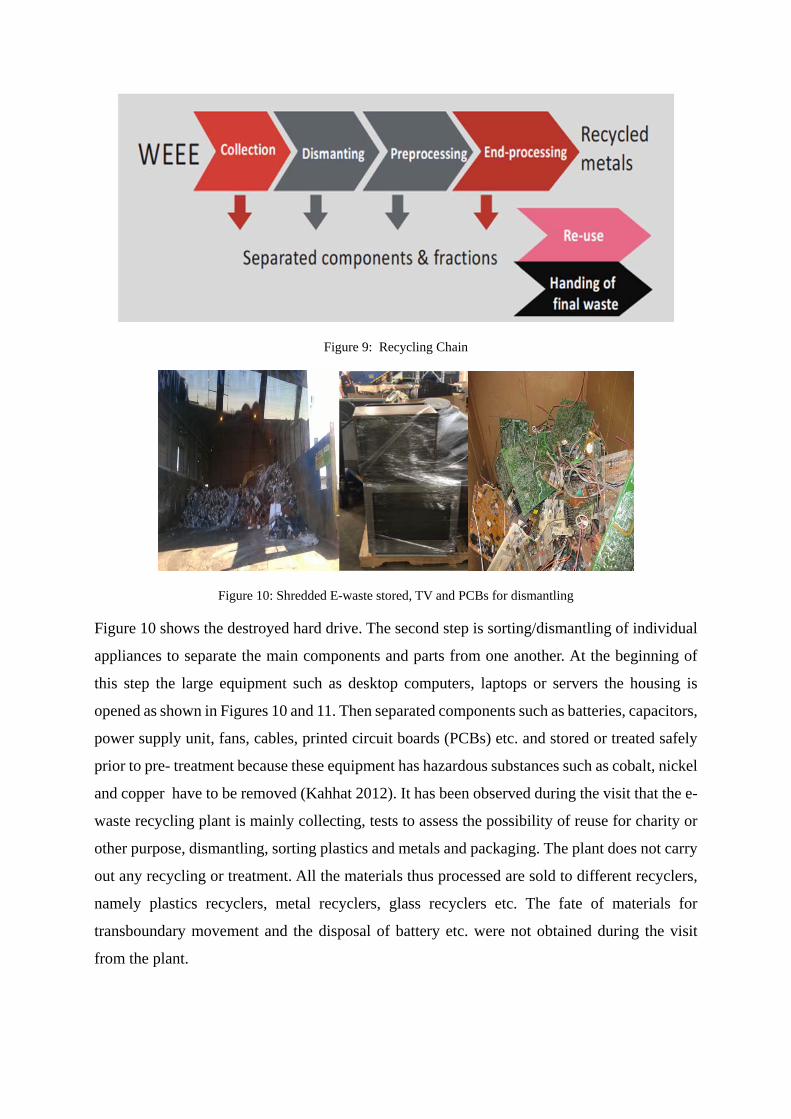
Figure 9: Recycling Chain
Figure 10: Shredded E-waste stored, TV and PCBs for dismantling
Figure 10 shows the destroyed hard drive. The second step is sorting/dismantling of individual
appliances to separate the main components and parts from one another. At the beginning of
this step the large equipment such as desktop computers, laptops or servers the housing is
opened as shown in Figures 10 and 11. Then separated components such as batteries, capacitors,
power supply unit, fans, cables, printed circuit boards (PCBs) etc. and stored or treated safely
prior to pre- treatment because these equipment has hazardous substances such as cobalt, nickel
and copper have to be removed (Kahhat 2012). It has been observed during the visit that the e-
waste recycling plant is mainly collecting, tests to assess the possibility of reuse for charity or
other purpose, dismantling, sorting plastics and metals and packaging. The plant does not carry
out any recycling or treatment. All the materials thus processed are sold to different recyclers,
namely plastics recyclers, metal recyclers, glass recyclers etc. The fate of materials for
transboundary movement and the disposal of battery etc. were not obtained during the visit
from the plant.

Figure 11: The separated components such as batteries, capacitors, power supply unit, fans, printed circuit boards
(PCBs)
While valuable components/materials need to be taken out for reuse or to be directed
to efficient recovery processes. Cathode ray tubes (CTR) and liquid crystal display (LCD)
monitors and televisions are removed from devices but not broken or crushed –or- kept whole
inside devices Figure 12.
Figure 12: CTR and LCD are kept whole
The recovered circuit boards are collected separately as shown in Figure 11 &13. The other
important machine is E-Waste Separation System. This system starts with transfer conveyor
and shredder that used to crush the electronic waste to reduce the size of the electronic materials
for easier further processing and recycling.
Then the materials travel to a screen to establish a common sized material to run across the

eddy current separator. Then these materials travel to magnet to remove ferrous metals from the
stream and finally transfer to metal recovery system. Figure 13 shows the recovered Circuit
Boards and Fig 14 shows the transfer conveyor, shredder and magnet that remove ferrous metals
& Physically Destroyed Hard Drives.
Figure 13: Recovered Circuit Boards
Figure 14: E-Waste conveyor, the Separation System & Physically Destroyed Hard Drives
Conclusion
The case study shows how the waste is being used for energy recovery and resource
recovery. These processes can make the burden of waste streams smarter in the developing
countries. However, there is a roaring voice now worldwide that if the waste to energy or the
recycling of waste and encourage the circular economy. However, the transboundary movement
of e-waste is still to be very carefully handles as per the BASEL convention.
References
Albrecht, O. W., et al. (1981). "Recycling in the usa - vision and reality." Resources Policy, 7(3): 188-196.
Allam, H. and Inauen, S., 2009. E-waste management practices in the Arab Region, Viewed 10 March 2013, http://ewasteguide.info/files /Allam_2009_R'09.pdf.
Baldé, C.P., Wang, F., Kuehr, R. and Huisman, J., 2015. The global e-waste monitor–2014. United Nations University, IAS–SCYCLE, Bonn, Germany.
Covanta – Delaware Valley Combined Presentation (2015).
Covanta Corporate Sustainability Goal Update (2014).
Covanta Corporate Sustainability Progress Report (2012).
Covanta Electronic Waste Recycling (http://www.covanta.com/services/business/electronic-waste.aspx) (2015.12.27).
Covanta Corporate Sustainability Progress Report (2011).
Dahroug, S 2009, BCRC-Egypt and e-waste activities in the Arab region. [online]. Available from:,http://ewasteforum.cedare.int/Presentations/Session _V/BCRC.pdf. [Accessed 27 December 2015].
Dat, L.Q., Linh, D.T.T., Chou, S.Y. and Vincent, F.Y., 2012. Optimizing reverse logistic costs for recycling end-of-life electrical and electronic products. Expert Systems with Applications, 39(7), pp.6380-6387.
Doing Business with Covanta (http://www.covanta.com/about-covanta/partners-suppliers.aspx) (2015.12.27).
Debnath B., Baidya R., Ghosh S.K., “Simultaneous Analysis of WEEE management System Focusing on the supply chain in India, UK and Switzerland”, International Journal of Manufacturing & Industrial Engineering, Volume 2, Issue 1, pg. 16 – 20. Publication date: 30th April, 2015. http://www.seekdl.org/nm.php?id=5602
Everett, J. W. and Peirce J. J. , 1993. Curbside recycling in the usa - convenience and mandatory participation. Waste Management & Research, 11(1): 49-61.
E-waste Recycling Faces Several Challenges, Critics Say. [online]. Available from: http://www.pcworld.com/article/145342/article.html. [Accessed 27 on December 2015].
Finlay, A. and Liechti, D., 2008. E-Waste Assessment South Africa: e-Waste Association of South Africa (eWASA). [online]. Available from: http://www.ngopulse.org/sites/default/files/e-Waste%20Assessment%20South%20Africa.pdf. [Accessed on 26 December 2015].
Franchetti, M. J., 2009. Case study: Determination of the economic and operational feasibility of a material recovery facility for municipal recycling in Lucas County, Ohio, USA. Resources Conservation and Recycling, 53(9): 535-543.
Ghosh S.K., Baidya R., De D., Debnath B., Li J., Ghosh S.K., Zheng L., Awasthi A.K., Liubarskaia M.A., Ogola J.S., Taraves A.N. “WEEE management and Basel Convention Complaince in BRICS nations.” The Tenth International Conference on Waste Management and Technology (ICWMT 10), China, 28- 30th October, 2015, pp. 1197 – 1214.
Ghosh S.K., Baidya R., Debnath B., Biswas N. T., De D., Lokeswari M., “E-waste supply chain issues and challenges in India using QFD as analytical tool”; Int. Conf. On Computing, Communication & Manufacturing 2014, 22 – 23RD November, 2014, pp 287-291, ISBN: 978-0-9940194-0-0.
Ghosh S. K., Singh N., Debnath B., De D., Baidya R., Biswas N. T., Ghosh S. K., Lili L., Dey P. K., Li J., “E-Waste Supply Chain Management : Findings from pilot studies in India, China, Taiwan (ROC) and the UK”,The 9th International Conference on Waste Management and Technology, Beijing China, 29 – 31TH October, 2014, pp 1131-1140.
Hassanin, L., 2010. “Middle East and North Africa-ICTs and environmental sustainability‘. Global Information Society Watch. [online]. Available from: http://www.giswatch.org/en/e-waste/middle-east-and-north-africa. [Accessed 20 December 2015].
Hoornweg, D. and Bhada-TATA, P., 2012. What a Waste: A Global Review of Solid Waste Management. World Bank: Washington, DC. License: CC BY 3.0 IGO. [online]. Available from: https://openknowledge.worldbank.org/handle/10986/17388. [Accessed on 20 January 2014].
Huisman, J., Botezatu, i., Herreras, L., Liddane, M., Hintsa, J., Luda Di Cortemiglia, V., Leroy, P., Vermeersch, E., Mohanty, S., Van Den Brink, S., Ghenciu, B., Dimitrova, D., Nash, E., Shryane, T., Wieting, M., Kehoe, J., Baldé, C.P., Magalini, F., Zanasi, A., RUINI, F. And Bonzio, A., 2015. Countering WEEE Illegal Trade (CWIT) Summary Report, Market Assessment, Legal Analysis, Crime Analysis and Recommendations Roadmap, August 30, 2015, Lyon, France. [online]. Available from: www.cwitproject.eu/wp-content/.../2015/08/CWIT-Final-Summary1.pdf. [Accessed on 22 December 2015].
Investor Presentation (2015).
Kahhat, R., E-waste Management: From Waste to Resource, ed. R. Kahhat, K. Hieronymi, and E. Williams. 2012: Routledge.
Kollikkathara, N., Feng, H. and Stern, E., 2009. A purview of waste management evolution: Special emphasis on USA. Waste Management, 29(2): 974-985.
LI, J., Tian, B., liu, T., Liu, H., Wen, X. and Honda, S.I., 2006. Status quo of e-waste management in mainland China. Journal of Material Cycles and Waste Management, 8(1), pp.13-20.
Maharashtra Pollution Control Board, 2007. Report on Assessment of Electronic Wastes in Mumbai-Pune Area Maharashtra. Maharashtra Pollution Control Board.
Matsuto, T. and Ham R. K., 1990. Residential solid-waste generation and recycling in the usa and japan. Waste Management & Research, 8(3): 229-242.
Nnorom, I.C. and Osibanjo, O., 2008. Overview of electronic waste (e-waste) management practices and legislations, and their poor applications in the developing countries. Resources, Conservation and Recycling, 52(6), pp.843-858.
Oke, A., 2015. Workplace Waste Recycling Behaviour: A Meta-Analytical Review. Sustainability, 7(6), pp.7175-7194.
Otegbeye, M., Abdel-Malek, L., Hsieh, H.N. and Meegoda, J.N., 2009. On achieving the state's household recycling target: A case study of Northern New Jersey, USA. Waste Management, 29(2): 647-654.
Park, S., Yi, H. and Feiock, R.C., 2015. Quantifying solid waste and recycling

employment in Florida, USA: Trends in public and private sectors. Waste Management & Research, 33(12): 1127-1131.
Psomopoulos, C.S., Bourka, A. and Themelis, N.J., 2009. Waste-to-energy: A review of the status and benefits in USA. Waste Management, 29(5): 1718-1724.
Renckens, S., 2015. The Basel Convention, US politics, and the emergence of non-state e-waste recycling certification. International Environmental Agreements-Politics Law and Economics, 15(2): 141-158.
Robinson, B.H., 2009. E-waste: an assessment of global production and environmental impacts. Science of the Total Environment, 408(2), pp.183-191.
Schluep, M., Hageluekenb, C., Kuehr, R., Magalini. F., Maurer, C., Meskers, C., Mueller, E., and Wang, F., 2009. Sustainable Innovation and Technology Transfer Industrial Sector Studies: Recycling – from E-waste to Resources. United Nations Environment Programme & United Nations University, Bonn, Germany.
Sepúlveda, A., Schluep, M., Renaud, F.G., Streicher, M., Kuehr, R., Hagelüken, C. and GERECKE, A.C., 2010. A review of the environmental fate and effects of hazardous substances released from electrical and electronic equipments during recycling: Examples from China and India. Environmental impact Assessment Review, 30(1), pp.28-41.
Slade, M. E. (1980). "The effects of higher energy prices and declining ore quality - copper-aluminium substitution and recycling in the USA." Resources Policy, 6(3): 223-239.
Sthiannopkao, S. and Wong, M.H., 2013. Handling e-waste in developed and developing countries: Initiatives, practices, and consequences. Science of the Total Environment, 463, pp.1147-1153.
Supplier Self-Serving Training Course. [online]. Available from: http://www.covanta.com/about-covanta/partners-suppliers/supplier-self-service-training.aspx. [Accessed on 27 December].
Understanding E-Waste [online]. Available from: http://www.covanta.com/en/services/business/electronic-waste/understanding-ewaste.aspx. [Accessed on 27 December].
United States Environmental Protection Agency, 2014. Municipal solid waste generation, recycling, and disposal in the United States detailed Tables and Figures for 2012. US Environmental Protection Agency.
Wagner, T. P. (2009). "Shared responsibility for managing electronic waste: A case study of Maine, USA." Waste Management, 29(12): 3014-3021.
Waste Management World, 2013. E-Waste: South Africa’s next gold rush? [online]. Available from: http://waste-management-world.com/a/e-waste-south-africas-next-gold-rush. [Accessed on 25 December 2015].
Wath, S.B., Dutt, P.S. and Chakrabarti, T., 2011. E-waste scenario in India, its management and implications. Environmental Monitoring and Assessment, 172(1-4), pp.249-262.
Wei, L. and Liu, Y., 2012. Present status of e-waste disposal and recycling in China. Procedia Environmental Sciences, 16, pp.506-514.
Wen, X., et al. (2014). "Comparison research on waste classification between China and the EU, Japan, and the USA." Journal of Material Cycles and Waste Management,16(2): 321-334.

Westenbarger, D., et al. (1991). "Welfare gains from aluminum recycling in the USA." Resources Policy, 17(4): 332-341.
What we buy [online]. Available from: http://www.covanta.com/about-covanta/partners-suppliers/what-we-buy.aspx. [Accessed on 27 December].
Widmer, R. and Lombard, R., 2005. E-Waste assessment in South Africa, a case study of the Gauteng province. “Swiss global e-waste programme” Knowledge Partnerships in e-Waste Recycling.
Widmer, R., Oswald-krapf, H., Sinha-Khetriwal, D., Schnellmann, M. and Böni, H., 2005. Global perspectives on e-waste. Environmental Impact Assessment Review, 25(5), pp.436-458.
Williams, E., Kahhat, R., Allenby, B., Kavazanjian, E., Kim, J. and Xu, M., 2008. Environmental, social, and economic implications of global reuse and recycling of personal computers. Environmental Science and Technology, 42(17), pp.6446-6454.
Wilson, D.C., Araba, A.O., Chinwah, K. and Cheeseman, C.R., 2009. Building recycling rates through the informal sector. Waste Management, 29(2), pp.629-635.
Wong, M.H., Wu, S.C., Deng, W.J., Yu, X.Z., Luo, Q., Leung, A.O.W., Wong, C.S.C., Luksemburg, W.J. and Wong, A.S., 2007. Export of toxic chemicals–a review of the case of uncontrolled electronic-waste recycling. Environmental Pollution, 149(2), pp.131-140.
Yu, J., Williams, E., Ju, M. and Shao, C., 2010. Managing e-waste in China: Policies, pilot projects and alternative approaches. Resources, Conservation and Recycling, 54(11), pp. 991-999.
Zeltner, C., Bader, H.P., Scheidegger, R. and Baccini, P., 1999. "Sustainable metal management exemplified by copper in the USA." Regional Environmental Change, 1(1): 31-46.