ghinwa dumyati, md christina felsen, mph university of
TRANSCRIPT

Ghinwa Dumyati, MD Christina Felsen, MPH
University of Rochester Medical Center

How do you decide where to start?
Start small; core elements recommend you focus on one thing at a time
Use data to help decide where to intervene first – data may come from multiple sources like pharmacy, quality, nursing, labs etc.
Must decide what scope of intervention is possible based on your staffing, medical record system, availability of an in-house pharmacist, relationship with the microbiology lab etc.

You Can’t Do it Alone
Who should be on your team?
What do your team members need to be effective?
Involve multiple people from the beginning to account for turn-over and other commitments
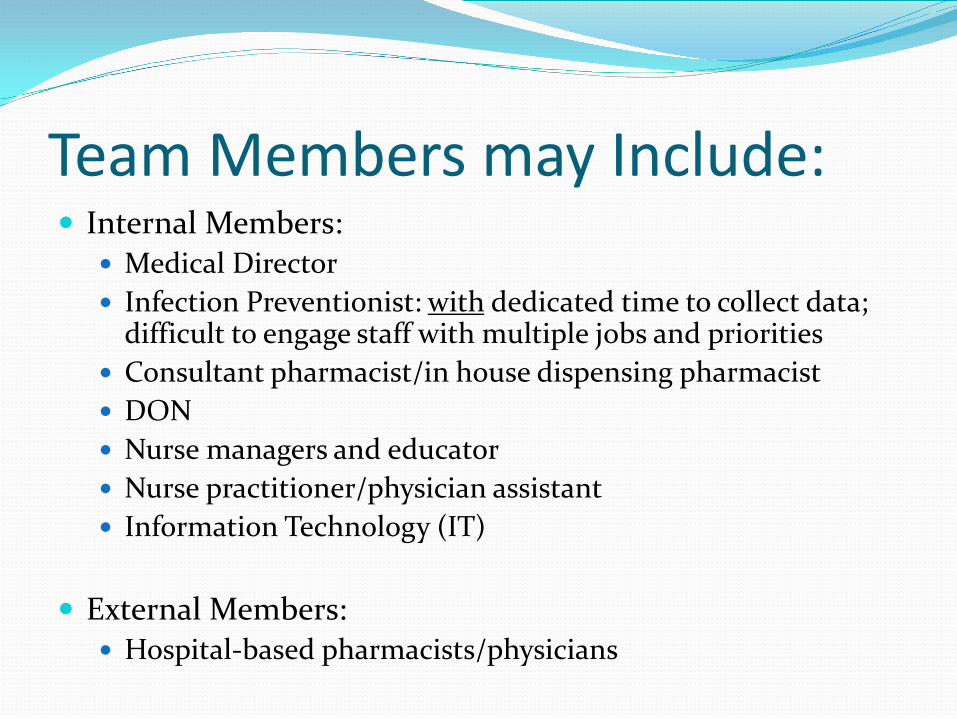
Team Members may Include: Internal Members:
Medical Director Infection Preventionist: with dedicated time to collect data;
difficult to engage staff with multiple jobs and priorities Consultant pharmacist/in house dispensing pharmacist DON Nurse managers and educator Nurse practitioner/physician assistant Information Technology (IT)
External Members:
Hospital-based pharmacists/physicians

Ways to Gather Facility-Wide Antibiotic Data Medication Administration data
Often not available electronically Purchasing data
Different from hospital as medications purchased in bulk Can be difficult for dispensing from a central pharmacy
location to many facilities Dispensing data
Does not insure the antibiotic was administered Often the dispensing pharmacy is outside the facility
Manual collection Point prevalence Antibiotic start

With many resources…. You can obtain antibiotic dispensing data to get a
complete picture of where to intervene: May be obtained from in-house or dispensing
pharmacies Useful variables to ask for:
Unique number for each patient Drug name and dose Complete “Sig” (contains indication) Start and end dates Days of Therapy (DOT)
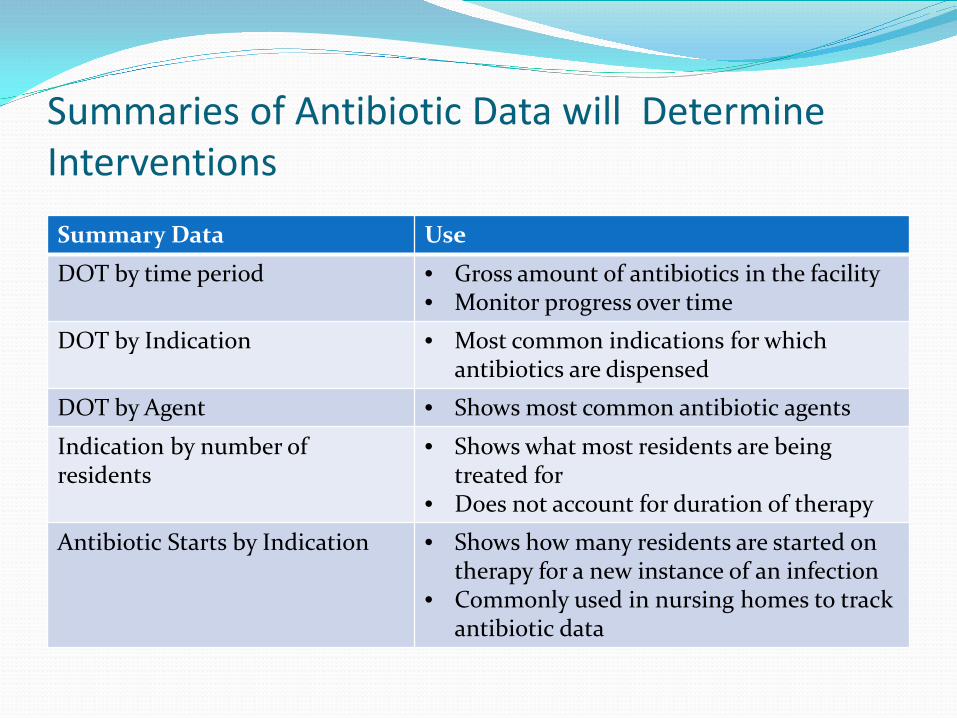
Summaries of Antibiotic Data will Determine Interventions Summary Data Use
DOT by time period • Gross amount of antibiotics in the facility • Monitor progress over time
DOT by Indication • Most common indications for which antibiotics are dispensed
DOT by Agent • Shows most common antibiotic agents
Indication by number of residents
• Shows what most residents are being treated for
• Does not account for duration of therapy
Antibiotic Starts by Indication • Shows how many residents are started on therapy for a new instance of an infection
• Commonly used in nursing homes to track antibiotic data

0 200 400 600 800
UTI PROPHYLAXIS
PEMPHEGOID
UTI
BONE/JOINT INFECTION
SSTI
PNEUMONIA
HEENT INFECTION
C. DIFF
COPD EXACERBATION
UNKNOWN
Days of Therapy
Nursing Home 1 – Quarter 3
Examples – Antibiotic DOT by Indication
0 500 1000
C. DIFF
SKIN/SOFT TISSUE INFECTION
UTI
UNSPECIFIED PROPHYLAXIS
UNSPECIFIED ABSCESS
BONE/JOINT INFECTION
LUNG ABSCESS
AORTIC ENTERIC FISTULA
BLEPHARITIS
BRONCHITIS
BRONCHITIS/UTI
Days of Therapy
Nursing Home 2 – Quarter 3

0 10 20 30 40 50 60 70 80 90
UTI
DENTAL PROPHYLAXIS
PNEUMONIA
SSTI
UNKNOWN
HEENT INFECTION
UTI PROPHYLAXIS
BONE/JOINT INFECTION
C. DIFF
PEMPHEGOID
Number of Residents
Nursing Home 1, Q3
Example – Indication by Number of Residents

Example – Antibiotics Used for UTI Treatment
0 20 40 60 80 100 120 140 160
CEPHALEXIN
TMP/SMZ
CIPROFLOXACIN
CEFPODOXIME
AMOXICILLIN
NITROFURANTOIN
CEFTRIAXONE
CLINDAMYCIN
DOXYCYCLINE
AMOXICILLIN/CLAV
LEVOFLOXACIN
Days of Therapy
Nursing Home 1, Q3

Antibiotics Used for UTI Treatment may Vary by Home and Unit Type
0 10 20 30 40 50 60 70
CIPROFLOXACIN
CEFPODOXIME
NITROFURANTOIN
CEPHALEXIN
BACTRIM
AMPICILLIN
TRIMETHOPRIM
LEVOFLOXACIN
AMOXICILLIN/CLAVULANATE
METRONIDAZOLE
AMOXICILLIN
CEFTRIAXONE
DOXYCYCLINE
PENICILLIN VK
Days of Therapy
Nursing Home 3, Q3
Long Term Care
Transitional Care

But this is not easy….
May have to enter data manually into Excel Usually requires significant cleaning of the data in order to summarize
with a pivot table Standardize drug name Assign drug type (antibiotic, antiviral) Standardize indication Calculate DOT if not provided

And it has limitations Dispensing data may not accurately reflect what
residents actually receive Time consuming and labor intensive; may not be
possible with hospital support Cannot differentiate between hospital and nursing
home initiated antimicrobials DOT skewed by long antibiotic courses and long term
prophylaxis

Starting Small Do you know what infection is the most common
reason for antibiotic use? Could determine this from antibiotic data or from
infection logs UTI is usually a common infection where antibiotic
treatment is usually unnecessary

Starting Small Example: Infection Preventionist + Consultant Pharmacist Targeted one unit and perform an antibiotic review of
residents treated for UTI IP collects initial data; consultant pharmacist adds
treatment data and assesses what percentage of the treated residents fit the updated McGeer surveillance criteria Looks at documentation of urinary symptoms Looks at the culture and if there is bug-drug mismatch

Example
Date Patient Name Medication DOT Indication
Positive UA (Y/N)
Culture Sensitive
Dysuria (Y/N)
Fever (Y/N)
Other Symptoms (Urinary urgency, frequency, pain, hematuria, incontinence) Allergies
Approp-riate abx?
Appropriate DOT?
Appropriate Dose?
Date Patient Name Medication DOT Indication
Positive UA (Y/N)
Culture Sensitive
Symptoms (Fever, rigors, delirium, Allergies
Appropriate abx?
Appropriate DOT?
Appropriate Dose
flank pain, hematuria, pelvic discomfort, lethargy, CVA tenderness)
• Red fields filled out by IP; blue fields by consultant pharmacist Residents without a catheter
Residents with catheter
Courtesy of Brandi Van Valkenburg Pharm D, BCGP

Examples

Another “small” step Do you know if you all your antibiotic orders have
an indication? Develop a system to ensure that all orders include:
Indication Duration
Although this intervention seems simple, it will likely require a coordinated effort between pharmacy, nursing and the providers This is why it’s important to form a team first!


Obtaining Facility-Wide Antibiotic Data
Medication Administration data If available electronically, can ask IT to pull on a daily or
weekly basis Manual collection
Point prevalence Antibiotic start
Start on 1 unit and involve nursing and Infection Prevention

Antibiotic and Infection Tracking Sheet Excel tool with graphs built in so not as labor intensive Allows for monitoring of DOT and antibiotic starts
over time Data can be obtained from morning report, infection
log, chart review, MDS Expands on antibiotic data to also track culture results,
symptoms, etc. to help measure appropriateness of antibiotics
Using on even one unit will allow you to better understand the infection and antibiotic patterns in your home
Tool available at: www.rochesterpatientsafety.com

Starting small – data feedback example
Number of urine cultures per month
Number of antibiotic starts for UTI
Patient days Rate of urine cultures Per 1000 residents days
Rate of antibiotic starts Per 1000 residents days
C. Difficile rate per 1000 resident days
June 44 12 10133 4.3 1.2 2 July 37 10 10222 3.6 1.0 1
August 24 5 10450 2.3 0.5 1
September 27 7 11001 2.4 0.6 0
• Data should be monitored over time to measure trends • Example of summary data for feedback and reporting • Can be presented at quality and infection prevention meetings

Tips for Success It’s not one size fits all Build processes into your daily routine so can be
continued despite turnover and competing priorities Present results to medical director and at quality
meetings to gain buy-in Initial data collection will determine interventions;
can be pared down over time to be less labor intensive Hospital expertise can help initiate program, provide
treatment guidelines and provide education on how to monitor data over time