gfc separation of water-soluble polymers using - sigma-aldrich
TRANSCRIPT
Separation Report No. 038
GFC Separation of
Water-Soluble Polymers
using TSKgel® PWXL
Series Columns
Table of Contents
1. Introduction 1
2. Calibration curves, theoretical plate numbers
and separation ranges for each grade in the
TSKgel PWXL series 1
3. Comparison of performance of TSKgel PWXL
series and PW series columns 3
4. Effect of elution conditions on resolution of the TSKgel PWXL series columns 4
4-1 Flow rate 44-2 Temperature 44-3 Sample concentration 44-4 Sample injection volume 5
5. Relationship between theoretical plate
number and resolution 6
6. Dependence of Mw/Mn and Mz/Mw on
theoretical plate number and sample
concentration in GFC 6
7. Analyzing molar mass by GFC/LALLS
(low-angle laser light scattering detector)
using TSKgel GMPWXL column 8
8. Dependence of Mn, Mw, and Mz on
theoretical plate number with GFC/LALLS 9
9. Selection of eluents for GFC separation of water-soluble polymers 10
10. Conclusions 14
3604 Horizon Drive, Suite 100, King of Prussia, PA 19406Phone: (484) 805-1219 FAX: (610) 272-3028Orders and Technical Service: (800) 366-4875Member of the TOSOH Group

1
1. Introduction High performance gel permeation (GPC) and gel
filtration chromatography (GFC) are widely used separation modes due to their separation power, good reproducibility, and short analysis time.
As shown in Table 1, which indicates the decades during which several high performance packing materials for GPC and GFC were developed, Tosoh has been in the forefront of developing high performance columns for both organic (GPC) and aqueous (GFC) solvent systems. To satisfy the demand for faster, more sensitive and labor-saving analytical equipment, Tosoh scientists and engineers continue to develop smaller particle size, higher performance, and faster columns for both organic and aqueous solvent systems.
This report discusses the separation performance of the high performance TSKgel PWXL series of GFC columns for use in aqueous systems and presents applications for using the TSKgel PWXL columns.
Table 1 History of development of GPC and GFC packing materials
2. Calibration curves, theoretical plate numbers, and separation range for each grade in the TSKgel PWXL series columns
Figure 1 shows calibration curves for each column in the TSKgel PWXL series using polyethylene oxide (PEO) SE-series standards produced by Tosoh Corporation. A TSKgel GMPWXL column is a mixed bed column that is prepared by mixing batches of particles each containing a narrow but different pore size distribution, making this column suitable for analyzing molar mass and molar mass distributions. A TSKgel G2500PWXL column has also been added to the TSKgel PWXL series columns. In this column, residual negative charges of the conventional TSKgel G2000PW column have been reduced while the resolution maintained (for details see Separation Report 037).
Elution volume (mL) Figure 1 Calibration curves for the PWXL columns Columns: 7.8mm ID x 30cm Sample: polyethylene oxide standards
Historical background
1970
Development of TSKgel S- and H-type GPC packing materials for organic solvent systems
Petrochemical industry is flourishing
1975
Development of TSKgel SW- and PW-type packing materials for aqueous solvent systems (GFC)
Oil shock Growth of high value-added industries
1980
Development of Toyopearl® packing materials for preparative GFC and other modes of chromatography
Start of the biotech revolution
1987
Development of packing materials for GPC and GFC with high theoretical plate numbers
Analytical equipment becoming faster, more sensitive, and more labor saving
Mol
ecul
ar w
eigh
t
2
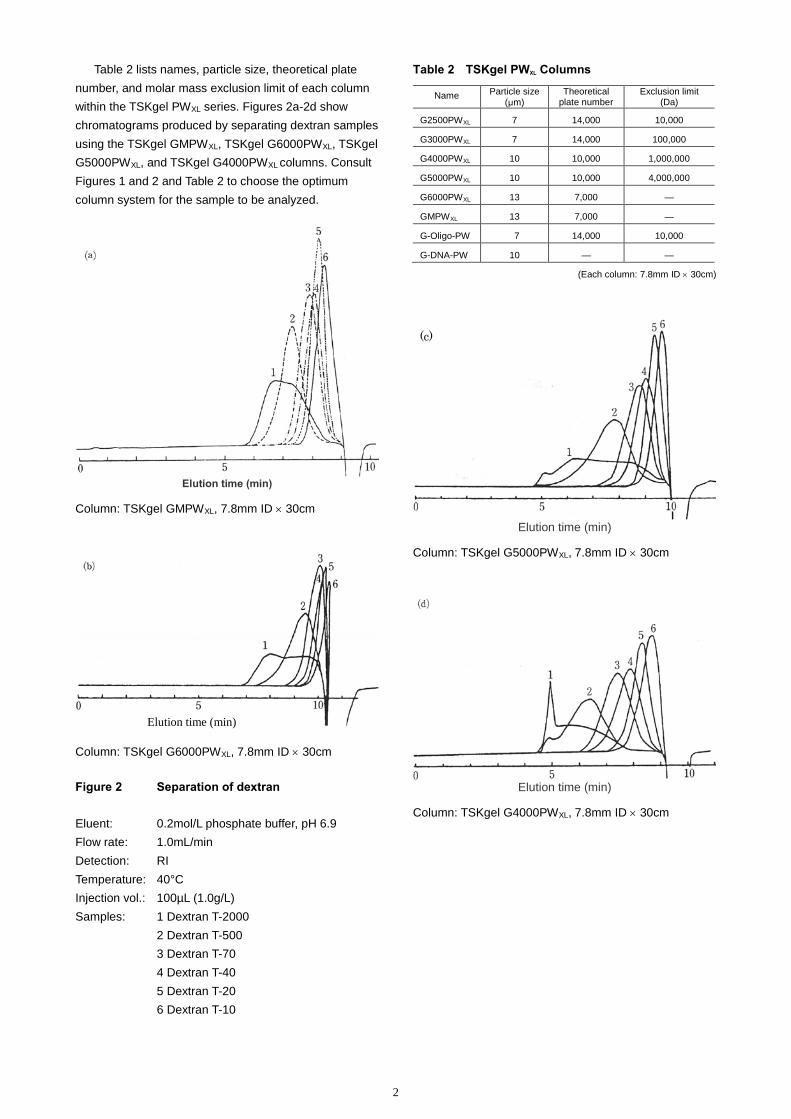
Table 2 lists names, particle size, theoretical plate number, and molar mass exclusion limit of each column within the TSKgel PWXL series. Figures 2a-2d show chromatograms produced by separating dextran samples using the TSKgel GMPWXL, TSKgel G6000PWXL, TSKgel G5000PWXL, and TSKgel G4000PWXL columns. Consult Figures 1 and 2 and Table 2 to choose the optimum column system for the sample to be analyzed.
Elution time (min)
Column: TSKgel GMPWXL, 7.8mm ID × 30cm
Elution time (min)
Column: TSKgel G6000PWXL, 7.8mm ID × 30cm
Figure 2 Separation of dextran Eluent: 0.2mol/L phosphate buffer, pH 6.9 Flow rate: 1.0mL/min Detection: RI Temperature: 40°C Injection vol.: 100µL (1.0g/L) Samples: 1 Dextran T-2000 2 Dextran T-500 3 Dextran T-70 4 Dextran T-40 5 Dextran T-20 6 Dextran T-10
Table 2 TSKgel PWXL Columns
Name Particle size (µm)
Theoretical plate number
Exclusion limit (Da)
G2500PWXL 7 14,000 10,000
G3000PWXL 7 14,000 100,000
G4000PWXL 10 10,000 1,000,000
G5000PWXL 10 10,000 4,000,000
G6000PWXL 13 7,000 —
GMPWXL 13 7,000 —
G-Oligo-PW 7 14,000 10,000
G-DNA-PW 10 — —
(Each column: 7.8mm ID × 30cm)
Elution time (min)
Column: TSKgel G5000PWXL, 7.8mm ID × 30cm
Elution time (min)
Column: TSKgel G4000PWXL, 7.8mm ID × 30cm
(c)

3
3. Comparison of performance of TSKgel PWXL and PW columns
Figures 3 and 4 are chromatograms comparing the performance of a TSKgel G6000PW + TSKgel G3000PW series of columns and a TSKgel G6000PWXL + TSKgel G3000PWXL series of columns.
Figure 3 compares elution profiles and resolution (Rs) obtained using a sample consisting of polyethylene oxide standards (SE-150: 1.20 ×10⁶ Da; SE-30: 2.8 ×10⁶ Da;
Figure 4 compares elution profiles obtained using a mixture of pullulan standards (P-400: 3.38 ×10⁵ Da; P-50: 4.67 ×10⁴ Da) as the sample. Columns in the TSKgel PWXL series are half as long as the 60cm columns in the TSKgel PW series columns, thus separation is completed in half the time, while resolution is equivalent to or higher than results produced with the TSKgel PW-type columns.
SE-8: 7.3 ×10⁴ Da).
TSKgel PW series columns Column size: 7.5mm ID × 60cm × 2
TSKgel PWXL series columns Column size: 7.8mm ID × 30cm × 2 Figure 3 Comparison of TSKgel PW and PWXL
Columns (1) Column: (Top) TSKgel G6000PW + TSKgel G3000PW (Bottom) TSKgel G6000PWXL + TSKgel G3000PWXL Eluent: 0.1mol/L NaCl Flow rate: 0.5mL/min Temperature: 50°C Injection vol.: 100µL (0.4g/L) Sample: polyethylene oxide, SE-150, SE-30, SE-8
TSKgel PWXL series columns Column size: 7.8mm ID × 30cm × 2
TSKgel PW series columns Column size: 7.5mm ID × 60cm × 2
Figure 4 Comparison of TSKgel PW and PWXLColumns (2)
Column: (A) TSKgel G6000PWXL + TSKgel G3000PWXL (B) TSKgel G6000PW + TSKgel G3000PW Eluent: 0.1mol/L NaCl Flow rate: 1.0mL/min Temperature: 50°C Injection vol.: 100µL (0.4, 1.2g/L) Sample: pullulan, P-400-P-50
Rs
Rs

4
Figure 5 shows the results of a comparison of the performance of two TSKgel PWXL columns with that of two TSKgel PW columns. A mixture of polyethylene oxide standards (SE-150: 1.20 × 10⁶ Da; SE-15: 15 × 104 Da; SE-2: 2.5 × 10⁴ Da) was used as the sample. As in Figures 3 and 4, performance of the TSKgel PWXL columns is the same or better at half the analysis time.
4. Effect of elution conditions on
resolution of the TSKgel PWXL series
1) Flow rate Figure 6 compares elution profiles at flow rates of
1.0mL/min and 0.5mL/min. Resolution (Rs) between the peaks are noted on the chromatograms. As expected according to theory, resolution improves as the flow rate decreases.
TSKgel PW series columns 7.5mm ID × 60cm × 2
TSKgel PWXL series columns 7.8mm ID × 30cm × 2
Figure 5 Comparison of TSKgel PW and PWXL
Columns (3) Column: (A) TSKgel G4000PW (B) TSKgel G4000PWXL Eluent: 0.1mol/L NaCl Flow rate: 1.0mL/min Temperature: 50°C Injection vol.: 100µL Sample: polyethylene oxide standards
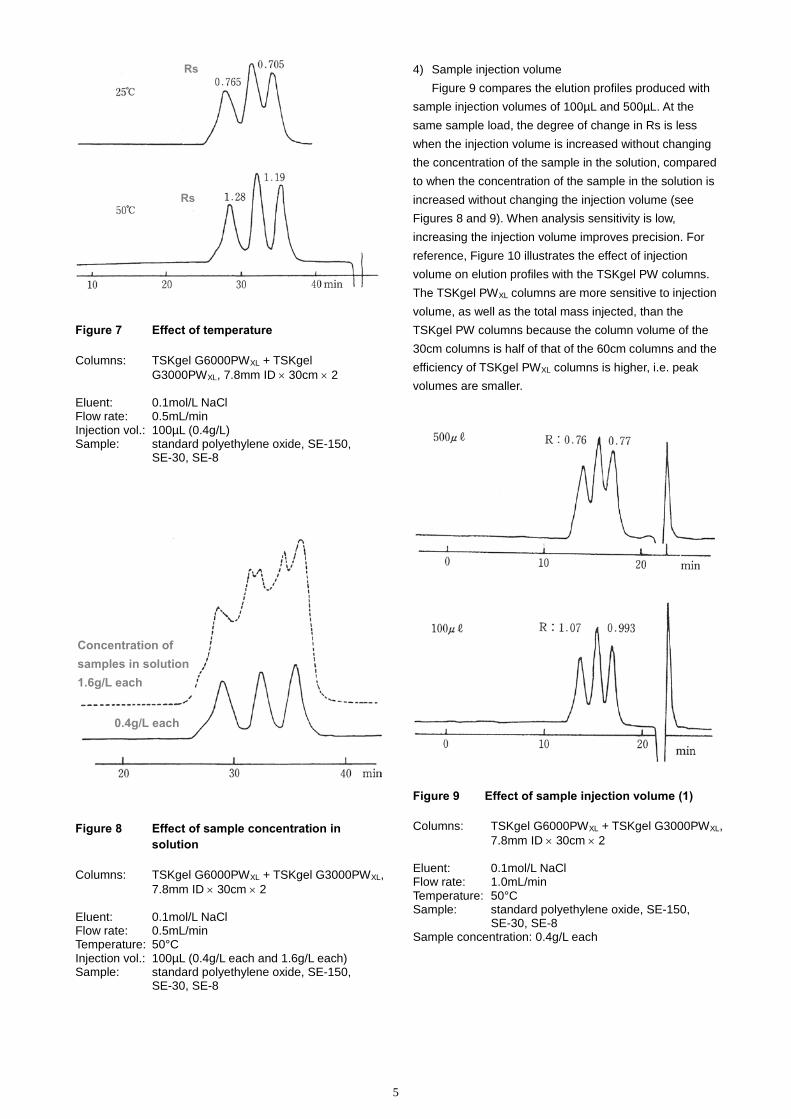
2) Temperature Figure 7 compares the elution profiles at 25°C and
50°C using a constant flow rate of 0.5mL/min. Increasing temperature causes a significant improvement in the resolution between the peaks. Note that the retention times do not change in size exclusion chromatography as it is an entropy-driven process. 3) Sample concentration
Figure 8 compares elution profiles produced when the sample concentration of each component was 0.4g/L versus 1.6g/L. Elution profiles are sensitive to sample volume used and total sample mass injected. Above a certain injection volume and sample mass, efficiency decreases due to extra-column band broadening due to mass overload. For example, in Figure 8, the sample mass injected (at 1.6g/L for each component) causes band broadening that was not visible at lower mass load.
Figure 6 Effect of flow rate Columns: TSKgel G6000PWXL + TSKgel 3000PWXL, 7.8mm ID × 30cm × 2 Eluent: 0.1mol/L NaCl Temperature: 50°C Injection vol.: 100µL (0.4g/L) Sample: polyethylene oxide standards, SE-150,
SE-30, SE-8
Rs
Rs
1.0mL/min
0.5mL/min
5
Figure 7 Effect of temperature Columns: TSKgel G6000PWXL + TSKgel
G3000PWXL, 7.8mm ID × 30cm × 2 Eluent: 0.1mol/L NaCl Flow rate: 0.5mL/min Injection vol.: 100µL (0.4g/L) Sample: standard polyethylene oxide, SE-150,
SE-30, SE-8
Concentration of samples in solution 1.6g/L each
0.4g/L each
Figure 8 Effect of sample concentration in
solution Columns: TSKgel G6000PWXL + TSKgel G3000PWXL,
7.8mm ID × 30cm × 2 Eluent: 0.1mol/L NaCl Flow rate: 0.5mL/min Temperature: 50°C Injection vol.: 100µL (0.4g/L each and 1.6g/L each) Sample: standard polyethylene oxide, SE-150,
SE-30, SE-8
4) Sample injection volume Figure 9 compares the elution profiles produced with
sample injection volumes of 100µL and 500µL. At the same sample load, the degree of change in Rs is less when the injection volume is increased without changing the concentration of the sample in the solution, compared to when the concentration of the sample in the solution is increased without changing the injection volume (see Figures 8 and 9). When analysis sensitivity is low, increasing the injection volume improves precision. For reference, Figure 10 illustrates the effect of injection volume on elution profiles with the TSKgel PW columns. The TSKgel PWXL columns are more sensitive to injection volume, as well as the total mass injected, than the TSKgel PW columns because the column volume of the 30cm columns is half of that of the 60cm columns and the efficiency of TSKgel PWXL columns is higher, i.e. peak volumes are smaller.
Figure 9 Effect of sample injection volume (1) Columns: TSKgel G6000PWXL + TSKgel G3000PWXL, 7.8mm ID × 30cm × 2 Eluent: 0.1mol/L NaCl Flow rate: 1.0mL/min Temperature: 50°C Sample: standard polyethylene oxide, SE-150,
SE-30, SE-8 Sample concentration: 0.4g/L each
Rs
Rs

6
5. Relationship between theoretical plate number and resolution (Rs)
In high performance liquid chromatography, the quality of the separation between components is expressed by Equation (1).
···················· (1)
Here Rs represents the resolution of two peaks, with better separation indicated by larger Rs values. N expresses the theoretical plate number; α, the selectivity factor, and K´, the retention factor, which are calculated using Equations (2) and (3), respectively.
··················································· (2)
··················································· (3)
VR and VO are the retention volume of the analyte and the void volume, respectively. The method for calculating the resolution Rs is shown in Figure 11. Due to (ideally) the absence of interaction between the sample and the packing material in GFC and GPC, α and K´ are constants that are unrelated to the length of the column. Thus Equation (1) becomes:
························ (1´) K: constant value
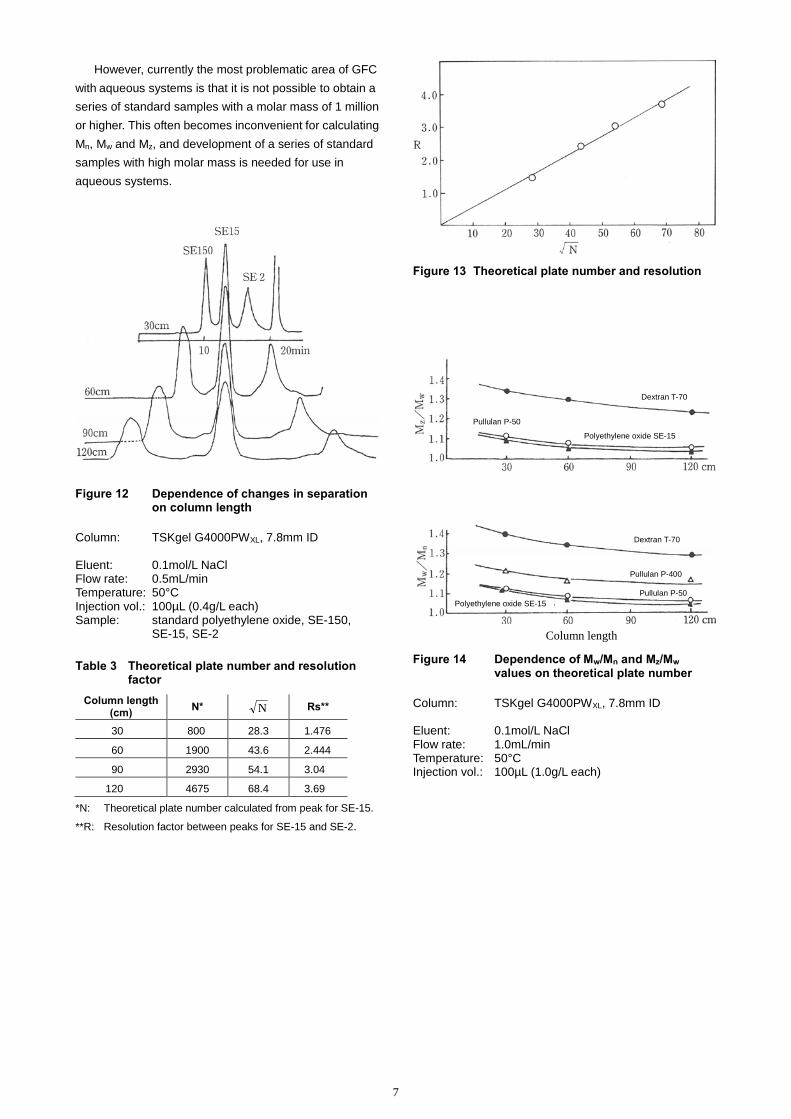
A simple way to increase resolution is to increase the number of theoretical plates by lengthening the column.
Figure 12 shows changes in the elution profiles for a mixture of polyethylene oxide standards when changing the length of the column. As expected from equation 1, resolution improves as the length of the column increases. Table 3 shows theoretical plate number N for SE-15 at various column lengths as well as calculations of Rs between peaks SE-15 and SE-2. Rs values are plotted as a function of N in Figure 13. A very good linear relationship is achieved, satisfying the relationship expressed by equation (1’).
6. Dependence of Mw/Mn and Mz/Mw on
theoretical plate number and sample concentration in GFC
Mw/Mn and Mz/Mw values for polyethylene oxide SE-15, pullulan P-50 and P-400, and dextran T-70 standards analyzed on TSKgel G4000PWXL columns with varying column lengths are shown in Figure 14. Mw/Mn and Mz/Mw values for the dextran, pullulan, and polyethylene oxide standards reached a constant value for a column length of ≥120cm.
Figure 15 shows changes in Mw/Mn and Mz/Mw values produced when the concentration of the sample was varied using a 30cm column. Mw/Mn and Mz/Mw values did
not change over the concentration range of 0.05-0.2% (injection volume: 100µL).
For each of these samples, Mw/Mn and Mz/Mw values approach unity as the column length, thus theoretical plate numbers, increase. However, to obtain accurate Mw/Mn and Mz/Mw values, a column length of 120cm is necessary when using a TSKgel G4000PWXL column.
Figure 10 Effect of sample injection volume (2) Columns: TSKgel G6000PW + TSKgel G3000PW, 7.5mm ID × 60cm × 2 Eluent: 0.1mol/L NaCl Flow rate: 1.0mL/min Temperature: 50°C Sample: standard polyethylene oxide, SE-150,
SE-30, SE-8 Sample solution concentration: 0.4g/L each
Figure 11 Method for calculating resolution factor
····································· (a) or:
······································ (b)
Note to Figure 11: The value of Rs in equation (a) increases as separation improves, while in (b) Rs will reach a maximum value of 100% when baseline separation is achieved.
Rs
Rs=K√N
500µL
100µL
Rs = 2 (VR2 – VR1) W1 + W2
Rs = h2 x 100 h1 + h2
7
However, currently the most problematic area of GFC with aqueous systems is that it is not possible to obtain a series of standard samples with a molar mass of 1 million or higher. This often becomes inconvenient for calculating Mn, Mw and Mz, and development of a series of standard samples with high molar mass is needed for use in aqueous systems.
Figure 12 Dependence of changes in separation
on column length Column: TSKgel G4000PWXL, 7.8mm ID Eluent: 0.1mol/L NaCl Flow rate: 0.5mL/min Temperature: 50°C Injection vol.: 100µL (0.4g/L each) Sample: standard polyethylene oxide, SE-150,
SE-15, SE-2
Table 3 Theoretical plate number and resolution factor
Column length (cm) N* N Rs**
30 800 28.3 1.476
60 1900 43.6 2.444
90 2930 54.1 3.04
120 4675 68.4 3.69
*N: Theoretical plate number calculated from peak for SE-15.
**R: Resolution factor between peaks for SE-15 and SE-2.
Figure 13 Theoretical plate number and resolution
Column length
Dextran T-70
Pullulan P-50
Polyethylene oxide SE-15
Dextran T-70
Pullulan P-400
Pullulan P-50 Polyethylene oxide SE-15
Figure 14 Dependence of Mw/Mn and Mz/Mw
values on theoretical plate number Column: TSKgel G4000PWXL, 7.8mm ID Eluent: 0.1mol/L NaCl Flow rate: 1.0mL/min Temperature: 50°C Injection vol.: 100µL (1.0g/L each)

8
Concentration Figure 15 Dependence of Mw/Mn and Mz/Mw
values on concentration of sample solution
Column: TSKgel G4000PWXL, 7.8mm ID × 30cm Eluent: 0.1mol/L NaCl Flow rate: 1.0mL/min Temperature: 50°C Injection vol.: 100µL
7. Analyzing molar mass by GFC/LALLS (low-angle laser light scattering detector) using a TSKgel GMPWXL column
1) Analyzing weight-average molar mass Mw of pullulan standard sample
Pullulan standard samples with a narrow molar mass distribution are commercially available. The molar mass of pullulan was analyzed by GFC/LALLS using a TSKgel GMPWXL column (Figure 16).
Table 4 shows the results of separation for each pullulan standard. Human serum albumin (M=66,000) was used as the primary standard, with pullulan P-100 as the secondary standard. For pullulan, molar masses were determined by Professor Kawahara et al., using sedimentation equilibrium and by Professor Takagi et al., using GFC/LALLS
2) Measuring the weight-average molar mass Mw of standard sodium polystyrene sulfonate (PNaSS)
Sodium polystyrene sulfonate standards are commercially available from Pressure Chemical Company (Pittsburgh, PA), as a standard polymer electrolyte with a narrow molar mass distribution.
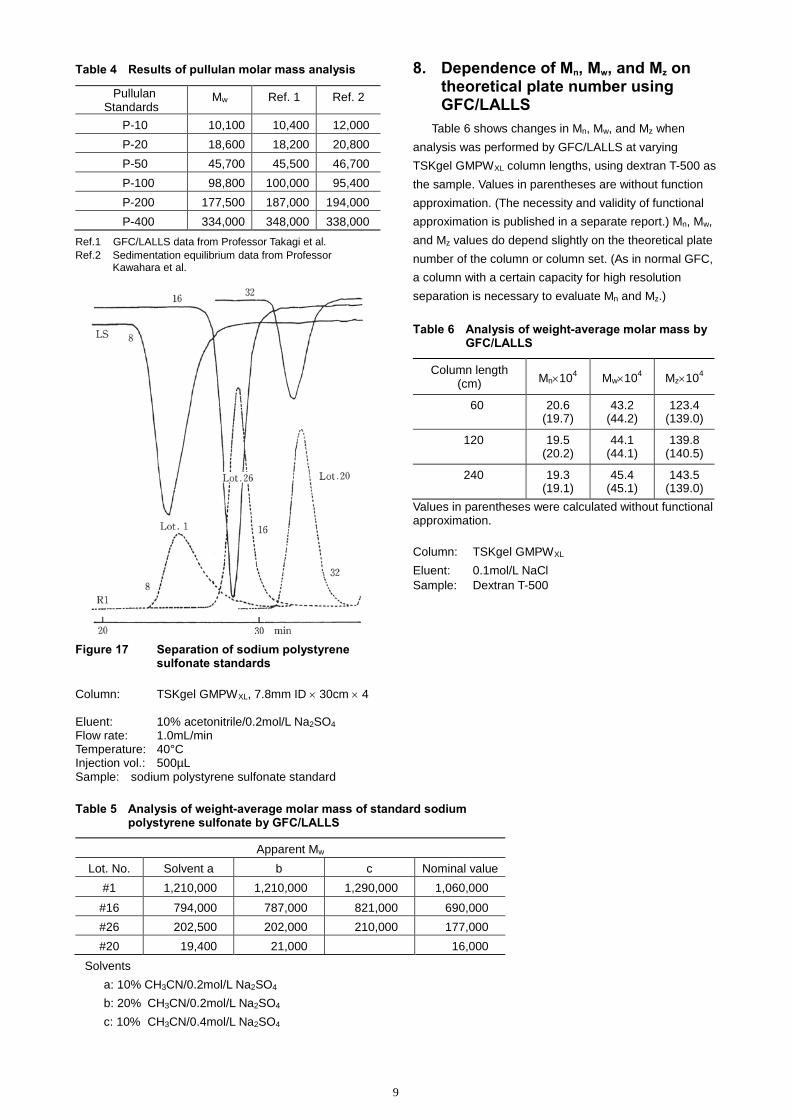
Separation of sodium polystyrene sulfonate standards by GFC requires the addition of at least 10% acetonitrile or methanol to a 0.2mol/L Na2SO4 mobile phase. Figure 17 shows chromatograms for sodium polystyrene
sulfonate standards using a TSKgel GMPWXL column. Peak shapes for sodium polystyrene sulfonate samples obtained by adding 10% acetonitrile to a 0.2mol/L Na2SO4 mobile phase remained constant upon addition of more acetonitrile
Table 5 shows the results of a study of the differences in the apparent molar mass Mw of each sample with varying eluent compositions. Small changes in the concentration of inorganic salt or % acetonitrile in the mobile phase caused only minor changes in apparent Mw. However, the values resulting from GFC analyses in each case were slightly higher than the nominal values provided by the manufacturer. Various explanations for this have been considered, including the complexity of the solvent composition, the inability of this method to handle light scattering in a two-component solution, and the hygroscopic properties of the samples. This problem will be a subject of future research in GFC/LALLS.
Elution time (min)
Figure 16 Chromatogram of pullulan by GFC/LALLS Column: TSKgel GMPWXL, 7.8mm ID × 120cm Eluent: 0.1mol/L NaCl Flow rate: 1.0mL/min Temperature: 40°C Injection vol.: 500µL Sample: pullulan
9
Table 4 Results of pullulan molar mass analysis
Pullulan Standards
Mw Ref. 1 Ref. 2
P-10 10,100 10,400 12,000 P-20 18,600 18,200 20,800 P-50 45,700 45,500 46,700 P-100 98,800 100,000 95,400 P-200 177,500 187,000 194,000 P-400 334,000 348,000 338,000
Ref.1 GFC/LALLS data from Professor Takagi et al. Ref.2 Sedimentation equilibrium data from Professor
Kawahara et al.
Figure 17 Separation of sodium polystyrene
sulfonate standards Column: TSKgel GMPWXL, 7.8mm ID × 30cm × 4 Eluent: 10% acetonitrile/0.2mol/L Na2SO4 Flow rate: 1.0mL/min Temperature: 40°C Injection vol.: 500µL Sample: sodium polystyrene sulfonate standard
8. Dependence of Mn, Mw, and Mz on theoretical plate number using GFC/LALLS
Table 6 shows changes in Mn, Mw, and Mz when analysis was performed by GFC/LALLS at varying TSKgel GMPWXL column lengths, using dextran T-500 as the sample. Values in parentheses are without function approximation. (The necessity and validity of functional approximation is published in a separate report.) Mn, Mw, and Mz values do depend slightly on the theoretical plate number of the column or column set. (As in normal GFC, a column with a certain capacity for high resolution separation is necessary to evaluate Mn and Mz.)
Table 6 Analysis of weight-average molar mass by
GFC/LALLS
Column length (cm) Mn×104 Mw×104 Mz×104
60 20.6 (19.7)
43.2 (44.2)
123.4 (139.0)
120 19.5 (20.2)
44.1 (44.1)
139.8 (140.5)
240 19.3 (19.1)
45.4 (45.1)
143.5 (139.0)
Values in parentheses were calculated without functional approximation. Column: TSKgel GMPWXL Eluent: 0.1mol/L NaCl Sample: Dextran T-500
Table 5 Analysis of weight-average molar mass of standard sodium polystyrene sulfonate by GFC/LALLS
Apparent Mw Lot. No. Solvent a b c Nominal value
#1 1,210,000 1,210,000 1,290,000 1,060,000
#16 794,000 787,000 821,000 690,000 #26 202,500 202,000 210,000 177,000 #20 19,400 21,000 16,000
Solvents a: 10% CH3CN/0.2mol/L Na2SO4 b: 20% CH3CN/0.2mol/L Na2SO4 c: 10% CH3CN/0.4mol/L Na2SO4

10
9. Selection of solvents for GFC separation of water-soluble polymers
Table 7 lists various types of common water-soluble polymers. Although there are many types of water-soluble polymers, most samples can be analyzed using a limited number of mobile phases as is indicated in Table 8. For example, analyzing viscose is difficult, as this substance can only be dissolved in a highly alkaline aqueous solution. Also, to analyze polymers with aromatic rings in their side chain, such as sodium polystyrene sulfonate, requires the addition of methanol or another organic solvent, to reduce hydrophobic interaction with the particle matrix.
To date, the separation of polycations is challenging due to the presence of trace quantities of carboxyl groups in the particle matrix. However, this problem can be solved by working at an acidic pH, thus inhibiting the dissociation of carboxyl groups and by increasing the ionic
strength. It should be noted that when polyanions are analyzed after having performed the separation of a polycation sample on the same column, polyanions, which are usually easy to analyze, tend to show signs of adsorption. Therefor it is recommended to dedicate a column strictly for the separation of polycation samples.
Several GFC applications of water-soluble polymers are shown in Figures 18-23. Figures 18-21 are chromatograms using a TSKgel G6000PWXL, TSKgel G5000PWXL, and TSKgel G4000PWXL column, respectively. Figure 22 shows the results using the TSKgel GMPWXL column. Figure 23 shows various polycations in an acetate buffer system using the TSKgel GMPWXL column. Each of these chromatograms was produced at a flow rate of 1.0mL/min with RI detection.
Note: Consult the Tosoh Bioscience website for TSKgel PWXL-CP columns that were specifically developed for the analysis of cationic water-soluble polymers.
Table 7 Types of water-soluble polymers
Water-soluble polymers
Natural polymers Semi-synthetic polymers Synthetic polymers
Starches Sweet potato starch
Potato starch
Wheat starch
Cellulosics Viscose
Methylcellulose
Ethylcellulose
Hydroxyethyl cellulose
Carboxymethyl cellulose
Polyvinyl alcohol
Polyethylene oxide
Polyvinyl ether
Polyvinylpyrrolidone
Polyacrylamide Mannan Konnyaku
Seaweed Glue plant (funori)
Agar (galactan)
Sodium alginate
Starches Soluble starch
Carboxymethyl starch
Dialdehyde starch
Sodium polyacrylate
Sodium polystyrene sulfonate
Polyacrylamine
Polyvinylpyridine hydrochloride
Polyethylenimine Plant mucilage Abelmosk
Tragacanth gum,
Gum arabic
Viscous substances derived from microbials
Dextran
Levan
Proteins Glue
Gelatin
Casein
Collagen

2
Table 8 Types of Eluents
Type Representative Eluent for use with TSKgel PW columns
Non-electrolyte polymers and polyanions
0.2mol/L phosphate buffer, pH 7, or 20% CH3CN (or CH3OH) / 0.2mol/L phosphate buffer, pH 7
Polycations 0.5mol/L acetate + 0.5mol/L sodium acetate or 0.3mol/L TEA + conc. phosphoric acid, pH 2.9
TEA: Triethanolamine
Figure 18 Separation of sodium polyacrylate Column size: 7.8mm ID × 30cm × 2 Eluent: 0.2mol/L phosphate buffer, pH 6.9
Figure 19 Separation of DNA sodium salt Column size: 7.8mm ID × 30cm × 2 Eluent: 0.2mol/L phosphate buffer, pH 6.9
Figure 20 Separation of gelatin Column size: 7.8mm ID × 30cm × 2 Eluent: 0.2mol/L phosphate buffer, pH 6.9

12
Figure 21 Separation of chondroitin sulfate
Column size: 7.8mm ID × 30cm × 2 Eluent: 0.2mol/L phosphate buffer, pH 6.9
Chondroitin sulfate
Gelatin
Gum Arabic
Figure 22 Separation performed using TSKgel GMPWXL column (1)
Column size: 7.8mm ID × 30cm × 2 Eluent: 0.2mol/L phosphate buffer, pH 6.9
Glycol Chitosan
Polyethylene piperazine
Ionene
Polyethylenimine
Figure 23 Separation performed using TSKgel GMPWXL column (2)
Column size: 7.8mm ID × 30cm × 2 Eluent: 0.5mol/L phosphate buffer + 0.5mol/L
sodium acetate

14
10. Conclusions
When used for analytical purposes, TSKgel PWXL columns provide improved performance over conventional GFC columns. In addition to an improvement in overall separation efficiency, 30cm high performance TSKgel PWXL columns offer several advantages over 60cm TSKgel PW columns, including
• A two-fold reduction in analysis time and solvent use
• Increased peak height and thus higher sensitivity .
Note: While 30cm TSKgel PWXL columns are preferred over 60cm TSKgel PW columns for analytical separations, for preparative purposes 60cm TSKgel PW columns outperform the shorter TSKgel PWXL columns simply because they contain more packing material, which allows a proportional increase in sample mass that can be injected.
For further information about the TSKgel PWXL and PW columns, we recommend that you consult the following Separation Reports available at www.tosohbioscience.com:
SR037: Introduction of Aqueous SEC Columns:
TSKgel PWXL series SR106: Aqueous SEC Columns for Analysis of Cationic
Polymers: TSKgel PWXL-CP Series

TOSOH BIOSCIENCE
TOSOH Bioscience LLC3604 Horizon Drive, Suite 100
King of Prussia, PA 19406Orders & Service: (800) 366-4875
Fax: (610) 272-3028www.separations.us.tosohbioscience.com
email: [email protected]
T413110 SR038
0811