getting started with the nh stone wall mapper … nh stone wall mapper was developed by the nh...
TRANSCRIPT

Getting Started with the NH Stone Wall Mapper
January 2019
Stone walls are significant cultural and historical features of the New England landscape. Creating a
statewide inventory of existing stone walls is an important step towards preserving and maintaining
these landmarks. The NH Stone Wall Mapper is an online mapping tool for individuals throughout
New Hampshire to record the locations and attributes of stone walls in their area(s) of interest. The
interface of the Mapper is designed to allow users to input information even if they do not have
previous GIS or online mapping experience.
Users of the NH Stone Wall Mapper will have access to a number of data sets archived in NH GRANIT,
the NH statewide GIS clearinghouse. One of the primary data collections available includes Digital
Elevation Models (DEMs), or digital representations of a treeless (“bare earth”) landscape, derived
from topographic LiDAR data. Beyond helping to compile a statewide inventory of stone walls, the
Mapper serves as a resource for users interested in LiDAR data (and its derivatives), and how the data
can be viewed and utilized. For more information on LiDAR data available in NH, please visit
http://lidar.unh.edu.
Resources available for users of the NH Stone Wall Mapper include:
• NH Stone Wall Mapper – the online mapping tool
• “Getting Started with the NH Stone Wall Mapper” - this document, intended to provide users
with guidance to begin mapping stone wall resources in New Hampshire
• NH Stone Wall Mapper Help Video – a 7.5 minute video to introduce users to the NH Stone Wall
Mapper
• “Looking at LiDAR” – a description of how to interpret stone walls based on LiDAR datasets
• “Wall to Wall: Connecting Landscape and Culture” – an engaging and informative perspective
on stone walls in New Hampshire delivered via a story map authored by Rick Chormann, NH
State Geologist.
The NH Stone Wall Mapper was developed by the NH Geological Survey and NH GRANIT, with
significant input from a committed group of volunteers. We are grateful to the NH Charitable
Foundation for supporting the development of the NH Stone Wall Mapper.
Overview of Typical Workflow
In a typical session, a user will follow this general sequence of steps:
1. Navigate to an area of interest
2. Turn on desired reference datasets, such as imagery and/or LiDAR (elevation data), using the
Layers List tab
3. Trace and record stone walls using the Smart Editor tab
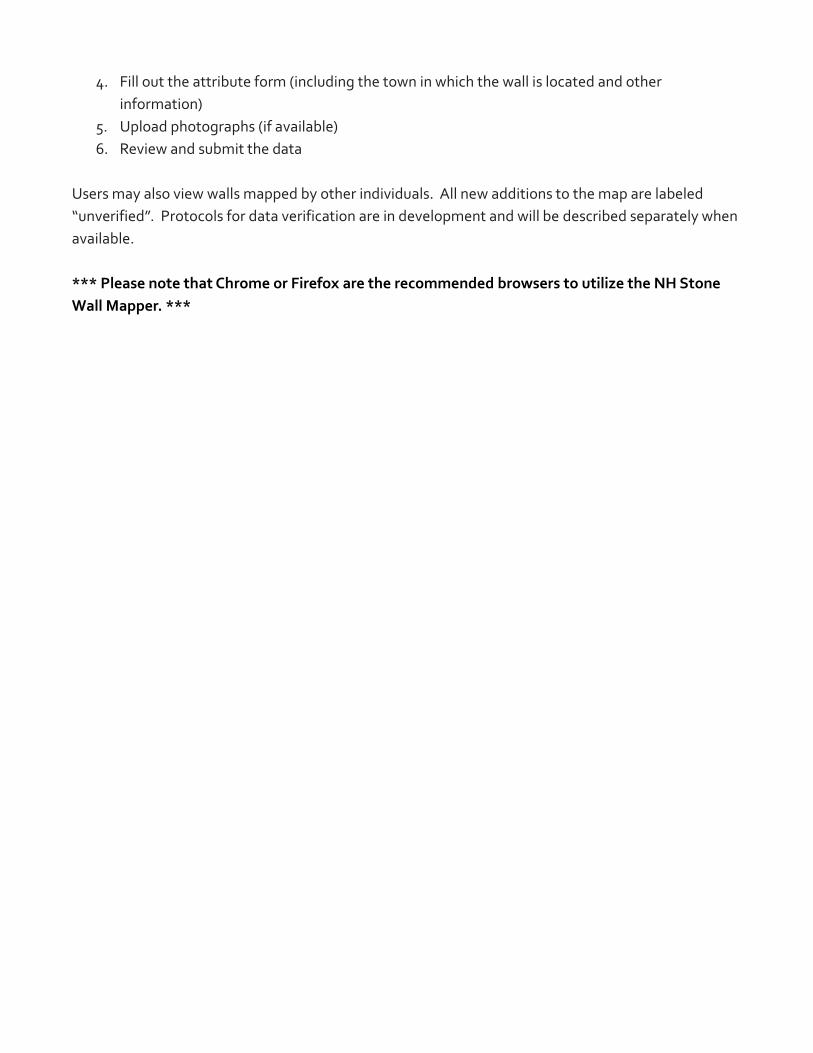
4. Fill out the attribute form (including the town in which the wall is located and other
information)
5. Upload photographs (if available)
6. Review and submit the data
Users may also view walls mapped by other individuals. All new additions to the map are labeled
“unverified”. Protocols for data verification are in development and will be described separately when
available.
*** Please note that Chrome or Firefox are the recommended browsers to utilize the NH Stone
Wall Mapper. ***
Getting Started
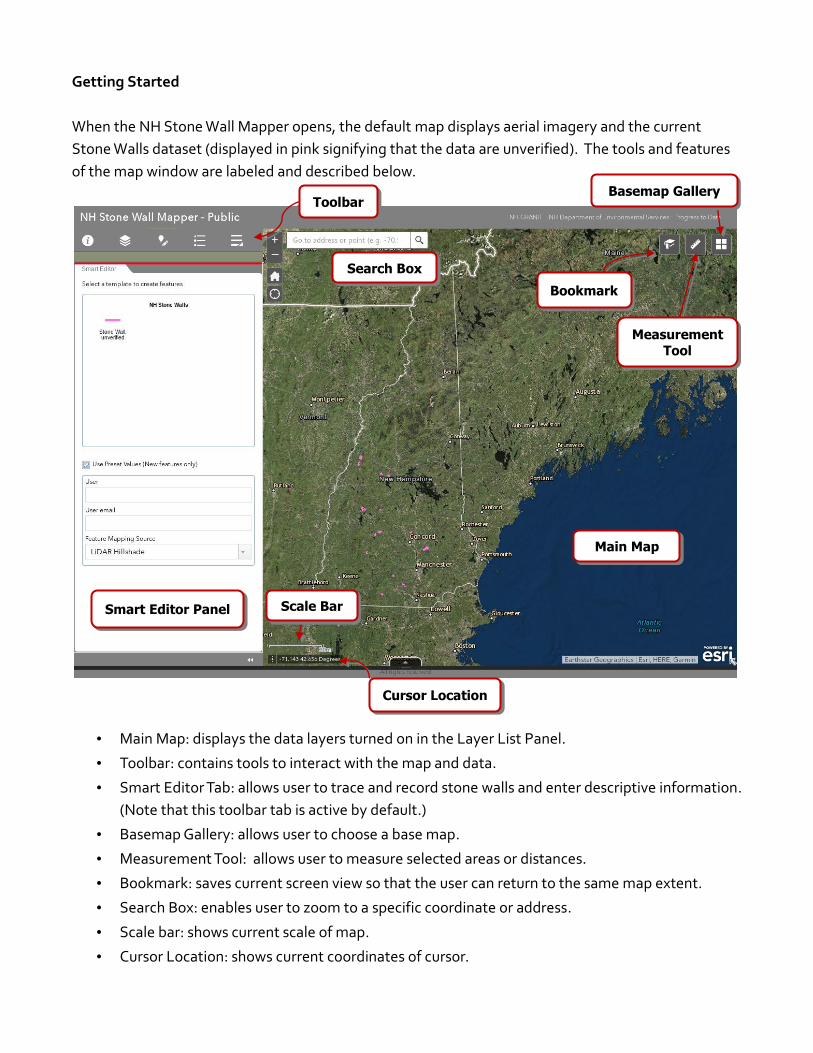
When the NH Stone Wall Mapper opens, the default map displays aerial imagery and the current
Stone Walls dataset (displayed in pink signifying that the data are unverified). The tools and features
of the map window are labeled and described below.
• Main Map: displays the data layers turned on in the Layer List Panel.
• Toolbar: contains tools to interact with the map and data.
• Smart Editor Tab: allows user to trace and record stone walls and enter descriptive information.
(Note that this toolbar tab is active by default.)
• Basemap Gallery: allows user to choose a base map.
• Measurement Tool: allows user to measure selected areas or distances.
• Bookmark: saves current screen view so that the user can return to the same map extent.
• Search Box: enables user to zoom to a specific coordinate or address.
• Scale bar: shows current scale of map.
• Cursor Location: shows current coordinates of cursor.
Smart Editor Panel
Main Map
Search Box
Basemap Gallery
Cursor Location
Bookmark
Scale Bar
Toolbar
Measurement
Tool
Navigating in the Main Map
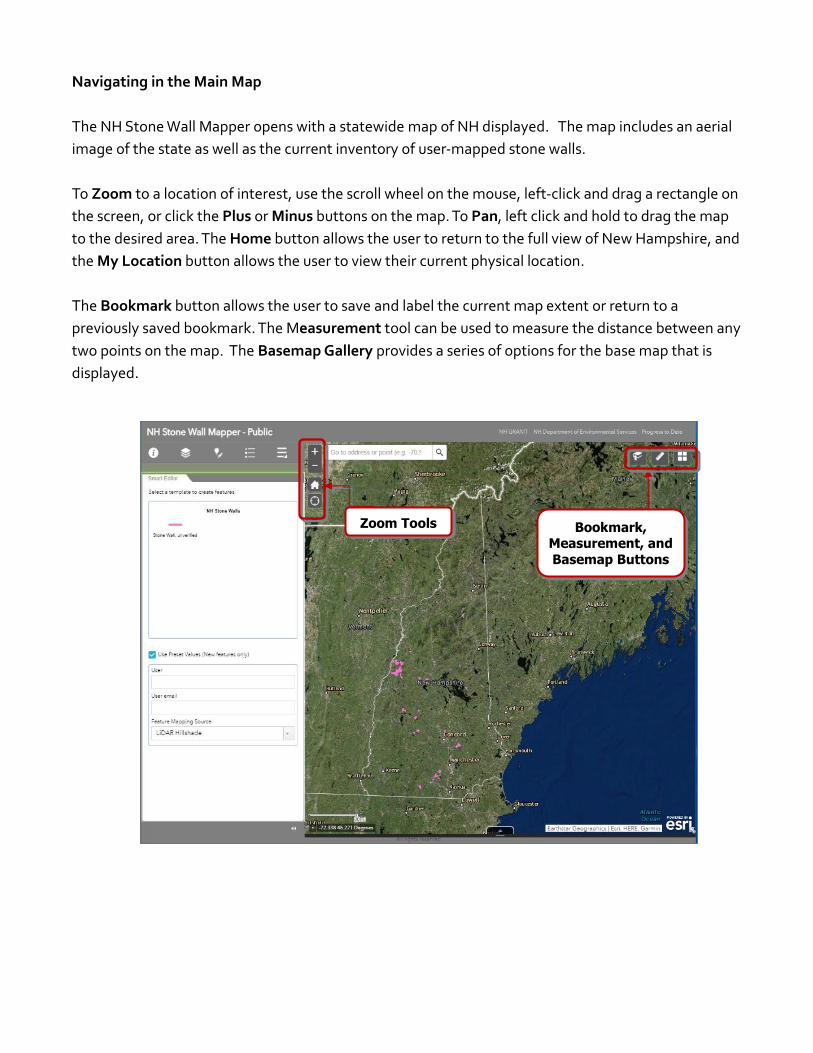
The NH Stone Wall Mapper opens with a statewide map of NH displayed. The map includes an aerial
image of the state as well as the current inventory of user-mapped stone walls.
To Zoom to a location of interest, use the scroll wheel on the mouse, left-click and drag a rectangle on
the screen, or click the Plus or Minus buttons on the map. To Pan, left click and hold to drag the map
to the desired area. The Home button allows the user to return to the full view of New Hampshire, and
the My Location button allows the user to view their current physical location.
The Bookmark button allows the user to save and label the current map extent or return to a
previously saved bookmark. The Measurement tool can be used to measure the distance between any
two points on the map. The Basemap Gallery provides a series of options for the base map that is
displayed.
Zoom Tools Bookmark, Measurement, and
Basemap Buttons
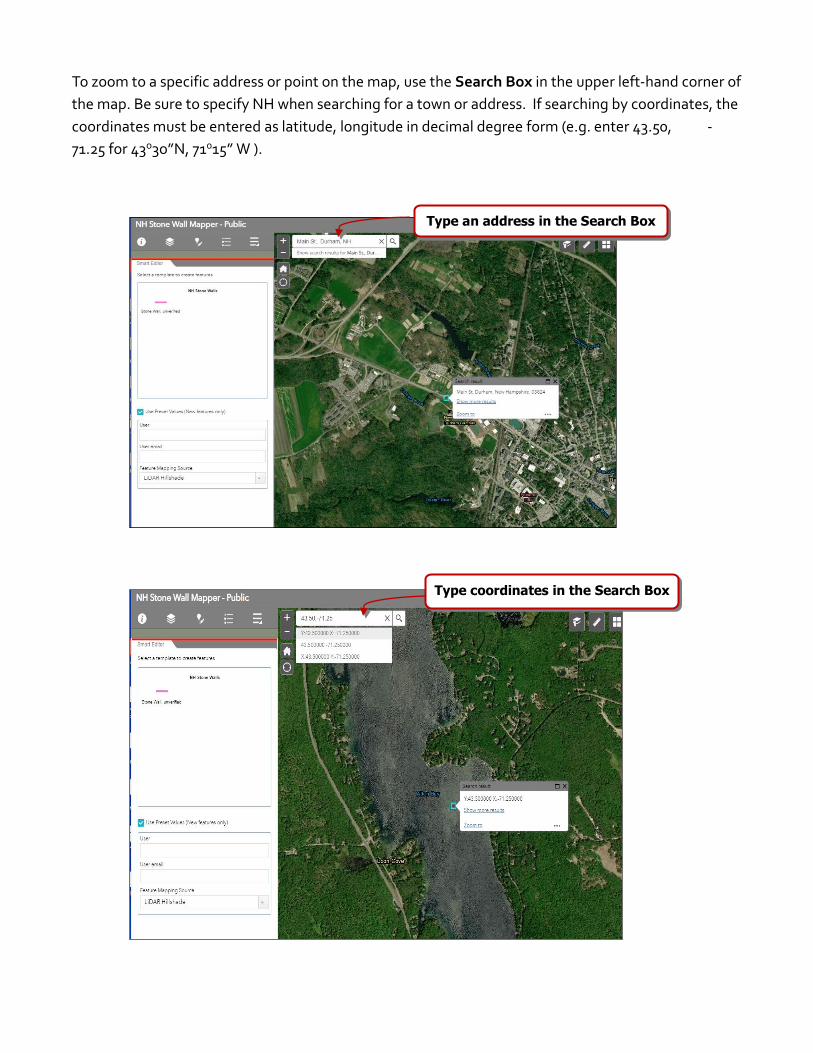
To zoom to a specific address or point on the map, use the Search Box in the upper left-hand corner of
the map. Be sure to specify NH when searching for a town or address. If searching by coordinates, the
coordinates must be entered as latitude, longitude in decimal degree form (e.g. enter 43.50, -
71.25 for 43o3o”N, 71015” W ).
Type coordinates in the Search Box
Type an address in the Search Box

The Toolbar
Located in the upper left corner of the map window, the Toolbar contains a number of tabs that change the display of the panel to the left of the Main Map and allow the user to interact with the map and create data. Tool Bar Tabs: About
Click the About tab to view a brief description of the Mapper.
Tool Bar Tabs: Layers List
The Layers List tab is a listing of the data layers available to view in the map. Data layers are made
visible on the map by clicking the box next to the layer name.
Tool Bar Tabs: Smart Editor
The Smart Editor tab provides access to the interactive tools for adding stone wall data to the map.
This tab is active by default.
Tool Bar Tabs: Legend
The Legend tab displays a list of the layers that are turned on in the map and shows the symbology
used to display each layer.
Tool Bar Tabs: More Tools
The More Tools tab provides access to tools for drawing graphics on the map, adding additional layers
of data, accessing the Swipe tool, and printing.
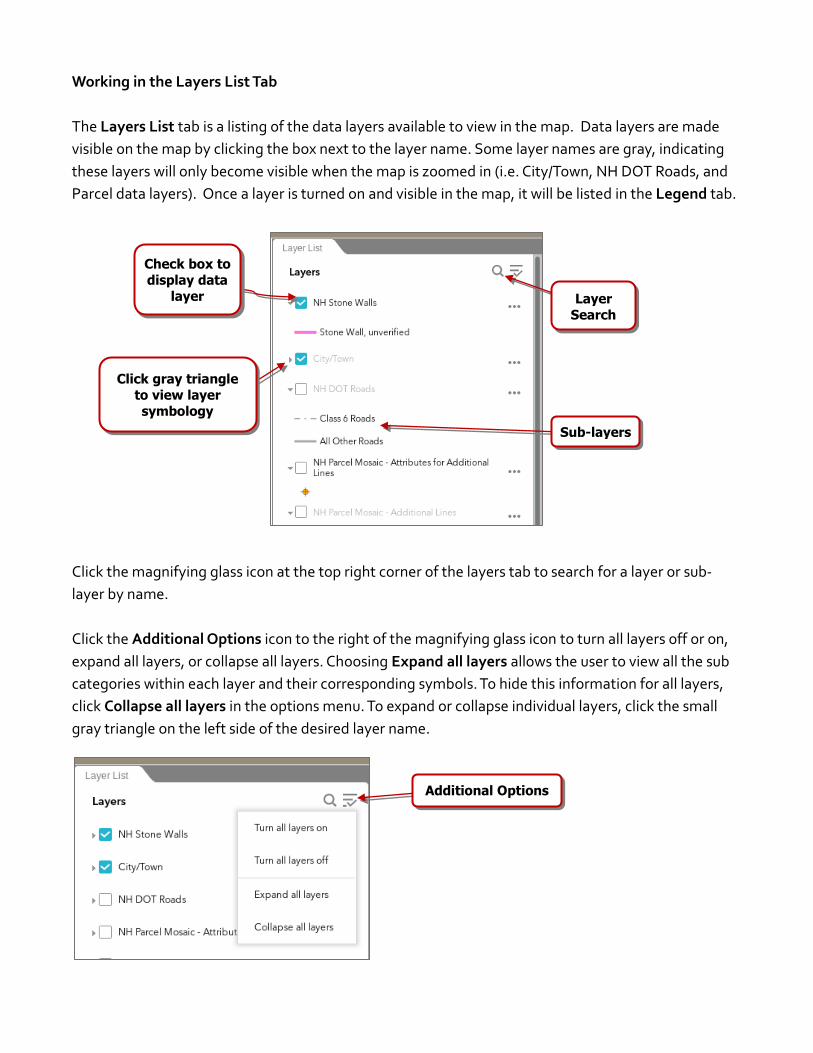
Working in the Layers List Tab
The Layers List tab is a listing of the data layers available to view in the map. Data layers are made
visible on the map by clicking the box next to the layer name. Some layer names are gray, indicating
these layers will only become visible when the map is zoomed in (i.e. City/Town, NH DOT Roads, and
Parcel data layers). Once a layer is turned on and visible in the map, it will be listed in the Legend tab.
Click the magnifying glass icon at the top right corner of the layers tab to search for a layer or sub-
layer by name.
Click the Additional Options icon to the right of the magnifying glass icon to turn all layers off or on,
expand all layers, or collapse all layers. Choosing Expand all layers allows the user to view all the sub
categories within each layer and their corresponding symbols. To hide this information for all layers,
click Collapse all layers in the options menu. To expand or collapse individual layers, click the small
gray triangle on the left side of the desired layer name.
Click gray triangle
to view layer
symbology
Sub-layers
Check box to
display data
layer
Additional Options
Layer
Search
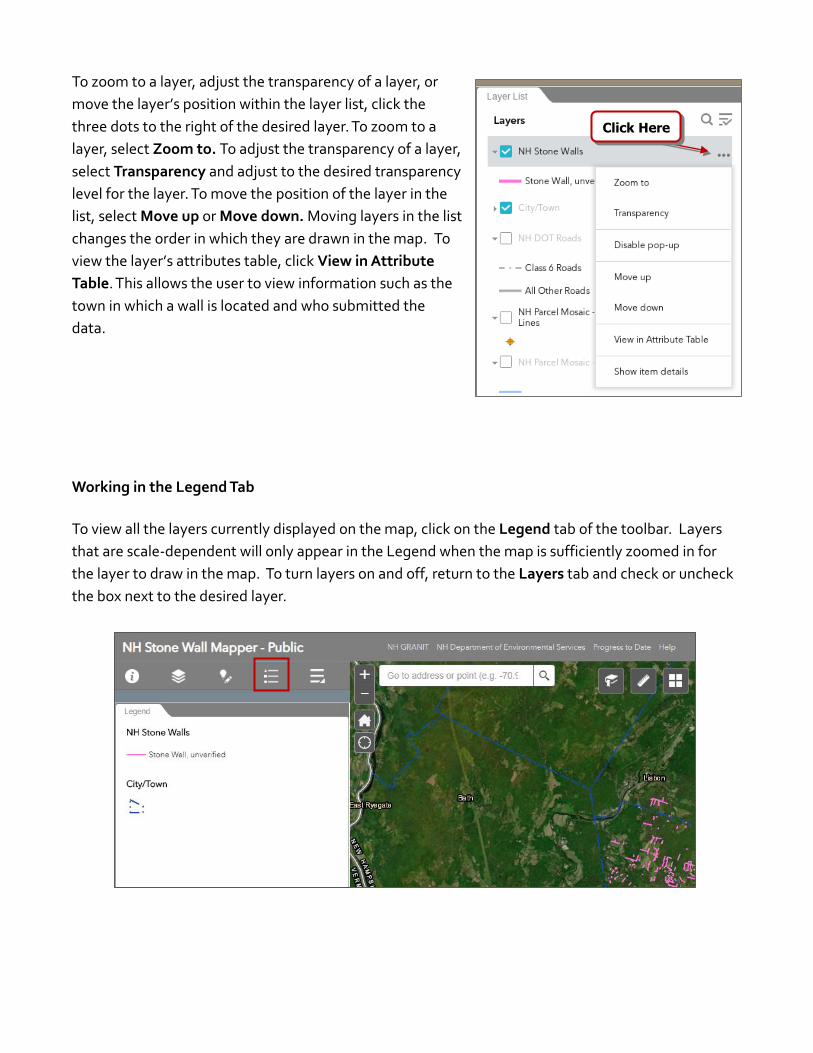
To zoom to a layer, adjust the transparency of a layer, or
move the layer’s position within the layer list, click the
three dots to the right of the desired layer. To zoom to a
layer, select Zoom to. To adjust the transparency of a layer,
select Transparency and adjust to the desired transparency
level for the layer. To move the position of the layer in the
list, select Move up or Move down. Moving layers in the list
changes the order in which they are drawn in the map. To
view the layer’s attributes table, click View in Attribute
Table. This allows the user to view information such as the
town in which a wall is located and who submitted the
data.
Working in the Legend Tab
To view all the layers currently displayed on the map, click on the Legend tab of the toolbar. Layers
that are scale-dependent will only appear in the Legend when the map is sufficiently zoomed in for
the layer to draw in the map. To turn layers on and off, return to the Layers tab and check or uncheck
the box next to the desired layer.
Click Here
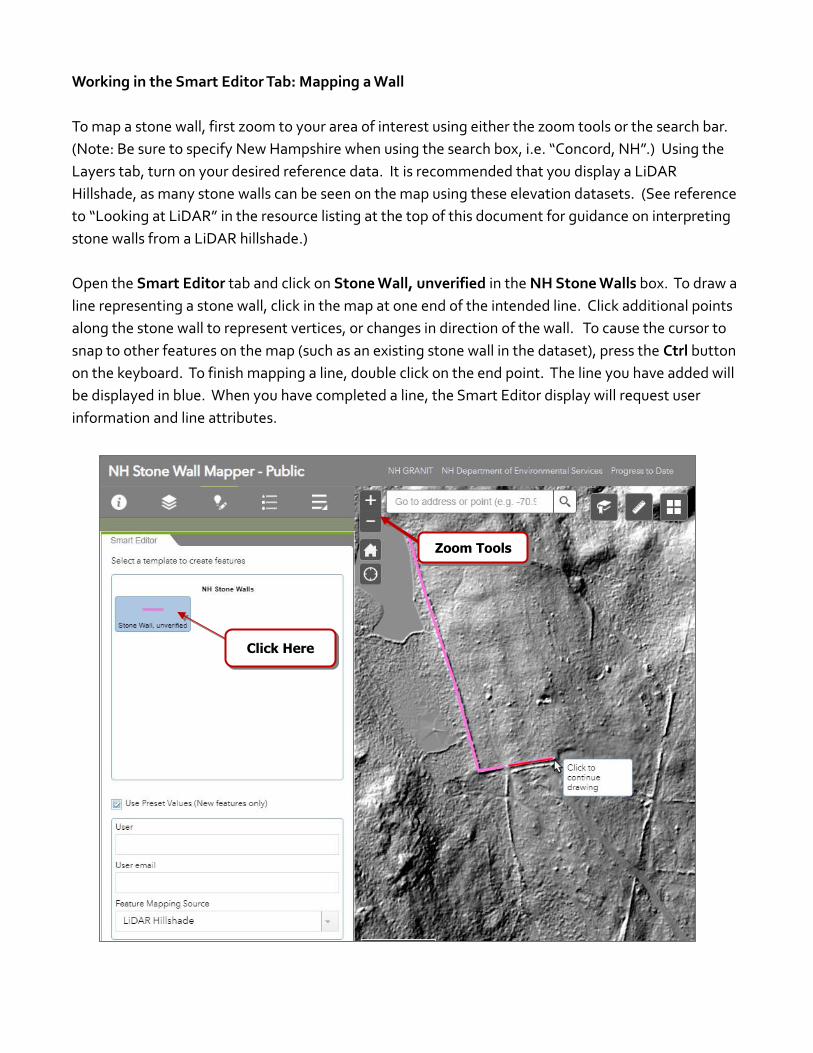
Working in the Smart Editor Tab: Mapping a Wall
To map a stone wall, first zoom to your area of interest using either the zoom tools or the search bar.
(Note: Be sure to specify New Hampshire when using the search box, i.e. “Concord, NH”.) Using the
Layers tab, turn on your desired reference data. It is recommended that you display a LiDAR
Hillshade, as many stone walls can be seen on the map using these elevation datasets. (See reference
to “Looking at LiDAR” in the resource listing at the top of this document for guidance on interpreting
stone walls from a LiDAR hillshade.)
Open the Smart Editor tab and click on Stone Wall, unverified in the NH Stone Walls box. To draw a
line representing a stone wall, click in the map at one end of the intended line. Click additional points
along the stone wall to represent vertices, or changes in direction of the wall. To cause the cursor to
snap to other features on the map (such as an existing stone wall in the dataset), press the Ctrl button
on the keyboard. To finish mapping a line, double click on the end point. The line you have added will
be displayed in blue. When you have completed a line, the Smart Editor display will request user
information and line attributes.
Zoom Tools
Click Here

To finish adding a wall to the map, enter your User
name and User email. (Within a single user session,
you may add additional features and avoid having to
re-enter this information by ensuring that the “Use
Preset Values” box is checked.) This step is optional,
but strongly encouraged. The Smart Editor will
automatically fill in the City or Town box with the
town in which the stone wall segment started. If the
wall spans a town boundary, you may wish to select
a different town from the drop-down menu. Ideally,
the town where most of the wall is located should
be the town entered in the City or Town box. In the
Feature Mapping Source box, select the dataset
used as the reference for your data. (Please note
that LiDAR Hillshade is the preferred source for
stone wall data.) In the Feature Mapping Notes
box, record any notes about the wall that could be
of importance such as type of rocks used, condition
of wall, etc. This box is optional and will likely only
be populated if you have viewed the stone wall in
the field. Please respect private property and always
obtain permission from the property owner before
entering. In the General Notes box, write any more
notes that are of importance to the data. This step is
also optional.
It is also possible to add an attachment to the data such as a photograph(s) or other documents
describing the stone wall being mapped. To do so, click the Choose File button under the
Attachments heading in the Smart Editor tab. (Note that the Attachments option will only appear
once you have mapped a stone wall.) Select the file(s) to be attached to the stone wall and click open
to add it to the Attachments box.
Note that a user can alter the geometry of the mapped line by clicking on the “Edit Geometry” button.
Hover over any of the vertices that define the line and move them as desired. Click Clear if you wish to
delete the entire entry and begin again.
When all data have been entered, click Save. This will save the mapped stone wall and any
photographs/documents you have added to the map. Once the line is saved, no further editing can be
performed.
”Edit Geometry” can be used to modify a
line BEFORE clicking
Save
Files selected
using “Choose File”
will be listed here
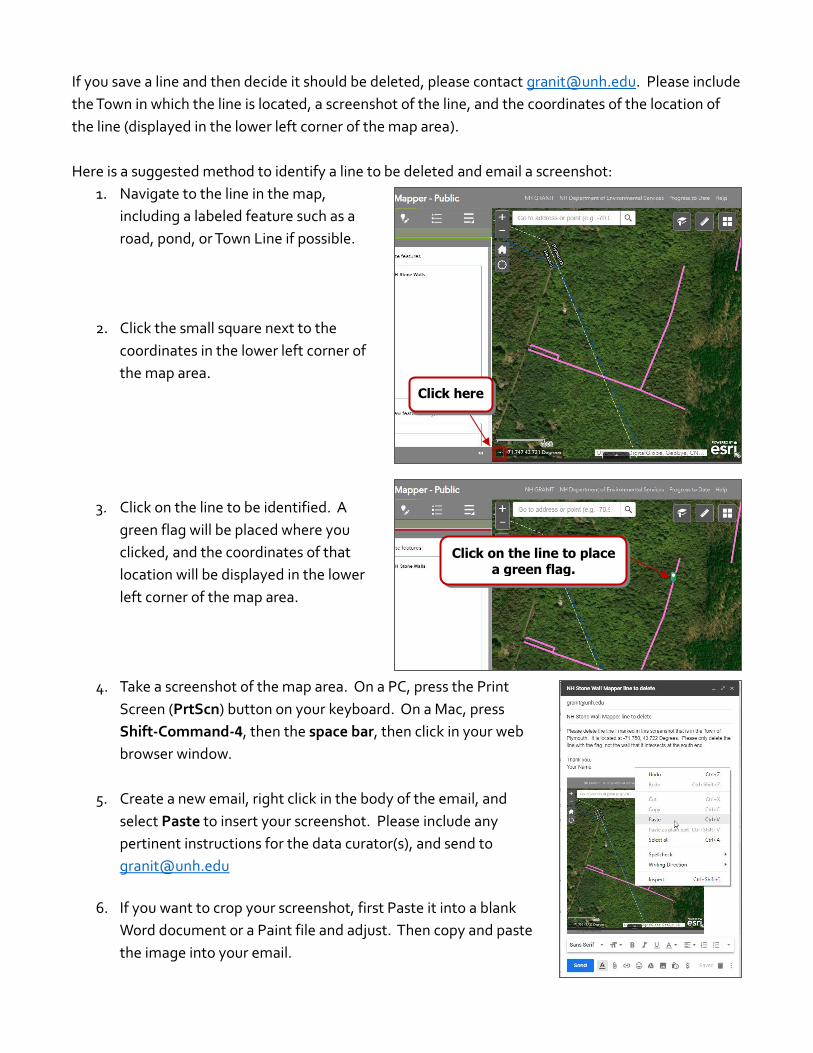
If you save a line and then decide it should be deleted, please contact [email protected]. Please include
the Town in which the line is located, a screenshot of the line, and the coordinates of the location of
the line (displayed in the lower left corner of the map area).
Here is a suggested method to identify a line to be deleted and email a screenshot:
1. Navigate to the line in the map,
including a labeled feature such as a
road, pond, or Town Line if possible.
2. Click the small square next to the
coordinates in the lower left corner of
the map area.
3. Click on the line to be identified. A
green flag will be placed where you
clicked, and the coordinates of that
location will be displayed in the lower
left corner of the map area.
4. Take a screenshot of the map area. On a PC, press the Print
Screen (PrtScn) button on your keyboard. On a Mac, press
Shift-Command-4, then the space bar, then click in your web
browser window.
5. Create a new email, right click in the body of the email, and
select Paste to insert your screenshot. Please include any
pertinent instructions for the data curator(s), and send to
6. If you want to crop your screenshot, first Paste it into a blank
Word document or a Paint file and adjust. Then copy and paste
the image into your email.
Click here
Click on the line to place
a green flag.
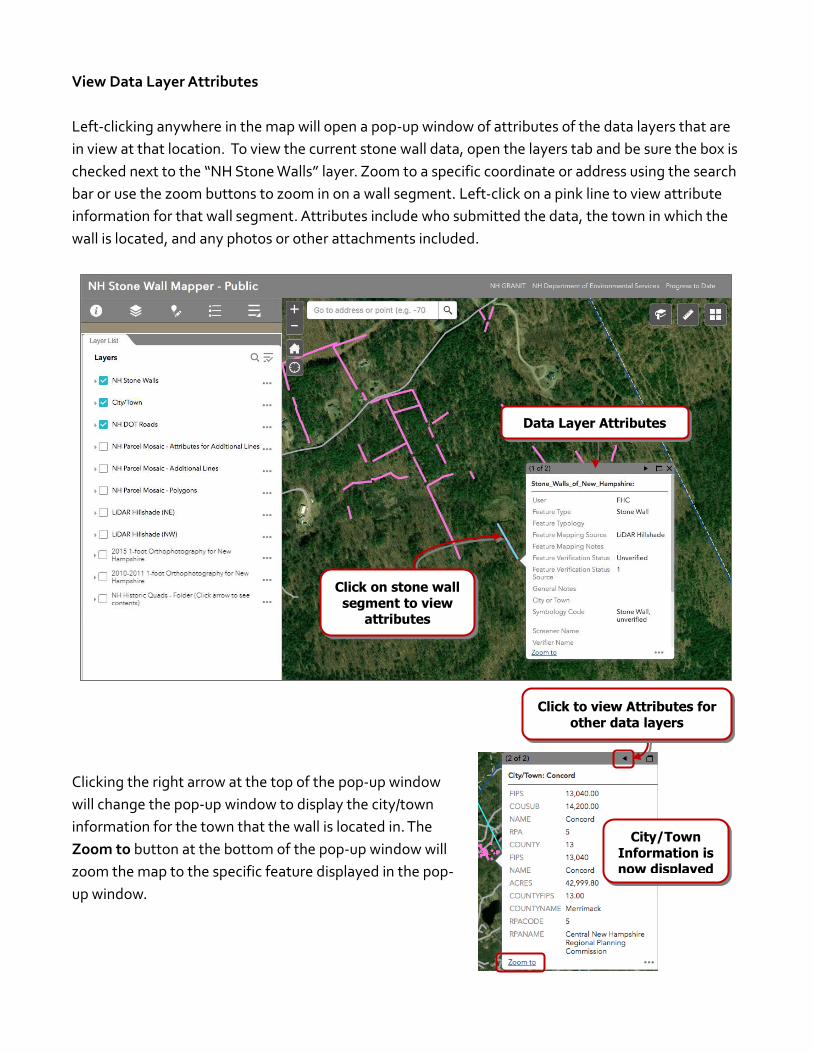
View Data Layer Attributes
Left-clicking anywhere in the map will open a pop-up window of attributes of the data layers that are
in view at that location. To view the current stone wall data, open the layers tab and be sure the box is
checked next to the “NH Stone Walls” layer. Zoom to a specific coordinate or address using the search
bar or use the zoom buttons to zoom in on a wall segment. Left-click on a pink line to view attribute
information for that wall segment. Attributes include who submitted the data, the town in which the
wall is located, and any photos or other attachments included.
Clicking the right arrow at the top of the pop-up window
will change the pop-up window to display the city/town
information for the town that the wall is located in. The
Zoom to button at the bottom of the pop-up window will
zoom the map to the specific feature displayed in the pop-
up window.
Click on stone wall
segment to view attributes
Data Layer Attributes
Click to view Attributes for
other data layers
City/Town
Information is now displayed

Going Further with the Stone Wall Mapper
Additional tools for working with the Stone Wall Mapper are available using the More Tools button in
the Toolbar. These include Swipe, Draw, Add Data, and Print.
Swipe allows the user to “move aside” a layer of data to reveal a layer underneath. This allows for a
quick comparison of two data layers, without having to turn the layers on and off. Before using the
tool, be sure that all layers of interest are turned on in the Layers List. Choose Swipe in the Toolbar,
then choose a layer from the drop-down menu that appears. Click the vertical Swipe bar in the middle
of the screen and drag it to the right or left.
Click and drag the
Swipe bar to hide/display data
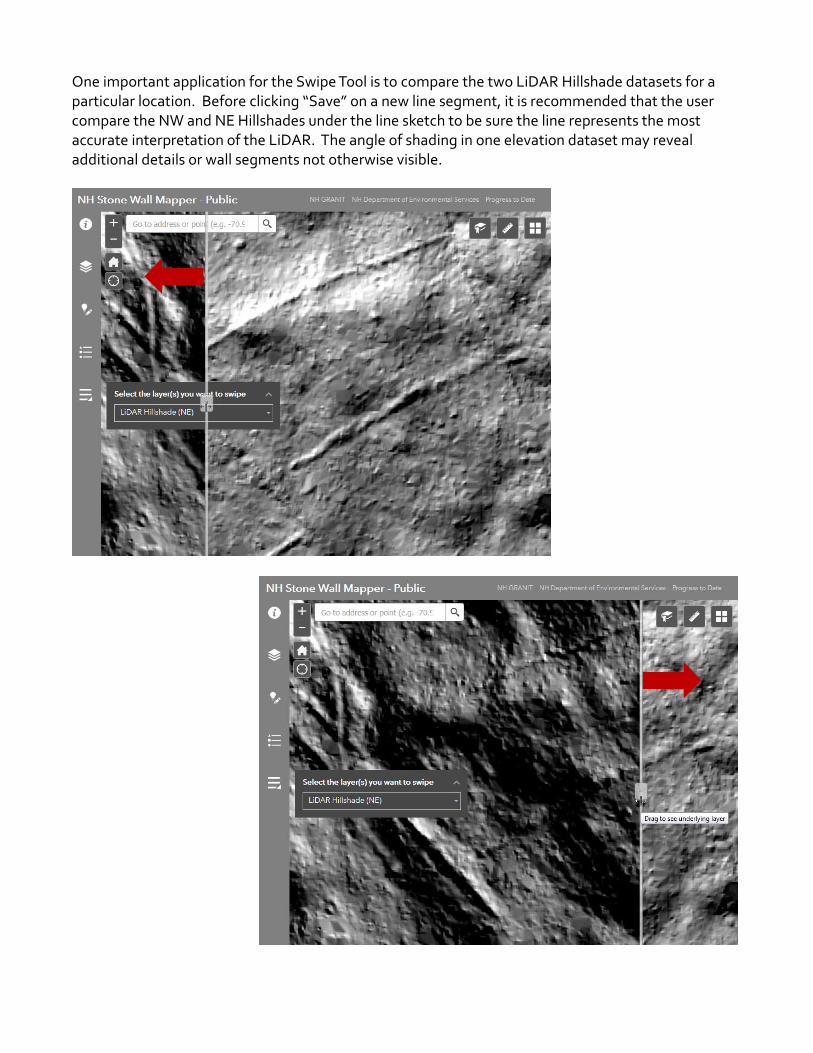
One important application for the Swipe Tool is to compare the two LiDAR Hillshade datasets for a particular location. Before clicking “Save” on a new line segment, it is recommended that the user compare the NW and NE Hillshades under the line sketch to be sure the line represents the most accurate interpretation of the LiDAR. The angle of shading in one elevation dataset may reveal additional details or wall segments not otherwise visible.
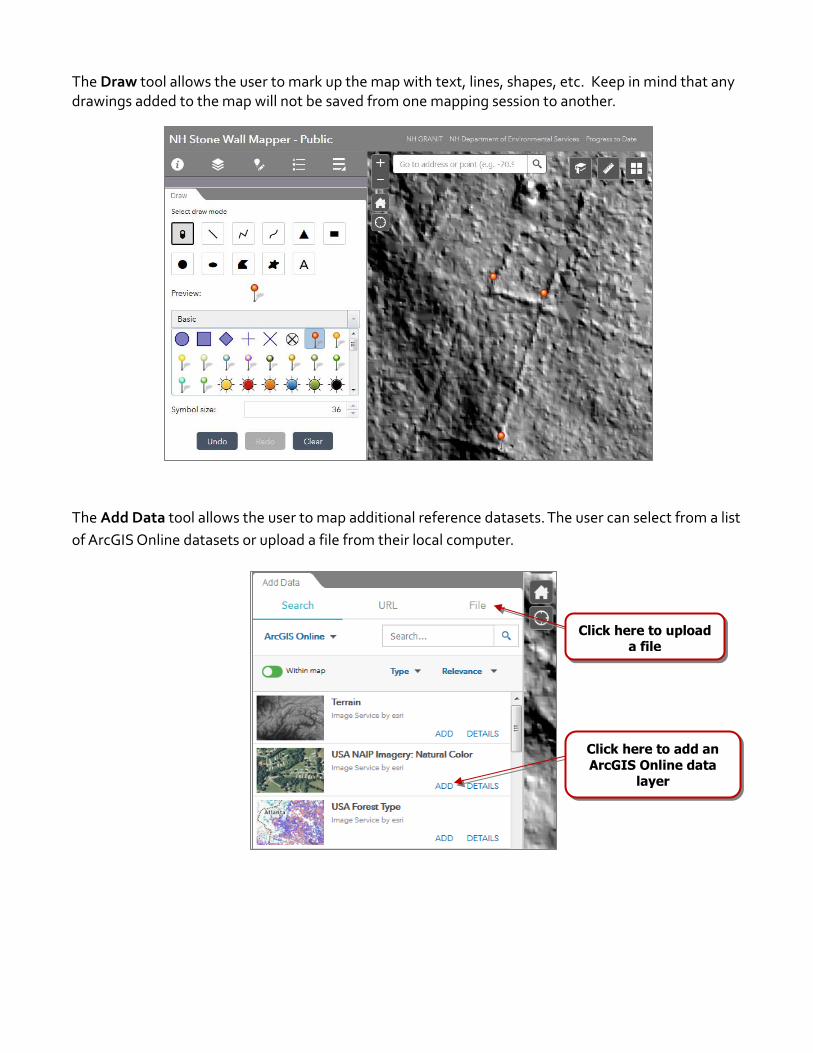
The Draw tool allows the user to mark up the map with text, lines, shapes, etc. Keep in mind that any drawings added to the map will not be saved from one mapping session to another.
The Add Data tool allows the user to map additional reference datasets. The user can select from a list
of ArcGIS Online datasets or upload a file from their local computer.
Click here to upload a file
Click here to add an
ArcGIS Online data layer
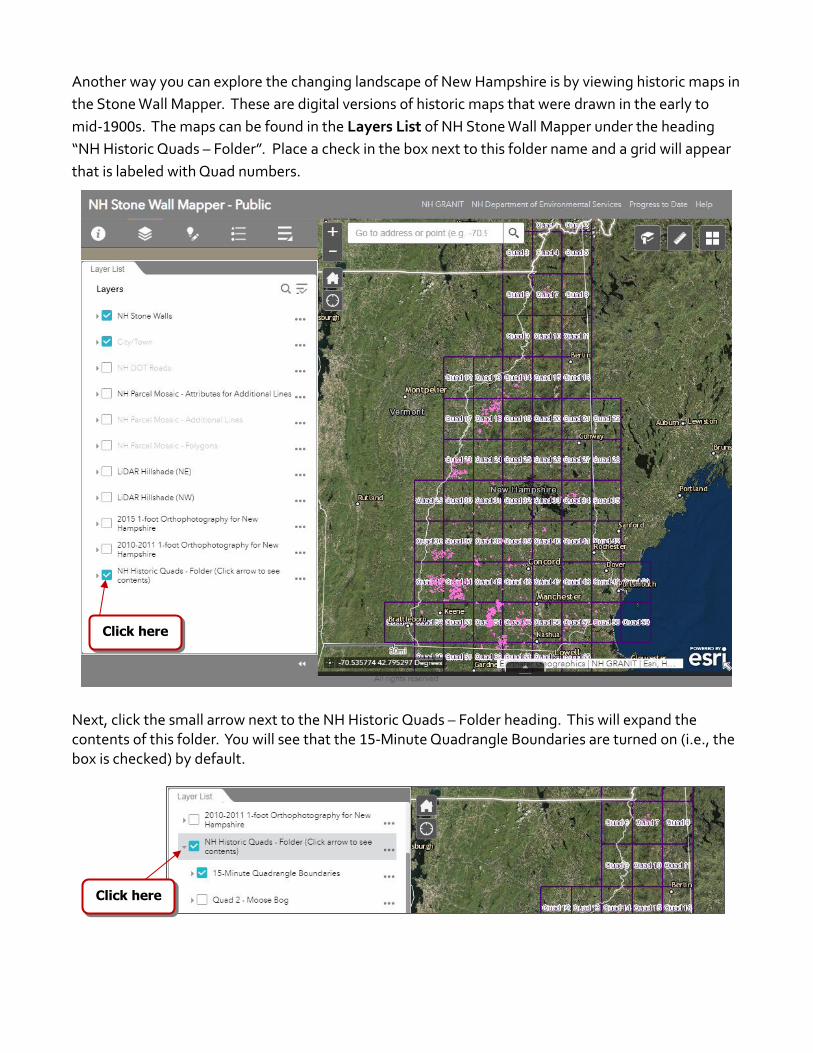
Another way you can explore the changing landscape of New Hampshire is by viewing historic maps in
the Stone Wall Mapper. These are digital versions of historic maps that were drawn in the early to
mid-1900s. The maps can be found in the Layers List of NH Stone Wall Mapper under the heading
“NH Historic Quads – Folder”. Place a check in the box next to this folder name and a grid will appear
that is labeled with Quad numbers.
Next, click the small arrow next to the NH Historic Quads – Folder heading. This will expand the contents of this folder. You will see that the 15-Minute Quadrangle Boundaries are turned on (i.e., the box is checked) by default.
Click here
Click here
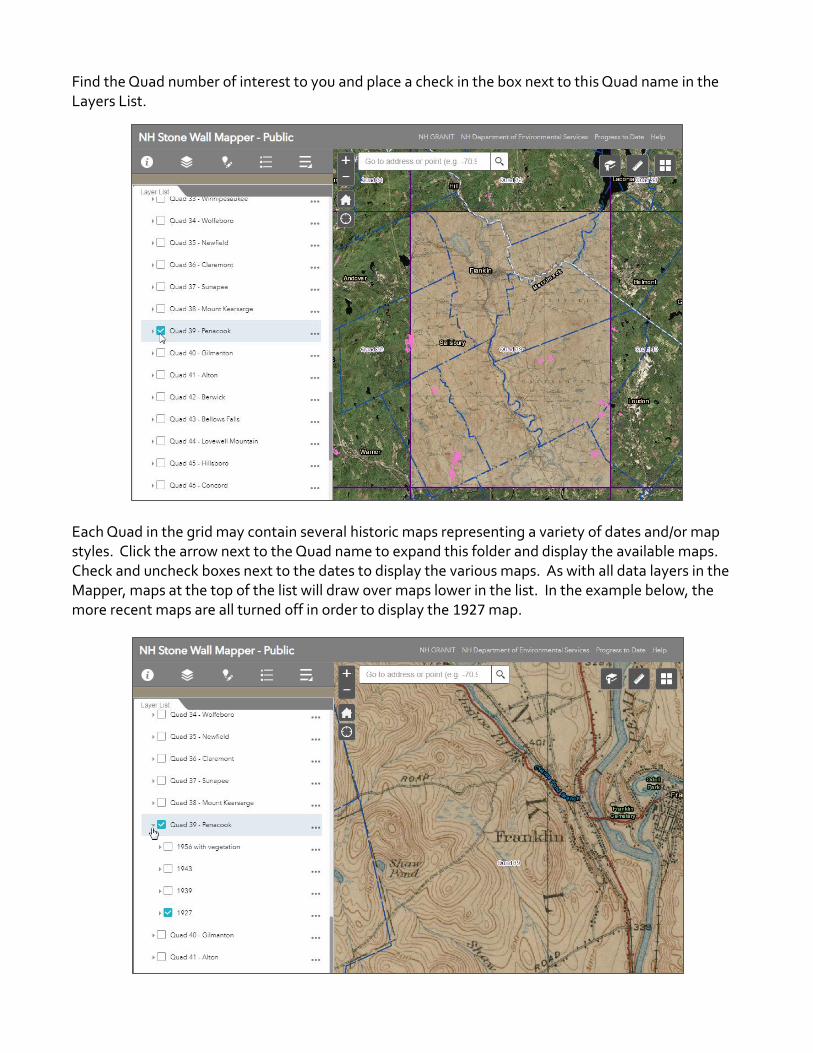
Find the Quad number of interest to you and place a check in the box next to this Quad name in the Layers List.
Each Quad in the grid may contain several historic maps representing a variety of dates and/or map styles. Click the arrow next to the Quad name to expand this folder and display the available maps. Check and uncheck boxes next to the dates to display the various maps. As with all data layers in the Mapper, maps at the top of the list will draw over maps lower in the list. In the example below, the more recent maps are all turned off in order to display the 1927 map.