getting lives back on track - transport accident … · robbie had a motorbike accident in 2008 at...
TRANSCRIPT
20
13
-14
AN
NU
AL
RE
PO
RT
GE
TT
ING
L
IVE
S
BA
CK
O
N
TR
AC
K

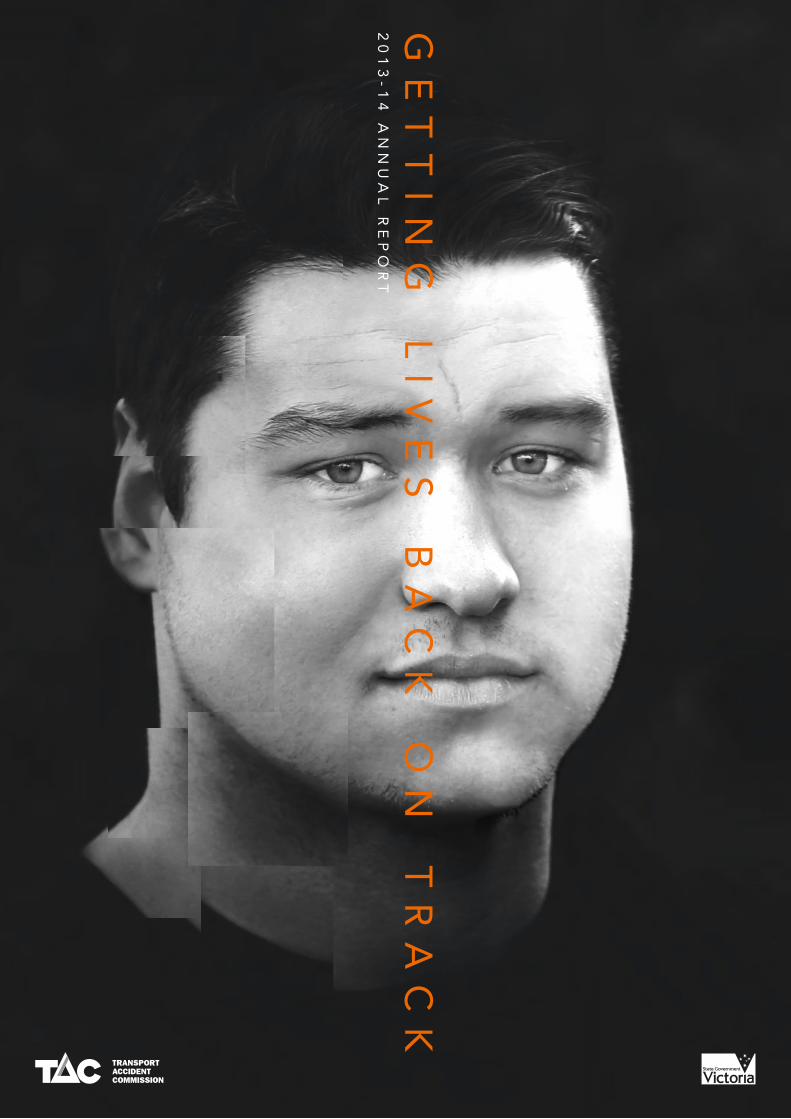
“ A F T E R M Y M O T O R B I K E A C C I D E N T , M Y L I F E C H A N G E D D R A M A T I C A L L Y . I H A D M Y W H O L E L I F E P L A N N E D – W H A T I W A N T E D T O D O , W H E R E I W A N T E D T O G O .
T H E H A R D E S T P A R T O F T H E C H A N G E A F T E R H A V I N G M Y A C C I D E N T W A S , I T H I N K , G O I N G O U T I N P U B L I C .
I W A S I N A N E L E C T R I C C H A I R . I D I D N ’ T L I K E T H A T E V E R Y O N E L O O K E D A T M E . A L S O , I H A D A L O T
O F S C A R R I N G O N M Y B O D Y . A T U R N I N G P O I N T W A S W H E N I G O T M Y D O G , L E N N Y . I T H I N K T H A T W A S
T H E M A I N T H I N G T H A T G O T M E O U T O F B E D .
A F A M I L Y F R I E N D T H E N E N C O U R A G E D M E B A C K I N T O T H E G Y M A N D I N T O F I T N E S S . I D I D A C E R T I F I C A T E
I I I A N D I V ( I N F I T N E S S ) A N D S T A R T E D P E R S O N A L T R A I N I N G , S P E C I A L I S I N G I N H E L P I N G O T H E R P E O P L E
W I T H D I S A B I L I T I E S . R E T U R N I N G T O W O R K H A S B E E N A B S O L U T E L Y F A N T A S T I C . I T M A K E S M E H A P P Y
W H E N I S E E I ’ V E H E L P E D S O M E O N E O R S O M E O N E H A S A C H I E V E D S O M E T H I N G . I T ’ S T H E B E S T T H I N G –
A B S O L U T E L Y B E S T T H I N G .
F O R M E , T H E T A C M E A N S I ’ M N O T O N M Y O W N . Y E S , I ’ V E G O T F A M I L Y A N D F R I E N D S H E L P I N G M E ,
B U T I A L S O H A V E T H E S U P P O R T O F T H E C A R I N G P E O P L E A T T H E T A C T O H E L P M E T H R O U G H . I K N O W
T H E Y ’ L L A L W A Y S B E T H E R E T O H E L P M E A N D T H A T M E A N S A L O T . ” – R O B B I E ( F R O N T C O V E R )
Robbie had a motorbike accident in 2008 at the age of 17, which left him with a spinal injury.
VISION: A FUTURE WHERE EVERY JOURNEY IS A SAFE ONE
MISSION: TO WORK WITH THE VICTORIAN COMMUNITY TO REDUCE ROAD TRAUMA AND SUPPORT THOSE IT AFFECTS
CONTENTS02 LETTER TO THE MINISTER
03 KEY ACHIEVEMENTS 2013-14
04 CHAIR AND CEO’S REPORT
06 BOARD AND EXECUTIVE MANAGEMENT
07 ABOUT THE TAC
08 GETTING LIVES BACK ON TRACK HIGHLIGHTS 2013-14
14 PREVENTING ACCIDENTS HIGHLIGHTS 2013-14
16 MANAGING THE SCHEME THE PEOPLE FINANCIAL AND CAPITAL MANAGEMENT
20 PERFORMANCE MEASURES
23 FINANCIAL REPORT
71 CORPORATE GOVERNANCE
75 COMPLIANCE
90 DISCLOSURE INDEX

LETTER TO THEMINISTER28 August 2014
The Honourable Gordon Rich-Phillips MLC Assistant Treasurer Level 5, 1 Macarthur Street East Melbourne, Victoria 3000
Dear Minister
I am pleased to submit the twenty-eighth Annual Report of the Transport Accident Commission for presentation to Parliament pursuant to Part 7 of the Financial Management Act 1994.
John Walter Chair
“ I G O T H R O U G H A L L T H E P I C T U R E S A N D R E P O R T S O N
T H E A C C I D E N T A N D I A M A M A Z E D A T H O W F A R I ’ V E
C O M E W I T H M Y R E C O V E R Y . I T ’ S E X T R A O R D I N A R Y . ”
T A C C L I E N T , M I C H A E L A
02

KEY ACHIEVEMENTS2013 –2014
$1.101 BILLION IN SUPPORT SERVICES AND BENEFITS PROVIDED TO 47,115 PEOPLE
HIGH CLIENT SATISFACTION SCORE MAINTAINED
NEW CLAIM LODGEMENT AND ELIGIBILITY PROCESSES FOR FASTER AND MORE EFFICIENT ACCESS TO TAC SERVICES
LEGISLATIVE AMENDMENTS TO BOOST SPECIFIC PAYMENTS FOR CLIENTS WHILE ENSURING THE FINANCIAL SUSTAINABILITY OF THE SCHEME
LOWEST EVER VICTORIAN ROAD TOLL AT 242 – 40 FEWER THAN THE PREVIOUS YEAR
LAUNCH OF AN $8 MILLION ENHANCED CRASH INVESTIGATION STUDY AS PART OF A STATE GOVERNMENT STRATEGY TO REDUCE ROAD TRAUMA BY 30% BY 2022
STAGING OF INTERNATIONAL TOWARDS ZERO ROAD SAFETY SYMPOSIUM
CORE ADMINISTRATION COST GROWTH CONTROLLED TO BELOW CPI AT 1.9% AMONG EFFICIENCY TARGETS ACHIEVED
03

CHAIR AND CEO’SREPORT
The TAC is determined never to lose sight of its vision: a future where every journey is a safe one.
In pursuit of its ultimate goal, the TAC is focusing on evidence based and targeted accident prevention strategies within the framework of the Victorian Government’s Road Safety Strategy, which aims to reduce road deaths and serious injuries by 30% by 2022.
As part of the strategy, the TAC was proud to join with its road safety partners earlier this year to launch the $8 million Enhanced Crash Investigation Study (ECIS). This world-first study will provide an unprecedented understanding of how crashes and injuries occur and will help inform future investments in prevention.
Tremendous progress has been made in recent years to reduce road trauma and the consequences of road trauma. This study will enhance these efforts and cement the state’s status as a global leader in accident prevention.
To this end, another major achievement in the last financial year was the lead role the TAC took in staging the inaugural Towards Zero Road Safety Symposium. The symposium brought together the Victorian community, the State Government, road safety agencies, international experts, corporate leaders and local government, with the aim of moving the death and serious injury road toll towards zero.
The TAC’s sustained focus on accident prevention does not diminish the commitment the organisation has to the Victorian State Trauma System. This was demonstrated in the last financial year with a $7.7 million contribution to air ambulance services. Access to immediate, urgent treatment is key to better outcomes for people involved in transport accidents.
Helping people get their lives back on track drives the organisation to continually improve and strengthen its operations. A considerable achievement in 2013-14, was the introduction of new lodgement and eligibility processes, as part of the transformation program the TAC has been delivering under its 2015 strategy. This has made it easier for people to submit a claim and get access to treatment and support services. Victorians involved in a transport accident are no longer required to fill out a hard copy claim form and more than 90 per cent of phone lodgements are accepted within five days.
Supporting injured Victorians with the most appropriate care, treatment and compensation was also at the heart of a package of amendments in 2013 to the Transport Accident Act 1986. The changes have not only boosted specific payments for TAC clients but have ensured the scheme remains sustainable well into the future.
In 2013-14, the TAC experienced an increase in the number of people needing support after a transport accident. The TAC provided $1.101 billion in services and benefits to 47,115 people, up from 45,038 in 2012-13. Of that number, 22,012 were new claims, compared to 19,354 the previous year.
04

The TAC recognises the importance of developing strong networks and partnerships in its efforts to support injured Victorians. With the headquarters of the National Disability Insurance Agency now established in Geelong, there is great opportunity to expand existing networks and create a centre of excellence in scheme design, research, employment and service delivery.
In addition to providing the highest levels of client support, the TAC is also charged with ensuring this support is delivered in the most socially and economically appropriate manner.
One of the most satisfying results of the past year has been the TAC’s 2013-14 actuarial release of $142 million, which was achieved through a sharper focus on efficiencies, effective accident prevention and strong claims management. This contributed to a performance from insurance operations in 2013-14 of $325 million, compared to negative $12 million in 2012-13.
The TAC recorded an after-tax operating profit of $499 million in 2013-14, compared to $973 million in 2012-13, driven by favourable net external factors, in addition to better than expected performance from insurance operations.
The TAC’s funding ratio as at 30 June 2014 was 91.1%, compared to 84.9% last financial year.
Building on the achievements of 2013-14, the TAC is looking forward with optimism and confidence to another year of providing a valued service to the Victorian community.
09/10 10/11 11/12 12/13 13/14
Performance from insurance operations 200 187 351 (12) 325
Impact on profit from external factors:
/ Difference between actual investment returns and long-term expected returns
252 226 (245) 618 644
/ Change in inflation assumptions and discount rates
(572) (22) (1,581) 772 (277)
Tax 39 (112) 451 (405) (193)
NET PROFIT/(LOSS) AFTER TAX (81) 279 (1,024) 973 499
Impacts on Profit ($M)
John Walter Chair
Janet Dore Chief Executive Officer
05
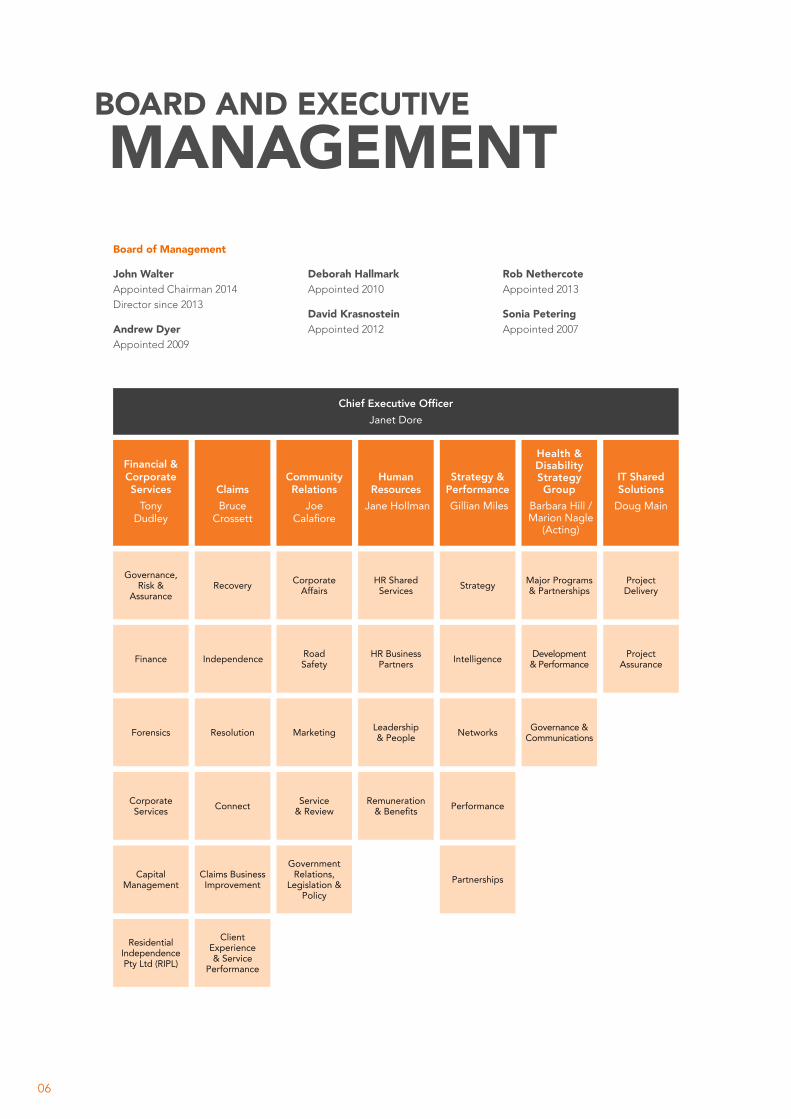
Board of Management
John Walter Appointed Chairman 2014 Director since 2013
Andrew Dyer Appointed 2009
Deborah Hallmark Appointed 2010
David Krasnostein Appointed 2012
Rob Nethercote Appointed 2013
Sonia Petering Appointed 2007
BOARD AND EXECUTIVE MANAGEMENT
Financial & Corporate Services Claims
Community Relations
Human Resources
Chief Executive OfficerJanet Dore
Strategy & Performance
Governance, Risk &
Assurance
Finance
Forensics
Corporate Services
Residential Independence Pty Ltd (RIPL)
Capital Management
HR Shared Services
HR Business Partners
Leadership & People
Remuneration & Benefits
Strategy Major Programs & Partnerships
Project Delivery
Intelligence Development & Performance
Project Assurance
Networks Governance & Communications
Performance
Partnerships
IT Shared Solutions
Health & Disability Strategy Group
Corporate Affairs
Road Safety
Marketing
Service & Review
Government Relations,
Legislation & Policy
Recovery
Independence
Resolution
Connect
Claims Business Improvement
Client Experience & Service
Performance
Tony Dudley
Bruce Crossett
Joe Calafiore
Jane Hollman Gillian Miles Doug MainBarbara Hill / Marion Nagle
(Acting)
06
ABOUTTHE TAC
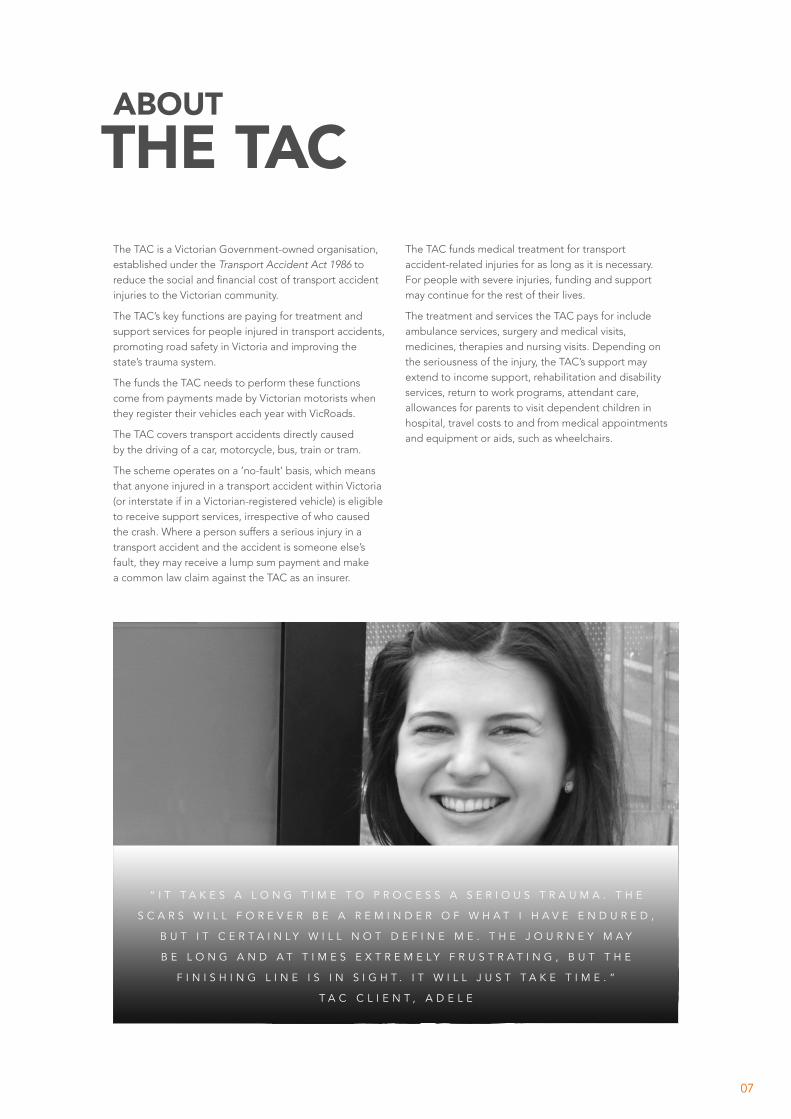
The TAC is a Victorian Government-owned organisation, established under the Transport Accident Act 1986 to reduce the social and financial cost of transport accident injuries to the Victorian community.
The TAC’s key functions are paying for treatment and support services for people injured in transport accidents, promoting road safety in Victoria and improving the state’s trauma system.
The funds the TAC needs to perform these functions come from payments made by Victorian motorists when they register their vehicles each year with VicRoads.
The TAC covers transport accidents directly caused by the driving of a car, motorcycle, bus, train or tram.
The scheme operates on a ‘no-fault’ basis, which means that anyone injured in a transport accident within Victoria (or interstate if in a Victorian-registered vehicle) is eligible to receive support services, irrespective of who caused the crash. Where a person suffers a serious injury in a transport accident and the accident is someone else’s fault, they may receive a lump sum payment and make a common law claim against the TAC as an insurer.
The TAC funds medical treatment for transport accident-related injuries for as long as it is necessary. For people with severe injuries, funding and support may continue for the rest of their lives.
The treatment and services the TAC pays for include ambulance services, surgery and medical visits, medicines, therapies and nursing visits. Depending on the seriousness of the injury, the TAC’s support may extend to income support, rehabilitation and disability services, return to work programs, attendant care, allowances for parents to visit dependent children in hospital, travel costs to and from medical appointments and equipment or aids, such as wheelchairs.
“ I T T A K E S A L O N G T I M E T O P R O C E S S A S E R I O U S T R A U M A . T H E
S C A R S W I L L F O R E V E R B E A R E M I N D E R O F W H A T I H A V E E N D U R E D ,
B U T I T C E R T A I N L Y W I L L N O T D E F I N E M E . T H E J O U R N E Y M A Y
B E L O N G A N D A T T I M E S E X T R E M E L Y F R U S T R A T I N G , B U T T H E
F I N I S H I N G L I N E I S I N S I G H T . I T W I L L J U S T T A K E T I M E . ”
T A C C L I E N T , A D E L E
07
GETTING LIVES BACK ON TRACK
Supporting The Victorian Community
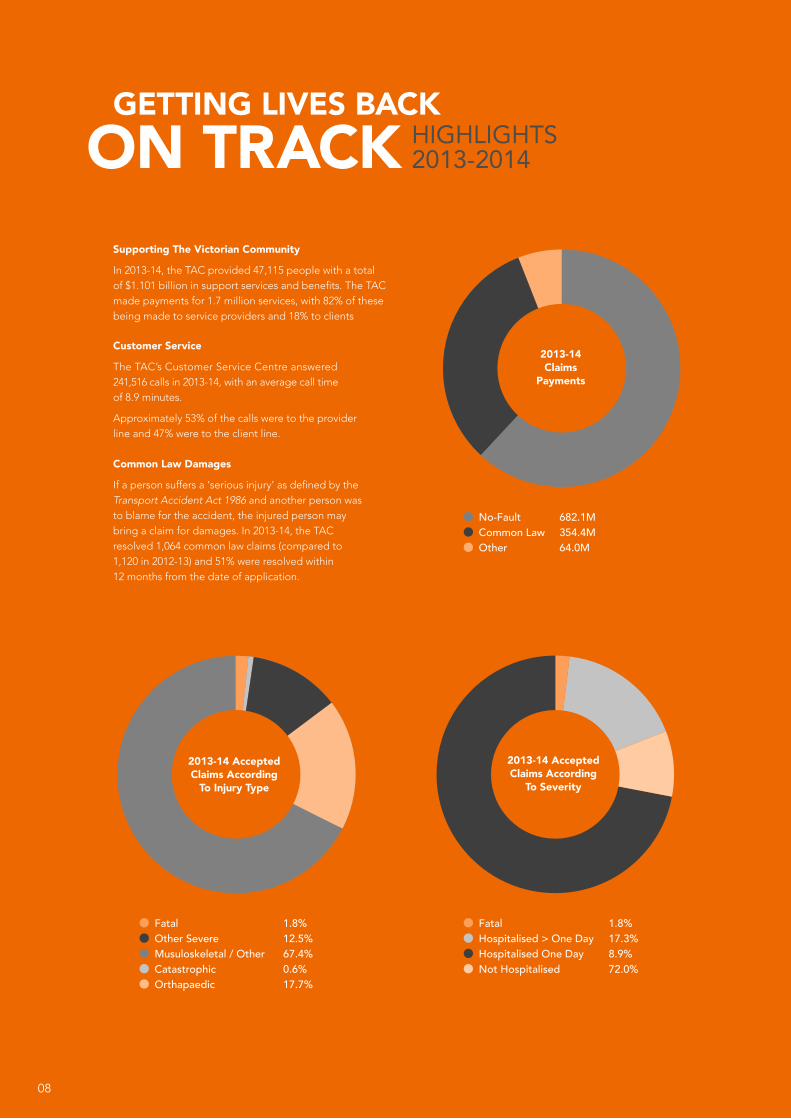
In 2013-14, the TAC provided 47,115 people with a total of $1.101 billion in support services and benefits. The TAC made payments for 1.7 million services, with 82% of these being made to service providers and 18% to clients
Customer Service
The TAC’s Customer Service Centre answered 241,516 calls in 2013-14, with an average call time of 8.9 minutes.
Approximately 53% of the calls were to the provider line and 47% were to the client line.
Common Law Damages
If a person suffers a ‘serious injury’ as defined by the Transport Accident Act 1986 and another person was to blame for the accident, the injured person may bring a claim for damages. In 2013-14, the TAC resolved 1,064 common law claims (compared to 1,120 in 2012-13) and 51% were resolved within 12 months from the date of application.
2013-14 Claims
Payments
2013-14 Accepted Claims According
To Injury Type
2013-14 Accepted Claims According
To Severity
No-Fault 682.1M Common Law 354.4M Other 64.0M
Fatal 1.8% Hospitalised > One Day 17.3% Hospitalised One Day 8.9% Not Hospitalised 72.0%
HIGHLIGHTS 2013-2014
Fatal 1.8% Other Severe 12.5% Musuloskeletal / Other 67.4% Catastrophic 0.6% Orthapaedic 17.7%
08

Simpler Claim Lodgement
Guided by its long term 2015 strategy, the TAC has worked hard to cut red tape and remove unnecessary processes so that it is able to help people involved in a transport accident get their lives back on track as quickly and efficiently as possible.
A key initiative has been the First Service project, which has focused on significantly reducing the time it takes to lodge a claim, while also streamlining processes to provide quicker access to the initial services people need to recover from their injuries.
What the TAC has been able to achieve for its clients is captured in the diagram below:
Claim Lodgement
Before First Service After First Service
Claim Acceptance
Income Decisions
Clients required to complete a hard-copy claim form and answer up to 220 questions. 220
QUESTIONS
Simple and easy claim lodgement. No hard copy claim form and clients required to answer only 20 questions.
20QUESTIONS
Average call duration is 40 minutes. 40
MINUTES
Average call duration is 13 minutes. 13
MINUTES
70 days accident to claim acceptance. 70
DAYS
NON-HOSPITALISED91% of claims accepted within 5 days of lodgement. 5
DAYS
70 days accident to claim acceptance.
HOSPITALISED64% of claims accepted within 5 days of accident. 5
DAYS70DAYS
Clients wait up to 100 days for first income payment. 100
DAYS
29% of clients receive an income payment within 5 days.[Others receive a payment within 28 Days]
5DAYS
Helping Victorians Access TAC Support
The TAC launched a new campaign in 2014 highlighting the organisation’s role as a provider of support and compensation for crash survivors.
Most Victorians are familiar with the TAC’s role in accident prevention education, which continues to be a major focus for the TAC, but this campaign was about ensuring
Victorians knew how they could access support to get their lives back on track after a transport accident.
The campaign, which aired on television and radio, encouraged anyone injured in a transport accident to find out about their entitlements by contacting the TAC.
09
Mental Health and Persistent Pain Supports
The TAC, in cooperation with the Victorian WorkCover Authority (VWA), has been progressively implementing a strategy designed to address the significant challenges of mental health and persistent pain among clients. Early identification, coupled with graduated and appropriate treatment pathways for clients, is a key strategic focus.
The strategy has been driven by the Health and Disability Strategy Group (HDSG) – a shared TAC and VWA service – and has led to an expansion of the range of mental health services available to clients.
In the last financial year, the HDSG has implemented two new services – Outreach and E-therapy.
The Outreach Service provides a range of flexible and tailored interventions in clients’ homes and the community, based on cognitive behavioural therapies. It has an early intervention focus and matches a client with a support worker with specific training and skills in mental health and disability. The support worker proactively engages with the client, helping them to access health, vocational and community services, while reducing barriers that may be affecting their ability to get their life back on track after a transport accident.
The E-therapy services are an online, low intensity therapy option, which complements clinical, health and outreach services. E-therapy aims to enhance a client’s capability to self-manage a range of symptoms related to pain and mental health issues. A link to e-therapy is available on the TAC’s website and allows clients to access support in privacy and at their own pace.
Longitudinal Client Research Study
Two years ago, the TAC began a longitudinal client research study, commencing with 1,500 clients from the Recovery branch of the Claims division, which manages clients who are generally expected to make a full recovery from their transport accident.
The study is not yet complete but in 2013-14 research data informed the development and implementation of the new mental health and persistent pain management processes within the TAC.
The clients involved in the longitudinal study have been interviewed at three, six and 12 months post-accident. The TAC is currently conducting the final 24-month post-accident interviews.
A range of data has been collected, from pre-accident health and vocational status through to post-accident health and vocational activity, various psycho-social factors, accident circumstances and perceptions of TAC service delivery.
The longitudinal study differs from previous cross-sectional research undertaken by the TAC. The cross-sectional approach provides a snapshot of a group of clients at a point in time, while the longitudinal study allows the TAC to follow the same cohort of clients on their recovery journey through the scheme. By surveying the same clients over time, it is possible to analyse and understand changes, which enables pathways to recovery to be better explored.
Independent Living
The TAC has launched a new accommodation initiative to address a shortfall in accessible housing for clients with a disability.
The purpose-built accommodation allows people with disabilities, such as quadriplegia or acquired brain injury, to live in their own apartments that meet their unique needs.
Four TAC clients moved into the first of the units at Abbotsford in September 2013. The clients are sharing an innovative model of support, including the use of an integrated security system, which allows them to communicate with support staff, and a smart phone or tablet to control lighting, blinds, windows and doors.
Other sites in Melbourne have already been earmarked for similar accommodation.
GETTING LIVES BACK ON TRACK HIGHLIGHTS
2013-2014
10

Improved Individualised Funding Model
In 2013-14, a new funding model was introduced to give TAC clients with severe injuries a greater say in how their support services are delivered.
The new model gives clients more choice, control and flexibility, enabling them to live more independently as active members of the community.
Those eligible for Individualised Funding receive a monthly allocation of funds into a bank account set up by the TAC. It is then up to the client to budget for, and arrange, the services they need. They are able to choose their health care providers and pay them directly through online banking or with a debit card.
The new funding model replaces the complex and outdated self-purchasing model.
“ W I T H I N D I V I D U A L I S E D F U N D I N G , T H E R E ’ S F A R L E S S R E D T A P E . I ’ M
N O W A B L E T O C H O O S E T H E S E R V I C E S I W A N T A N D I D O N ’ T R E A L L Y
F E E L L I K E A L I T T L E C H I L D A N Y M O R E A S K I N G F O R P E R M I S S I O N T O
D O S O M E T H I N G . I T ’ S R E A L L Y C H A N G E D M Y L I F E F O R T H E B E T T E R . ”
T A C C L I E N T , M I C H A E L
11

Reform Package
In 2013, more than 20 amendments were made to the TAC’s governing legislation, the Transport Accident Act 1986. The changes boost specific payments for Victorians
injured in transport accidents, while ensuring the scheme remains consistent and sustainable.
Highlights of the reform package are outlined below. Further details can be found on page 77 of this report.
The Amendment Relates To The Change
Family Counselling Services
The cap on family counselling has increased from $5,870 to $15,000. This will ensure people get the help they need at the time they need it.
Family Travel and Accommodation Expenses
This change acknowledges the rising cost of travel and accommodation by increasing the cap from $4,680 to $10,000. This will help families of TAC clients to access travel and accommodation so they can visit family members in hospital.
Taxi Services for A Return To Work
This amendment extends the time limit for travel assistance from 12 weeks to 24 weeks for people on a return to work plan.
Mental Injury A section of the Act has been changed to clarify the definition of a severe long-term mental or severe long-term behavioural disturbance or disorder. Clients who do not meet the definition are still entitled to treatment and services.
Medical Reports Feedback shows that clients who have had to undergo multiple medical examinations are more negative about their TAC experience. The reform package aims to reduce the number of medical-legal examinations that a client needs to attend by requiring agreement between the TAC and client before reports are funded.
Loss of Earnings Capacity (LOEC) Benefits
This amendment aims to give clients an incentive to participate in rehabilitation long term. The change affects payment of loss of earning capacity benefits, which may stop for people who are not participating in vocational rehabilitation services.
Funeral Expenses In the tragic event of a death from a transport accident, the entitlement of surviving family for funeral expenses has increased from around $10,600 to $14,800 and expanded to cover all funeral related expenses.
GETTING LIVES BACK ON TRACK HIGHLIGHTS
2013-2014
12

RESOLVING DISPUTES AND
The TAC makes hundreds of decisions that affect clients each week. Sometimes a client does not accept or understand a decision and in these cases, they may choose to have the decision:
• Informally reviewed by the TAC
• Reviewed under the Dispute Resolution Protocols, or
• Reviewed by the Victorian Civil and Administrative Tribunal (VCAT) – known as a merit review.
Informal Reviews
There has been a reduction again this year in the number of disagreements clients have had with TAC decisions. There were 266 requests for an informal review lodged, compared to 308 in 2012-13 and 361 in 2011-12. Around 81% of informal reviews were resolved within four months, with nearly half of reviews maintaining TAC’s original decision and a third being resolved through compromise or overturned.
Dispute Resolution Protocols
In 2005, protocols were implemented in collaboration with legal stakeholders to provide an alternative to the formal disputation process at VCAT and reduce the time and cost to resolve disputes. In 2013-14, 1,042 applications for a review of a TAC decision were lodged under the protocols, compared to 974 in 2012-13.
The TAC has commenced managing around 80% of these disputes with a Review Officer instead of a lawyer, delivering faster outcomes for clients.
Merit Reviews
A total of 624 merit review applications were lodged at VCAT in 2013-14. In the previous year, 817 merit reviews were lodged. The number of merit reviews resolved during the year was 660, compared to 675 in 2012-13.
Model Litigant
The TAC is committed to the Victorian Government’s Model Litigant Guidelines. The guidelines require the TAC to act fairly and consistently, to avoid litigation, pay legitimate claims promptly and to minimise legal costs. The guidelines require fairness and the utmost propriety. During 2013-14, two formal complaints were received, compared six the previous year and 11 the year before that. All complaints were investigated internally, and no breaches of the guidelines were found.
Complaints
The TAC takes service complaints very seriously and has a formal complaints office to manage these issues, including matters of inquiry from the Chief Executive Officer and Ombudsman Victoria. In 2013-14, the TAC received 217 formal complaints compared to 206 in 2012-13 and 274 in 2011-12.
Freedom of Information
The TAC is committed to extending as far as possible the right of the community to access information held by the TAC. The TAC received 1,170 applications in 2013-14, compared to 1,213 received in 2012-13.
In December 2012 the Victorian Freedom of Information Commissioner (FOIC) took office. The Commissioner’s functions include review, handling complaints, monitoring agencies’ compliance, reporting and providing advice, education and guidance. The TAC has had nine matters referred to the FOIC for review, and one complaint. Six of these matters, including the complaint, have been resolved to date.
The TAC welcomes feedback from clients and other stakeholders to help improve its service through [email protected]
COMPLAINTS
13

PREVENTINGACCIDENTS
HIGHLIGHTS 2013-2014
The TAC has delivered a number of significant initiatives in 2013-14 to support the Victorian Government’s Road Safety Strategy 2013-22 and its goal to reduce deaths and serious injuries on the state’s roads by a third.
Guided by this strategy, the TAC is working together with the Victorian community, the State Government, VicRoads, Victoria Police and the Department of Justice to move the death and injury road toll towards zero.
The Victorian Road Safety Strategy is underpinned by the Safe System approach. This approach recognises that humans make mistakes and have limited tolerance to forces when involved in crashes. The Safe System approach ensures that appropriate speed limits are set and road infrastructure and vehicles are safe, so that in the event of an accident, all road users will be better protected.
Towards Zero Road Safety Symposium
The inaugural Towards Zero Symposium in May 2014 was a significant step in involving Victoria’s leaders in the TAC’s vision to make every journey a safe one. The symposium was attended by representatives from all road safety partner agencies, leading Victorian corporate organisations and international road safety experts from Sweden and the Netherlands.
The TAC has developed a Safe System eLearning module to help the community understand the approach and its role.
Safer Roads
The TAC is committed to building safer road infrastructure that will prevent crashes or protect drivers and passengers if a crash happens. In 2013-14 the TAC increased its investment in the Safe System Roads Infrastructure Program (SSRIP) to $1 billion over 10 years. In 2013-14, $77.2 million was expended on SSRIP projects across Victoria. A Monash University Accident Research Centre evaluation found the previous Safer Roads Infrastructure Program (SRIP) led to a 31% reduction in serious and fatal crashes at the targeted sites.
Safer Drivers
The TAC encourages safer drivers on Victoria’s roads through targeted public education campaigns and community engagement initiatives.
Support the Drive to Wipe off 5
In August 2013, the TAC held one of its biggest ever community engagement campaigns, Support the Drive to Wipe off 5. The aim of the campaign was to raise awareness of the Wipe off 5 message and enhance the community’s understanding of the dangers associated with low-level speeding. The campaign was led by a month-long state-wide road show of giant 3D letters spelling Wipe off 5 and a social media competition encouraging local communities to demonstrate their commitment to wiping off 5. The month culminated in an AFL round where the 5 was wiped off the 50-metre mark at every ground.
Ungiven Gifts
To highlight the road safety message ahead of Christmas, the TAC held an installation of ungiven gifts representing those who had died on the roads in 2013 and wouldn’t be with their families for Christmas. Victorians were able to make a commitment to driving safely in the lead up to Christmas. They were encouraged to leave a physical tribute at the Ungiven Gift display at the State Library or make online tributes via the TAC’s Facebook page. More than 13,000 people visited the installation and the message reached 38,000 people on Facebook. This initiative was recognised internationally with a Gold Lion award at Cannes in June 2014, along with a Bronze Lion for Support the Drive to Wipe off 5.
14
0
100
200
300
400
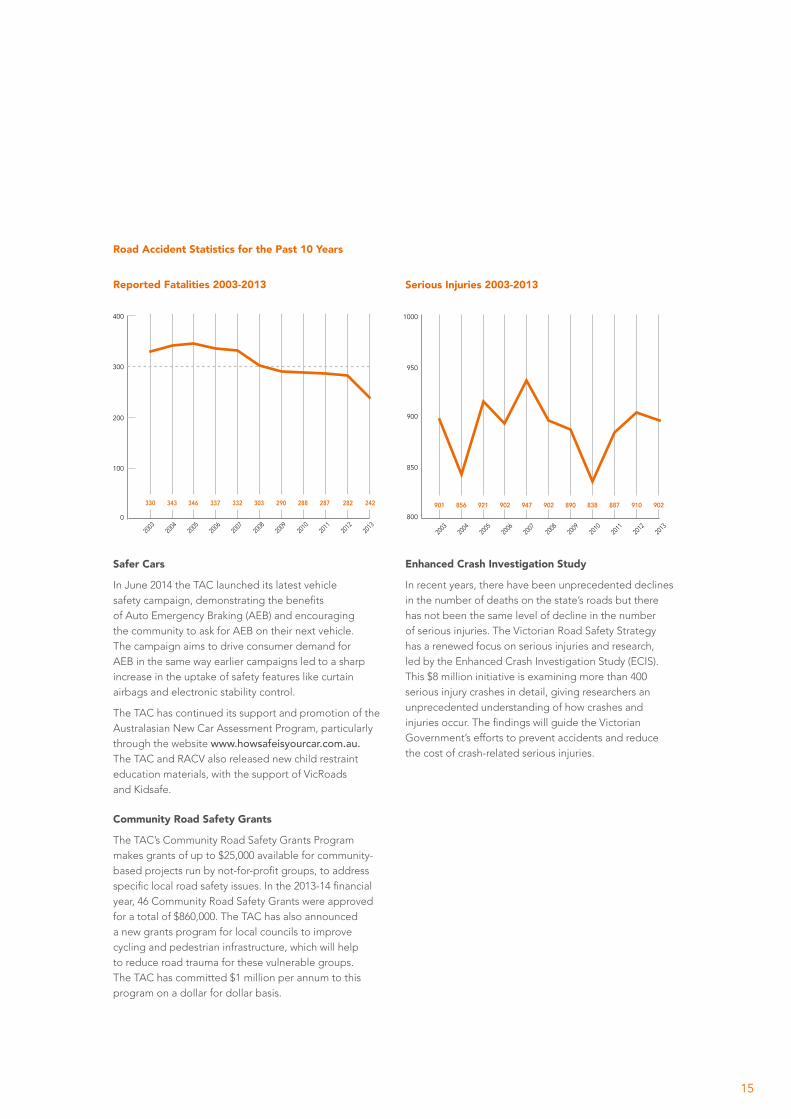
330
2003
2004
2005
2006
2007
2008
2009
2010
2011
2012
2013
303 290 288 287 282 242332337343 346
2003
2004
2005
2006
2007
2008
2009
2010
2011
2012
2013
800
850
950
900
1000
901 856 921 902 947 902 890 838 887 910 902
Serious Injuries 2003-2013
Road Accident Statistics for the Past 10 Years
Safer Cars
In June 2014 the TAC launched its latest vehicle safety campaign, demonstrating the benefits of Auto Emergency Braking (AEB) and encouraging the community to ask for AEB on their next vehicle. The campaign aims to drive consumer demand for AEB in the same way earlier campaigns led to a sharp increase in the uptake of safety features like curtain airbags and electronic stability control.
The TAC has continued its support and promotion of the Australasian New Car Assessment Program, particularly through the website www.howsafeisyourcar.com.au. The TAC and RACV also released new child restraint education materials, with the support of VicRoads and Kidsafe.
Community Road Safety Grants
The TAC’s Community Road Safety Grants Program makes grants of up to $25,000 available for community-based projects run by not-for-profit groups, to address specific local road safety issues. In the 2013-14 financial year, 46 Community Road Safety Grants were approved for a total of $860,000. The TAC has also announced a new grants program for local councils to improve cycling and pedestrian infrastructure, which will help to reduce road trauma for these vulnerable groups. The TAC has committed $1 million per annum to this program on a dollar for dollar basis.
Enhanced Crash Investigation Study
In recent years, there have been unprecedented declines in the number of deaths on the state’s roads but there has not been the same level of decline in the number of serious injuries. The Victorian Road Safety Strategy has a renewed focus on serious injuries and research, led by the Enhanced Crash Investigation Study (ECIS). This $8 million initiative is examining more than 400 serious injury crashes in detail, giving researchers an unprecedented understanding of how crashes and injuries occur. The findings will guide the Victorian Government’s efforts to prevent accidents and reduce the cost of crash-related serious injuries.
Reported Fatalities 2003-2013
15
The TAC is committed to attracting and retaining high quality employees. This ensures the organisation can continue to deliver outstanding service and support to the Victorian community.
As at 30 June 2014, there were 781 employees, based on full time equivalency. The majority of employees are based at the TAC’s headquarters in Geelong, about 75 kilometres south west of the state’s capital, Melbourne.
Employee Opinion Survey
Each year the TAC conducts an employee survey to measure employee engagement and staff morale. This is a point in time survey, measuring employees’ perceptions and feelings at the time the survey is conducted. A total of 83% of all employees responded to the 2014 survey, conducted in the first three weeks of June. The response rate was up 3% compared to the previous year. The overall engagement score increased by one percentage point to 90% and the staff morale index remained stable at 75%. Both results continue to be substantially above the Australian National Norm.
Occupational Health and Safety
The TAC actively promotes a safe work environment, through an integrated Workplace Occupational Health and Safety Program and a dedicated OHS Committee.
In the past financial year, there were three new WorkCover claims. Of the four employee claims that were current throughout 2013-14, a total of 235.4 days were lost due to injury or illness. Three employees have returned to work at full capacity
Shared Services With The Victorian WorkCover Authority (VWA)
The Health and Disability Strategy Group (HDSG)
The HDSG is a shared service that manages the relationship with the health and disability industry that provides treatment and services to TAC clients and injured workers. Its purpose is to ensure TAC clients and injured workers receive treatment, rehabilitation and support at a reasonable and sustainable cost, with a focus on return to work and independence.
The HDSG also administers the Small Grants Program. This program encourages innovative projects that facilitate client independence, promote quality of life, attainment of life goals and enable clients to become active members of their communities. In 2013-14, the TAC approved the funding of eight Small Grants projects at a total of $150,000.
IT Shared Solutions (ITSS)
This shared division of the TAC and VWA provides IT solutions that enable both organisations to achieve their strategic goals and business outcomes.
In 2013-14 ITSS focussed on improving the reliability of its service to enable the day-to-day operations of the TAC and VWA, in addition to project initiatives.
SCHEME: THE PEOPLE
MANAGING THE
16
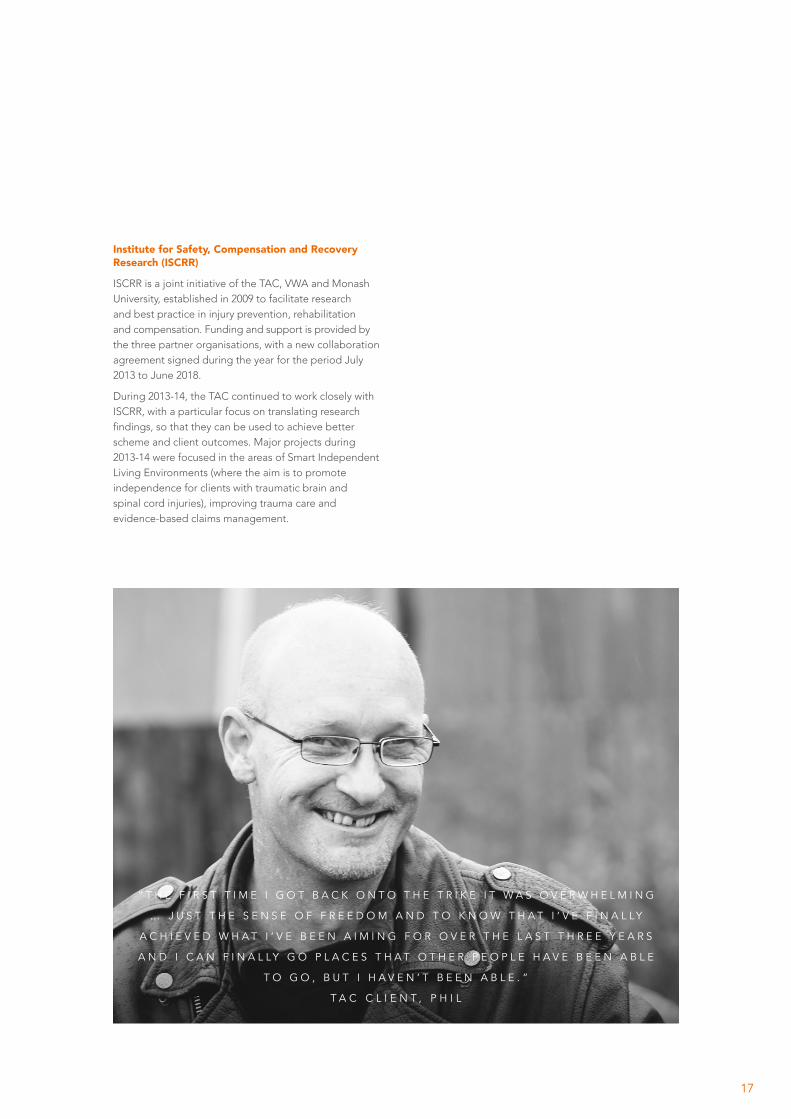
Institute for Safety, Compensation and Recovery Research (ISCRR)
ISCRR is a joint initiative of the TAC, VWA and Monash University, established in 2009 to facilitate research and best practice in injury prevention, rehabilitation and compensation. Funding and support is provided by the three partner organisations, with a new collaboration agreement signed during the year for the period July 2013 to June 2018.
During 2013-14, the TAC continued to work closely with ISCRR, with a particular focus on translating research findings, so that they can be used to achieve better scheme and client outcomes. Major projects during 2013-14 were focused in the areas of Smart Independent Living Environments (where the aim is to promote independence for clients with traumatic brain and spinal cord injuries), improving trauma care and evidence-based claims management.
“ T H E F I R S T T I M E I G O T B A C K O N T O T H E T R I K E I T W A S O V E R W H E L M I N G
… J U S T T H E S E N S E O F F R E E D O M A N D T O K N O W T H A T I ’ V E F I N A L L Y
A C H I E V E D W H A T I ’ V E B E E N A I M I N G F O R O V E R T H E L A S T T H R E E Y E A R S
A N D I C A N F I N A L L Y G O P L A C E S T H A T O T H E R P E O P L E H A V E B E E N A B L E
T O G O , B U T I H A V E N ’ T B E E N A B L E . ”
T A C C L I E N T , P H I L
17

The TAC’s objective is to maintain scheme viability through sound financial management, prudent investment and financial risk management.
Operating Results
The TAC recorded an after-tax profit of $499 million in 2013-14, compared to a profit of $973 million in 2012-13.
The 2013-14 result was mainly driven by a better than expected performance from insurance operations and net favourable external factors. The TAC has recorded an investment return of 14.7%, compared to 15.5% in 2012-13, arising from strong equity market performance.
Performance from Insurance Operations
The TAC has developed a reporting framework where contributions to annual profit from internal and external factors (such as volatility in investment markets, claims discount rates and inflation) are identified and reported separately. This allows the Board and management to assess the underlying financial performance of the TAC.
In 2013-14, the TAC’s performance from insurance operations was a favourable $325 million (compared to an unfavourable $12 million in 2012-13). This was primarily due to favourable claims experience.
The TAC has recorded an actuarial release of $142 million, compared to negative $102 million in 2012-13. This improvement is mainly due to continued strong claims management.
Assets and Liabilities
The TAC’s total assets as at June 2014 were $11.6 billion while total liabilities were $11.7 billion.
Notwithstanding this negative net asset position, the going concern assumption of the TAC remains appropriate based on the financial projections, which continue to show improvements in the overall financial position.
The TAC’s funding ratio at 30 June 2014 was 91.1%, compared to 84.9% as at 30 June 2013.
Dividend
Under the Transport Accident Act 1986, the TAC may pay an annual dividend to the Victorian Government. The dividend is determined each year by the Treasurer in consultation with the TAC and the Minister responsible for the TAC, having regard to funding levels and other factors. No dividend, relating to 2012-13, was paid in 2013-14.
Transport Accident Charge
Consistent with the Transport Accident Act 1986, transport accident charge levels for motorists increased in line with CPI (2.1%) on 1 July 2013. The TAC also covers people injured in train and tram accidents with charges paid by the railway and tramway managers to fund these claims. Transport accident charge levels for both railways and tramways are set following a review of claims experience by independent actuaries.
Reinsurance
As part of the TAC’s financial risk management strategies – to protect the scheme against the impact of a catastrophic accident – the TAC has purchased reinsurance cover.
MANAGING THESCHEME: FINANCIAL AND
CAPITAL MANAGEMENT
18

Reducing Fraud
The TAC is continuing to reduce fraud across the scheme with a balanced, risk-based and responsive forensics support program.
Enforcement action in 2013-14 included 14 prosecutions, finalised through the Magistrates Court. In 10 cases, a conviction was recorded and a total of $265,154 in restitution was awarded to the TAC. Eight matters are currently before the courts where the TAC is alleging fraud against the scheme totalling $400,000. There were 51 warning letters issued for breaches of the Act relating to fraud and providing false information to the TAC, incorporating demands for reimbursement of $99,008.
The TAC has continued its focus on premium compliance, instigating enforcement action including prosecution, while developing effective partnerships and strategies with VicRoads to improve the behaviour and awareness of Victorian vehicle owners and operators about the TAC charge. This financial year the TAC has recovered $196,704 in underpaid premium charges.
The TAC has also continued its focus on ensuring payments made to health practitioners and service providers were appropriate and complied with the relevant TAC policies and fee schedules. Reviews were completed on 2,888 payments made to 175 providers across 317 claims. Four medical practitioners were referred to the Australian Health Practitioner Regulation Agency (AHPRA) for conduct issues during 2013-14. There are currently two referrals outstanding.
“ I W A S I N R E H A B F O R A L M O S T A Y E A R . I H A D T O R E L E A R N H O W T O
D O E V E R Y T H I N G A G A I N , I N C L U D I N G E A T I N G A N D W A L K I N G . I T W A S
H A R D , E S P E C I A L L Y T H E C O - O R D I N A T I O N . I F E L T L I K E A N E W B O R N .
N O W I C A N W A L K U P S T A I R S A N D E A S I L Y G O F O R A W A L K . I F E E L
V E R Y G O O D A N D H A V E A G R E A T S E N S E O F A C H I E V E M E N T . ”
T A C C L I E N T , J A M E S
19
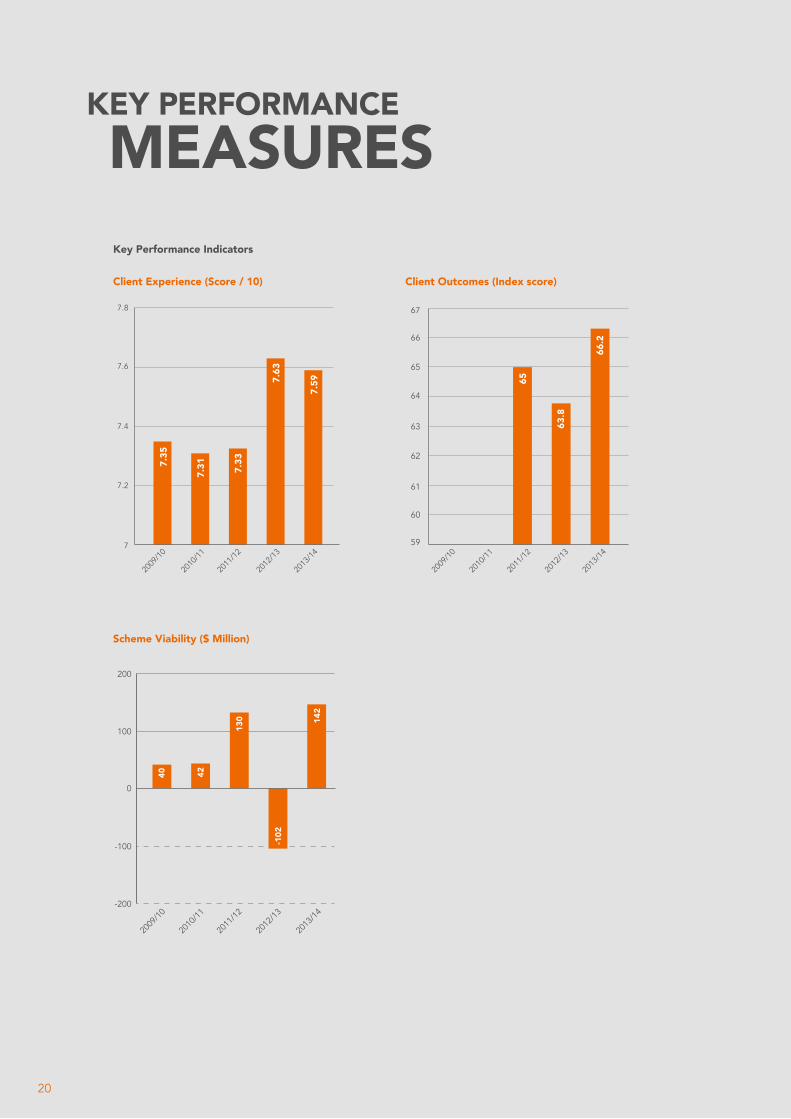
KEY PERFORMANCEMEASURESKey Performance Indicators
Client Experience (Score / 10)
Scheme Viability ($ Million)
Client Outcomes (Index score)
7
7.2
7.4
7.6
7.8
2009
/10
2010
/11
2011
/12
2012
/13
2013
/14
7.35
7.31 7.33
7.63
7.59
2009
/10
2010
/11
2011
/12
2012
/13
2013
/14
60
61
62
63
64
65
66
67
59
65
66.2
63.8
-200
-100
100
200
0
2009
/10
2010
/11
2011
/12
2012
/13
2013
/14
40 42
142
130
-102
20
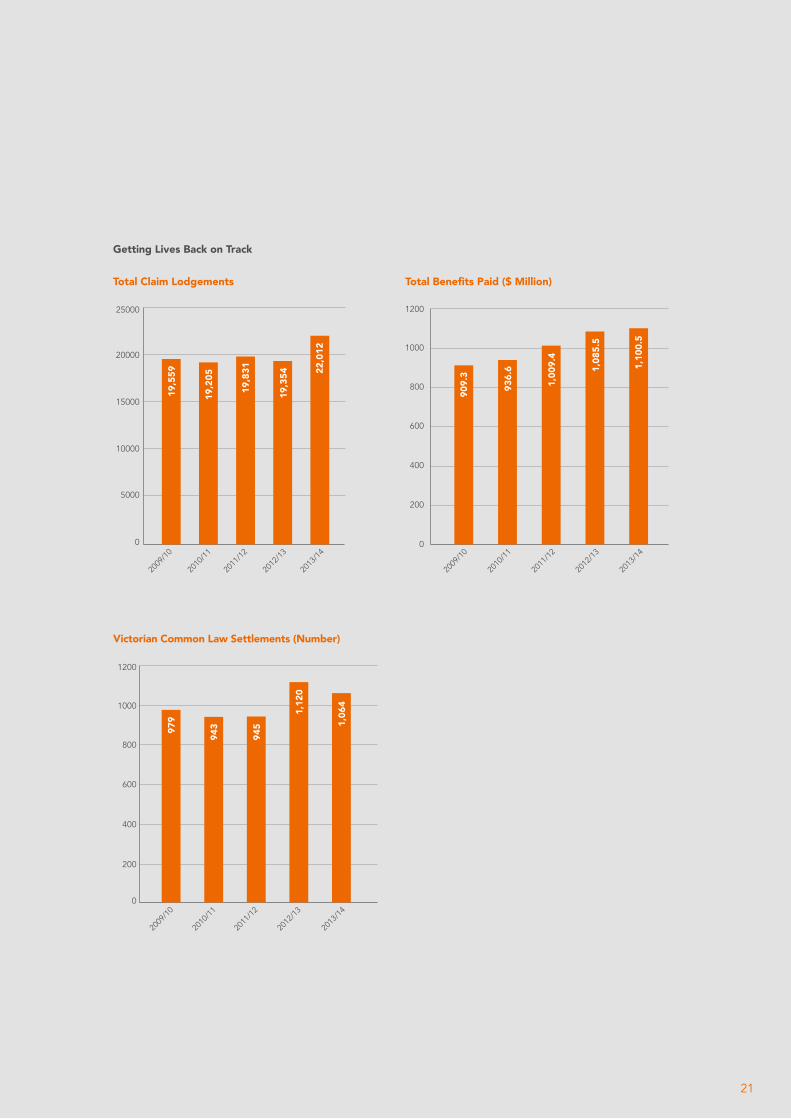
Getting Lives Back on Track
Total Claim Lodgements Total Benefits Paid ($ Million)
Victorian Common Law Settlements (Number)
2009
/10
2010
/11
2011
/12
2012
/13
2013
/14
0
200
400
600
800
1000
1200
909.
3
936.
6
1,00
9.4
1,08
5.5
1,10
0.5
2009
/10
2010
/11
2011
/12
2012
/13
2013
/14
0
200
400
600
800
1000
1200
979
943
945
1,12
0
1,06
4
2009
/10
2010
/11
2011
/12
2012
/13
2013
/14
0
5000
10000
15000
20000
2500022
,012
19,3
54
19,8
31
19,2
05
19,5
59
21

PARTNERSHIPS
Strategic Partnerships
AFL Victoria – TAC Cup $ 435,000
Melbourne Victory $ 300,000
AFL – Wipe off 5 $ 300,000
Geelong Football Club $ 223,000
MotoGP $ 203,500
Country Racing Victoria Limited $ 120,000
Falls Festival $ 70,000
The Winemakers of Rutherglen $ 25,000
Yarra Valley Winegrowers Association $ 25,000
Community Partnerships
Road Trauma Support Services $451,990
Give Where You Live $55,000
SpinChat $41,800
Barwon Health Foundation $33,000
Barwon Sports Academy $33,000
Run Geelong $16,500
Back to Back Theatre $16,500
The TAC builds strong, long-term strategic and community partnerships to ensure road safety messages reach a diverse audience at a grass-roots level. It also partners with community organisations to support community and economic development.
Community Partnerships
Road Trauma Support Services
Road Trauma Support Services Victoria is a not-for-profit organisation that provides counselling and support to people affected by road trauma.
Give Where You Live
Give Where You Live is a charitable organisation that raises funds to address the symptoms and fundamental causes of disadvantage in the Geelong region.
SpinChat
The SpinChat program aims to promote prevention and educate secondary school students about spinal cord injury.
Barwon Health Foundation
The Barwon Health Foundation supports Barwon Health in its mission to deliver comprehensive medical, surgical, aged care, rehabilitation, community and mental health services.
Barwon Sports Acadamy
The Barwon Sports Academy is a non-profit organisation that provides pathways for aspiring athletes to reach higher goals at State and National levels.
Run Geelong
Run Geelong is a local event where 100% of registration fees go towards supporting and improving health facilities for young people.
Back to Back Theatre
Back to Back Theatre creates new forms of contemporary theatre imagined from the minds and experiences of a unique ensemble of actors with disabilities.
22

FINANCIALREPORT
FOR THE YEAR ENDED 30 JUNE 2014

Comprehensive Income Statement For the financial year ended 30 June 2014
Note2014 $000
2013 $000
Premium revenue 1,526,242 1,457,133
Reinsurance premium expense (1,801) (1,901)
Net premium revenue 1,524,441 1,455,232
Gross claims incurred 6 (1,818,051) (948,475)
Claims recoveries revenue 6 14,686 3,215
Net claims incurred (1,803,365) (945,260)
Administration costs 4 (158,905) (149,213)
Marketing and road safety expenditure (59,418) (54,024)
Safer road infrastructure expenditure (77,181) (76,589)
Trauma projects expenditure (11,053) (11,747)
Premium collection fees 10 (37,244) (35,659)
Underwriting expenses (343,801) (327,232)
Underwriting profit / (loss) (622,725) 182,740
Investment income 5 1,343,512 1,219,962
Investment expense 5 (28,944) (24,499)
Net investment income 1,314,568 1,195,463
Profit / (loss) before income tax 691,843 1,378,203
Income tax benefit / (expense) 7(a) (192,832) (405,330)
Net result for the year 499,011 972,873
Other comprehensive income - -
Other comprehensive income for the year - -
Total comprehensive result for the year 499,011 972,873
The above comprehensive income statement should be read in conjunction with the accompanying notes to the financial statements.
24
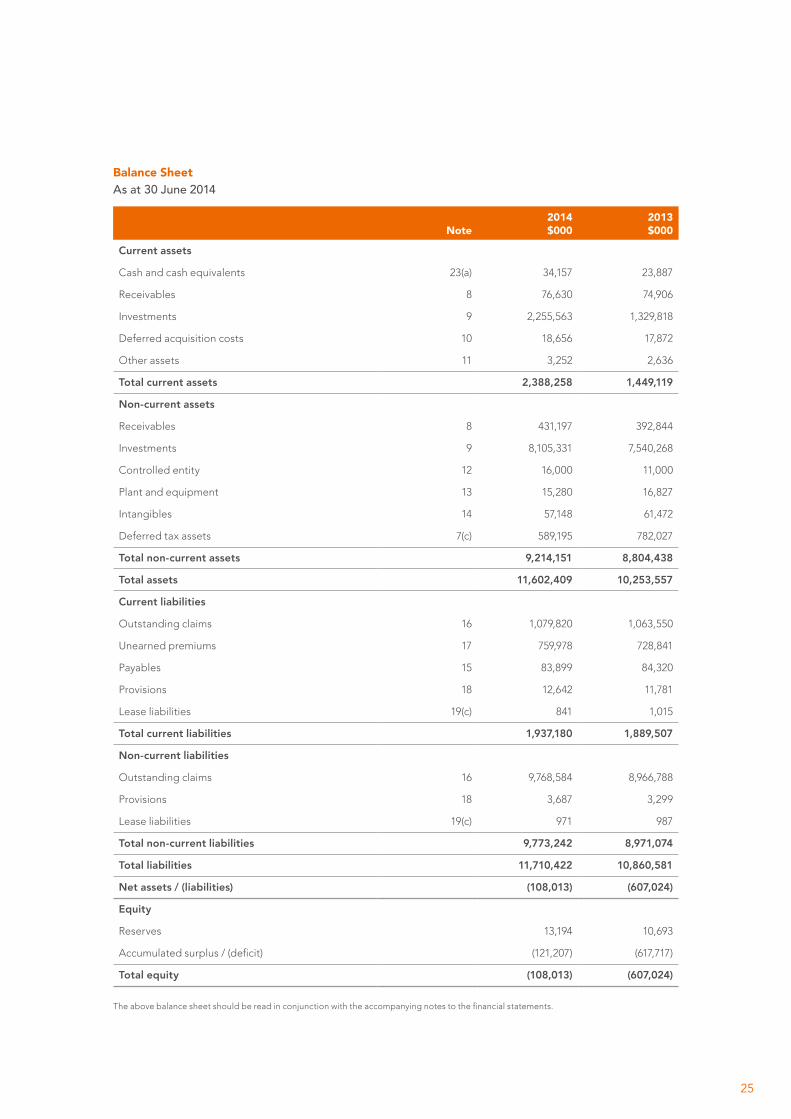
Balance Sheet As at 30 June 2014
Note2014 $000
2013 $000
Current assets
Cash and cash equivalents 23(a) 34,157 23,887
Receivables 8 76,630 74,906
Investments 9 2,255,563 1,329,818
Deferred acquisition costs 10 18,656 17,872
Other assets 11 3,252 2,636
Total current assets 2,388,258 1,449,119
Non-current assets
Receivables 8 431,197 392,844
Investments 9 8,105,331 7,540,268
Controlled entity 12 16,000 11,000
Plant and equipment 13 15,280 16,827
Intangibles 14 57,148 61,472
Deferred tax assets 7(c) 589,195 782,027
Total non-current assets 9,214,151 8,804,438
Total assets 11,602,409 10,253,557
Current liabilities
Outstanding claims 16 1,079,820 1,063,550
Unearned premiums 17 759,978 728,841
Payables 15 83,899 84,320
Provisions 18 12,642 11,781
Lease liabilities 19(c) 841 1,015
Total current liabilities 1,937,180 1,889,507
Non-current liabilities
Outstanding claims 16 9,768,584 8,966,788
Provisions 18 3,687 3,299
Lease liabilities 19(c) 971 987
Total non-current liabilities 9,773,242 8,971,074
Total liabilities 11,710,422 10,860,581
Net assets / (liabilities) (108,013) (607,024)
Equity
Reserves 13,194 10,693
Accumulated surplus / (deficit) (121,207) (617,717)
Total equity (108,013) (607,024)
The above balance sheet should be read in conjunction with the accompanying notes to the financial statements.
25

Statement of Changes in Equity For the financial year ended 30 June 2014
Motorcycle Road Safety Reserve
$000
Accumulated surplus / (deficit)
$000Total $000
At 1 July 2012 6,727 (1,410,624) (1,403,897)
Total comprehensive result
Net result for the year - 972,873 972,873
Other comprehensive income - - -
Total comprehensive result for the year - 972,873 972,873
Transactions with owners, recorded directly in equity
Transfer to Motorcycle Road Safety Reserve - (6,308) (6,308)
Transfer from Motorcycle Road Safety Reserve - 2,342 2,342
Transfer to accumulated surplus (2,342) - (2,342)
Transfer from accumulated surplus 6,308 - 6,308
Dividend paid for 2011/12 year - (176,000) (176,000)
Total transactions with owners 3,966 (179,966) (176,000)
At 30 June 2013 10,693 (617,717) (607,024)
Total comprehensive result
Net result for the year - 499,011 499,011
Other comprehensive income - - -
Total comprehensive result for the year - 499,011 499,011
Transactions with owners, recorded directly in equity
Transfer from Motorcycle Road Safety Reserve - 4,020 4,020
Transfer to Motorcycle Road Safety Reserve - (6,521) (6,521)
Transfer from accumulated surplus 6,521 - 6,521
Transfer to accumulated surplus (4,020) - (4,020)
Dividend paid for 2012/13 year - - -
Total transactions with owners 2,501 (2,501) -
At 30 June 2014 13,194 (121,207) (108,013)
The above statement of changes in equity should be read in conjunction with the accompanying notes to the financial statements.
26
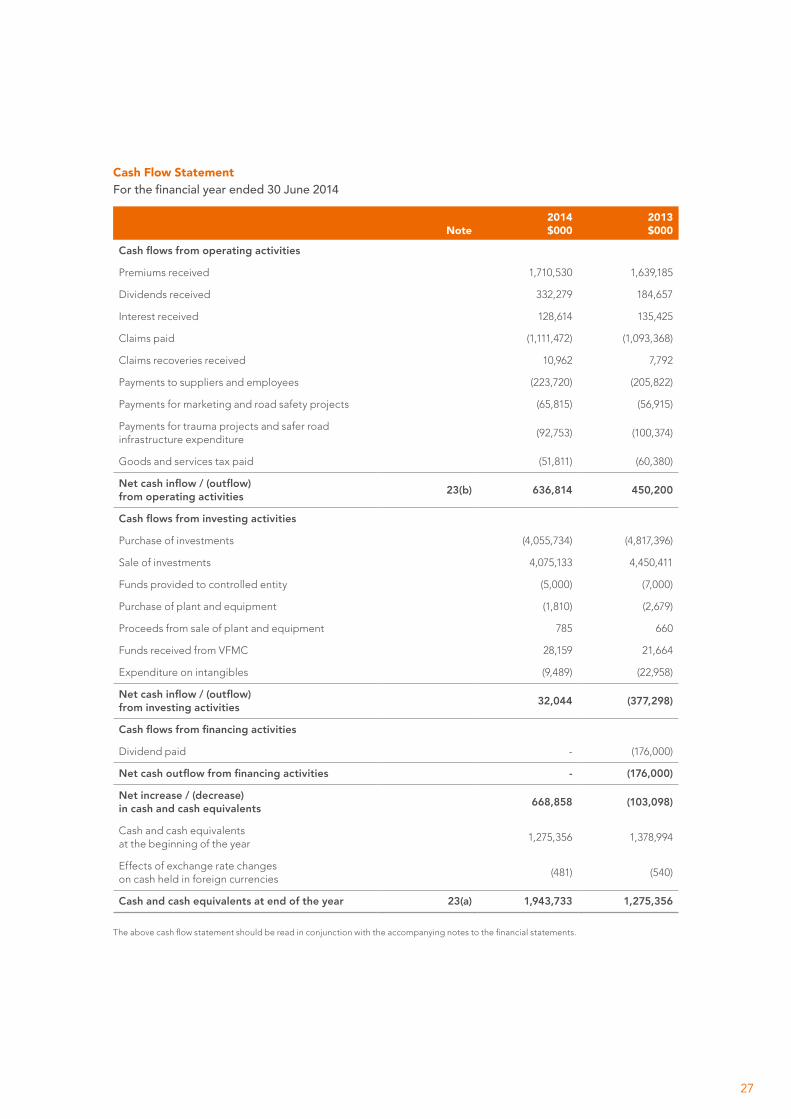
Cash Flow Statement For the financial year ended 30 June 2014
Note2014 $000
2013 $000
Cash flows from operating activities
Premiums received 1,710,530 1,639,185
Dividends received 332,279 184,657
Interest received 128,614 135,425
Claims paid (1,111,472) (1,093,368)
Claims recoveries received 10,962 7,792
Payments to suppliers and employees (223,720) (205,822)
Payments for marketing and road safety projects (65,815) (56,915)
Payments for trauma projects and safer road infrastructure expenditure
(92,753) (100,374)
Goods and services tax paid (51,811) (60,380)
Net cash inflow / (outflow) from operating activities 23(b) 636,814 450,200
Cash flows from investing activities
Purchase of investments (4,055,734) (4,817,396)
Sale of investments 4,075,133 4,450,411
Funds provided to controlled entity (5,000) (7,000)
Purchase of plant and equipment (1,810) (2,679)
Proceeds from sale of plant and equipment 785 660
Funds received from VFMC 28,159 21,664
Expenditure on intangibles (9,489) (22,958)
Net cash inflow / (outflow) from investing activities 32,044 (377,298)
Cash flows from financing activities
Dividend paid - (176,000)
Net cash outflow from financing activities - (176,000)
Net increase / (decrease) in cash and cash equivalents 668,858 (103,098)
Cash and cash equivalents at the beginning of the year
1,275,356 1,378,994
Effects of exchange rate changes on cash held in foreign currencies
(481) (540)
Cash and cash equivalents at end of the year 23(a) 1,943,733 1,275,356
The above cash flow statement should be read in conjunction with the accompanying notes to the financial statements.
27
Notes to the Financial Statements and the year endThe Transport Accident Commission (TAC) was established and is governed by the Transport Accident Act 1986. The TAC operates the transport accident compensation scheme for Victorians who are injured or die as a result of a transport accident. For the purposes of this financial report prepared under Australian Accounting Standards:
• insurance refers to the transport accident compensation scheme;
• premiums refer to transport accident charge for motor vehicles and charge for trains and trams; and
• policy refers to the cover provided under the Transport Accident Act 1986.
1. Summary of significant accounting policies
Statement of compliance
The financial report is a general purpose financial report which has been prepared on an accrual basis in accordance with the Financial Management Act 1994 and applicable Australian Accounting Standards (AAS) which include Interpretations, issued by the Australian Accounting Standards Board (AASB). The Minister of Finance has determined that the TAC is a “for-profit” entity for the purpose of preparing the financial statements.
The financial report was authorised for issue by the directors on 28 August 2014.
Basis of preparation
This financial report has been prepared on a historical cost basis, except for outstanding claims liabilities, recovery receivables, employee leave liabilities which are included at present value and investments, plant, equipment and motor vehicles which are included at fair value. Cost is based on the fair values of the consideration given in exchange for assets.
In the application of Australian Accounting Standards, management is required to make judgements, estimates and assumptions about carrying values of assets and liabilities that are not readily apparent from other sources. The estimates and associated assumptions are based on historical experience and various other factors that are believed to be reasonable under the circumstances, the results of which form the basis of making the judgements. Actual results may differ from these estimates.
The estimates and underlying assumptions are reviewed on an ongoing basis. Revisions to accounting estimates are recognised in the period in which the estimate is revised if the revision affects only that period or in the period of the revision and future periods if the revision affects both current and future periods.
Judgements made by management in the application of Australian Accounting Standards that have significant effects on the financial report and estimates with a significant risk of material adjustments in the next year are disclosed in notes 1(e), 2 and 24 in the financial report.
The TAC determines the policies and procedures for fair value measurements in accordance with the requirements of AASB 13 and the relevant Financial Reporting Directions.
All assets and liabilities for which fair value is measured or disclosed in the financial statements are categorised within the fair value hierarchy as follows:
• Level 1: quoted prices (unadjusted) in active markets for identical assets or liabilities
• Level 2: inputs other than quoted prices included in Level 1 that are observable for the asset or liability, either directly (i.e. as prices) or indirectly (i.e. derived from prices)
• Level 3: inputs for the asset or liability that are not based on observable market data (unobservable inputs).
For the purpose of fair value disclosures, the TAC has determined classes of assets and liabilities on the basis of the nature, characteristics and risks of the asset or liability and the level of the fair value hierarchy as explained above. In addition, the TAC determines whether transfers have occurred between levels in the hierarchy by re-assessing categorisation at the end of each reporting period.
28
The financial statements do not consolidate the controlled entity of the TAC, the Residential Independence Pty Ltd (RIPL) as trustee for Residential Independence Trust (RIT) (note 12) as the financial impact of consolidation is considered not material.
The financial position continues to improve with strong operating results in the year of $499 million (2013: profit $973 million) leading to an improved net asset position of negative $108 million as at 30 June 2014 (2013: negative $607 million) and positive cash flows from operating activities of $637 million (2013: $450 million). Based on the financial projections, which continue to show improvements in the overall financial position, the Directors have concluded that the going concern assumption of the TAC remains appropriate.
Changes in accounting policies
The new and revised Standards adopted by the TAC in the current period and their financial impact are outlined below:
(a) AASB 13 Fair Value Measurement
AASB 13 establishes a single framework for measuring fair value and making disclosures about fair value measurements. It unifies the definition of fair value as the price that would be received to sell an asset or paid to transfer a liability in an orderly transaction between market participants at the measurement date. It replaces and expands the disclosure requirements about fair value measurements in other standards, including AASB 7. As a result, the TAC has included additional disclosures in this regard (see notes 13 and 24). This standard has had no material impact on the valuation methodologies used in the fair value measurement of the TAC’s assets and liabilities.
(b) AASB 119 Employee Benefits
AASB 119 changes the definition of short-term employee benefits, namely annual leave, which is recognised in Provisions. As the TAC does not expect its annual leave obligations to be settled wholly within 12 months from the end of the reporting period, it is classified as a long term benefit in its entirety. This standard has not had a material impact on the value of the obligation as the majority of the leave is still expected to be taken within a short timeframe after the end of the reporting period.
Australian Accounting Standards issued but not yet effective
The AASB has issued the following amendments to Australian Accounting Standards which are applicable to the TAC. These amendments are not effective for the annual reporting period ended 30 June 2014 and have not been applied in preparing the TAC’s financial report.
The nature of the application of these standards could impact the classification and measurement of financial assets. The extent of any impact has not yet been determined. The TAC will apply these standards for the annual reporting periods beginning on or after the operative dates set out below.
Title Operative Date
AASB 9 Financial Instruments 1 January 2017
2010-7 Amendments to Australian Accounting Standards arising from AASB 9 1 January 2017
29

The following significant accounting policies have been adopted in the preparation and presentation of the financial report.
(a) Premium revenue
Premium revenue is recognised in the comprehensive income statement when it has been earned and is calculated from the attachment date over the period of the policy. The pattern of recognition over the policy period is based on time, which is considered to approximate closely the pattern of risks underwritten.
Premium revenue is net of refunds and excludes stamp duty and goods and services tax.
(b) Investment income
Dividend income is recognised when the TAC’s right to receive the dividend has been established. Interest income is recognised on an accrual basis. Trust distribution income is recognised when the market prices are quoted ex-distribution for listed trusts. Unlisted trust distribution income is recognised when the trustee declares a distribution.
Changes in fair values of investments at balance date, as compared with their fair values at the previous balance date or cost of acquisition if acquired during the financial year, are recognised as investment income or loss. Realised profits or losses on the termination of derivative financial instruments and realised and unrealised profits or losses on changes in fair values of financial instruments are included in investment income.
(c) Unearned premiums
Unearned premiums represent the proportion of premiums received or receivable not earned and relate to periods of insurance subsequent to balance date, computed on the basis that the risk attaches to all policies from the middle of the month in which they are written.
(d) Unexpired risk liability
At each reporting date the TAC performs a liability adequacy test to assess whether the unearned premium liability is sufficient to cover all expected future cash flows relating to future claims against current insurance contracts.
If the present value of the expected future cash flows relating to future claims plus the additional risk margin to reflect the inherent uncertainty in the central estimate exceeds the unearned premium liability less related intangible assets and related deferred acquisition costs, then the unearned premium liability is deemed to be deficient. The TAC applies a risk margin to achieve the same probability of sufficiency for future claims as is achieved by the estimate of the outstanding claims liability, see note 1(e).
The entire deficiency is recognised immediately in the comprehensive income statement. The deficiency is recognised first by writing down any related intangible assets and then related deferred acquisition costs, with any excess being recorded in the balance sheet as an unexpired risk liability. No deficiency resulted in the year ended 30 June 2014 (2013: No deficiency).
(e) Outstanding claims liability
The liability for outstanding claims is measured on the basis of actuarially estimated costs of future claims payments, which include goods and services tax and the anticipated effects of inflation and other factors and are discounted to a present value at balance date. The expected future payments include those in relation to claims reported but not yet paid, claims incurred but not yet reported and the anticipated direct and indirect costs of settling those claims. The expected future payments are discounted to present value using a risk free rate.
A risk margin (refer note 16) is applied to the outstanding claims liability to reflect the inherent uncertainty in the central estimate of the outstanding claims liability. The risk margin increases the probability that the claims liability is adequately provided for to a 75% (2013: 75%) probability of sufficiency.
(f) Claim recovery receivables
Recoveries on claims paid and outstanding claims are recognised as revenue. Recoveries receivable are assessed in a manner similar to the measurement of outstanding claims liability. Receivables are measured as the present value of the expected future receipts, calculated on the same basis as the outstanding claims liability (note 1(e)). A provision for impairment is established when there is objective evidence that the TAC will not be able to collect all the claim recovery amounts.
30

(g) Deferred acquisition costs
Acquisition costs represent fees incurred for the collection of transport accident charges for motor vehicles. Acquisition costs are deferred and recognised as assets where they can be reliably measured and where it is probable that they will give rise to a future benefit. Deferred acquisition costs are measured at the lower of cost and recoverable amount and are expensed to correspond to the earning pattern of the premium revenue.
(h) Assets backing insurance liabilities
The TAC’s investment portfolio is managed by the Victorian Funds Management Corporation (VFMC) through internal management and fund managers and a Master Custodian. The Master Custodian holds the investments and conducts settlements pursuant to instructions from internal management and fund managers.
The TAC has determined that all assets, except for plant and equipment and intangibles, are held to back insurance liabilities. Investments are designated at fair value through the comprehensive income statement on the basis that the investments are managed as a portfolio based on their fair values, and have their performance evaluated in accordance with documented risk management and investment strategies (refer note 9). Initial recognition is at cost in the balance sheet and subsequent measurement is at fair value with any resultant unrealised profits and losses recognised in the comprehensive income statement.
The following methods and assumptions are used to determine the fair value of investments:
• financial instruments traded in an organised financial market (traded securities) – fair value based on current quoted market price for the instrument. Quoted market prices are used to value listed shares, options, debentures and other equity and debt securities.
• financial instruments not readily traded in an organised financial market – fair value based on present value of contractual future cash flows. Cash flows are discounted using standard valuation techniques at the applicable market yield having regard to the timing of the cash flows.
Details of fair value for the different types of investment assets are listed below:
• cash assets, deposits held at call with banks and investments in money market instruments are carried at face value which approximate to their fair value;
• investments in discounted money market instruments are valued at their quoted mid price at the balance sheet date, as with fine trading spreads in this market, there is an ability to transact at mid price;
• shares, fixed interest securities, options and units in trusts listed on stock exchanges or traded in an open market are initially recognised at cost (which is equal to fair value) and the subsequent fair value is taken as the quoted bid price of the instruments at the balance sheet date;
• futures contracts listed on recognised exchanges are valued using the quoted settlement price; and
• units in unlisted trusts are recorded at fair value as determined by the fund manager or valuation by other skilled independent third parties. In determining fair value, the manager or third parties use observable market transactions of the units and underlying assets where available and applicable; some of the underlying assets of the trusts are valued using valuation models that include inputs which are not based on observable market data.
All purchases and sales of investments that require delivery of the asset within the time frame established by regulation or market convention (‘regular way’ transactions) are recognised at trade date, being the date on which the commitments are made to buy or sell the asset. In cases where the period between trade and settlement exceeds this time frame, the transaction is recognised at settlement date.
Investments are derecognised when the rights to receive future cash flows from the assets have expired, or have been transferred, and the TAC has transferred substantially all the risks and rewards of ownership.
Investments that are due to mature, expire or be realised within twelve months of balance date are classified as current investments for the purposes of classification in the balance sheet. While this classification policy may result in a reported working capital deficit, the TAC holds high quality liquid assets in its investment portfolio which are readily convertible to cash assets. In addition, the TAC is normally cash flow positive with premium and investment income exceeding claims and administrative cost payments.
31

(i) Foreign currency translation
Foreign currency transactions are translated into Australian dollars at the exchange rates ruling at the dates of the transactions. Investments held at balance date that are denominated in foreign currencies are retranslated to Australian dollars at rates of exchange ruling at the balance sheet date. Exchange differences are recognised in the comprehensive income statement in the period in which they arise.
(j) Derivative financial instruments
VFMC and fund managers use derivative financial instruments such as foreign exchange contracts, futures, swaps and options to more effectively manage the risks associated with investing in large institutional portfolios. Derivatives are originally recognised at fair value at the date a derivative contract is entered into and are subsequently remeasured to their fair value at each reporting date with any gain or loss recognised in the comprehensive income statement.
The fair value of forward exchange contracts is calculated by reference to current forward exchange rates for contracts with similar maturity profiles. The fair value of interest rate swap contracts is determined by reference to market values for similar instruments.
(k) Employee benefits
Provision is made for benefits accruing to employees in respect of salaries, annual leave and long service leave. In determining the provisions, allowance is made for on-costs including payroll tax, workers compensation and superannuation. No provision is made for non-vesting sick leave as the TAC has no legal obligation to pay accumulated sick leave upon staff termination.
Short Term employee benefit obligations
Provisions made in respect of employee benefits expected to be settled wholly within 12 months after the end of the reporting period, are measured at their nominal values using the remuneration rate expected to apply at the time of settlement.
Other Long Term employee benefit obligations
Liabilities arising which the entity does not expect the obligations to be wholly settled within 12 months from the end of the reporting period are classified as long term benefits.
Those liabilities that are not expected to be settled within 12 months are recognised in the provision for employee benefits as current liabilities, where the TAC does not have the right to defer settlement. This is measured at present value of the amounts expected to be paid when the liabilities are settled using the remuneration rate expected to apply at the time of settlement.
Employee entitlements for which the TAC has an unconditional right to defer settlement of the liability beyond 12 months after the reporting date are shown as a non-current liability. This is measured at present value of the amounts expected to be paid when the liabilities are settled using the remuneration rate expected to apply at the time of settlement.
Termination Benefits
Termination benefits are payable when employment is terminated before the normal retirement date, or when an employee decides to accept an offer of benefits in exchange for the termination of employment. The TAC recognises termination benefits when it is demonstrably committed to either terminating the employment of current employees according to a detailed formal plan without possibility of withdrawal or providing termination benefits as a result of an offer made to encourage voluntary redundancy. Benefits falling due more than 12 months after the end of the reporting period are discounted to present value.
Defined contribution superannuation plans
Contributions to defined contribution superannuation plans are expensed when incurred.
Defined benefit superannuation plans
The amount charged to the comprehensive income statement in respect of defined benefit superannuation plans represents the contributions made to the superannuation plans in respect of the current services of employees. Superannuation contributions are made to the plans based on the relevant rules of each plan.
32

(l) Plant, equipment and motor vehicles
Plant and equipment is stated at fair value defined as cost less accumulated depreciation and any impairment in value. Motor vehicles under finance leases are capitalised at the present value of the minimum lease payments.
Depreciation of plant and equipment is calculated on a straight line basis at rates which allocate their costs over the estimated useful lives of the assets to its estimated residual value. The costs of improvements to leasehold premises is amortised over the remaining period of the lease or estimated useful life, whichever is the shorter, using the straight line method. The estimated useful lives, residual values and depreciation method are reviewed at the end of each annual reporting period and adjusted if appropriate.
Any gain or loss on disposal is recognised in the comprehensive income statement.
Depreciation on motor vehicles is calculated on a straight line basis over the term of the lease.
The depreciation rates applied to each of the asset classes are as follows:
• Leasehold improvements, plant and equipment - 5% - 15% (2013: 5% - 15%)
• Computer equipment - 20% - 33% (2013: 20% - 33%)
• Motor vehicles under lease - 33% (2013: 33%)
(m) Intangible assets
Intangible assets represent identifiable non-monetary assets without physical substance.
Intangible assets are initially recognised at cost. Subsequently, intangible assets with finite useful lives are carried at cost less accumulated depreciation/amortisation and accumulated impairment losses.
Costs associated with the acquisition or development of computer software are capitalised and amortised on a straight line basis over the expected useful life of the computer software. The useful lives range from 3 to 10 years (2013: 3 to 10 years). The amortisation period for an intangible asset is reviewed annually.
(n) Impairment of assets
Assets are assessed annually for indications of impairment except for financial instrument assets and deferred tax assets. If there is an indication of impairment, the assets concerned are tested as to whether their carrying value exceeds their recoverable amount. Where an asset’s carrying value exceeds its recoverable amount, the difference is written-off by a charge to the comprehensive income statement.
The recoverable amount for assets is measured at the higher of the present value of future cash flows expected to be obtained from the asset and fair value less costs to sell, where applicable.
(o) Leases
Leases are classified as finance leases whenever the terms of the lease transfer substantially all the risks and rewards of ownership to the lessee. All other leases are classified as operating leases.
Finance leases are capitalised at fair value, or if lower, at the present value of the minimum lease payments. A lease liability of equal value is also recognised. Lease payments are allocated between the principal component of the lease liability and the interest expense. Finance leases assets are amortised on a straight line basis over the term of the lease.
Operating lease payments are charged as an expense in the comprehensive income statement on a straight-line basis over the lease term.
(p) Dividends
In accordance with section 29B of the Transport Accident Act 1986, the TAC is required to pay to the Victorian State Government, a dividend as determined by the Treasurer.
An obligation to pay a dividend only arises after a formal determination is made by the Treasurer following consultation between the TAC, the Assistant Treasurer and the Treasurer.
33

(q) Income tax
In accordance with section 88 (3D) of the State Owned Enterprises Act 1992, the TAC is required to pay income tax equivalent under the National Tax Equivalent Regime (NTER).
The income tax expense or benefit represents the tax payable or receivable on the current year’s taxable income based on the prevailing income tax rate adjusted for changes in deferred tax assets and liabilities.
Deferred tax is accounted for using the balance sheet liability method in respect of temporary differences arising from differences between the carrying amount of assets and liabilities in the financial statements and the corresponding tax base of those items. Deferred tax assets and liabilities are recognised for temporary differences at the tax rates that are expected to apply when the assets and liabilities are realised or settled, based on tax rates that have been enacted or substantially enacted by reporting date.
Deferred tax assets are recognised to the extent that it is probable that sufficient taxable amounts will be available against which deductible temporary differences or unused tax losses and tax offsets can be utilised. However, deferred tax assets and liabilities are not recognised if the temporary differences giving rise to them arise from the initial recognition of assets and liabilities which affect neither taxable income nor accounting profit.
The carrying amount of deferred tax assets is reviewed at each balance sheet date and reduced to the extent that it is no longer probable that sufficient taxable profit will be available to allow all or part of the deferred tax asset to be utilised.
Deferred tax assets and liabilities are offset as the TAC settles its current tax assets and liabilities on a net basis.
(r) Motorcycle Road Safety Reserve
The TAC premiums for certain motorcycle classes include an additional levy collected annually to fund special projects to improve motorcycle road safety in Victoria. These monies are set aside in the Motorcycle Road Safety Reserve specifically set up for this program. The program expenditure is developed by the Victorian Motorcycle Advisory Council (made up of representatives from the State’s main road safety agencies, the RACV and motorcyclist interest groups) and administered by VicRoads which seeks reimbursement for expenditure from the TAC.
(s) Goods and services tax
Revenues, expenses and assets are recognised net of the amount of goods and services tax (GST), except where the amount of GST incurred is not recoverable from the Australian Taxation Office (ATO). In these circumstances the GST is recognised as part of the cost of acquisition of the asset or as part of the expense. Receivables and payables are stated inclusive of GST.
The net amount of GST recoverable from, or payable to the ATO, is included as part of receivables or payables in the balance sheet.
Cash flows are included in the cash flow statement on a gross basis. The GST component of cash flows arising from investing and financing activities, which is recoverable from, or payable to the ATO, are classified as operating cash flows.
(t) Commitments
Commitments include operating and capital expenditure commitments arising from non-cancellable contractual sources and are disclosed at their nominal value inclusive of GST.
(u) Contingent assets and contingent liabilities
Contingent assets and contingent liabilities are not recognised in the balance sheet, but are disclosed by way of a note and, if quantifiable, are measured at nominal value inclusive of GST.
34

(v) Events after reporting date
Assets, liabilities, income or expenses arise from past transactions or other past events. Where the transactions result from an agreement between the TAC and other parties, the transactions are only recognised when the agreement is irrevocable at or before the end of the reporting period. Adjustments are made to amounts recognised in the financial statements for events which occur between the end of the reporting period and the date when the financial statements are authorised for issue, where those events provide information about conditions which existed at the reporting date. Note disclosure is made about events between the end of the reporting period and the date the financial statements are authorised for issue where the events relate to conditions which arose after the end of the reporting period that are considered to be of material interest.
(w) Rounding
Amounts have been rounded to the nearest thousand dollars unless otherwise stated.
(x) Functional and presentation currency
The functional currency of the TAC is the Australian dollar, which has also been identified as the presentation currency of the TAC.
2. Actuarial assumptions and methodsThe TAC operates the Victorian transport accident compensation scheme which is long tail in nature, meaning that claims are typically settled more than one year after being reported.
Significant estimates and judgements are made by the TAC valuation actuary in respect of certain key asset and liability amounts disclosed in the financial statements. These estimates and judgements are continually being evaluated and are based on historical experience, as well as enhancements to actuarial modelling techniques. The key areas of significant estimates and judgements and the methodologies used to determine key assumptions are set out below.
Provision is made at the year end for the estimated cost of claims incurred but not settled at the balance sheet date, including the cost of claims incurred but not reported to the TAC.
The estimation of outstanding claims liabilities is based largely on the assumption that past developments are an appropriate predictor of the future and involves a variety of actuarial techniques that analyse experience, trends and other relevant factors. The process commences with the actuarial projection of the future claims payments and claims handling costs incurred to reporting date. Each benefit type is usually examined separately.
Actuarial techniques used to analyse and project the various benefit types, include:
• Payments per claim incurred (PPCI)
• Payments per active claim (PPAC)
• Payments per claim settled (PPCS)
• Annuity based individual claim models (ICM)
Projected future claims payments and associated claims handling costs are discounted to a present value as required using appropriate risk free discount rates (i.e. rates set with reference to Commonwealth Government Securities). A projection of future claims payments are undertaken separately of both gross claims payments and recoveries.
This projection is made without bias toward over or under estimation. As such, the resulting estimate is considered to be a net central estimate of outstanding claims liabilities that has an approximately equal chance of proving adequate or inadequate. Where possible and appropriate, multiple actuarial methods will be applied to project future claims payments. This assists in providing a greater understanding of the trends inherent in the past data. The projections obtained from various methods also assist in setting the range of possible outcomes. The most appropriate method, or even a combination of methods, is selected taking into account the characteristics of each benefit type and the extent of the development of each past accident period.
Large claims impacting each relevant benefit type are generally assessed separately, being measured on a case by case basis or projected separately in order to allow for the possible distortive effect of the development and incidence of these large claims.
The final provision is then obtained by examining the results from the above methods and using judgement to combine them in varying proportions according to injury period.
35
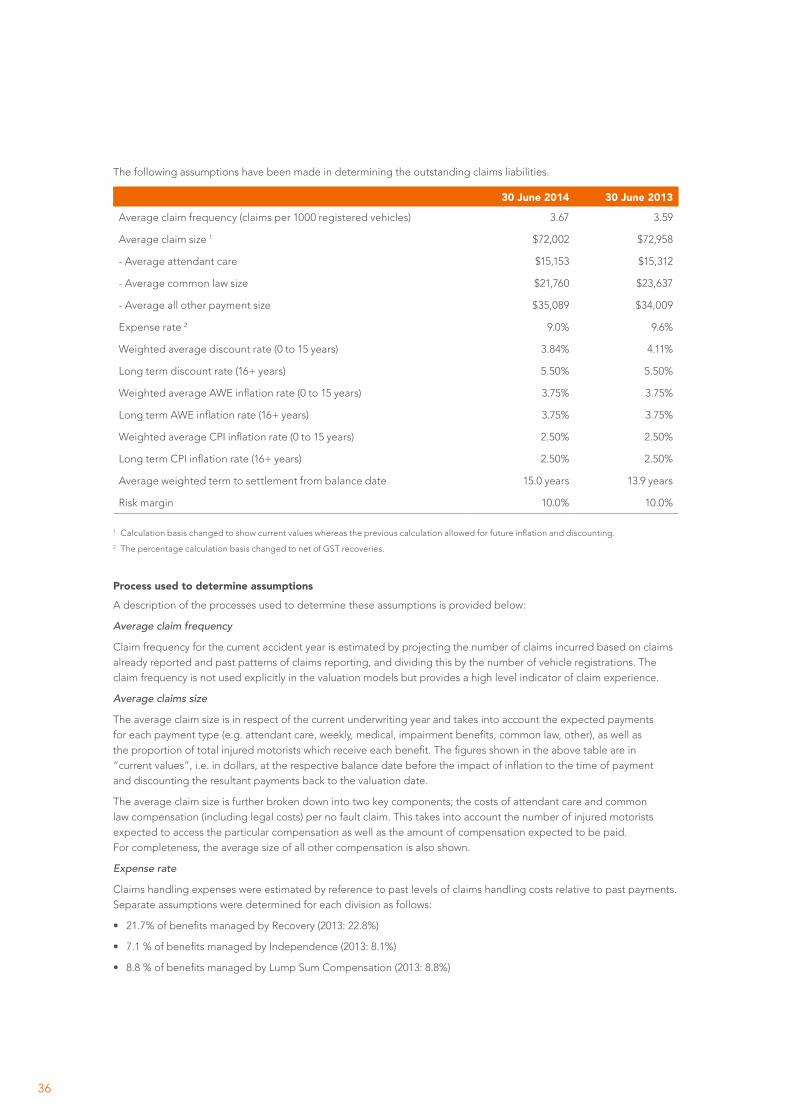
The following assumptions have been made in determining the outstanding claims liabilities.
30 June 2014 30 June 2013
Average claim frequency (claims per 1000 registered vehicles) 3.67 3.59
Average claim size 1 $72,002 $72,958
- Average attendant care $15,153 $15,312
- Average common law size $21,760 $23,637
- Average all other payment size $35,089 $34,009
Expense rate 2 9.0% 9.6%
Weighted average discount rate (0 to 15 years) 3.84% 4.11%
Long term discount rate (16+ years) 5.50% 5.50%
Weighted average AWE inflation rate (0 to 15 years) 3.75% 3.75%
Long term AWE inflation rate (16+ years) 3.75% 3.75%
Weighted average CPI inflation rate (0 to 15 years) 2.50% 2.50%
Long term CPI inflation rate (16+ years) 2.50% 2.50%
Average weighted term to settlement from balance date 15.0 years 13.9 years
Risk margin 10.0% 10.0%
1 Calculation basis changed to show current values whereas the previous calculation allowed for future inflation and discounting.
2 The percentage calculation basis changed to net of GST recoveries.
Process used to determine assumptions
A description of the processes used to determine these assumptions is provided below:
Average claim frequency
Claim frequency for the current accident year is estimated by projecting the number of claims incurred based on claims already reported and past patterns of claims reporting, and dividing this by the number of vehicle registrations. The claim frequency is not used explicitly in the valuation models but provides a high level indicator of claim experience.
Average claims size
The average claim size is in respect of the current underwriting year and takes into account the expected payments for each payment type (e.g. attendant care, weekly, medical, impairment benefits, common law, other), as well as the proportion of total injured motorists which receive each benefit. The figures shown in the above table are in “current values”, i.e. in dollars, at the respective balance date before the impact of inflation to the time of payment and discounting the resultant payments back to the valuation date.
The average claim size is further broken down into two key components; the costs of attendant care and common law compensation (including legal costs) per no fault claim. This takes into account the number of injured motorists expected to access the particular compensation as well as the amount of compensation expected to be paid. For completeness, the average size of all other compensation is also shown.
Expense rate
Claims handling expenses were estimated by reference to past levels of claims handling costs relative to past payments. Separate assumptions were determined for each division as follows:
• 21.7% of benefits managed by Recovery (2013: 22.8%)
• 7.1 % of benefits managed by Independence (2013: 8.1%)
• 8.8 % of benefits managed by Lump Sum Compensation (2013: 8.8%)
36
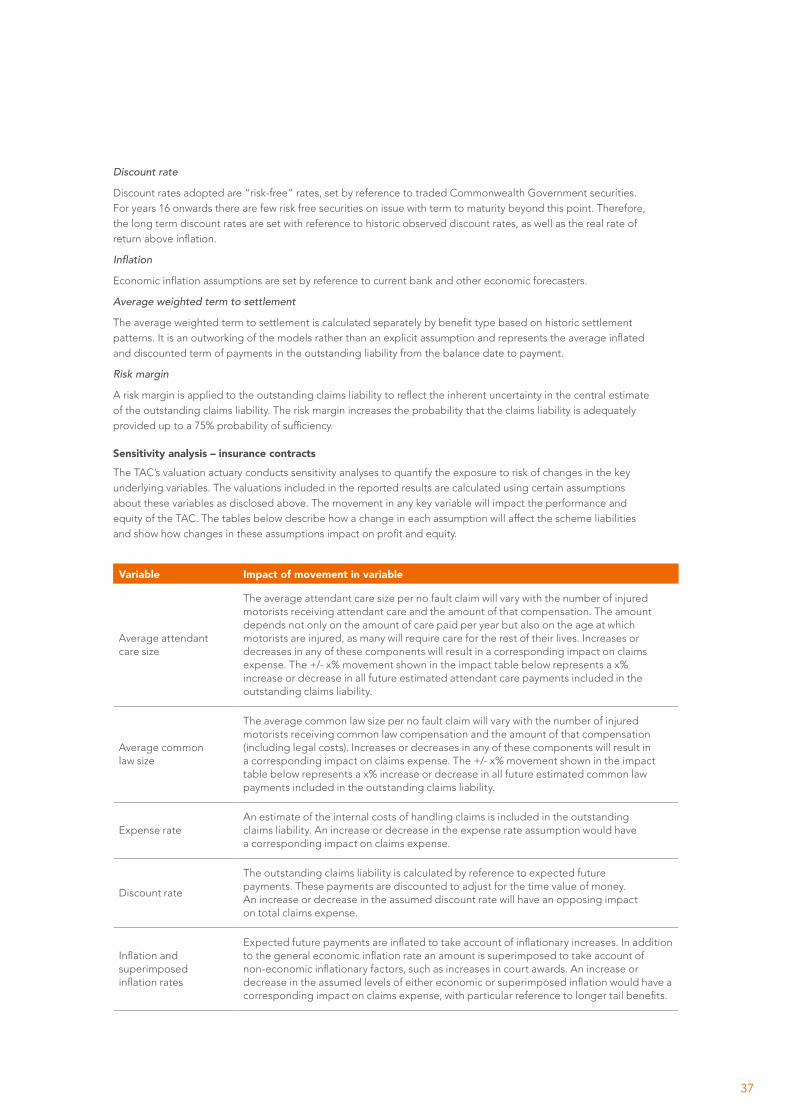
Discount rate
Discount rates adopted are “risk-free” rates, set by reference to traded Commonwealth Government securities. For years 16 onwards there are few risk free securities on issue with term to maturity beyond this point. Therefore, the long term discount rates are set with reference to historic observed discount rates, as well as the real rate of return above inflation.
Inflation
Economic inflation assumptions are set by reference to current bank and other economic forecasters.
Average weighted term to settlement
The average weighted term to settlement is calculated separately by benefit type based on historic settlement patterns. It is an outworking of the models rather than an explicit assumption and represents the average inflated and discounted term of payments in the outstanding liability from the balance date to payment.
Risk margin
A risk margin is applied to the outstanding claims liability to reflect the inherent uncertainty in the central estimate of the outstanding claims liability. The risk margin increases the probability that the claims liability is adequately provided up to a 75% probability of sufficiency.
Sensitivity analysis – insurance contracts
The TAC’s valuation actuary conducts sensitivity analyses to quantify the exposure to risk of changes in the key underlying variables. The valuations included in the reported results are calculated using certain assumptions about these variables as disclosed above. The movement in any key variable will impact the performance and equity of the TAC. The tables below describe how a change in each assumption will affect the scheme liabilities and show how changes in these assumptions impact on profit and equity.
Variable Impact of movement in variable
Average attendant care size
The average attendant care size per no fault claim will vary with the number of injured motorists receiving attendant care and the amount of that compensation. The amount depends not only on the amount of care paid per year but also on the age at which motorists are injured, as many will require care for the rest of their lives. Increases or decreases in any of these components will result in a corresponding impact on claims expense. The +/- x% movement shown in the impact table below represents a x% increase or decrease in all future estimated attendant care payments included in the outstanding claims liability.
Average common law size
The average common law size per no fault claim will vary with the number of injured motorists receiving common law compensation and the amount of that compensation (including legal costs). Increases or decreases in any of these components will result in a corresponding impact on claims expense. The +/- x% movement shown in the impact table below represents a x% increase or decrease in all future estimated common law payments included in the outstanding claims liability.
Expense rateAn estimate of the internal costs of handling claims is included in the outstanding claims liability. An increase or decrease in the expense rate assumption would have a corresponding impact on claims expense.
Discount rate
The outstanding claims liability is calculated by reference to expected future payments. These payments are discounted to adjust for the time value of money. An increase or decrease in the assumed discount rate will have an opposing impact on total claims expense.
Inflation and superimposed inflation rates
Expected future payments are inflated to take account of inflationary increases. In addition to the general economic inflation rate an amount is superimposed to take account of non-economic inflationary factors, such as increases in court awards. An increase or decrease in the assumed levels of either economic or superimposed inflation would have a corresponding impact on claims expense, with particular reference to longer tail benefits.
37
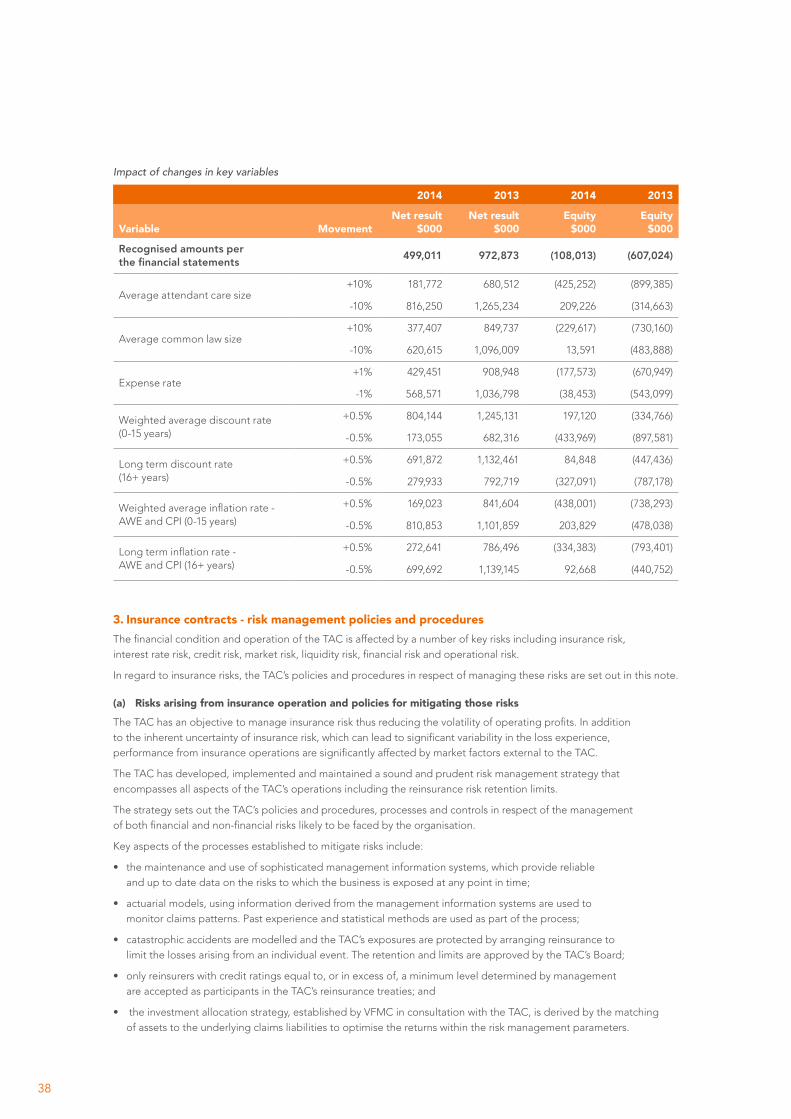
Impact of changes in key variables
2014 2013 2014 2013
Variable MovementNet result
$000Net result
$000Equity
$000Equity
$000
Recognised amounts per the financial statements 499,011 972,873 (108,013) (607,024)
Average attendant care size+10% 181,772 680,512 (425,252) (899,385)
-10% 816,250 1,265,234 209,226 (314,663)
Average common law size+10% 377,407 849,737 (229,617) (730,160)
-10% 620,615 1,096,009 13,591 (483,888)
Expense rate+1% 429,451 908,948 (177,573) (670,949)
-1% 568,571 1,036,798 (38,453) (543,099)
Weighted average discount rate (0-15 years)
+0.5% 804,144 1,245,131 197,120 (334,766)
-0.5% 173,055 682,316 (433,969) (897,581)
Long term discount rate (16+ years)
+0.5% 691,872 1,132,461 84,848 (447,436)
-0.5% 279,933 792,719 (327,091) (787,178)
Weighted average inflation rate - AWE and CPI (0-15 years)
+0.5% 169,023 841,604 (438,001) (738,293)
-0.5% 810,853 1,101,859 203,829 (478,038)
Long term inflation rate - AWE and CPI (16+ years)
+0.5% 272,641 786,496 (334,383) (793,401)
-0.5% 699,692 1,139,145 92,668 (440,752)
3. Insurance contracts - risk management policies and proceduresThe financial condition and operation of the TAC is affected by a number of key risks including insurance risk, interest rate risk, credit risk, market risk, liquidity risk, financial risk and operational risk.
In regard to insurance risks, the TAC’s policies and procedures in respect of managing these risks are set out in this note.
(a) Risks arising from insurance operation and policies for mitigating those risks
The TAC has an objective to manage insurance risk thus reducing the volatility of operating profits. In addition to the inherent uncertainty of insurance risk, which can lead to significant variability in the loss experience, performance from insurance operations are significantly affected by market factors external to the TAC.
The TAC has developed, implemented and maintained a sound and prudent risk management strategy that encompasses all aspects of the TAC’s operations including the reinsurance risk retention limits.
The strategy sets out the TAC’s policies and procedures, processes and controls in respect of the management of both financial and non-financial risks likely to be faced by the organisation.
Key aspects of the processes established to mitigate risks include:
• the maintenance and use of sophisticated management information systems, which provide reliable and up to date data on the risks to which the business is exposed at any point in time;
• actuarial models, using information derived from the management information systems are used to monitor claims patterns. Past experience and statistical methods are used as part of the process;
• catastrophic accidents are modelled and the TAC’s exposures are protected by arranging reinsurance to limit the losses arising from an individual event. The retention and limits are approved by the TAC’s Board;
• only reinsurers with credit ratings equal to, or in excess of, a minimum level determined by management are accepted as participants in the TAC’s reinsurance treaties; and
• the investment allocation strategy, established by VFMC in consultation with the TAC, is derived by the matching of assets to the underlying claims liabilities to optimise the returns within the risk management parameters.
38
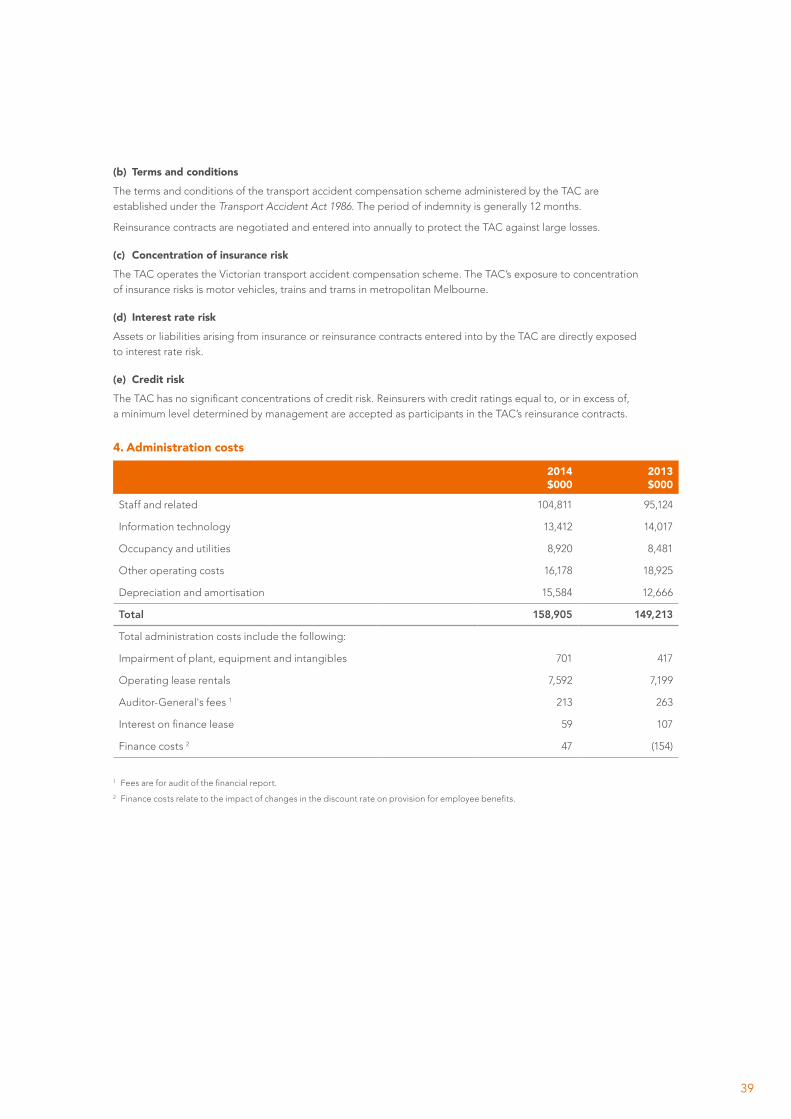
(b) Terms and conditions
The terms and conditions of the transport accident compensation scheme administered by the TAC are established under the Transport Accident Act 1986. The period of indemnity is generally 12 months.
Reinsurance contracts are negotiated and entered into annually to protect the TAC against large losses.
(c) Concentration of insurance risk
The TAC operates the Victorian transport accident compensation scheme. The TAC’s exposure to concentration of insurance risks is motor vehicles, trains and trams in metropolitan Melbourne.
(d) Interest rate risk
Assets or liabilities arising from insurance or reinsurance contracts entered into by the TAC are directly exposed to interest rate risk.
(e) Credit risk
The TAC has no significant concentrations of credit risk. Reinsurers with credit ratings equal to, or in excess of, a minimum level determined by management are accepted as participants in the TAC’s reinsurance contracts.
4. Administration costs
2014 $000
2013 $000
Staff and related 104,811 95,124
Information technology 13,412 14,017
Occupancy and utilities 8,920 8,481
Other operating costs 16,178 18,925
Depreciation and amortisation 15,584 12,666
Total 158,905 149,213
Total administration costs include the following:
Impairment of plant, equipment and intangibles 701 417
Operating lease rentals 7,592 7,199
Auditor-General's fees 1 213 263
Interest on finance lease 59 107
Finance costs 2 47 (154)
1 Fees are for audit of the financial report.
2 Finance costs relate to the impact of changes in the discount rate on provision for employee benefits.
39

5. Investment income
2014 $000
2013 $000
Dividends 331,688 187,272
Interest 1 124,985 126,520
Changes in fair values of investments 2
- realised profit / (loss) 299,188 246,195
- unrealised profit / (loss) 587,651 659,975
Investment income 1,343,512 1,219,962
Investment expense 3 (28,944) (24,499)
Net investment profit 1,314,568 1,195,463
1 Interest earned includes net settlements on swap contracts.
2 This is the difference between the fair value of the investments as at 1 July or the cost of acquisition (for investments purchased during the period), and net sales proceeds (realised) or their fair value as at 30 June (unrealised).
3 Fees paid to Victorian Funds Management Corporation under the Client Funds Management Service Agreement and other professional fees incurred by the TAC in relation to the management of the investment portfolio.
The TAC investment portfolio benefited from the strong performance in global equity markets and recorded a return of 14.7% for 2013-14, compared to 15.5% for the previous year.
40
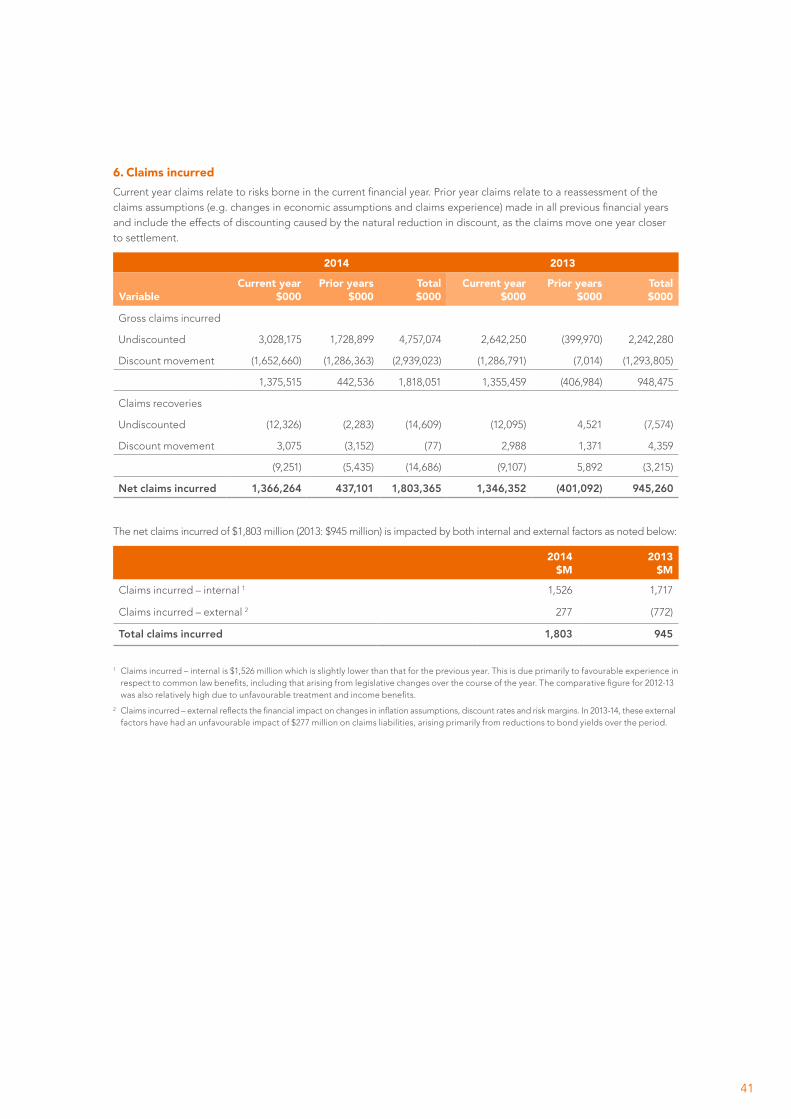
6. Claims incurred Current year claims relate to risks borne in the current financial year. Prior year claims relate to a reassessment of the claims assumptions (e.g. changes in economic assumptions and claims experience) made in all previous financial years and include the effects of discounting caused by the natural reduction in discount, as the claims move one year closer to settlement.
2014 2013
VariableCurrent year
$000Prior years
$000 Total $000
Current year $000
Prior years $000
Total $000
Gross claims incurred
Undiscounted 3,028,175 1,728,899 4,757,074 2,642,250 (399,970) 2,242,280
Discount movement (1,652,660) (1,286,363) (2,939,023) (1,286,791) (7,014) (1,293,805)
1,375,515 442,536 1,818,051 1,355,459 (406,984) 948,475
Claims recoveries
Undiscounted (12,326) (2,283) (14,609) (12,095) 4,521 (7,574)
Discount movement 3,075 (3,152) (77) 2,988 1,371 4,359
(9,251) (5,435) (14,686) (9,107) 5,892 (3,215)
Net claims incurred 1,366,264 437,101 1,803,365 1,346,352 (401,092) 945,260
The net claims incurred of $1,803 million (2013: $945 million) is impacted by both internal and external factors as noted below:
2014 $M
2013 $M
Claims incurred – internal 1 1,526 1,717
Claims incurred – external 2 277 (772)
Total claims incurred 1,803 945
1 Claims incurred – internal is $1,526 million which is slightly lower than that for the previous year. This is due primarily to favourable experience in respect to common law benefits, including that arising from legislative changes over the course of the year. The comparative figure for 2012-13 was also relatively high due to unfavourable treatment and income benefits.
2 Claims incurred – external reflects the financial impact on changes in inflation assumptions, discount rates and risk margins. In 2013-14, these external factors have had an unfavourable impact of $277 million on claims liabilities, arising primarily from reductions to bond yields over the period.
41

7. Income tax
2014 $000
2013 $000
(a) Income tax recognised in comprehensive income statement
Income tax expense / (benefit) comprises:
Current tax expense / (benefit) 20,480 215,505
Deferred tax adjustment 177,136 191,494
Adjustment in respect of prior years (4,784) (1,669)
Total tax expense / (benefit) 192,832 405,330
Deferred tax adjustment comprises:
(Increase) / Decrease in deferred tax assets 16,683 112,336
Increase in deferred tax liabilities 160,453 79,158
177,136 191,494
(b) Reconciliation between net result before tax and income tax expense / (benefit)
Net profit / (loss) before tax 691,843 1,378,203
Tax at the statutory rate of 30% (2013 - 30%) 207,553 413,461
Imputation gross-up on dividends received 4,569 3,003
Franking credits and withholding tax on dividends received (14,552) (9,415)
Sundry items (4,738) (1,719)
Income tax expense / (benefit) 192,832 405,330
(c) Deferred tax balances
Deferred tax assets comprise:
Carry forward tax losses 560,365 596,276
Claims handling expense included in outstanding claims 267,694 263,780
Provisions and accrued employee entitlements not currently deductible 5,524 5,910
Prepayment 1,800 1,800
Accruals not currently deductible 39 35
835,422 867,801
Deferred tax liabilities comprise:
Unrealised gain on investments 241,886 80,191
Difference in depreciation/amortisation of plant and equipment and intangible assets for accounting and income tax purposes
4,341 5,583
246,227 85,774
Net deferred tax assets 589,195 782,027
42

8. Receivables
2014 $000
2013 $000
Current
Premiums receivable 1 14,755 13,721
Claims GST receivable 2 50,812 50,044
Claims recoveries and other debtors 3 11,316 13,409
Less: Provision for impairment (253) (2,268)
11,063 11,141
Total current 76,630 74,906
Non-current
Claims GST receivable 2 378,726 343,631
Claims recoveries and other debtors 3 52,490 49,564
Less: Provision for impairment (19) (351)
52,471 49,213
Total non-current 431,197 392,844
1 Premium receivables are computed based on the proportion of premium collections attributable to periods of insurance prior to the period when the premiums were collected.
2 Amounts represent the GST credits which the TAC is entitled to claim on future claims payments. These amounts are actuarially estimated and discounted to present value at balance date.
3 Included within the claims recoveries and other debtors balance is $61.933 million (2013: $58.208 million) of actuarially determined recoveries with the remaining $1.873 million (2013: $4.765 million) relating to actual receivables from known counterparties which are past due as at the reporting date. The TAC has provided for impairment of these on the basis of past experience. The average age of those receivables that are past due but not impaired is above 90 days. The TAC does not hold any collateral over these balances.
(a) Movement in provision for impairment
2014 $000
2013 $000
Balance at 1 July (2,619) (2,576)
Increase in allowance recognised in the net result - (113)
Decrease in allowance recognised in the net result 124 -
Reversal of unused provision recognised in the net result 2,223 70
Balance at 30 June (272) (2,619)
43

9. InvestmentsThe TAC’s investment activity is undertaken pursuant to the Transport Accident Act 1986, the Borrowing and Investment Powers Act 1987 and the Treasurer’s Prudential Statement. It is the Victorian Government’s policy that all the investment assets of the TAC be managed by the Victorian Funds Management Corporation (VFMC).
Under the Centralised Model implemented by the Victorian Government in July 2006, the TAC is responsible for setting its investment objectives whilst the VFMC has responsibility to develop appropriate investment strategies that target the TAC’s investment objectives. The investment strategy that is determined by the VFMC for the TAC is documented in a detailed Investment Risk Management Plan (IRMP) which is approved by the Treasurer. The IRMP is prepared by the VFMC and addresses issues concerning strategy, portfolio construction, benchmarks and risk management.
The TAC Board is not responsible for the management or prudential supervision of the investments – the management responsibility rests with the VFMC and the prudential supervision responsibility rests with the Department of Treasury and Finance (DTF). The VFMC Board is required to certify to the DTF on a quarterly basis and on an annual basis to the TAC, that the TAC’s investment portfolio has been managed in accordance with the accepted IRMP and with the TAC’s investment objectives. The TAC is responsible for the review of the contractual and service level agreements and for periodically reviewing and discussing with VFMC its investment performance against its investment objectives.
Investment performance, including comparisons to market benchmarks, is reported to the TAC Board monthly. The Board’s standing Financial and Investment Strategies Committee also convenes periodically to review the VFMC’s investment performance, discuss the investment strategy and review the implications for achieving the TAC’s investment objectives.
The investment portfolio consists of a range of assets that broadly resemble: cash and nominal bonds to cover short term risk and liquidity needs; inflation linked assets that more closely match TAC’s liability characteristics; and equities to provide for long term growth.
2014 $000
2013 $000
Asset category
Cash investments 648,092 346,708
Australian equities 1,266,393 1,127,506
International equities 3,685,449 3,072,344
Private equity 308,342 310,124
Inflation linked bonds 1,368,513 1,285,548
Infrastructure 484,353 429,581
Property 591,133 622,680
Diversified fixed income 1,116,435 1,051,767
Insurance 167,580 80,905
Non traditional strategies 719,117 528,354
Overlays 1 5,487 14,569
Total 10,360,894 8,870,086
Current 2,255,563 1,329,818
Non-current 8,105,331 7,540,268
Total 10,360,894 8,870,086
1 Overlays represent the gains or losses on various derivative and swap positions in interest rate, foreign currency and equity markets.
TAC has uncalled capital commitments within its investments totalling $559.9 million as at 30 June 2014 (2013: $324.1 million), which have not been recognised on the balance sheet.
44

10. Deferred acquisition costs
2014 $000
2013 $000
Balance at 1 July 17,872 17,044
Acquisition costs incurred in the year 38,028 36,487
Amount expensed to comprehensive operating statement (37,244) (35,659)
Balance at 30 June 18,656 17,872
Deferred acquisition costs represent premium collections fees.
11. Other assets
2014 $000
2013 $000
Current
Prepayments and others 1,921 2,636
GST receivable 1,331 -
Total Current 3,252 2,636
12. Controlled entity
2014 $000
2013 $000
Non current
Controlled entity 16,000 11,000
Balance at 30 June 16,000 11,000
Residential Independence Pty Ltd (RIPL) as trustee for the Residential Independence Trust (RIT) is a controlled entity of the TAC which is wholly owned by the TAC. The RIT was established on 1 February 2011. The RIPL was incorporated in Victoria, Australia on 21 December 2010 and its principal activity is to establish a portfolio of residential property configured so that the accommodation is suitable for the TAC’s seriously injured clients. The financial statements of RIPL have not been consolidated in the preparation of the financial report of the TAC as the financial impact of consolidation is considered not material. The valuation included in the financial statements is the cost of the units held as at 30 June 2014 by the TAC.
45

13. Plant and equipment
2014 $000
2013 $000
Leasehold improvements 11,552 11,552
Accumulated depreciation (2,976) (2,399)
8,576 9,153
Plant and equipment 9,226 9,033
Accumulated depreciation (4,315) (3,332)
4,911 5,701
Motor vehicles under lease 2,434 2,878
Accumulated depreciation (641) (905)
1,793 1,973
Balance at fair value at 30 June 15,280 16,827
(a) Reconciliation of carrying amount
Movements in carrying amounts
Leasehold improvements
$000
Plant & equipment
$000
Motor vehicles
$000Total $000
Balance at 1 July 2012 9,150 6,312 2,233 17,695
Additions 555 990 1,134 2,679
Disposals - - (690) (690)
Impairment loss - (417) - (417)
Depreciation expense (552) (1,184) (704) (2,440)
Balance at 30 June 2013 9,153 5,701 1,973 16,827
Additions - 464 1,346 1,810
Disposals - - (885) (885)
Impairment loss - - - -
Depreciation expense (577) (1,254) (641) (2,472)
Balance at 30 June 2014 8,576 4,911 1,793 15,280
(b) Measurement of fair value
(i) Fair value hierarchy
Leasehold improvements and plant and equipment are held at fair value using the depreciated replacement cost method. The inputs used in the valuation include cost of assets, accumulated depreciation and impairment in value in accordance with Note 1(l).
On average the useful life is 20 years for leasehold improvements and 3 - 7 years for plant and equipment with the majority of the assets located in Geelong. The assets are in optimum working condition.
There were no changes in valuation techniques during the year.
46

Fair value measurement at end of the reporting period using
30 June 2014Level 1
$000Level 2
$000Level 3
$000Total $000
Leasehold improvements - - 8,576 8,576
Plant and equipment - - 4,911 4,911
Total at fair value - - 13,487 13,487
The significant unobservable input to Level 3 valuations is the useful life of the leasehold improvements and plant and equipment. A significant increase or decrease in the estimated useful life of the asset would result in a significantly higher or lower valuation.
(ii) Level 3 fair values
The following table shows the reconciliation from the opening balances to the closing balances for Level 3 fair values.
Total Level 3
$000
Balance at beginning of the year 14,854
Profit recognised in the comprehensive income statement
Depreciation (1,831)
Purchases 464
Closing Balance 13,487
Unrealised gains/(losses) for assets held at the end of the period -
14. Intangibles
2014 $000
2013 $000
Computer software
At cost 122,231 116,176
Less: Accumulated amortisation (65,083) (54,704)
Balance at 30 June 57,148 61,472
Movements in carrying amounts
Balance at 1 July 61,472 48,740
Additions 9,489 22,958
Write down of intangibles (701) -
Current year amortisation (13,112) (10,226)
Balance at 30 June 57,148 61,472
47

15. Payables
2014 $000
2013 $000
Current
Advance premiums 1 27,404 27,782
GST Payable - 1,087
Other creditors and accruals 2 56,495 55,451
Total Current 83,899 84,320
1 Advance premiums represent premiums received for policies commencing after balance date.
2 Accruals and creditors represent liabilities for goods and services provided to the TAC, prior to the end of the financial year, which are unpaid. Amounts are normally settled within 30 days and are carried at nominal value which approximates fair value. The TAC has processes in place to ensure that all payables are paid within the credit timeframe.
16. Outstanding claims
(a) Outstanding claims liability
Outstanding claims liability as at 30 June 2014 has been determined by the Directors after appropriate consideration of the actuarial advice provided by an independent actuarial firm, PricewaterhouseCoopers Actuarial Pty Ltd.
2014 $000
2013 $000
Expected future claims payments (undiscounted) 26,584,023 23,164,787
Discount to present value (17,488,355) (14,804,549)
9,095,668 8,360,238
Claims handling expenses 811,196 799,332
9,906,864 9,159,570
Risk margin 941,540 870,768
Outstanding claims liability 10,848,404 10,030,338
Current 1,079,820 1,063,550
Non-current 9,768,584 8,966,788
Outstanding claims liability 10,848,404 10,030,338
(b) Risk margin
The TAC has added a risk margin to the central (best) estimate of the discounted future claims payments to provide for a higher degree of certainty that the liability for outstanding claims, at balance date, will be adequate to cover possible adverse developments.
The overall risk margin was determined allowing for the relative uncertainty of the outstanding claims estimate. Uncertainty was analysed for each benefit type taking into account potential uncertainties relating to the actuarial models and assumptions, the quality of the underlying data used in the models, the insurance environment, and the impact of legislative reform.
The assumptions regarding uncertainty were applied to the central estimates in order to arrive at an overall provision that allows for a 75% probability of sufficiency in meeting the actual amount of liability to which it relates. The calculation of this risk margin is reviewed by the Scheme’s external actuaries from time to time and was recalculated during the 2013-14 year. As a result of this updated analysis, the risk margin applied at balance date was 10.0% (2013: 10.0%).
48
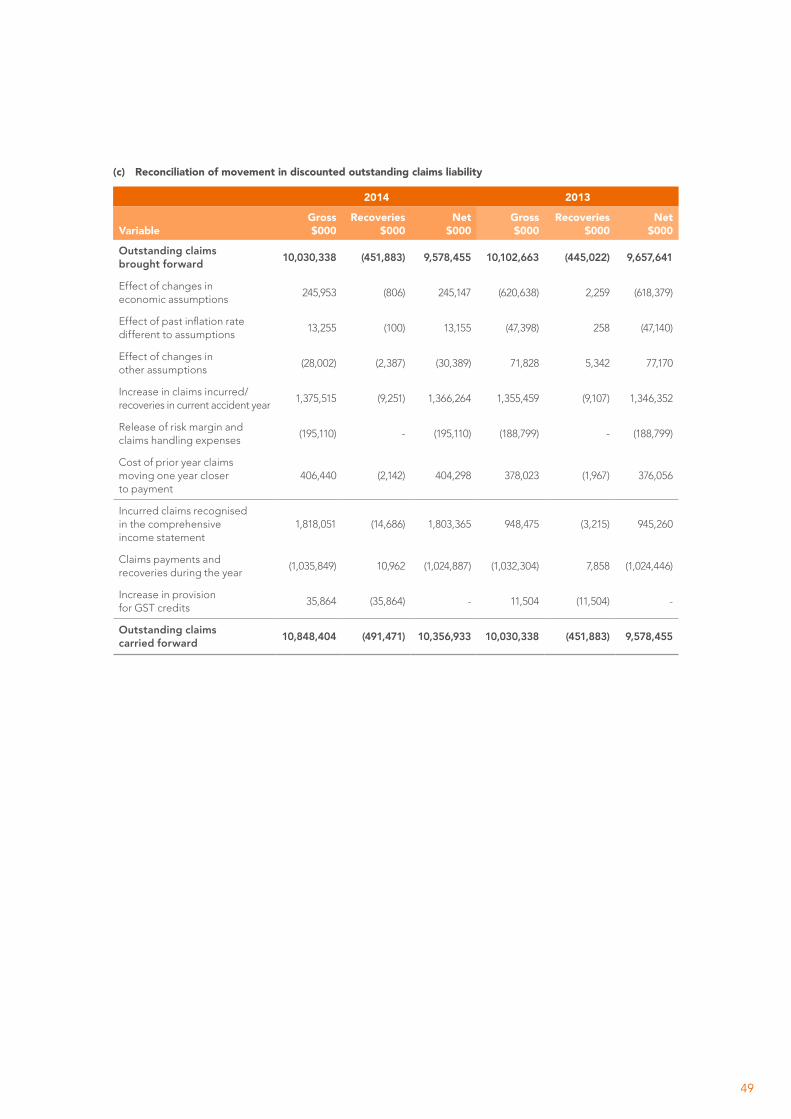
(c) Reconciliation of movement in discounted outstanding claims liability
2014 2013
VariableGross $000
Recoveries $000
Net $000
Gross $000
Recoveries $000
Net $000
Outstanding claims brought forward 10,030,338 (451,883) 9,578,455 10,102,663 (445,022) 9,657,641
Effect of changes in economic assumptions
245,953 (806) 245,147 (620,638) 2,259 (618,379)
Effect of past inflation rate different to assumptions
13,255 (100) 13,155 (47,398) 258 (47,140)
Effect of changes in other assumptions
(28,002) (2,387) (30,389) 71,828 5,342 77,170
Increase in claims incurred/recoveries in current accident year
1,375,515 (9,251) 1,366,264 1,355,459 (9,107) 1,346,352
Release of risk margin and claims handling expenses
(195,110) - (195,110) (188,799) - (188,799)
Cost of prior year claims moving one year closer to payment
406,440 (2,142) 404,298 378,023 (1,967) 376,056
Incurred claims recognised in the comprehensive income statement
1,818,051 (14,686) 1,803,365 948,475 (3,215) 945,260
Claims payments and recoveries during the year
(1,035,849) 10,962 (1,024,887) (1,032,304) 7,858 (1,024,446)
Increase in provision for GST credits
35,864 (35,864) - 11,504 (11,504) -
Outstanding claims carried forward 10,848,404 (491,471) 10,356,933 10,030,338 (451,883) 9,578,455
49

(d) Claims development table
The table shows the development of undiscounted outstanding claims relative to the ultimate expected claims for the ten most recent accident years.
Accident year
2005 $000
2006 $000
2007 $000
2008 $000
2009 $000
2010 $000
2011 $000
2012 $000
2013 $000
2014 $000
Total $000
Estimate of ultimate claims costs:
At end of accident year
1,330,042 1,715,906 1,924,878 2,103,279 1,902,683 1,868,977 2,095,677 2,190,740 2,375,635 2,770,542
One year later 1,605,442 1,674,284 1,896,843 1,818,182 1,870,243 1,822,545 2,122,859 2,089,306 2,643,268
Two years later 1,558,131 1,436,193 1,964,435 1,787,095 1,980,985 2,048,727 2,179,206 1,973,791
Three years later 1,499,894 1,417,902 1,925,678 1,789,816 2,091,361 1,972,760 2,280,844
Four years later 1,419,173 1,335,871 1,925,684 1,761,781 1,917,496 2,196,216
Five years later 1,359,116 1,361,137 1,820,379 1,821,568 2,106,249
Six years later 1,406,340 1,419,764 1,952,761 1,902,933
Seven years later 1,411,894 1,394,534 2,000,101
Eight years later 1,365,447 1,472,569
Nine years later 1,411,404
Current estimate of cumulative claims costs
1,411,404 1,472,569 2,000,101 1,902,933 2,106,249 2,196,216 2,280,844 1,973,791 2,643,268 2,770,542 20,757,917
Cumulative payments
(576,329) (644,929) (716,788) (668,035) (678,255) (578,624) (524,170) (436,658) (300,485) (166,383) (5,290,656)
Outstanding claims - undiscounted
835,075 827,640 1,283,313 1,234,898 1,427,994 1,617,592 1,756,674 1,537,133 2,342,783 2,604,159 15,467,261
Discount (9,995,102)
2004 and prior claims
4,073,578
Claims handling expenses
811,196
Recoveries and GST credits
491,471
Outstanding claims per balance sheet
10,848,404
50
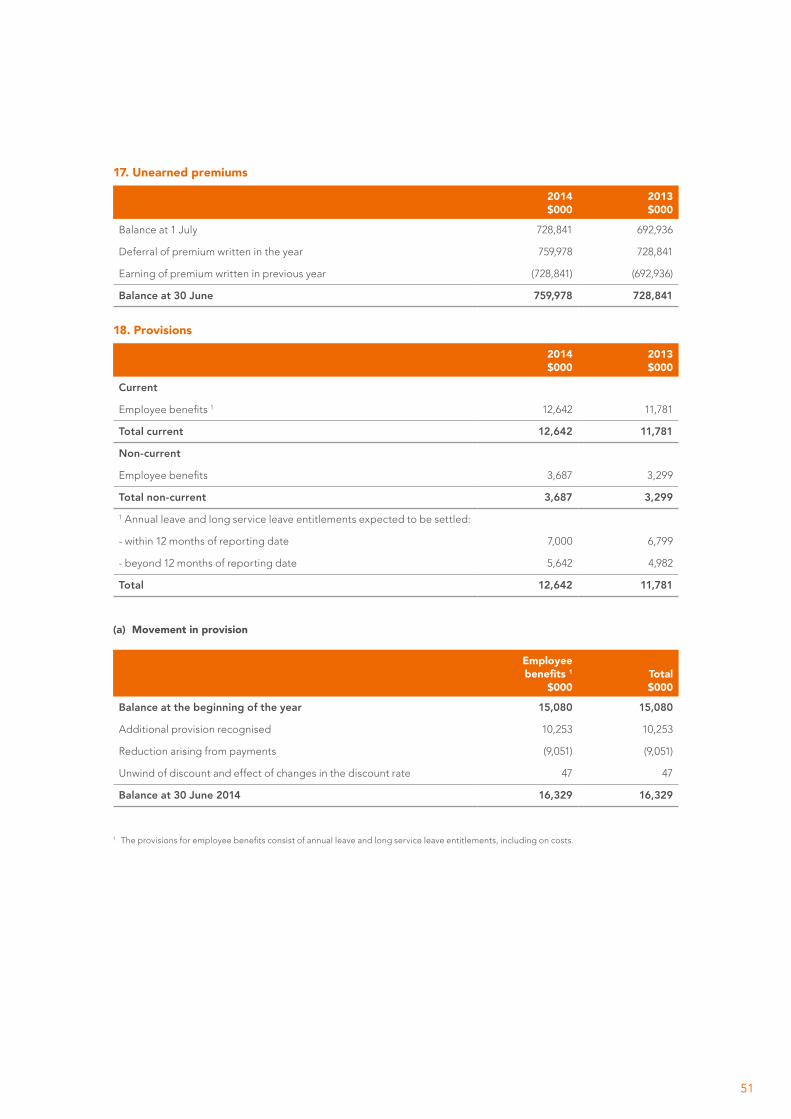
17. Unearned premiums
2014 $000
2013 $000
Balance at 1 July 728,841 692,936
Deferral of premium written in the year 759,978 728,841
Earning of premium written in previous year (728,841) (692,936)
Balance at 30 June 759,978 728,841
18. Provisions
2014 $000
2013 $000
Current
Employee benefits 1 12,642 11,781
Total current 12,642 11,781
Non-current
Employee benefits 3,687 3,299
Total non-current 3,687 3,2991 Annual leave and long service leave entitlements expected to be settled:
- within 12 months of reporting date 7,000 6,799
- beyond 12 months of reporting date 5,642 4,982
Total 12,642 11,781
(a) Movement in provision
Employee benefits 1
$000Total $000
Balance at the beginning of the year 15,080 15,080
Additional provision recognised 10,253 10,253
Reduction arising from payments (9,051) (9,051)
Unwind of discount and effect of changes in the discount rate 47 47
Balance at 30 June 2014 16,329 16,329
1 The provisions for employee benefits consist of annual leave and long service leave entitlements, including on costs.
51
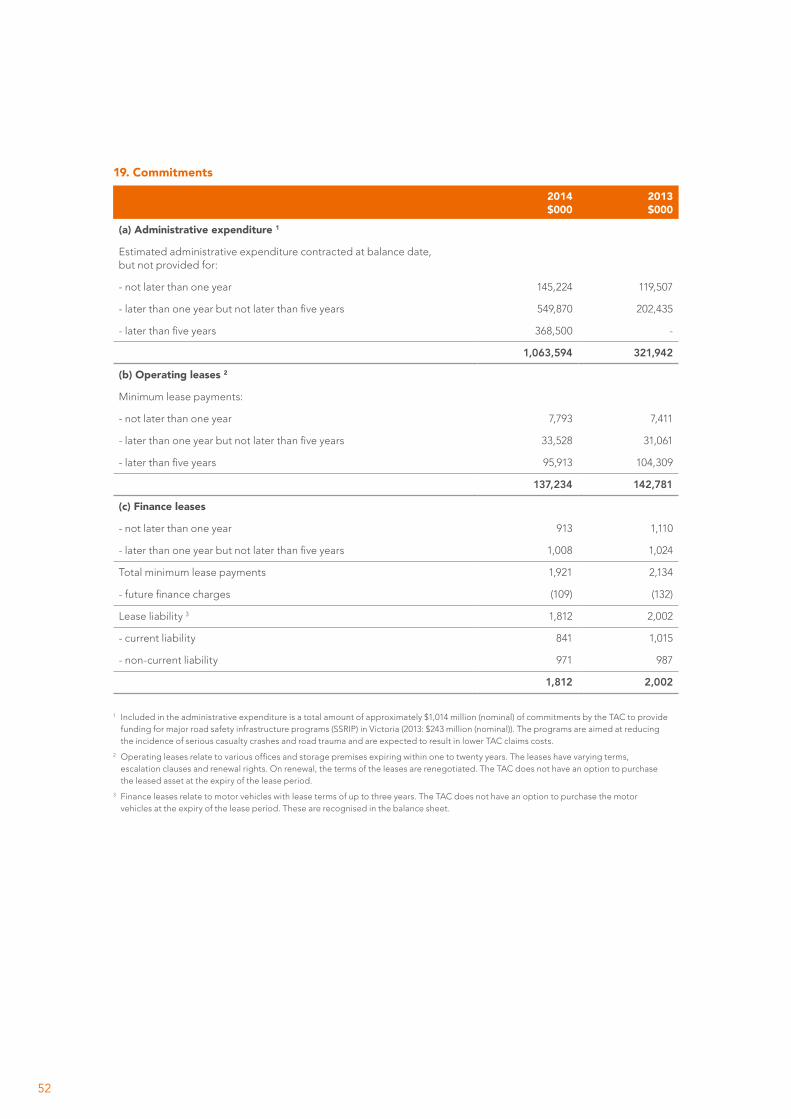
19. Commitments
2014 $000
2013 $000
(a) Administrative expenditure 1
Estimated administrative expenditure contracted at balance date, but not provided for:
- not later than one year 145,224 119,507
- later than one year but not later than five years 549,870 202,435
- later than five years 368,500 -
1,063,594 321,942
(b) Operating leases 2
Minimum lease payments:
- not later than one year 7,793 7,411
- later than one year but not later than five years 33,528 31,061
- later than five years 95,913 104,309
137,234 142,781
(c) Finance leases
- not later than one year 913 1,110
- later than one year but not later than five years 1,008 1,024
Total minimum lease payments 1,921 2,134
- future finance charges (109) (132)
Lease liability 3 1,812 2,002
- current liability 841 1,015
- non-current liability 971 987
1,812 2,002
1 Included in the administrative expenditure is a total amount of approximately $1,014 million (nominal) of commitments by the TAC to provide funding for major road safety infrastructure programs (SSRIP) in Victoria (2013: $243 million (nominal)). The programs are aimed at reducing the incidence of serious casualty crashes and road trauma and are expected to result in lower TAC claims costs.
2 Operating leases relate to various offices and storage premises expiring within one to twenty years. The leases have varying terms, escalation clauses and renewal rights. On renewal, the terms of the leases are renegotiated. The TAC does not have an option to purchase the leased asset at the expiry of the lease period.
3 Finance leases relate to motor vehicles with lease terms of up to three years. The TAC does not have an option to purchase the motor vehicles at the expiry of the lease period. These are recognised in the balance sheet.
52

20. Employee superannuation Superannuation is provided for employees via the following superannuation funds:
2014 $000
2013 $000
Emergency Services Superannuation Scheme - Revised and New Scheme 1
363 576
Victorian Superannuation Fund - VicSuper Scheme 4,766 4,858
Private sector complying funds 2,250 2,513
Total 7,379 7,947
1 These schemes are defined benefit superannuation plans.
The TAC does not recognise any defined benefit liability in respect of the Revised and New Scheme under the Emergency Services Superannuation Scheme, as the TAC has no legal or constructive obligation to pay future benefits relating to its employees. The TAC’s only obligation is to pay superannuation contributions as they fall due. The Department of Treasury and Finance administers and discloses the State’s defined benefit liabilities in its financial report.
The basis of superannuation contributions is based on the relevant rules of each plan. At 30 June 2014, contributions outstanding were $nil (2013: $nil).
Employees have the option of contributing exclusively to private sector complying funds or contributing to the Victorian Superannuation Fund or both.
21. Responsible person related disclosuresIn accordance with the Ministerial Directions issued by the Minister for Finance under the Financial Management Act 1994, the responsible persons who held office during the financial year was The Honourable Gordon Rich-Phillips MLC, Assistant Treasurer from 2 December 2010 and the following responsible persons:
Directors:
Mr Paul Barker (Chairman, term ended 31 August 2013)
Mr John Walter (appointed 9 October 2013, appointed Chairman 1 March 2014)
Mr Andrew Dyer (appointed acting Chairman from 1 September 2013 to 28 February 2014)
Mr David Krasnostein
Mr Rob Nethercote (appointed 9 October 2013)
Ms Sonia Petering
Ms Deborah Hallmark
Ms Helen Silver (resigned 12 July 2013)
Chief Executive Officer:
Ms Janet Dore
53

(a) Remuneration of responsible persons
2014 $000
2013 $000
Total remuneration received or receivable by responsible persons 1 820 834
The number of responsible persons of the TAC whose remuneration falls within the following bands were:
Income Band 2014 2013
$10,000 - $19,999 - 1
$20,000 - $29,999 1 -
$30,000 - $39,999 1 2
$40,000 - $49,999 - 1
$50,000 - $59,999 3 3
$60,000 - $69,999 1 -
$80,000 - $89,999 1 -
$110,000 - $119,999 - 1
$430,000 - $439,999 - 1
$460,000 - $469,999 1 -
1 Amounts relating to ministers are reported in the financial statements of the Department of Premier and Cabinet.
(b) Related party transactions
Mr David Krasnostein and Mr John Walter were directors of the Victorian WorkCover Authority (VWA), which is entitled to recover from the TAC under the Accident Compensation Act 1985, all compensation payable under the WorkCover scheme for injury in a transport accident during the course of work. The TAC also makes payments for the annual Workplace Injury Insurance premium to VWA.
The TAC and VWA reimbursed each other for the cost of external services acquired jointly, and internal services provided to each other, in relation to collaborative initiatives between VWA and the TAC. In addition, the TAC received payments from VWA for the management of VWA claims of injured workers with catastrophic injuries.
The aggregate amounts in respect of the above transactions with responsible person-related entity were:
2014 $000
2013 $000
Claim compensation paid (73,700) (69,600)
Annual Workplace Injury Insurance premium paid (554) (419)
Cost reimbursement receivable 6,097 6,043
Cost reimbursement payable (11,796) (8,650)
Management of catastrophic claims received 1,528 1,279
Transactions with responsible person-related entities are made on normal commercial terms and conditions. Conflicts of interest are overcome where warranted, by Directors declaring their interests and abstaining from voting at the TAC’s Board meetings.
(c) Other transactions
Other related transactions requiring disclosure under the Directions of the Minister for Finance have been considered and there are no matters to report.
54

22. Remuneration of executive officers and payments to other personnel
(a) Remuneration of executives
The remuneration of executive officers, being operational key management personnel of the TAC, is set out below.
2014 $000
2013 $000
Short-term employee benefits 1,392 1,477
Post-employment benefits 89 91
Other long-term employee benefits - 34
Termination benefits - 46
Total 1,481 1,648
The number of executive officers of the TAC, excluding the Chief Executive Officer is shown in the table below. Base remuneration is exclusive of bonus, long service leave and redundancy payments.
The executive numbers vary from year to year due to the timing of appointments, resignations, and the composition of the executive officers.
Base remuneration Total remuneration
Income band2014
No.2013
No.2014
No.2013
No.
less than $100,000 4 2 4 2
$160,000 - $169,999 - 1 - -
$170,000 - $179,999 - 1 - -
$180,000 - $189,999 1 - 1 -
$200,000 - $209,999 1 - - 1
$220,000 - $229,999 - - 1 -
$230,000 - $239,999 - 1 - -
$240,000 - $249,999 - 2 - -
$250,000 - $259,999 1 - - 4
$260,000 - $269,999 - 1 - -
$270,000 - $279,999 - - 1 -
$280,000 - $289,999 2 - - 1
$290,000 - $299,999 - - 2 -
Total number 9 8 9 8
Total annualised employee equivalent 1 6.5 6.5 6.5 6.5
Total amount ($000) 1,390 1,437 1,481 1,648
1 Annualised employee equivalent is based on working 38 ordinary hours per week over the reporting period
2 Executives within the collaborative initiatives of TAC and Victorian WorkCover Authority are shared between the two organisations. TAC’s share of executives employed by Victorian WorkCover Authority in the collaborative initiatives is included within Note 22(b) payments to other personnel.
55
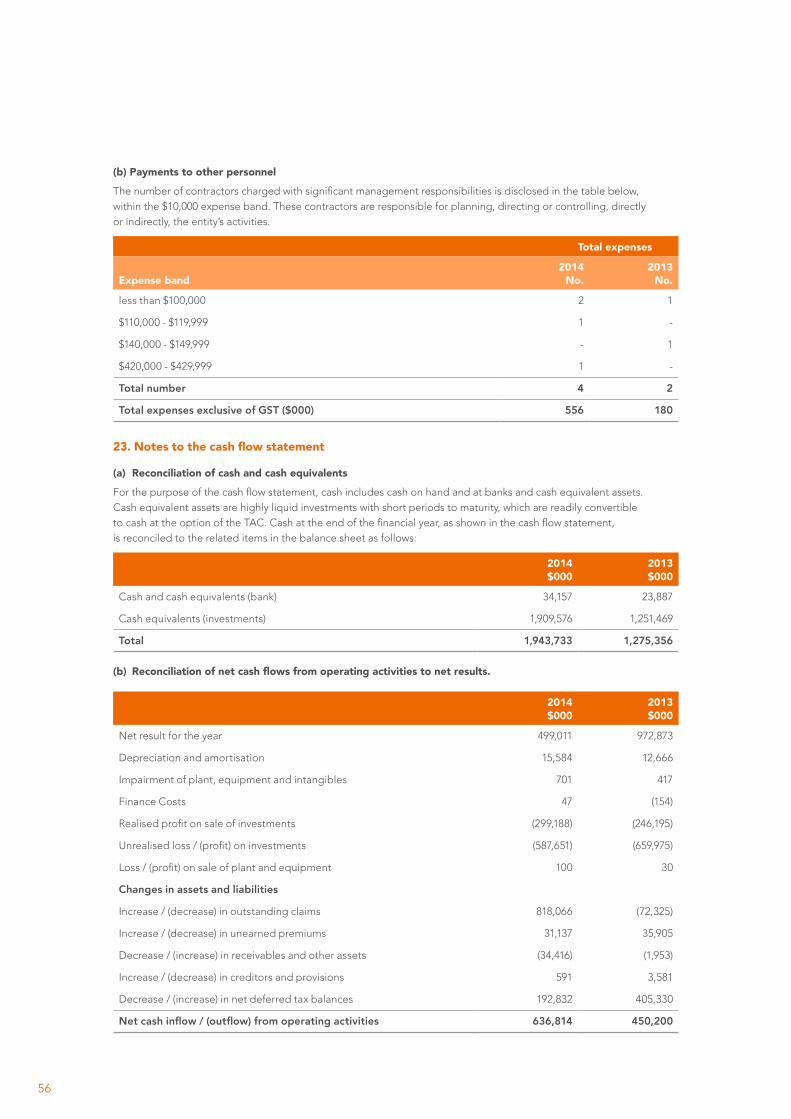
(b) Payments to other personnel
The number of contractors charged with significant management responsibilities is disclosed in the table below, within the $10,000 expense band. These contractors are responsible for planning, directing or controlling, directly or indirectly, the entity’s activities.
Total expenses
Expense band2014
No.2013
No.
less than $100,000 2 1
$110,000 - $119,999 1 -
$140,000 - $149,999 - 1
$420,000 - $429,999 1 -
Total number 4 2
Total expenses exclusive of GST ($000) 556 180
23. Notes to the cash flow statement
(a) Reconciliation of cash and cash equivalents
For the purpose of the cash flow statement, cash includes cash on hand and at banks and cash equivalent assets. Cash equivalent assets are highly liquid investments with short periods to maturity, which are readily convertible to cash at the option of the TAC. Cash at the end of the financial year, as shown in the cash flow statement, is reconciled to the related items in the balance sheet as follows:
2014 $000
2013 $000
Cash and cash equivalents (bank) 34,157 23,887
Cash equivalents (investments) 1,909,576 1,251,469
Total 1,943,733 1,275,356
(b) Reconciliation of net cash flows from operating activities to net results.
2014 $000
2013 $000
Net result for the year 499,011 972,873
Depreciation and amortisation 15,584 12,666
Impairment of plant, equipment and intangibles 701 417
Finance Costs 47 (154)
Realised profit on sale of investments (299,188) (246,195)
Unrealised loss / (profit) on investments (587,651) (659,975)
Loss / (profit) on sale of plant and equipment 100 30
Changes in assets and liabilities
Increase / (decrease) in outstanding claims 818,066 (72,325)
Increase / (decrease) in unearned premiums 31,137 35,905
Decrease / (increase) in receivables and other assets (34,416) (1,953)
Increase / (decrease) in creditors and provisions 591 3,581
Decrease / (increase) in net deferred tax balances 192,832 405,330
Net cash inflow / (outflow) from operating activities 636,814 450,200
56

24. Financial instrumentsThe TAC’s financial assets and liabilities are exposed to a variety of financial risks: market risk, credit risk and liquidity risk. VFMC uses different methods to measure different types of risk to which the TAC’s investment portfolio is exposed. These methods include sensitivity analysis in the case of interest rate, foreign exchange and other price risks, and credit rating for credit risk.
Market risk
Market risk is the risk that the fair value of future cash flows of a financial instrument will fluctuate because of changes in market prices. Market risk comprises three types of risk: market interest rates (interest rate risk), foreign exchange (currency risk), and market prices (price risk).
VFMC manages market risk by seeking input from the TAC’s actuaries to ensure the investment mix is appropriate to service future liabilities and that projected outcomes are in line with the TAC’s overall investment objectives and remain within the risk parameters approved by the Treasurer.
For the sensitivity analysis of each type of market risk, the percentage change used for each of the variables has been determined by the TAC as at 30 June 2014 and 30 June 2013, in consultation with VFMC.
(a) Interest rate risk
Interest rate risk is the risk that the fair value or future cash flows of a financial instrument will fluctuate because of changes in market interest rates.
The significant accounting policies (Note 1) describe the policies used to measure and report the assets and liabilities of the TAC. Where the applicable fair value is determined by discounting future cash flows, movements in interest rates will result in a reported unrealised gain or loss in the operating statement.
VFMC manages interest rate risk through an asset allocation strategy for the TAC’s investment portfolio, which acts as an economic hedge against the insurance liabilities of the TAC. To the extent that these assets and liabilities can be matched, unrealised gains and losses on re-measurement of liabilities resulting from interest rate movements will be offset by unrealised losses or gains on re-measurement of investment assets.
VFMC uses derivatives to manage the interest rate risk on interest rate sensitive assets. Interest rate swap contracts and forward rate agreements are used to either change the interest rate risk between fixed and floating rates of interest or between different floating rates of interest.
A summary of the TAC’s exposure to interest rate risk and maturity analysis is as follows:
Fixed maturity dates
2014
Variable interest
rate $000
3 months or less
$000
4 to 12 months
$000
1 to 5 years $000
Over 5 years $000
Non interest bearing
$000
Total value $000
Financial assets
Cash and cash equivalents
34,157 - - - - - 34,157
Investments:
- interest rate swaps 32,643 - - - - - 32,643
- other investments 1,598,898 1,623,555 89,601 317,493 306,464 6,392,240 10,328,251
Other assets - - - - - 1,873 1,873
1,665,698 1,623,555 89,601 317,493 306,464 6,394,113 10,396,924
Financial liabilities Payables - - - - - 56,495 56,495
Other liabilities - 210 631 971 - - 1,812
- 210 631 971 - 56,495 58,307
Net financial assets 1,665,698 1,623,345 88,970 316,522 306,464 6,337,618 10,338,617
57

Fixed maturity dates
2013
Variable interest
rate $000
3 months or less
$000
4 to 12 months
$000
1 to 5 years $000
Over 5 years $000
Non interest bearing
$000
Total value $000
Financial assets
Cash and cash equivalents
23,887 - - - - - 23,887
Investments:
- interest rate swaps 2,235 - - - - - 2,235
- other investments 1,346,501 1,135,010 10,959 374,320 252,615 5,748,446 8,867,851
Other assets - - - - - 4,765 4,765
1,372,623 1,135,010 10,959 374,320 252,615 5,753,211 8,898,738
Financial liabilities Payables - - - - - 55,451 55,451
Other liabilities - 254 761 987 - - 2,002
- 254 761 987 - 55,451 57,453
Net financial assets 1,372,623 1,134,756 10,198 373,333 252,615 5,697,760 8,841,285
Reconciliation of net financial assets to net assets
2014 $000
2013 $000
Net financial assets as above 10,338,617 8,841,285
Non-financial assets and liabilities:
- Other Receivable 505,954 462,985
- Deferred acquisition costs 18,656 17,872
- Other assets 3,252 2,636
- Controlled Entity 16,000 11,000
- Plant and equipment 15,280 16,827
- Intangibles 57,148 61,472
- Deferred tax assets 589,195 782,027
- Outstanding claims (10,848,404) (10,030,338)
- Unearned premiums (759,978) (728,841)
- Other Payables (27,404) (28,869)
- Provisions (16,329) (15,080)
Net assets per balance sheet (108,013) (607,024)
58

Interest rate sensitivity
A sensitivity analysis has been determined based on the exposure to interest rates at the reporting date and the stipulated change taking place at the beginning of the financial year and held constant throughout the reporting period. A 0.5% increase or decrease in interest rates (or discount rates) is used by the TAC’s actuaries to present the sensitivities of the actuarial claims liabilities to management to allow them to monitor interest rate risk on liabilities.
At reporting date, if interest rates had moved 0.5% up or down with all other variables held constant, the TAC’s net profit and equity would move as follows (all other reserves would remain constant):
2014 $000
2013 $000
Impact on profit and equity of a 0.5% increase in interest rates:
- Before impact of interest rate derivatives (50,180) (42,615)
- Impact of interest rate derivatives (574) (7,676)
- After impact of interest rate derivatives (50,754) (50,291)
Impact on profit and equity of a 0.5% decrease in interest rates:
- Before impact of interest rate derivatives 50,211 42,639
- Impact of interest rate derivatives 574 7,680
- After impact of interest rate derivatives 50,785 50,319
(b) Foreign currency risk
Foreign currency risk is the risk that the fair value or future cash flows of a financial instrument will fluctuate because of changes in foreign exchange rates. The TAC is exposed to foreign exchange risk through its investments which are denominated in foreign currency, and anticipated future transactions.
VFMC limits foreign exchange risk through the use of forward currency contracts where it agrees to sell specified amounts of foreign currencies in the future at a predetermined exchange rate. The proportion of foreign exchange risk which is hedged is reviewed regularly to ensure that the net exposure is maintained at a level which is consistent with the overall investment objectives.
The assets in each currency include those assets which are directly held and denominated in each currency. Assets which are held in a Trust are included in the table in the currency denomination of the Trust. Directly held currency hedges are reported in the table and reflect hedging of currency risk according to VFMC’s policy as approved in the Investment Risk Management Plan.
Investment in foreign currency
Forward contract cover
Net exposure
2014 $000
2013 $000
2014 $000
2013 $000
2014 $000
2013 $000
- Australian Dollar 7,822,823 6,815,473 1,948,296 1,691,753 9,771,119 8,507,225
- United States Dollar 1,944,508 1,618,081 (947,043) (755,441) 997,465 862,640
- British Pound 112,811 97,356 (244,767) (307,058) (131,956) (209,702)
- Euro Dollar 234,707 226,371 (354,010) (354,397) (119,303) (128,026)
- Japanese Yen 63,872 62,926 (138,983) (150,885) (75,111) (87,959)
- Other currencies 168,843 149,486 (250,163) (223,578) (81,320) (74,092)
Total investments (note 10) 10,360,894 8,870,086
59

Foreign currency sensitivity
The sensitivity analysis below has been determined based on the exposure to foreign exchange rates at the reporting date and the stipulated change taking place at the beginning of the financial year and held constant throughout the reporting period.
The following table details the TAC’s sensitivity to a 10% increase and decrease in the Australian Dollar against the relevant foreign currencies with all other variables held constant.
The sensitivity analysis includes foreign currency denominated investments items and adjusts their translation at the period end for a 10% change in the value of the Australian dollar relative to foreign currency.
2014 $000
2013 $000
Impact on profit and equity of a 10% increase in foreign exchange rates:
- Before impact of foreign exchange derivatives (165,135) (137,099)
- Impact of foreign exchange derivatives 130,284 113,996
- After impact of foreign exchange derivatives (34,851) (23,103)
Impact on profit or equity of a 10% decrease in foreign exchange rates:
- Before impact of foreign exchange derivatives 201,832 167,566
- Impact of foreign exchange derivatives (159,236) (139,328)
- After impact of foreign exchange derivatives 42,596 28,238
(c) Other price risk
The TAC is exposed to equity price risk arising from equity investments (both within Australian markets and overseas, refer to note 9). Equity investments are held for strategic rather than trading purposes.
VFMC limits price risk through diversification of the equity investment portfolio.
Equity price sensitivity
The sensitivity analysis below has been determined based on the exposure to equity prices both within Australia and overseas markets at the reporting date and the stipulated change taking place at the beginning of the financial year and held constant throughout the reporting period.
The following table details the TAC’s sensitivity to a 10% increase and decrease in listed equities market and a 10% increase and decrease in unlisted equities markets in Australia and overseas.
At reporting date, if listed and unlisted equity prices had been 10% higher or lower and all other variables were held constant, the TAC’s net profit and equity would move as follows:
2014 $000
2013 $000
Impact on profit and equity of a 10% increase in equity prices:
- listed equities 153,404 136,442
- unlisted equities - Australian 238,704 221,177
- unlisted equities - overseas 62,683 48,506
454,791 406,125
Impact on profit and equity of a 10% decrease in equity prices:
- listed equities (153,404) (136,442)
- unlisted equities - Australian (238,704) (221,177)
- unlisted equities - overseas (62,683) (48,506)
(454,791) (406,125)
60
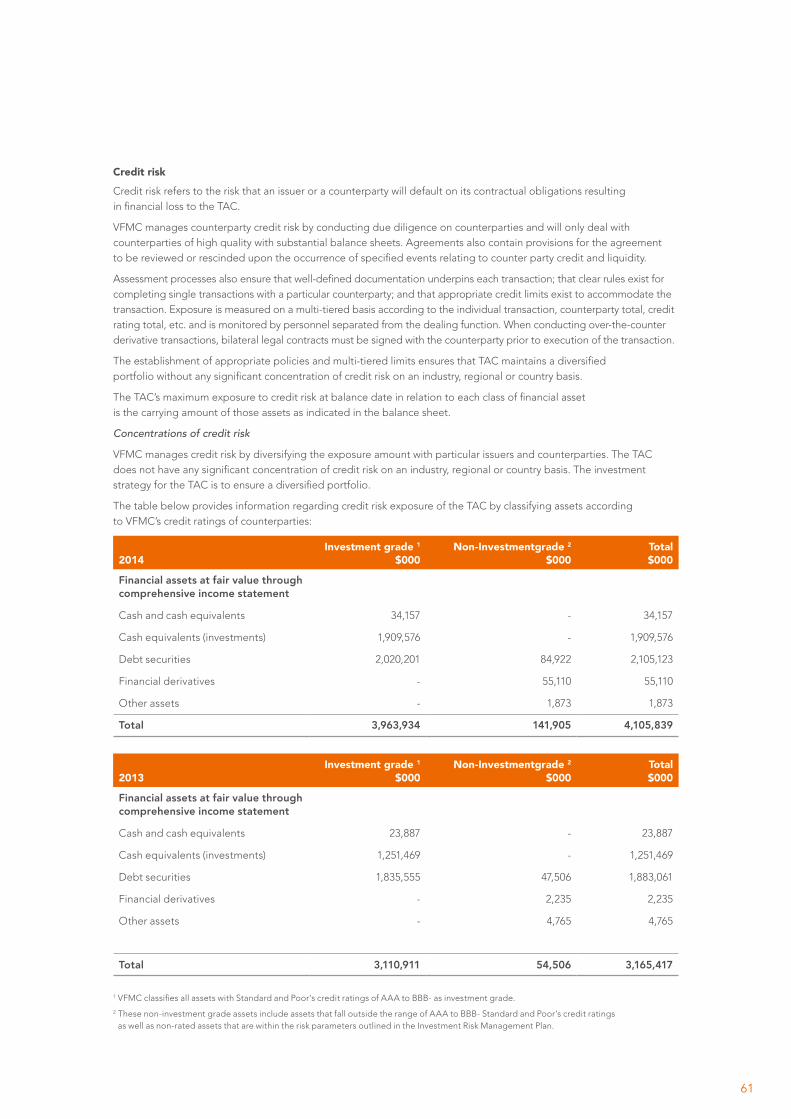
Credit risk
Credit risk refers to the risk that an issuer or a counterparty will default on its contractual obligations resulting in financial loss to the TAC.
VFMC manages counterparty credit risk by conducting due diligence on counterparties and will only deal with counterparties of high quality with substantial balance sheets. Agreements also contain provisions for the agreement to be reviewed or rescinded upon the occurrence of specified events relating to counter party credit and liquidity.
Assessment processes also ensure that well-defined documentation underpins each transaction; that clear rules exist for completing single transactions with a particular counterparty; and that appropriate credit limits exist to accommodate the transaction. Exposure is measured on a multi-tiered basis according to the individual transaction, counterparty total, credit rating total, etc. and is monitored by personnel separated from the dealing function. When conducting over-the-counter derivative transactions, bilateral legal contracts must be signed with the counterparty prior to execution of the transaction.
The establishment of appropriate policies and multi-tiered limits ensures that TAC maintains a diversified portfolio without any significant concentration of credit risk on an industry, regional or country basis.
The TAC’s maximum exposure to credit risk at balance date in relation to each class of financial asset is the carrying amount of those assets as indicated in the balance sheet.
Concentrations of credit risk
VFMC manages credit risk by diversifying the exposure amount with particular issuers and counterparties. The TAC does not have any significant concentration of credit risk on an industry, regional or country basis. The investment strategy for the TAC is to ensure a diversified portfolio.
The table below provides information regarding credit risk exposure of the TAC by classifying assets according to VFMC’s credit ratings of counterparties:
2014Investment grade 1
$000Non-Investmentgrade 2
$000Total $000
Financial assets at fair value through comprehensive income statement
Cash and cash equivalents 34,157 - 34,157
Cash equivalents (investments) 1,909,576 - 1,909,576
Debt securities 2,020,201 84,922 2,105,123
Financial derivatives - 55,110 55,110
Other assets - 1,873 1,873
Total 3,963,934 141,905 4,105,839
2013Investment grade 1
$000Non-Investmentgrade 2
$000Total $000
Financial assets at fair value through comprehensive income statement
Cash and cash equivalents 23,887 - 23,887
Cash equivalents (investments) 1,251,469 - 1,251,469
Debt securities 1,835,555 47,506 1,883,061
Financial derivatives - 2,235 2,235
Other assets - 4,765 4,765
Total 3,110,911 54,506 3,165,417
1 VFMC classifies all assets with Standard and Poor’s credit ratings of AAA to BBB- as investment grade.
2 These non-investment grade assets include assets that fall outside the range of AAA to BBB- Standard and Poor’s credit ratings as well as non-rated assets that are within the risk parameters outlined in the Investment Risk Management Plan.
61

Liquidity risk
Liquidity risk arises from the TAC being unable to meet financial obligations as they fall due.
VFMC manages liquidity risks through holding high quality liquid assets in its total investment portfolio, which are readily convertible to cash assets. The TAC is cash flow positive with premium and investment income exceeding claims and administrative cost payments.
The following table summarises the maturity profile of the TAC’s financial liabilities. The tables have been drawn up based on the undiscounted cash flows of financial liabilities and on the earliest date on which the TAC can be required to pay.
2014
Less than 3 months
$000
4 to 12 months
$000
1 to 5 years $000
5 + years $000
Total $000
Financial liabilities
Other creditors and accruals 56,495 - - - 56,495
Finance lease liabilities 210 631 971 - 1,812
Total 56,705 631 971 - 58,307
2013
Less than 3 months
$000
4 to 12 months
$000
1 to 5 years $000
5 + years $000
Total $000
Financial liabilities
Other creditors and accruals 55,451 - - - 55,451
Finance lease liabilities 254 761 987 - 2,002
Financial derivatives (net settled) 106,254 - - - 106,254
Total 161,959 761 987 - 163,707
The table above includes only the liquidity analysis in relation to contractual (as opposed to statutory) financial liabilities. While the liability for outstanding claims is the most significant liability for which payments will need to be made in the future, these do not meet the definition of a financial liability. The average term to settlement from injury date for claims liabilities is 15.0 years (2013: 13.9 years).
Fair Value
The TAC uses various methods in estimating the fair value of a financial instrument. The fair value of the financial assets and liabilities reflects the amount at which the instrument could be exchanged in an orderly transaction between market participants at the measurement date.
The following tables illustrate the level in the fair value hierarchy in which fair value measurements are categorised for financial assets.
• Level 1 fair value measurements are those derived from quoted prices (unadjusted) in active markets for identical assets or liabilities.
• Level 2 fair value measurements are those derived from inputs other than quoted prices included within Level 1 that are observables for the asset or liability, either directly (i.e. as prices) or indirectly (i.e. derived from prices).
• Level 3 fair value measurements are those derived from valuation techniques that include inputs for the asset or liability that are not based on observable market data (unobservable inputs).
62

Fair value measurement at end of the reporting period using
30 June 2014Level 1
$000Level 2
$000Level 3
$000Total $000
Financial assets
Cash and cash equivalents 34,157 - - 34,157
Investments
Cash investments 590,283 57,809 - 648,092
Australian equities 595,168 671,186 39 1,266,393
International equities 2,159,015 1,526,434 - 3,685,449
Private equity 3,637 2,956 301,749 308,342
Inflation linked bonds 61,161 1,307,352 - 1,368,513
Infrastructure 1,869 34,498 447,986 484,353
Property 4,807 550 585,776 591,133
Diversified fixed income 71,153 1,045,282 - 1,116,435
Insurance - 1,251 166,329 167,580
Non traditional strategies 279,514 123,144 316,459 719,117
Overlays - 5,487 - 5,487
Other assets 1,873 - - 1,873
3,802,637 4,775,949 1,818,338 10,396,924
Financial liabilities
Payables 56,495 - - 56,495
Other liabilities 1,812 - - 1,812
58,307 - - 58,307
Net financial assets 3,744,330 4,775,949 1,818,338 10,338,617
63

Fair value measurement at end of the reporting period using
30 June 2013Level 1
$000Level 2
$000Level 3
$000Total $000
Financial assets
Cash and cash equivalents 23,887 - - 23,887
Investments
Cash investments 321,431 25,277 - 346,708
Australian equities 533,881 593,603 22 1,127,506
International equities 1,788,726 1,283,618 - 3,072,344
Private equity 1,664 (16,729) 325,189 310,124
Inflation linked bonds 105,738 1,179,810 - 1,285,548
Infrastructure 468 (11,434) 440,547 429,581
Property 5,701 (3,583) 620,562 622,680
Diversified fixed income 69,295 958,930 23,542 1,051,767
Insurance - (4,206) 85,111 80,905
Non traditional strategies 168,780 79,431 280,143 528,354
Overlays - 14,569 - 14,569
Other assets 4,765 - - 4,765
3,024,336 4,099,286 1,775,116 8,898,738
Financial liabilities
Payables 55,451 - - 55,451
Other liabilities 2,002 - - 2,002
57,453 - - 57,453
Net financial assets 2,966,883 4,099,286 1,775,116 8,841,285
Transfers between categories
An amount of $0.2 million was transferred from Level 1 to Level 3 during the year ended 30 June 2014 (2013: $nil million) based on TAC’s assessment of the valuation given the security is currently suspended from trade on the Australian Stock Exchange.
An amount of $nil million was transferred from Level 2 to Level 3 during the year ended 30 June 2014 (2013: $1.4 billion).
64

Reconciliation of Level 3 fair value movements
The following table presents the changes in Level 3 instruments (financial assets) for the year ended 30 June 2014.
Total Level 3 $000
Balance at beginning of the year 1,775,116
Loss recognised in the comprehensive income statement (100,274)
Sales (138,394)
Purchases 281,690
Transfer in to Level 3 200
Transfer out of Level 3 -
Closing Balance 1,818,338
Total gains for the period included in profit or loss for assets held at the end of the period 3,952
The investments managed by VFMC on behalf of the TAC include unlisted investments. These unlisted investments are not traded in an active market, and hence their fair value at reporting date is based on the price advised by fund managers or valuations determined by appropriately skilled independent third parties.
Where valuation techniques including discounted cash flows, multiples based analysis, comparison with similar transactions and other techniques considered appropriate in the circumstances have been employed in pricing or valuing investments, the valuations are inherently subject to estimation uncertainty. Given this inherent subjectivity, the underlying inputs and assumptions are reviewed on an ongoing basis to ensure the valuations reflect the best estimates of the economic conditions at reporting date.
The value of such investments is set out in the following table:
Investment Classes2014 $000
2013 $000
Infrastructure 447,986 440,547
Private Equity 301,749 325,189
Property 585,776 620,562
Insurance 166,329 85,111
Diversified Fixed Income - 23,542
Non Traditional Strategies 316,459 280,143
1,818,299 1,775,094
It is reasonably possible that outcomes within the next financial year would be different from the assumptions used in the current valuation models and a material adjustment to the carrying amounts of the related investments could be required.
The disclosures below provide details of the inputs and assumptions used in the current valuation models. Further detailed information has been provided where available. A majority of these investments are held via third party pooled investment vehicles, and as such the TAC is not privy to the detailed assumptions or valuation techniques used to value the underlying investment assets. The TAC is reliant on third parties for these valuations and the quantitative information regarding significant unobservable inputs used in the fair value measurement cannot be assessed.
65

Infrastructure Investments
Infrastructure investments comprise both domestic and international exposures to transport, social, energy and other infrastructure assets through unlisted pooled vehicles and unlisted trusts.
The valuations of unlisted infrastructure investments are primarily based on a discounted cash flow methodology. Key inputs which are subject to estimation uncertainty include the choice of risk free discount rate in the main ranging between 8.0% – 15.0% (2013: 8.8% – 11.3%), risk premium, asset utilisation rates (for example this includes airline passenger volumes and mix at a foreign airport, and also includes assuming the renewal of existing gas transmission contracts upon their expiry at forecast volumes and pricing for another investment), capital expenditure forecasts, operating costs and other estimated future cash flows dependent on the longer term general economic forecasts and the forecast performance of applicable underlying assets (including, for example, gearing forecasts, expected foreign tax rates, long term retail price index, counter party risks and group tax relief).
An increase in the choice of risk free discount rate would decrease the value of the infrastructure investments. Reductions would result in an increase to the fair value.
Private Equity Investments
Private Equity Investments comprise both domestic and international exposures to venture capital, buyout, special situations and expansion capital sectors. The investments include externally managed unlisted pooled vehicles and trusts.
The valuations of unlisted private equity investments are primarily based on multiples of earnings, discounted cash flow, market equivalents and other market accepted methodologies. Assumptions which may be subject to estimation uncertainty would include the identification of appropriate comparables, estimated future profits, risk free rate, risk premium, estimated future cash flows and future economic and regulatory conditions.
Property Investments
Property investments comprise externally managed unlisted property trusts with exposure to domestic and international commercial, industrial, retail and development property market.
The valuations of unlisted property investments are primarily based on discounted cash flow, capitalisation and direct comparison methodologies. Assumptions which may be subject to estimation uncertainty would include the identification of appropriate comparables, estimated future profits, risk free rate, risk premium, estimated future cash flows and future economic and regulatory conditions.
Insurance Investments
The valuation of insurance investments is primarily based on a discounted cash flow methodology. The portfolio of US life insurance policies is valued by an independent valuer using the actuarial asset share method. The actuarial asset share method is based on the assumptions of probabilities of insured’s mortality and premium payments on the valuation date. Other assumptions and interdependencies in the valuation model include weighted average discount rate applied to the portfolio of 16.4% (2013: 16.4%), life expectancy estimates obtained from qualified providers and expected premium payments based on “back solving” premiums’ optimisation method.
An increase in the weighted average discount rate would decrease the value of the insurance investments. Reductions would result in an increase to the fair value.
An increase in the life expectancy estimates would decrease the value of the insurance investments. Reductions would result in an increase to the fair value.
66

Diversified Fixed Income Investments
Diversified fixed income investments comprise of investments in government, government-related, corporate and securitised bonds, loans and other debt instruments, primarily from Australian issuers but with some limited exposure to international issuers, and fixed interest and currency instruments through externally managed unlisted pooled vehicles and segregated portfolios.
The valuation of diversified fixed income investments are primarily provided by third party pricing servicers, which source prices from brokers and market makers. For less liquid securities, valuations are based on valuation methodologies determined to be appropriate by the manager or their independent valuation agent. Such methodologies applied may include discounted cash flow, amortised cost, direct comparison and others.
Assumptions which may be subject to estimation uncertainty would include appropriate credit spread and other risk premium, future risk free rate, future cash flows, identification of appropriate comparables, future economic and regulatory conditions.
Non Traditional Strategies Investments
The non traditional strategies investments comprise investments in hedge funds and other non traditional investments that do not fit within the definition of other asset classes but which provide diversification benefits to the total portfolio. Investments are made through externally managed unlisted pool vehicles.
The valuation of non traditional strategies investments are primarily based on prices quoted on an exchange or traded in a dealer market. For less liquid securities, valuation methodologies are set out by each manager. Depending on the investment, the methodologies applied include discounted cash flow, amortised cost, direct comparison and other market accepted methodologies. The investment manager may choose to appoint independent valuation agents to seek independent price verification.
Assumptions which may be subject to estimation uncertainty would include appropriate credit spread and other risk premium, future risk free rate, future cash flows, identification of appropriate comparables, future economic and regulatory conditions.
Capital management strategy
Capital maintained by the TAC is an integral part of managing the uncertainties impacting on the value of outstanding claims liabilities and returns from its investment portfolio. Consistent with the outcome of the State Government review, the TAC has adopted a target funding level of 100%, being the midpoint of a target funding level range of 80-120%. It is expected that from time to time the TAC’s actual funding ratio will be outside that target funding range. In such circumstances, corrective action may be recommended to transition the actual funding range to the target funding level over time.
The TAC will seek to continually aim towards the target funding ratio of 100% over rolling five-year periods. Where funding ratio exceeded 120%, ‘special’ dividends may be payable in addition to the ordinary dividend, or other options such as increasing benefits or reducing premiums may be considered.
The TAC’s funding ratio is calculated as “net assets less deferred tax asset and intangible assets divided by net outstanding claims liability”. The funding ratio is also adjusted for an allowance for dividend at the benchmark rate to ensure the reported funding ratio is not misleading.
67

Statement by Chairman, Chief Executive Officer and Chief Finance and Accounting Officer
We certify that the financial report of the Transport Accident Commission has been prepared in accordance with Standing Direction 4.2 of the Financial Management Act 1994, applicable Financial Reporting Directions, Australian Accounting Standards and other mandatory professional reporting requirements.
We further state that, in our opinion, the information set out in the comprehensive income statement, balance sheet, statement of changes in equity, cash flow statement and notes to and forming part of the financial statements, present fairly the financial transactions for the year ended 30 June 2014 and the financial position of the Transport Accident Commission as at that date.
We are not aware of any circumstances which would render any particulars included in the financial report misleading or inaccurate.
Dated at Geelong this 28th day of August 2014.
Janet Dore Chief Executive Officer
John Walter Chair
Tony Dudley Chief Finance and Accounting Officer
68


CORPORATEGOVERNANCE
This statement covers the main corporate governance practices that ensure the TAC is managed to achieve its mission, meet commitments to stakeholders and operate commercially.
Board of Management
The Chairman and the Board are nominated by the Minister and appointed by the Governor in Council. There are presently five non-executive directors, including the Chairman.
The Board has established clearly defined accountabilities and delegations for the Chief Executive Officer. Policies and procedures cover all aspects of the TAC’s activities and are reviewed regularly to ensure the TAC achieves its objectives regarding:
• Compliance with applicable laws and regulations
• Reliability of financial reporting
• Safeguarding of assets
• Effectiveness and efficiency of operations.
Directors’ access to independent professional advice
Directors are entitled to seek independent professional advice in connection with their duties at the TAC’s expense, unless determined otherwise by the Board.
Conflict of Interest
If a Director has a direct or indirect pecuniary interest in a matter being considered by the Board, the Director must disclose the nature of the interest. Unless otherwise determined by the Minister or the Board, the Director must not be present during any deliberation of the Board in relation to the matter and must not take part in any decision of the Board.
Board Committees
TAC Committees
Audit and Risk Management Committee
Members at 30 June 2014: John Walter, Andrew Dyer, Pauk Kirk and David Krasnostein (Chair), all of whom are independent persons for the purpose of the Standing Directions of the Minister for Finance under the Financial Management Act 1994.
Role:
• Oversee an appropriate risk management framework and consider the effectiveness of the TAC’s risk management and internal controls;
• Provide oversight for the issues that potentially impact the TAC’s financial reporting process of proposed regulatory, accounting or reporting initiatives;
• Consider the reliability, integrity and completeness of financial information and the financial reporting practices of the TAC presented by management;
• Monitor compliance with relevant laws, regulations and government directives and that accounting policies are in line with the Financial Management Act 1994, government guidelines and current Australian Accounting Standards;
• Monitor compliance with the TAC’s internal investment policies and procedures, the contractual arrangements with the VFMC and requirements of the Prudential Statement;
• Advise the Financial and Investment Strategies Committee of any matter or internal control weakness that impacts the committee’s area of responsibility;
• Review and recommend to the Board approval of the annual plan submitted by internal audit;
• Monitor that the objectivity and independence of internal and external audit is preserved by monitoring employment relationships, financial relationships and the provision of non-audit services and other assessments as deemed necessary;
• Review management responses to internal and external audit reports, actions to correct any noted deficiencies and monitor progress to correct deficiencies;
• Evaluate the overall effectiveness of internal and external audit and recommend appointment and fees for the internal auditors to the Board;
• Implement the TAC’s annual internal audit plan and deal with issues raised by the TAC’s auditors (internal and external);
• Initiate and supervise, where appropriate, special reviews;
• Review and monitor the policies (including whistle blowers and protected disclosure) for preventing and detecting fraud; and
• Annually recommend to the Board an attestation to government that the TAC complies with the Victorian Government Risk Management Framework.
72
Board Workshop Advisory Committee
Members at 30 June 2014: John Walter, David Krasnostein, Deb Hallmark, Sonia Petering, Rob Nethercote and Andrew Dyer
Role:
• This forum provides Board members with the opportunity to interact and engage with the relevant stakeholders and provide background information to assist Directors in the discharge of their responsibilities.
Joint TAC and Victorian WorkCover Authority (VWA) Advisory Committees
Financial and Investment Strategies Committee
Members at 30 June 2014: John Walter, Sonia Petering, Andrew Dyer and David Krasnostein (Chair)
Role:
• Make recommendations at least annually to the Boards on TAC and VWA’s (the agencies) investment objectives in the context of overall balance sheet risk management and consistent with the Risk Preference Statements issued by the Minister;
• Monitor compliance and make recommendations to the Boards regarding balance sheet management, pricing and other policies required under the Prudential Insurance Standard;
• Review the operational performance of the VFMC, including VFMC’s service level agreement, proxy voting and ESG obligations, and monitor compliance with the Prudential Investment Standard
• Monitor the success of the VFMC investment strategy by reviewing fund performances compared to objectives, long-term targets and peer benchmarks; and
• Monitor the ongoing health of the agencies’ balance sheets and the long term financial sustainability of the schemes.
The Financial and Investment Strategies Committee will also advise the Boards in relation to other matters relevant to the management of the agencies balance sheets, investment funds and other financial strategies as appropriate.
Talent Committee
Members as at 30 June 2014: John Walter and Rob Nethercote
Business Information Systems Committee
Members at 30 June 2014: Andrew Dyer (Chair)
Role:
• Request, oversee, receive and review recommendations that relate to any material deployment or change to the business systems application portfolios of TAC and VWA, including recommendations to decommission existing applications. Endorse such recommendations as appropriate for presentation to the Boards of the Participants;
• Ensure the Participants continue to work together to achieve the ITSS Agreement Objectives and application of the Principles;
• Oversee ITSS’s delivery of its ITSS plan in meeting the requirements of TAC and VWA;
• Receive reports and presentations on major advances in information technology that may benefit the TAC and VWA;
• Review the TAC and VWA business systems/ information technology Enterprise Architecture and Roadmap presented by management on a regular basis and ensure it is consistent with the ITSS Agreement Objectives and Core Principles and progresses the retirement of legacy systems, and make relevant recommendations to the Boards of the Participants;
• Make recommendations to the Boards of the Participants as required on the alignment of business systems and IT infrastructure projects to the TAC and VWA Enterprise Architecture and roadmap, including appropriate level of customisation and configuration;
73

Request to, or when requested by the Boards of the Participants, review the progress of any technology focussed project, including achievement of scope, use of Fineos, level of customisation and configuration; and make recommendations to the Boards;
• Provide an escalation and review forum for IT business support services issues, audit action items involving ITSS, ITSS workforce management issues, significant variations to IT Enterprise Architecture and significant non-delivery of the ITSS plan;
• Review critical commercial and performance risks that may cause a significant deviation to the ITSS plan and when necessary make recommendations to the Boards of the Participants;
• Endorse the ITSS annual plan, including a review of projects to ensure that the works program is capturing technology synergies between both TAC and VWA and leveraging existing platforms including Fineos;
• Request to, or when requested by the Boards of the Participants, receive the post implementation review of any technology focussed project and make recommendations to the Boards; and
• Undertake other roles allocated to it under the Agreement or as requested by the Boards of the Participants.
Prudential Standards
The Board is required to submit annual certifications of compliance with the Prudential insurance standards for Victorian Government insurance agencies and the Prudential Standard: VFMC and the Centralised Investment Model. These standards impose obligations regarding liability reserving, capital management, pricing, reinsurance, actuarial review and the setting of appropriate investment objectives for TAC funds.
Certifications have been issued by the Board for the year ending 30 June 2014.
Risk Management
The TAC has in place a risk management framework to ensure effective identification, assessment and management of risks. That framework details the roles of the Board and its committees, management and the internal auditor. The Board is responsible for setting the risk priorities on which the framework is focused. The Audit and Risk Management Committee oversees the framework and is responsible for ensuring the effectiveness of the design and implementation of control strategies and operational practices.
Compliance with the Victorian Government Risk Management Framework
Standing Direction 4.5.5 given by the Minister for Finance pursuant to section 8 of the Financial Management Act 1994 requires public sector agencies to provide an annual attestation of compliance with the risk management process requirements set out in the Victorian Government Risk Management Framework.
The Audit and Risk Management Committee of the Transport Accident Commission has considered the statement by the Chief Executive Officer on compliance with the Victorian Government Risk Management Framework, the internal attestation process undertaken by executive management and independent assessments from the internal auditor.
On that basis, I certify that the Transport Accident Commission has risk management processes in place consistent with the Australian/New Zealand Risk Management Standard (AS/NZS ISO 31000:2009) and an internal control system is in place that enables the executive to understand, manage and satisfactorily control risk exposures. The Board of the Transport Accident Commission verifies this assurance and that the risk profile of the Transport Accident Commission has been critically reviewed within the last 12 months.
Insurance
Standing Direction of the Minister for Finance 4.5.5.1 Insurance requires Public Sector Agencies to evaluate the adequacy of their insurance arrangements. This involves the Transport Accident Commission making a judgement on the amount of risk they can bear and, where they decide to bear that risk, ensuring they are able to meet the financial impacts from existing resources.
I have considered the internal due diligence process and my Chief Financial Officer’s certification of compliance.
On this basis, I certify that the Transport Accident Commission has complied with Ministerial Direction 4.5.5.1 – Insurance.
John Walter/Chair Transport Accident Commission 28 August 2014
74

COMPLIANCE

This section includes the disclosures required by the Financial Management Act 1994 and the Transport Accident Act 1986.
Incorporation and Ministerial Responsibility
The TAC is a body corporate established under section 10 of the Transport Accident Act 1986 (the Act) (No. 111 of 1986, reprint No. 13 dated 1 January 2014). The Act sets out the objectives, functions and powers of the TAC.
The Assistant Treasurer is the Minister administering the Transport Accident Act 1986.
Ministerial Directions
There were no Ministerial Directions given by the Assistant Treasurer in the period 1 July 2013 to 30 June 2014.
The TAC’s Objectives, Functions, Powers and Accountability
Sections 11, 12, 13 and 14 of the Transport Accident Act 1986 set out the objectives, functions, powers and accountability of the TAC.
Objectives of the Commission (section 11)
• To manage the transport accident compensation scheme as effectively, efficiently and economically as possible
• To ensure that appropriate compensation is delivered in the most socially and economically appropriate manner and as expeditiously as possible
• To ensure that the transport accident scheme emphasises accident prevention and effective rehabilitation
• To develop internal management structures and procedures that will enable it to perform its functions and exercise its powers effectively, efficiently and economically
• To manage claims under the Accident Compensation Act 1985 or the Workplace Injury Rehabilitation and Compensation Act 2013 as an authorised agent of the Victorian WorkCover Authority as effectively, efficiently and economically as possible
• If appointed as an agent of a self-insurer under section 143A of the Accident Compensation Act 1985, to carry out the functions and powers of a self-insurer as effectively, efficiently and economically as possible.
Functions of the Commission (section 12)
• To administer the Transport Accident Fund
• To receive and assess, and accept or reject, claims for compensation
• To defend proceedings relating to claims for compensation
• To pay compensation to persons entitled to compensation
• To determine transport accident charges
• To collect and recover transport accident charges
• To provide advice in relation to the transport accident scheme
• To provide funds for the program designed to secure the early and effective medical and vocational rehabilitation of persons injured as a result of transport accidents and for other rehabilitation programs for persons injured in transport accidents
• To collect and assess data and statistics in relation to transport accidents
• To provide advice to the Minister in relation to matters specifically referred to the Commission by the Minister and generally in relation to the administration of this Act and the compensation scheme under this Act
• To commercially exploit knowledge and expertise in compensation schemes and scheme administration
• To act as an authorised agent under section 501 of the Workplace Injury Rehabilitation and Compensation Act 2013
• If appointed, to act as an agent of a self-insurer under section 392(2) of the Workplace Injury Rehabilitation and Compensation Act 2013
• To carry out such other functions conferred on the Commission by this or any other Act
• To promote the prevention of transport accidents and safety in use of transport
• To design and promote, so far as possible, a program designed to secure the early and effective medical and vocational rehabilitation of people injured as a result of transport accidents to whom or on behalf of whom the Commission is or may become liable to make any payment under the Act.
76

Powers of the Commission (section 13)
• To do all things that are necessary or convenient to be done for, or in connection with, the performance of its functions and to enable it to achieve its objectives
• To enter into agreements or arrangements and settle or compromise differences or disputes with other persons
• To apply for, obtain and hold intellectual property rights (including patents, copyrights, trade marks and registered designs)
• To enter into agreements or arrangements for the commercial exploitation within or outside Victoria of intellectual property rights and ancillary services on any terms or conditions as to royalties, lump sum payments or otherwise as the Commission may see fit
• To enter into agreements or arrangements within or outside Victoria for the provision by the Commission of administration, management or information systems or services
• To do all things necessary or convenient to be done in connection with acting as an authorised agent of the Victorian WorkCover Authority under section 501 of the Workplace Injury Act 2013 and as an agent of a self-insurer under section 393(2) of that Act.
Accountability of the Commission (section 14)
The Commission must perform its functions and exercise its powers subject to the general direction and control of the Minister and in accordance with any specific written directions given by the Minister in relation to a matter or class of matters specified in the directions.
If the Commission is given a written direction, the Commission may cause the direction to be published in the Government Gazette and must publish the direction in its next annual report.
Legislation
The following legislative changes have occurred in the period from 1 July 2013 to 30 June 2014:
On 29 September 2013, the Road Legislation Amendment (Use and Disclosure of Information and Other Matters) Act 2013 inserted a new section 126C into the Transport Accident Act 1986 which authorises VicRoads (which is referred to as “the Roads Corporation” under the Transport Accident Act 1986) and relevant persons, to disclose relevant information to the Commission to enable it to undertake any activities specified under section 126C(1)(a) to (e). These activities include:
• determining whether a person is entitled to claim;
• disseminating road safety information; and
• building statistical models that identify crash risk factors, compensation cost factors and the likelihood of injury or crashes for a road user or vehicle.
These activities relate to the functions of the Commission under the Transport Accident Act 1986.
On 12 November 2013, the Workplace Injury Rehabilitation and Compensation Act 2013 amended various sections of the Transport Accident Act 1986 which refer to and operate in relation to the Accident Compensation Act 1985 and the Accident Compensation (WorkCover Insurance) Act 1993. References to the Accident Compensation (WorkCover Insurance) Act 1993 were deleted to reflect that the Accident Compensation (WorkCover Insurance) Act 1993 was repealed. Similarly, some references to the Accident Compensation Act 1985 were deleted, where the relevant sections of that Act were repealed. Specifically, the Workplace Injury Rehabilitation and Compensation Act 2013:
• amended the definition of “employer superannuation contribution” in section 3(1) of the Transport Accident Act 1986 by replacing the words “section 5(1) of the Accident Compensation Act 1985” with the words “section 3 of the Workplace Injury Rehabilitation and compensation Act 2013”
• amended the definitions of self-insurer” and “worker” in section 3(1) of the Transport Accident Act 1986 by replacing the words “Accident Compensation Act 1985” with the words “Workplace Injury Rehabilitation and Compensation Act 2013”
• amended section 3(2)(c) of the Transport Accident Act 1986 by inserting the words “the Workplace Injury Rehabilitation and Compensation Act 2013” after the words “Act 1985”
• amended section 11(e) of the Transport Accident Act 1986 by inserting the words “or the Workplace Injury Rehabilitation and Compensation Act 2013” after the words “Accident Compensation Act 1985.”
• amended section 12(1):
• (jb) of the Transport Accident Act 1986 by substituting the words “section 23 of the Accident Compensation Act 1985” with the words “section 501 of the Workplace Injury Rehabilitation and Compensation Act 2013”
77
• (jc) of the Transport Accident Act 1986 by substituting the words “section 143A of the Accident Compensation Act 1985” with the words “section 392(2) of the Workplace Injury Rehabilitation and Compensation Act 2013”
• amended section 13(5):
• (a) of the Transport Accident Act 1986 by substituting the words “section 23 of the Accident Compensation Act 1985” with the words “section 501 of the Workplace Injury Rehabilitation and Compensation Act 2013”
• (b) of the Transport Accident Act 1986 by substituting the words “section 143A of the Accident Compensation Act 1985” with the words “section 392(2) of the Workplace Injury Rehabilitation and Compensation Act 2013”
• amended section 27(3)(hb) of the Transport Accident Act 1986 by inserting the words “section 368 of the Workplace Injury Rehabilitation and Compensation Act 2013” after the words “Act 1985”
• amended section 37(1)(g) of the Transport Accident Act 1986 by inserting the words “the Workplace Injury Rehabilitation and Compensation Act 2013” after the words “Act 1985”
• inserted the following heading to section 38A of the Transport Accident Act 1986 “Commission not liable where compensation payable under Accident Compensation Act 1985 or Workplace Injury Rehabilitation and Compensation Act 2013”
• amended section 38A, 86(2)(c), 94(1), and 131(2)(c) of the Transport Accident Act 1986 by inserting the words “or the Workplace Injury Rehabilitation and Compensation Act 2013” after the words “Act 1985”
• amended section 94A(1) of the Transport Accident Act 1986 by inserting the words “or section 369 of the Workplace Injury Rehabilitation and Compensation Act 2013” after the words “Act 1985”
On 19 November 2013, the Transport Accident Amendment Act 2013:
• amended the definition of dependent child in section 3(1) and section 68(3)(a) of the Transport Accident Act 1986 to provide that a dependent child of a person who dies as a result of a transport accident, who was under the age of 18 at the time of the transport accident, is able to make a claim for dependency benefits at any time before attaining the age of 21 years, if no dependency claim has been made on their behalf;
• inserted a new subsection (aa) in the definition of medical service in section 3(1) and inserts a new subsection (aaa) in section 23(1)(a) of the Transport Accident Act 1986 to provide that occupational therapy services are included as a medical service and that these services require prior approval. The provision also adds occupational therapists to the list of practitioners that the TAC may require a person to be examined by under section 71 of the Transport Accident Act 1986 for the purposes of assessing the person’s entitlement to compensation;
• inserted the definitions of a RTO, TAFE institute and university in section 3(1) and substitutes the definition of transportation costs in section 3(1) of the Transport Accident Act 1986 to extend reimbursement of reasonable travel costs to persons attending RTO, TAFE institutes and university who were students before their transport accident and who are unable to travel by their pre-accident means of transport, because of their injuries;
• inserted a new subsection (d) in section 3(1A) of the Transport Accident Act 1986 to confirm that incidents involving the opening or closing of train, tram and bus doors are transport accidents;
• repealed sections 13(3), 14(1)(c), 14(3), 27(2)(fa), 27(3)(ha) and Part 2A of the Transport Accident Act 1986 which finalised the Government’s response to the collapse of the Farrow Group of Building Societies in 1991;
• amended section 16(3)(d) of the Transport Accident Act 1986 to provide that Director’s resignations are to be submitted to the Minister instead of the Governor in Council;
• amended section 39(3)(b) of the Transport Accident Act 1986 to the effect that the TAC is not liable to pay compensation other than medical and like services to the driver of a motor vehicle who is convicted of an offence in another State or Territory that is declared by Order in Council to be a corresponding law, which is intended to be a law that is equivalent to culpable driving causing death or dangerous driving causing death under the Crimes Act 1958;
• inserted a definition in section 42(5) of the Transport Accident Act 1986 to clarify that a law of a place outside Victoria and proceedings outside Victoria includes a law of the Commonwealth or a proceeding under Commonwealth law;
78
• amended sections 46A(1A), 47(7)(a), section 67(1) and repealed section 67(1A) of the Transport Accident Act 1986 to clarify that a person who is injured in a transport accident must have an accepted claim for compensation in their own right for their own personal injury in order to obtain a determination of impairment and consequently seek access to common law damages;
• inserted a new section 46A(1E) of the Transport Accident Act 1986 to clarify that the TAC is only required to determine the degree of transport accident-related impairment of a person and, in the case of a person who has an injury that existed before the transport accident that is aggravated by an injury that was the result of a transport accident, the use of the apportionment methodology set out in Chapter 3.3f of the A.M.A Guides is to be used for spinal injury and in any other case, use the subtraction methodology set out in Chapter 2 of the A.M.A Guides;
• inserted new sections 46A(2C) and 46A(2D) into the Transport Accident Act 1986 to provide for the TAC, with the approval of the Minster, to publish a Guides Modification Document to set out guidelines regarding the use and application of the A.M.A Guides for the assessment of the degree of permanent impairment of a person injured as a result of a transport accident;
• amended section 46A(4)(a) and 46A(4)(b) of the Transport Accident Act 1986 to clarify that diminution of hearing must be assessed as a binaural loss of hearing;
• amended section 60(2)(a) of the Transport Accident Act 1986 to provide that the reasonable costs of vocational rehabilitation services can be paid as compensation under section 60 of the Transport Accident Act 1986;
• amended section 60(2A)(a) of the Transport Accident Act 1986 to provide that family counselling services are increased to a total of $15,000 for the immediate family of a person who has died or is severely injured in a transport accident;
• amended section 60(2A)(b) of the Transport Accident Act 1986 to provide that the total amount of compensation payable for the costs of funerals, burials or cremations, monuments, or any other expense prescribed for the purposes of this section, is $14,135. This amount will be indexed each year under section 61 of the Transport Accident Act 1986;
• amended section 60(2BA) of the Transport Accident Act 1986 to increase the period for which travel expenses may be claimed from 12 weeks to 24 weeks and to provide that the weeks do not have to be consecutive or immediately following the transport accident;
• amended sections 60(2D)(c) and 60(2E) of the Transport Accident Act 1986 to increase the amount of claimable travel or accommodation expenses for members of the immediate family visiting the injured person in hospital to $10,000;
• inserted section 60(2F) and amend section 71(1) of the Transport Accident Act 1986 to provide that the TAC is liable to pay the reasonable costs of a certificate, or a report or other document obtained for medico-legal purposes, if it is provided jointly to the TAC and the person who is injured. The provision also confirms that the TAC may require a person who was injured as a result of a transport accident to submit from time to time for examination by one or more medical services providers nominated by the TAC, including for Part 6 purposes;
• amended sections 60(11A) and 61(7) of the Transport Accident Act 1986 to provide that contributions by persons residing in shared supported accommodation must not exceed $32.50 per day towards the cost of that accommodation, consistent with existing requirements of an Order in Council. Section 61 of the Act provides that the amount of $32.50 is to be indexed by the Consumer Price Index on 1 July each year. The amendment to section 61(7) provides for the power to suppress indexation in any year by Order of the Governor in Council;
• amended section 61A(4)(e) of the Transport Accident Act 1986 to increase the cap on aids, appliances or apparatus, that can be purchased under the terms of an Individual Funding Agreement to $1,000;
• inserted section 67A into the Act to provide that a person who makes a claim for compensation must, as soon as practicable, sign an authority in a form approved by the TAC, to release relevant medical or other information to the TAC for the purpose of processing, assessing or otherwise managing the person’s claim and that a person may sign more than one authority;
79

• amended section 74(2)(b) of the Transport Accident Act 1986 to the effect that the TAC is able to discontinue or reduce a person’s entitlement to loss of earning capacity benefits if the TAC reasonably believes that the person has not accepted a reasonable offer of suitable employment or a reasonable offer of rehabilitation or vocational rehabilitation services;
• inserted section (2A) after section 93(2) of the Transport Accident Act 1986 to provide that a person who is injured as a result of a transport accident may not recover damages in respect of mental injury (including nervous shock) in circumstances where the person was not directly involved in and did not witness the transport accident, and the mental injury (including nervous shock) was suffered as a result of the injury or death of another person who was directly involved in the transport accident, and the transport accident was caused by that other person committing suicide, intending to commit suicide or as result of the sole or predominant negligence of that other person;
• inserted a clinical framework into section 93(17) of the Transport Accident Act 1986 to define what is a severe long-term mental or severe long-term behavioural disturbance or disorder. This clause will come into operation on 16 October 2013 and apply to an application for a serious injury certificate under section 93(4)(c)(ii) and an application to the Court for leave under section 93(4) made after that date. The provision is given effect in respect of all applications made after that date to ensure that the new criteria are given immediate effect and to ensure there is no incentive to lodge applications for a serious injury certificate prematurely to avoid the application of the revised test. This will ensure there is no significant increase in lodgements and will avoid the risks associated with increasing liability associated with increasing lodgements prior to introduction of the revised clinical framework for the assessment of mental injuries.
• amended section 120(4) of the Act to increase the time limit for certain criminal prosecutions under section 116, 117 or 117C from 2 years to 3 years after the alleged offence occurred;
• amended section 127(3A) and 124(4) of the Transport Accident Act 1986 to extend the definition of an employer to include a person who had entered into an agreement with a person who is injured or dies in the transport accident in the 3 years preceding the accident;
• inserted Division 6 in Part 11 of the Transport Accident Act 1986.
On 8 April 2014, the Mental Health Act 2014 amended the definition of “hospital” in section 3(1) of the Transport Accident Act 1986 by replacing paragraph (b) of that definition with the words “a designated mental health service within the meaning of the Mental Health Act 2014; or”.
On 3 June 2014, the Victoria Police Amendment (Consequential and Other Matters) Act 2014 amended the Transport Accident Act 1986 by:
• inserting the definition of “police officer” in section 3(1) of the Transport Accident Act 1986 to have the same meaning as in the Victoria Police Act 2013;
• amending section 39(1)(a):
• subparagraph (i) of the Transport Accident Act 1986 by substituting the words “member of the police force” with the words “police officer”
• subparagraph (ii) of the Transport Accident Act 1986 after the words “police force” inserting the words “or police service”
• amending sections 64(1) and (3), 90 (2)(b), 99(3) and 100(3) of the Transport Accident Act 1986, by substituting the words “member of the police force” with the words “police officer”
• amending section 120(1A) of the Transport Accident Act 1986, by substituting the words “an officer of police” with the words “a police officer”.
On 27 June 2014, the Treasury Legislation and Other Acts Amendment Act 2014 amended provisions relating to indexation under the Transport Accident Act 1986 by.
• amending sections 49(5A) and 56(1)of the Transport Accident Act 1986, by substituting the words “Australian Statistician” with the words “Australian Bureau of Statistics”
• amending section 61(1) of the Transport Accident Act 1986 by:
• substituting the definition of B with the words “B is the average weekly total earnings of all employees in Victoria in original terms for the most recent reference period in the preceding calendar year last published by the Australian Bureau of Statistics as at 15 June immediately preceding the date on which the variation is made.”
80
• substituting the definition of C with the words “C is the average weekly total earnings of all employees in Victoria in original terms for the corresponding reference period in the calendar year preceding the calendar year referred to in B last published by the Australian Bureau of Statistics as at 15 June immediately preceding the date on which the variation is made.”
• amending section 61(2) of the Transport Accident Act 1986 by:
• substituting the definition of E with the words, “E is the all groups consumer price index for Melbourne in original terms for the most recent reference period in the preceding calendar year last published by the Australian Bureau of Statistics as at 15 June immediately preceding the date on which the variation is made.”
• substituting the definition of F with the words, “F is the all groups consumer price index for Melbourne in original terms for the corresponding reference period one year earlier than the reference period referred to in E last published by the Australian Bureau of Statistics as at 15 June immediately preceding the date on which the variation is made.”
• amending section 61(2A), of the Transport Accident Act 1986 by:
• substituting the definition E with the words “E is the all groups consumer price index for Melbourne in original terms for the most recent reference period in the preceding calendar year last published by the Australian Bureau of Statistics as at 15 June immediately preceding the date on which the variation is made.”
• substituting the definition of F with the words, “F is the all groups consumer price index for Melbourne in original terms for the corresponding reference period one year earlier than the reference period referred to in E last published by the Australian Bureau of Statistics as at 15 June immediately preceding the date on which the variation is made”
• amending section 61(2B), of the Transport Accident Act 1986 by:
• substituting the definition E, with the words “E is the average weekly total earnings of all employees in original terms in Victoria for the most recent reference period in the preceding calendar year last published by the Australian Bureau of Statistics as at 15 June immediately preceding the date on which the variation is made.”
• substituting the definition F, with the words “F is the average weekly total earnings of all employees in Victoria in original terms for the corresponding reference period in the calendar year preceding the calendar year referred to in E last published by the Australian Bureau of Statistics as at 15 June immediately preceding the date on which the variation is made.”
• amending section 61(2C), of the Transport Accident Act 1986 by:
• substituting the definition E, with the words “E is the average weekly total earnings of all employees in Victoria in original terms for the most recent reference period in the preceding calendar year last published by the Australian Bureau of Statistics as at 15 June immediately preceding the date on which the variation is made.”
• substituting the definition F, with the words “F is the average weekly total earnings of all employees in Victoria in original terms for the corresponding reference period in the calendar year preceding the calendar year referred to in E last published by the Australian Bureau of Statistics as at 15 June immediately preceding the date on which the variation is made.”
• amending section 61(2D), of the Transport Accident Act 1986 by:
• substituting the definition E, with the words “E is the all groups consumer price index for Melbourne in original terms for the most recent reference period in the preceding calendar year last published by the Australian Bureau of Statistics as at 15 June immediately preceding the date on which the variation is made.”
• substituting the definition F, with the words “F is the all groups consumer price index for Melbourne in original terms for the corresponding reference period one year earlier than the reference period referred to in E last published by the Australian Bureau of Statistics as at 15 June immediately preceding the date on which the variation is made.”
• amending section 174(1)(c) and subparagraph (i) of the Transport Accident Act 1986 by deleting the words “quarter” (where 3 times occurring), with the words “reference period”.
81
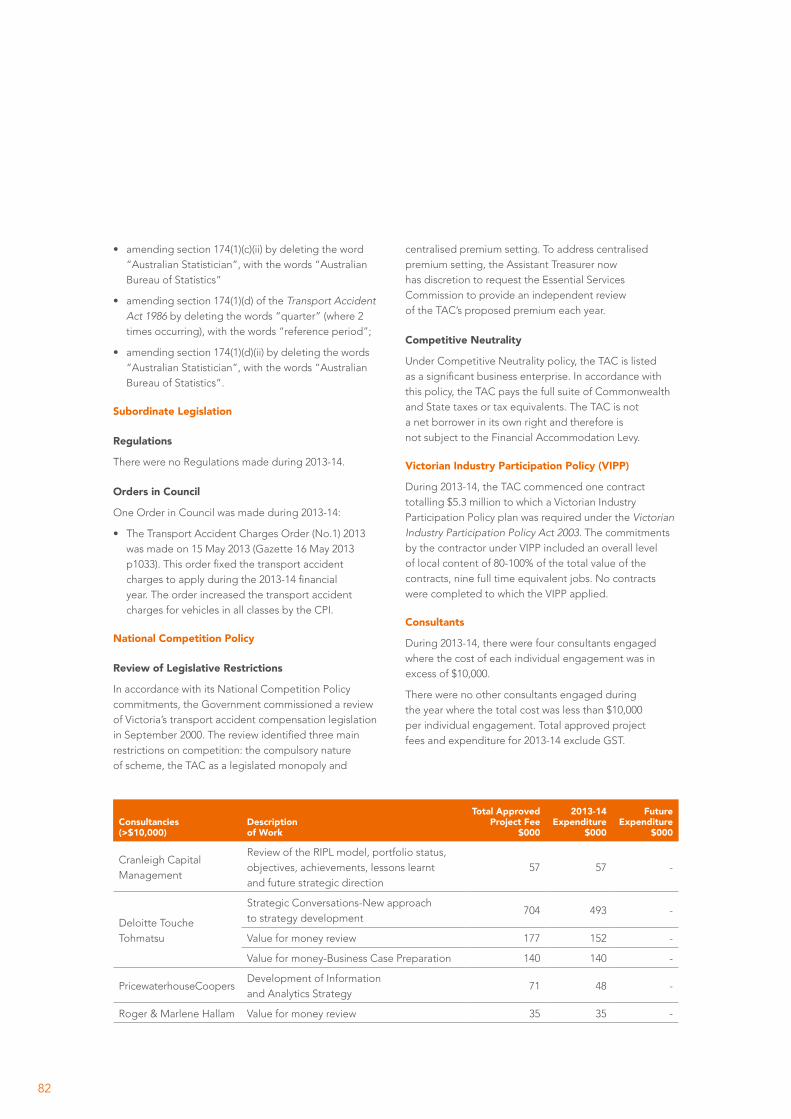
• amending section 174(1)(c)(ii) by deleting the word “Australian Statistician”, with the words “Australian Bureau of Statistics”
• amending section 174(1)(d) of the Transport Accident Act 1986 by deleting the words “quarter” (where 2 times occurring), with the words “reference period”;
• amending section 174(1)(d)(ii) by deleting the words “Australian Statistician”, with the words “Australian Bureau of Statistics”.
Subordinate Legislation
Regulations
There were no Regulations made during 2013-14.
Orders in Council
One Order in Council was made during 2013-14:
• The Transport Accident Charges Order (No.1) 2013 was made on 15 May 2013 (Gazette 16 May 2013 p1033). This order fixed the transport accident charges to apply during the 2013-14 financial year. The order increased the transport accident charges for vehicles in all classes by the CPI.
National Competition Policy
Review of Legislative Restrictions
In accordance with its National Competition Policy commitments, the Government commissioned a review of Victoria’s transport accident compensation legislation in September 2000. The review identified three main restrictions on competition: the compulsory nature of scheme, the TAC as a legislated monopoly and
centralised premium setting. To address centralised premium setting, the Assistant Treasurer now has discretion to request the Essential Services Commission to provide an independent review of the TAC’s proposed premium each year.
Competitive Neutrality
Under Competitive Neutrality policy, the TAC is listed as a significant business enterprise. In accordance with this policy, the TAC pays the full suite of Commonwealth and State taxes or tax equivalents. The TAC is not a net borrower in its own right and therefore is not subject to the Financial Accommodation Levy.
Victorian Industry Participation Policy (VIPP)
During 2013-14, the TAC commenced one contract totalling $5.3 million to which a Victorian Industry Participation Policy plan was required under the Victorian Industry Participation Policy Act 2003. The commitments by the contractor under VIPP included an overall level of local content of 80-100% of the total value of the contracts, nine full time equivalent jobs. No contracts were completed to which the VIPP applied.
Consultants
During 2013-14, there were four consultants engaged where the cost of each individual engagement was in excess of $10,000.
There were no other consultants engaged during the year where the total cost was less than $10,000 per individual engagement. Total approved project fees and expenditure for 2013-14 exclude GST.
Consultancies (>$10,000)
Description of Work
Total Approved Project Fee
$000
2013-14 Expenditure
$000
Future Expenditure
$000
Cranleigh Capital Management
Review of the RIPL model, portfolio status, objectives, achievements, lessons learnt and future strategic direction
57 57 -
Deloitte Touche Tohmatsu
Strategic Conversations-New approach to strategy development
704 493 -
Value for money review 177 152 -
Value for money-Business Case Preparation 140 140 -
PricewaterhouseCoopersDevelopment of Information and Analytics Strategy
71 48 -
Roger & Marlene Hallam Value for money review 35 35 -
82
Building Act 1993
The TAC’s policy with respect to new building works, and alterations to existing buildings, is to comply with the Building Act 1993 as though the TAC were not exempt from compliance as a public authority (this is provided for in section 217 (3) of the Building Act 1993).
Some premises occupied by the TAC may have been constructed or altered under exemptions for public bodies which applied at the time.
The TAC is unaware of any material non-compliance with the current building standards for buildings of their nature and age.
The Protected Disclosure Act 2012
The TAC encourages the reporting of known or suspected incidences of improper conduct or detrimental actions. Procedures have been established to facilitate disclosures of improper conduct by the TAC and its employees and to ensure that any matters disclosed are properly investigated and dealt with. The procedures provide for the protection from reprisals of persons making disclosures. Included in the procedures are the disclosure mechanisms, confidentiality provisions and the roles and responsibilities of the designated protected disclosure coordinator, the protected disclosure officers, investigators and welfare managers.
Since the Protected Disclosure Act 2012 came into operation, there have been no disclosures made to the IBAC under section 21(2) of that Act.
Environmental Performance
The TAC has a Green Office policy focussed on protecting the environment and supporting sustainable outcomes.
During 2013-14, the TAC continued a number of environmentally sustainable initiatives, supported by a corporate social responsibility committee, to reduce waste and improve resource efficiency.
Charter Of Human Rights And Responsibilities Compliance
The TAC conducts regular updates to claims staff on the Charter of Human Rights and Responsibilities. All claims policies and work practices are audited for compliance with the Charter to help claims staff make decisions that are consistent with the provisions of the Transport Accident Act 1986 (TA Act) and the Charter.
Miscellaneous Disclosure
To the extent applicable, the information required under Financial Reporting Direction 22 issued by the Minister for Finance under Section 8 of the Financial Management Act 1994 has been prepared and is available on request.
Advertising and Communications Disclosure
Effective 1 July 2012, new disclosures relating to the State Government’s commitment to transparency of advertising and communications expenditure, must be included in the report of operations. The disclosure of advertising expenditure is required for each government advertising campaign with total media buy of $150,000.
Working closely with its road safety partners – Victoria Police, the Department of Justice and VicRoads – the TAC develops public education campaigns that increase awareness of specific road safety issues, to change behaviour and ultimately reduce the incidence of road trauma.
Significant research and planning goes into the development of the campaigns, ensuring they are evidence-based, relevant and are able to be used over many years.
83

Name of Campaign
Campaign summary
Start/ End date
Advertising (Media)
Expenditure 2013-14
(ex. GST)
Creative and campaign
developmentExpenditure
2013-14 (ex. GST)
Research and
evaluationExpenditure
2013-14 (ex. GST)
Distractions "Blind"
A campaign addressing the issue of distractions whilst using the road network. The campaign speaks to drivers and riders, as well as other vulnerable road users such as pedestrians and cyclists, and addresses distractions such as mobile phones and other devices, demonstrating the potential traumatic consequences.
15/07/13 - 04/08/13 $841,966 $44,594 $36,357
Speed "Support the Drive to Wipe Off 5"
A community-based promotional campaign raising awareness of the Wipe off 5 message and enhancing the community’s understanding of the dangers associated with low-level speeding. Through a range of media, social media competition and regional roadshow, Victorians were asked to actively “Support the Drive to Wipe off 5” by demonstrating how lower speed can benefit everyone's life, every day.
05/08/13 - 01/09/13 $1,393,084 $1,157,056 $98,917
Drink Drive "Bloody Idiots"
A campaign addressing the impact of alcohol, even at low levels, on the ability to control a vehicle and the ripple effect consequences.
02/09/13 - 29/09/13 $1,957,362 $161,284 $36,357
Drink Drive "Booze Busted"
An primarily online driven campaign targeting drink driving males, highlighting the extent and severity of penalty consequences for repeat drink driving.
13/09/13 - 03/10/13 $198,723 $56,660 $23,100
Motorcycles "The Perfect Ride"
The launch campaign during the Australian Moto GP targeting returned / recreational riders addressing the risks associated with motorcycling and unexpected dangers on the road. It highlights the need to ride safely within personal limits, directing riders to the Spokes website to undertake a range of tutorials designed to refresh road safety skills and apply strategies to mitigate risk. Campaign aired during all televised MotoGP events.
09/10/13 - 30/10/13 $1,542,918 $1,160,414 $126,432
Ps Parental Influence "Red Line"
A launch campaign addressing the risk factor of newly licenced drivers, and aimed at parents of these drivers encouraging them to continue to play a role in the safety and decision making of their young drivers through continued mentoring and role modelling.
12/11/13 - 28/11/13
03/02/14 - 23/02/14
$1,538,095 $795,927 $90,022
Police Enforcement "The Party's Over"
A multifaceted campaign to support increased on-road Police enforcement activity, specifically targeting drink driving, speeding, drug driving, unlicensed drivers and unregistered vehicles.
02/12/13 - 06/01/14 $1,845,344 $142,853 $36,357
Youth Risk Taking - MAFMAD Short Films 2013
A cinema and online campaign showcasing the two winning Make A Film Make A Difference (MAFMAD) concepts, developed by young film makers, addressing the issue of road safety among 18-25 year olds and specifically the issue of peer influence.
27/12/13 - 25/01/14 $249,554 $112,705 $72,379
Vehicle Safety "James"
A campaign promoting the benefits of improved vehicle safety, new or used, and promoting howsafeisyourcar.com.au as a destination for more information about vehicle safety.
15/01/14 - 03/02/14 $1,512,285 $154,348 $45,779
Distractions "Blind"
A campaign addressing the issue of distractions whilst using the road network. The campaign speaks to drivers and riders, as well as other vulnerable road users such as pedestrians and cyclists, and addresses distractions such as mobile phones and other devices, demonstrating the potential traumatic consequences.
06/02/14 - 26/02/14 $814,475 $98,693 $45,779
Youth Risk Taking "Roadtrip Forever"
Through social media and technology, this campaign encourages the public to experience the potential traumatic consequences of youth risk taking, through interactive video focussing on the dangers of speed and distractions whilst driving.
10/02/14 - 23/03/14 $188,790 – –
Drugs & Driving "The Cell"
A campaign addressing the impact of illicit drugs on the ability to control a vehicle and the potential traumatic consequences.
06/03/14 - 26/03/14 $1,593,793 $168,049 $45,779
Transport Accident Commission
Details of government advertising expenditure (campaign with a media spend of $150,000 or greater)
84

Name of Campaign
Campaign summary
Start/ End date
Advertising (Media)
Expenditure 2013-14
(ex. GST)
Creative and campaign
developmentExpenditure
2013-14 (ex. GST)
Research and
evaluationExpenditure
2013-14 (ex. GST)
Motorcycles & Drivers "Vice Versa"
A campaign dually addressing drivers and motorcyclists about shared responsibility on the road for the safety of all road users through shared experienced and greater respect for all road users.
27/03/14 - 09/04/14 $827,932 $129,584 $52,684
Fatigue "Drowsy Pillow"
A launch campaign speaking to all drivers and riders about the issues of 'drowsy driving' and educating the community about the science of sleep and, ultimately, the body’s inability to fight it, highlighting the potential traumatic outcomes when using the road network.
10/04/14 - 24/04/14 $1,989,600 $716,718 $97,829
Fatigue - SES "Driver Reviver"
A tactical campaign to the support the SES Driver Reviver campaign, encouraging all holiday makers to use the stops and take a 15 minute powernap over the Easter period.
15/04/14 - 22/04/14 $175,369 $32,451 –
Police Enforcement "The Party's Over"
An existing campaign adapted to raise road user awareness of increased police enforcement activity during the Easter period.
16/04/14 - 22/04/14 $256,029 $282,073 $16,485
Speed "Good Driver"
A campaign addressing the issues of low level speeding, specifically the issues of justification, and encouraging drivers/rider to realistically evaluate their behaviour against the real potential consequences of speeding.
01/05/14 - 21/05/14 $1,426,088 $115,012 $45,779
Ps Parental Influence "Red Line"
A campaign addressing the risk factor of newly licenced drivers, and aimed at parents of these drivers encouraging them to continue to play a role in the safety and decision making of their young drivers through continued mentoring and role modelling.
05/05/14 - 24/06/14 $828,814 $80,271 $45,779
Police Enforcement "The Party's Over"
An existing campaign adapted to raise road user awareness of increased police enforcement activity during the Queen’s birthday long weekend.
05/06/14 - 09/06/14 $180,258 $6,201 $16,485
Corporate "Your TAC"
A campaign targeted at all Victorian road and transport users about the role of the TAC as a personal injury insurer.
12/05/14 - 30/06/14 $402,044 $59,758 $73,599
Vehicle Safety "Auto Emergency Braking"
A launch campaign demonstrating the “Auto Emergency Braking” vehicle technology and highlighting the potential to reduce collision/trauma outcomes. The campaign directs consumers to the HSIYC website for more information and encourages them to choose this technology when purchasing their next new vehicle.
26/06/14 - 22/07/14 $1,517,367 $1,115,810 $79,384
Child Safety "Thingle Toodle"
A year long campaign using five existing executions as part of the Victorian "Starting Out Safely" program addressing early childhood education and parental influence around issues such as seatbelts, helmet wearing, crossing the road, etc.
01/08/13 - 30/06/14 $331,465 $898 –
Youth "TAC Cup Future Stars"
Naming rights and content partnership for the TAC Cup Future Stars program addressing a number of road safety issues including learner driving, education surrounding speed and safety, as well as parental influence into the early days of solo driving.
July - Sept 2013 &
May - June 2014
$450,000 $48,179 –
Drink Drive "Country Racing"
A campaign addressing drink driving issues and specifically highlighting the increased police breath-testing activity in the lead up to 30 key regional country racing events throughout regional Victoria. The campaign encourages race goers to plan ahead to avoid drink driving and enforcement detection.
Sept 2013 - June 2014 $90,172 $33,769 –
Melbourne Victory "Wipe off 5"
A campaign as part of the Melbourne Victory partnership and aired during A-League programming, addressing issue of low level speeding and demonstrating the benefits of slowing down.
October 2013 - March 2014
$172,014 $102,838 $16,500
85
Service of Documents
Section 130 of the Transport Accident Act 1986 sets out the method of service of documents on the TAC, by personally serving an authorised officer at the TAC’s Geelong office. People wishing to effect service should attend the TAC’s Customer Service Centre, 60 Brougham Street, Geelong, and ask for an authorised officer to accept service.
Alternatively, an authorised officer of the TAC will give a written acknowledgment of service of process directed as follows:
Head of Claims PO Box 742 GEELONG 3220 Ausdoc: DX 216079 Geelong
Please note that this is a voluntary process and that proof of posting is not proof of service. If an acknowledgment letter is not received within 10 days after sending process by mail, personal service should be attempted under section 130.
Access To Information
Freedom of Information
The TAC officers responsible for monitoring receipt of requests and decision making under the Freedom of Information Act 1982 are Justine Adams, Ellen Jennings, Debbie Finch, Kate Healy, Tahlee Byars and Emily Holland.
Documents created and maintained for claims administration, general administrative, financial and investment functions are primarily electronic with a minority of documents stored using paper and aged documents on microfiche.
During 2013-14, the TAC received 1,170 Freedom of Information (FOI) requests for access to documents, compared with 1,213 during 2012-13. Most requests related to personal documentation. There were no requests for amendment to personal records.
Routine documentation may be released without making a formal FOI request. Potential applicants should therefore first request release of such documentation from the relevant staff member.
If a formal FOI request is required, it must be submitted in writing, detailing the documents sought, as well as enclosing the statutory $26.50 application fee, preferably in the form of a cheque payable to “Transport Accident Commission”. The statutory application fee of $26.50 is applicable for the period 1 July 2014 to 30 June 2015 in accordance with the Monetary Units Act 2004.
The application fee and access charges will be waived for applicants demonstrating hardship (irrespective of the kind of information sought). There is no application fee for a request for amendment to personal records.
The TAC is an agency subject to the Freedom of Information Act 1982 and is therefore not subject to the direct access provisions of the Information Privacy Act 2000 and the Health Records Act 2001.
Further information about FOI is available from the TAC’s website: www.foi.tac.vic.gov.au and the Victorian Government FOI Commissioner’s website www.foicommissioner.vic.gov.au.
Contact details for the TAC’s FOI section are as follows:
Freedom of Information Officer Transport Accident Commission PO Box 742 GEELONG VIC 3001 Phone: 1300 654 329 Fax: (03) 9656 9360 Email: [email protected]
Medical Reports for Common Law Purposes
To facilitate clients in receiving legal advice, the TAC will, on request or as part of its agreed protocols, provide copies of medical reports commissioned by the TAC, independently of its normal FOI access arrangements.
Requests for access to medical reports should be directed to the relevant TAC claims officer or, where the reports relate to impairment assessments, to the relevant impairment officer. There is no fee for access to documents under this policy.
Subpoenas
All subpoenas should be addressed to ‘The Authorised Person’ and must be personally served on an authorised officer at the TAC’s offices at 60 Brougham Street, Geelong. The TAC prefers to have a minimum of 14 days notice prior to the return date of the subpoena.
86

Publications
The TAC produces and makes available the following publications:
Description Mode of access
About the TAC Copy/Internet
Working for the TAC Internet
After Your Transport Accident DVD
Annual Transport Accident charges including GST and duty Internet
At home with the family Copy/Internet
Choosing an Attendant Care Agency (information sheet) Copy/Internet
Choosing a supported accommodation service (information sheet) Copy/Internet
Community Group Programs (information sheet) Copy
Community Road Safety Grants newsletter Copy/Internet
Community services (information sheet) Copy/Internet
Connecting the Dots secondary school resource Copy/Internet
Daily support (information sheet) Copy/Internet
Drive Smart 2 CD-ROM (available to learner drivers) Internet
Empower Copy/Internet
GST compliance (information sheet) Copy/Internet
If you need further treatment (information sheet) Copy/Internet
Independence – an overview for providers Copy/Internet
Information for people with major injuries (Booklets 1 – 4) Copy/Internet
Information on TAC medical examinations (information sheet) Copy/Internet
Integration support billing information (information sheet) Copy/Internet
Kids on the Move primary school resource Copy/Internet
Loss of earnings capacity (information sheet) Copy/Internet
Occupational physicians - helping you get back to work Copy/Internet
Occupational physiotherapists - helping you recover and get back to work Copy/Internet
Occupational physiotherapists Directory – metro Copy/Internet
Occupational physiotherapists Directory – regional Copy/Internet
Pharmacy expenses (information sheet) Copy/Internet
Post-hospital support (information sheet) Copy/Internet
Preparing to go home - hospital discharge checklist Copy/Internet
RAW DVD secondary school resource Copy/Internet
Returning to work - information for employers Copy/Internet
Returning to work - information for new employers Copy/Internet
Returning to work Copy/Internet
Ride Smart Internet
87

Description Mode of access
Road Safety Statistical Summary Internet
Safe driving policy Internet
Get Your Gear On Copy
TAC Annual Reports Copy/Internet
TAC loss of earnings benefits for self-employed people Copy/Internet
TAC billing requirements Copy/Internet
TAC client service charter Copy/Internet
TAC dependency benefits – a guide for funeral directors Copy/Internet
TAC equipment suppliers billing standards Internet
TAC Enterprise Agreement 2011-2014 Copy
TAC fee schedules Internet
TAC home modifications (information sheet) Copy/Internet
TAC home services Copy/Internet
TAC hospital charter Copy/Internet
TAC hospital services billing guidelines Copy/Internet
TAC information for people with soft tissue injuries Copy/Internet
TAC impairment benefits Copy/Internet
TAC impairment examination (information sheet) Copy/Internet
TAC loss of earnings Copy/Internet
Invoice guidelines for medical practitioners Internet
TAC post-acute support services Copy/Internet
TAC prosthetics and orthotics billing standards (information sheet) Copy/Internet
TAC research charter Copy/Internet
TAC support when a person dies Copy/Internet
TAC vehicle modifications Copy/Internet
The TAC and the Victorian Freedom of Information Act 1982 Copy/Internet
The TAC’s complaints process Copy/Internet
Therapy Support (information sheet) Copy/Internet
Traffic Safety Essentials Copy/Internet
Using modified vehicles – cost exemptions Copy/Internet
Your Feedback Copy
Your Mental Health Copy/Internet
Your Privacy and the TAC Copy/Internet
Your Voice newsletter Copy/Internet
4th Edition Impairment Examinations Information Manual Copy
88
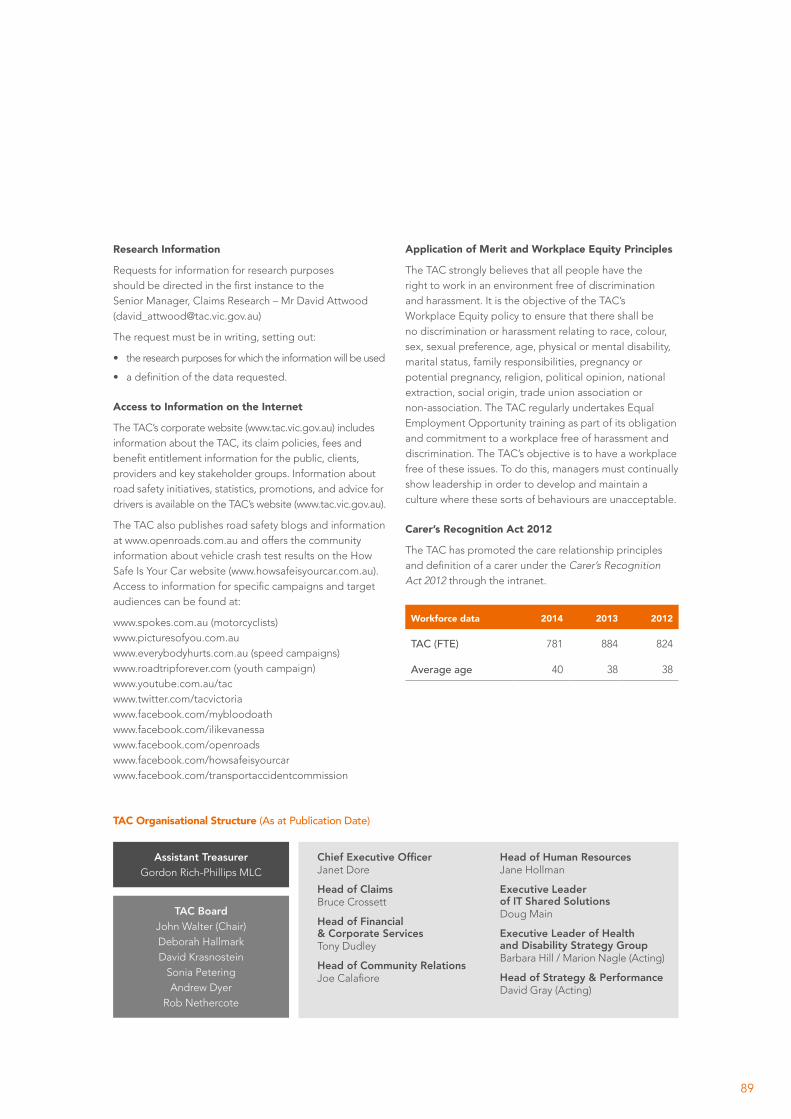
89
Research Information
Requests for information for research purposes should be directed in the first instance to the Senior Manager, Claims Research – Mr David Attwood ([email protected])
The request must be in writing, setting out:
• the research purposes for which the information will be used
• a definition of the data requested.
Access to Information on the Internet
The TAC’s corporate website (www.tac.vic.gov.au) includes information about the TAC, its claim policies, fees and benefit entitlement information for the public, clients, providers and key stakeholder groups. Information about road safety initiatives, statistics, promotions, and advice for drivers is available on the TAC’s website (www.tac.vic.gov.au).
The TAC also publishes road safety blogs and information at www.openroads.com.au and offers the community information about vehicle crash test results on the How Safe Is Your Car website (www.howsafeisyourcar.com.au). Access to information for specific campaigns and target audiences can be found at:
www.spokes.com.au (motorcyclists)www.picturesofyou.com.auwww.everybodyhurts.com.au (speed campaigns)www.roadtripforever.com (youth campaign)www.youtube.com.au/tacwww.twitter.com/tacvictoriawww.facebook.com/mybloodoathwww.facebook.com/ilikevanessawww.facebook.com/openroadswww.facebook.com/howsafeisyourcarwww.facebook.com/transportaccidentcommission
Application of Merit and Workplace Equity Principles
The TAC strongly believes that all people have the right to work in an environment free of discrimination and harassment. It is the objective of the TAC’s Workplace Equity policy to ensure that there shall be no discrimination or harassment relating to race, colour, sex, sexual preference, age, physical or mental disability, marital status, family responsibilities, pregnancy or potential pregnancy, religion, political opinion, national extraction, social origin, trade union association or non-association. The TAC regularly undertakes Equal Employment Opportunity training as part of its obligation and commitment to a workplace free of harassment and discrimination. The TAC’s objective is to have a workplace free of these issues. To do this, managers must continually show leadership in order to develop and maintain a culture where these sorts of behaviours are unacceptable.
Carer’s Recognition Act 2012
The TAC has promoted the care relationship principles and definition of a carer under the Carer’s Recognition Act 2012 through the intranet.
Workforce data 2014 2013 2012
TAC (FTE) 781 884 824
Average age 40 38 38
TAC Organisational Structure (As at Publication Date)
Assistant Treasurer Gordon Rich-Phillips MLC
TAC Board John Walter (Chair) Deborah Hallmark David Krasnostein
Sonia Petering Andrew Dyer
Rob Nethercote
Chief Executive Officer Janet Dore
Head of Claims Bruce Crossett
Head of Financial & Corporate Services Tony Dudley
Head of Community Relations Joe Calafiore
Head of Human Resources Jane Hollman
Executive Leader of IT Shared Solutions Doug Main
Executive Leader of Health and Disability Strategy Group Barbara Hill / Marion Nagle (Acting)
Head of Strategy & Performance David Gray (Acting)

90
DISCLOSUREINDEXThe Annual Report of the TAC is prepared in accordance with all relevant Victorian legislations. This index has been prepared to facilitate identification of the TAC’s compliance with statutory disclosure requirements.
Ministerial Directions Legislation Requirement Page reference
Report of operations
Charter and purpose
FRD 22E Manner of establishment and the relevant Minister 76
FRD 22E Objectives, functions, powers and duties 76-77
FRD 22E Nature and range of services provided 7-15
Management and structure
FRD 22E Organisational structure 89
Financial and other information
FRD 22E Statement of workforce data and merit and equity 89
FRD 22E Summary of the financial results for the year 5
FRD 22E Significant changes in financial position during the year 25
FRD 22EOperational and budgetary objectives and performance against objectives
*
FRD 22E Major changes or factors affecting performance *
FRD 22E Subsequent events N/A
FRD 22E Details of consultancy expenditure 82
FRD 22EApplication and operation of Freedom of Information Act 1982
86
FRD 22ECompliance with building and maintenance provisions of Building Act 1993
83
FRD 22EApplication and operation of the Protected Disclosure Act 2012
83
FRD 22E Statement on National Competition Policy 82
FRD 22E Statement of availability of other information 87-88
FRD 22E Occupational health and safety 16
FRD 22E Employment and conduct principles 89
FRD 22E Advertising and communications disclosure 84-85
FRD 10 Disclosure index 90-91
FRD 25B Victorian Industry Participation Policy disclosures 82
SD 4.5.5 Risk management compliance attestation 74
SD 4.5.5.1 Ministerial Standing Direction 4.5.5.1 compliance attestation 74
SD 4.2(g) General information requirements *
SD 4.2(j) Sign-off requirements 2

Financial Statements
Financial statements required under Part 7 of the FMA
SD 4.2(a) Statement of changes in equity 26
SD 4.2(b) Income statement 24
SD 4.2(b) Balance sheet 25
SD 4.2(b) Cash flow statement 27
SD 4.2(b) Notes to the financial statements 28-68
SD 4.2(c)Compliance with Australian accounting standards and other authoritative pronouncements
28
SD 4.2(c) Compliance with ministerial directions 76
SD 4.2(c) Accountable officer’s declaration 68
SD 4.2(c) Rounding of amounts 35
Other disclosures in notes to the financial statements
FRD 3A Accounting for dividends 33
FRD 11A Disclosure of ex-gratia payments N/A
FRD 17B Wage inflation and discount notes for employee benefits 32
FRD 21BResponsible person, executive officer and other personnel disclosures
53-56
FRD 103E Non-current physical assets 33
FRD 104 Foreign currency 32
FRD 106 Impairment of assets 33
FRD 109 Intangible assets 33
FRD 110 Cash flow statement 27
FRD 112D Defined benefit superannuation obligations 53
FRD 116 Financial instruments – public financial corporations 57-67
FRD 120HAccounting and reporting pronouncements applicable to the reporting period
29
Legislation
Freedom of Information Act 1982 86
Building Act 1993 83
Protected Disclosure Act 2012 83
Victorian Industry Participation Policy Act 2003
82
Financial Management Act 1994 28
Audit Act 1994 69-70
91