get your spreadsheets under (version) control
TRANSCRIPT
Get Your Spreadsheets Under (Version) Control
Jose Nuno Macedo13, Ricardo Moreira24, Jacome Cunha14, and Joao Saraiva13
1 Universidade do Minho, Portugal2 Universidade NOVA de Lisboa, Portugal
3 HASLab/INESC TEC, Portugal4 NOVA LINCS, Portugal
[email protected] [email protected]
{jacome,saraiva}@di.uminho.pt
Abstract. Spreadsheets play a pivotal role in many organizations. Theyserve to store and manipulate data or forecasting, and they are often usedto help in the decision process, thus directly impacting the success, ornot, of organizations.As the research community already realized, spreadsheets tend to havethe same problems “professional” software contain. Thus, in the pastdecade many software engineering techniques have been successfully pro-posed to aid spreadsheet developers and users. However, one of the mostused mechanisms to manage software projects is still lacking in spread-sheets: a version control system. A version control system allows forcollaborative development, while also allowing individual developers toexplore different alternatives without compromising the main project.In this paper we present a version control system, named SheetGit, ori-ented for end-user programmers. It allows to graphically visualize the his-tory of versions (including branches), to switch between different versionsjust by pointing and clicking, and to visualize the differences between anytwo versions in an animated way. To validate our approach/tool we per-formed an empirical evaluation which shows evidence that SheetGitcan aid users when compared to other tools.
Keywords: Spreadsheets · Version Control System
1 Introduction
Spreadsheet systems are a success example in the history of software systems.They have achieved an astonishing usage both in terms of the number of users(55 million of end-users programmers in 2012 just in the USA alone [13]) and thevariety of domains in which they are nowadays used. Moreover, they are usedboth by professional programmers at large worldwide organizations, and by non-professional programmers in small family-run businesses. In fact, spreadsheetsystems are installed in 90% of all computers globally [3] .
Spreadsheet systems offer end users a high level of flexibility, making it easierto get started working with them. Although spreadsheets start as a single user,simple software artifact, as any other software system, they tend to quickly evolve

2 J. N. Macedo et al.
into a large and complex system! Moreover, in the age of cloud-based softwaredevelopment, spreadsheets tend to be maintained in a collaborative environment.
In such a context, software is nowadays developed by relying on versioncontrol systems that help collaboratively building complex systems. A versioncontrol mechanism helps teams to manage changes to the same source code overtime. These systems usually track and provide control over changes in softwarefiles and implicitly allow developers to return to any earlier stage of the software.
Although the spreadsheet research community has done considerable work,for instance, in defining abstractions for complex spreadsheets [7, 6, 4] or develop-ing testing frameworks [1, 2], unfortunately, little work has been done in support-ing version control based spreadsheet development. As a consequence, versioncontrol in spreadsheet development is rare, still! There are several reasons forthis situation. First, spreadsheet users, usually non-professional programmers,are not familiar with systems for version control software. Second, spreadsheetsare easy to share - usually a single file artifact which has to be under versioncontrol, thus making it difficult to control and maintain their integrity. Third,version control systems, such as Git5, work very well for text-based languages,but they cannot be directly applied to the visual-representation of spreadsheets.
Although, version control systems are rarely used in spreadsheet develop-ment, research shows that version control does help end users [11]. Because thetraditional version control systems cannot be directly applied to (visual) spread-sheets, end users perform their own versioning manually by adding a suffix/prefixto a file name with the file’s version number! This can be seen even in large com-panies such as Enron [9], where they often sent updated spreadsheets throughemail. However, manual versioning holds numerous risks, as it is possible for auser to receive an email with a wrong or already outdated version, which wouldcause a problem whose root can be difficult to trace.
The goal of our work is three-fold: First, to bring version control to spread-sheet end-users developers in an intuitive manner. Second, to incorporate yetanother modern software development methodology into the spreadsheet realm.Third, to help end users to create, manage, and comprehend complex spread-sheets. For this purpose, we created an add-in for Microsoft Excel, named Sheet-Git, which automatically commits changes, creates branches when needed, al-lows the user to change between versions, and see the spreadsheet differencesbetween versions. Because, the control version is to be used by end users, ouruser interface has been carefully designed: an history slider is presented in ourplug-in allowing end-users to return/see any earlier version of their spreadsheet.A new version of a spreadsheet is added to the control version by just pressing abutton (or by configuring such a commit to occur when a given number of cellshave been updated). This will be detailed in Section 3.2.
To evaluate SheetGit we performed an empirical evaluation with 18 partic-ipants, doing two different kinds of tasks in two different spreadsheets. Evidenceshow SheetGit helped end users being faster and more correct in most cases.Section 4.5 presents this study in detail.
5 https://git-scm.com

Get Your Spreadsheets Under (Version) Control 3
2 Related work
In this paper we present a version control system, named SheetGit. The initialideas that motivated the development of this tool were presented in a preliminaryworkshop paper [12]. We now present in great detail SheetGit, we extend thevisual interface of the tool, and we present a validation of our approach and tool.
Microsoft Excel’s official approach, which they simply call History, is avail-able solely on the Windows platform. However, it is limited to spreadsheetshosted on Microsoft Sharepoint, so one cannot make use of it without beingonline, but it does allow collaboration between users. Versions are saved auto-matically when the user saves the document; Excel will either create a completelynew version or merge the changes with the last one, with unknown criteria.
One of the important features in version control is the ability to see thedifferences between versions of a file, but Excel does not have such a feature.
It is worth noting that Microsoft has actually developed an official tool todetect spreadsheet differences called Spreadsheet Compare6 that comes alongsidesome versions of Excel 2013 and 2016 in Windows. It works as an externaltool and can function without having Excel itself open, having no integrationwith Excel’s version control system. In Spreadsheet Compare, spreadsheets aredisplayed side-by-side without their formatting, and depending on the type ofchange, have specific colors highlight the altered cells. Unfortunately, there isno easy way to detect changes to entire rows and columns, as sometimes theprogram’s algorithm merely sees them as regular changed cell values. While thatis indeed correct, it is not very useful for users as it does not represent whathappened in reality. When it does detect row/column changes, it adds them tothe list of all changes, but does not specifically show that in the spreadsheets.
Coopy7 is a spreadsheet version control tool which supports showing differ-ences, patching, merging and conflict resolution on spreadsheets and databasetables. It is separated from spreadsheet programs, and focuses on keeping data insynchronization with various people across multiple spreadsheet technologies byconverting the worksheets to an intermediate format called CSVS. This CSVSformat is based on the well known CSV format but with support for multi-ple worksheets per file, unambiguous header rows, and a clear representation ofNULL. While Coopy does have a large feature-set, its interface is aimed more to-wards professional programmers with its use of concepts, information and syntaxprobably difficult for end users to know.
The revision history system of Google Sheets8 is very powerful. It beginsfunctioning immediately upon creating a new spreadsheet and automaticallycommits a new version whenever a new change is made. If various changes aredone in a short period of time, Google Sheets may aggregate the changes intoa single commit. In the Revision History page, one is able to see a list of all
6 https://support.office.com/en-us/article/overview-of-spreadsheet-compare-13fafa61-62aa-451b-8674-242ce5f2c986
7 http://share.find.coop8 https://www.google.com/sheets/about/

4 J. N. Macedo et al.
versions right next to the actual spreadsheet, each having the list of people whoedited the spreadsheet in that particular version and their unique color. Uponclicking one of the versions, the spreadsheet will change to show that particularpoint in history but in a gray-scale color scheme; the cells that were edited insome fashion will be tinted with the unique color of their author.
XLTools9 is a suite of various utilities for Microsoft Excel all in one VSTOadd-in, one of them being called Version Control. This tool can create a localGit repository for the active workbook, where committing can be done eithermanually or automatically when saving; commit messages can also be added. Theuser also has access to the list of revisions, where they can choose to compareor save individual worksheets. However, there is no option to directly restoreto a previous version. One has to save the file somewhere and then overwritethe original when Excel is closed, as the original cannot be overwritten whileExcel and the add-on are open. Despite using Git, the system is fully local andhas no collaboration features. Spreadsheet comparing can only be applied to oneworksheet at a time. This will open a new Excel window with both old and newspreadsheets, having the new cell values tinted in red and its text in bold. Thetool does not detect formatting changes and merely detects the actual cell value,and since formatting when comparing sheets is not changed, if one is unfortunateenough to have the same red cell formatting as the add-on uses, edited cells inthe document may be confused with cells that were never touched.
Xltrail10 is a recently created program that provides version control in spread-sheets. It is not directly integrated with Excel, it instead functions by creatinga folder in the operating system that will be monitored by the program. Anyspreadsheets placed in it become versioned, and when they are edited, the pro-gram will detect the changes and create a new version appropriately. It can alsowork through the cloud by detecting changes on Dropbox or Sharepoint accounts.In this case one would not need to download their personal client. Versions arekept in a linear format, much like Microsoft Excel. The service provides diffing,in a similar way to Coopy’s highlighter format. Xltrail does not work withoutan internet connection nor does it support branching and merging.
Table 1 presents an overview of the features implemented by all tools.
Table 1. Table comparing SheetGit features with existing tools
Tool Commit Diff Merge Branch Collaboration Offline
SheetGit yes yes yes yes yes yesMicrosoft Excel yes no no no yes no
Spreadsheet Compare no yes no no no noCoopy no yes yes no no yes
Google Sheet yes yes no no yes noXLTools yes yes no no no yes
xltrail yes yes no no yes no
9 https://xltools.net10 http://xltrail.com

Get Your Spreadsheets Under (Version) Control 5
3 The SheetGit Tool
In this section we describe several features for version control for spreadsheetsand introduce SheetGit. We have created our solution as an Excel add-into keep it as closely knit to Excel as possible, as this potentially increases itsacceptance among spreadsheet developers as opposed to have to be run as anexternal tool. This will also enable us to present information directly in theactive spreadsheet, and grant us access to Excel’s proprietary file formats.
3.1 Technological Choices
Fig. 1. SheetGit’s taskpane, displaying variouscommits
There are two main types of add-ins for Excel: i)the Visual Studio Tools for Office (VSTO), add-insmade with C# or Visual Basic, and ii) the new typeMicrosoft calls Office add-ins. The latter are simplyweb pages that can interact with the documents us-ing an API in Javascript. They are sandboxed andless closely integrated with Office, making them morerestrictive than VSTO add-ins, but in exchange, theywould also work in Excel for browsers.
We chose to create an VSTO add-in instead of us-ing the new Javascript API, because we find the APInot powerful enough for what we intend to create.We ultimately want the add-in to start immediatelywhen Excel is ran so there is no risk of the users for-getting to enable the add-in, possibly losing data as aresult, something that is not possible in the Javascriptadd-ins due to their sandboxed nature. As a result,our solution will only support Microsoft Excel in theWindows platforms.
The add-in consists of a self-contained task pane,as seen in Figure 1, that includes an embeddedbrowser to allow us to make use of Javascript, whileretaining the advantages of VSTO add-ins. Our ver-sion tree is created using Gitgraph.js11, a Javascriptlibrary. We use Bitbucket12 in the background to actually manage the differentversions of the spreadsheet, that is, each commit is actually stored in a privateBitbucket repository as a new file.
3.2 SheetGit Capabilities
We implemented a set of fundamental features: committing versions, switchingbetween commits/versions, the option to see the actual differences between twoversions, merge two different commits, and sharing these between various people.
11 http://gitgraphjs.com12 https://bitbucket.org

6 J. N. Macedo et al.
Committing One of the most important features of a version control systemis to organize the history of the commits done by the different users. In ourparticular case a commit is a set of changes in a workbook that occurred sincethe last commit until the next one. These commits can be done automatically(each time the user saves the file), or manually (when the user decides to committhe changes). A commit can also be called a version of the spreadsheet.
The list of commits, or versions, is displayed in a tree format, as shown inFigure 1. We use a tree because of its simplicity and adaptability, allowing foran intuitive graphical representation of many version control functions such asbranches and merges. Very popular version control services such as Github13 orBitbucket also make use of a tree structure to display their version lists. Thecommits are placed chronologically, with the topmost being the oldest and thebottom most the youngest.
The large white commit is the currently active version, meaning it is thespreadsheet the user is seeing. A user can click in a desired commit in the tree,and the workbook will change so it is in the state of the particular versionselected. In this case, the user restored his spreadsheet to a previous version, soit is not the most recent version of the spreadsheet.
By default, commits are generated automatically, reducing the burden onthe user. By using metrics such as time since last edit and amount of dataentered into the workbook, we combine various commits into blocks such thatthe end result may be indifferent to the user. In fact, Google Sheets has a similarbehavior. An option to enable manual commits has also been added, for moreexperienced users who know better when to actually commit changes.
Each commit is associated with an optional commit message, auto-generatedversion number, and an automatically generated summary of the changes, whichis shown upon hovering a commit dot in the tree as illustrated in the text boxdisplayed in Figure 1.
Even though these messages are automatically generated, the user has alwaysthe possibility of editing such message by clicking and directly editing it. Nextwe list some of the messages shown for particular changes (the message shouldbe self explanatory, c being a cell address, v a value, col a column letter, rowa row number, and color a color): Cell c = v ; Deleted cell c content; Deletedcolumn col ; Inserted row row ; Cell c = color tinted.
Note that the formatting changes are also recorded and displayed. This isnecessary in spreadsheets as they are naturally visual tools. This is a featurenone of the professional version control systems hold.
Showing Differences Between Commits To make an easy to understandcomparison in complex spreadsheets, SheetGit presents a slider between twoconsecutive commits. Dragging the slider from one commit to the other displaysthe individual differences (e.g. cell changes) between them, one at a time. Thisallows the user to see the differences step-by-step rather than being overwhelmed
13 https://github.com

Get Your Spreadsheets Under (Version) Control 7
with all of them at the same time. This scales well with spreadsheet size andcomplexity as long as the user controls the speed of traversing the timeline.
Fig. 2. Comparison betweentwo versions in SheetGit
An option to skip to certain cells of the compari-son also helps in this regard. The differences thatare shown as the user moves through the timelineare also appropriately highlighted in the spread-sheet as one needs to be able to tell it apart fromthe rest of the spreadsheet. This can be done forexample by changing the affected areas color orby drawing a circle around it.
In SheetGit, the Diff Pane, as shown in Fig-ure 2, contains all functionality related to view-ing differences between two versions.
The slider moves through each cell that hasdifferences between the two versions. The two di-rectional buttons move the slider up and down,one step at a time, for when more precision is re-quired and because some users may favor click-ing buttons rather than dragging the slider.
Collaborative Development Version controlsystems are a great incentive for collaborativework. Thus, the visualization of the commitsmust reflect the changes introduced by the differ-ent users. To do so, our tree has a different colorfor each user working in a particular spreadsheet.
Moreover, in order to organize the collabora-tive development, each user gets his own branchso such particular development can be donewithout interfering with the main development.Branches other than the main one are thus colored with the user’s color, signal-ing the respective author’s ownership. Thus, the commits are shown as coloreddots in the tree, each color uniquely representing the commit’s author. This canbe seen in Figure 1, where two different colors signal that two different authorscollaborated on the same spreadsheet.
Each user can have more than one branch. For instance, if the user begins toedit the spreadsheet from an older version (recall the last version is the bottomdot in the line), it will be created a new branch for the forthcoming commits.
Merging Since each user has its own branch, at some point she/he may desire tointegrate her/his changes in the main branch. When done, this will be displayedin the tree structure in an analogous way to the new branch, as illustrated inFigure 1, where the red author performed merges twice over the developmentcycle. These merges are signaled by the red line joining the main branch.

8 J. N. Macedo et al.
4.8. AVAILABILITY
Figure 4.8: Resolving conflicts in SheetGit
31
Fig. 3. Example of conflict when merging with SheetGit: When a new branch wascreated the original value of the conflicting cell was 86.7. Then, in the new branch (B)that cell changed to 26.0, while it was also changed in the main branch/trunk (T) to65.0. Thus, a conflict occurs when merging the branches.
To make the development process easier for end user, we decided that it is notpossible to merge changes between branches from different users. Nevertheless,it is possible to merge branches from the same user.
In some cases, conflicts may happen when merging to the main branch. Inthese cases two situations may occur. First, if there are concurrent changes tocells, the user must solve the conflicts by hand, that is, he/she must decide whichversion goes to the main branch. SheetGit will show the possible solutions,allowing the user to choose the intended one, as displayed in Figure 3. The secondsituation occurs when the changes are in different cells. In this case, all the cellswill be integrated in the spreadsheet without the need for user intervention.
SheetGit is available at http://spreadsheetsunl.github.io/sheetgit.
4 Empirical Evaluation
The aim of our study is to evaluate the effectiveness and efficiency of users usingSheetGit when compared to the use of Excel and Spreadsheet Compare.
4.1 Study Design
Hypotheses. With this study we intend to test two hypotheses:
1. In order to perform a given set of tasks, users spent less time when usingSheetGit instead of using only Excel and Spreadsheet Compare.
2. Spreadsheets used with the support of SheetGit have a correctness gradehigher than using only Excel and Spreadsheet Compare.
Formally, the two hypotheses being tested are: HT for the time that is neededto perform a given set of tasks, and HC for the correctness grade found indifferent types of spreadsheets. They are respectively formulated as follows:
1. Null hypothesis. HT0. The time to perform a given set of tasks using
SheetGit is not less than that taken using Excel and Spreadsheet Compare.HT0 : µd ≤ 0, where µd is the expected mean of the time differences.Alternative hypothesis. HT1
: µd > 0. The time to perform a given set oftasks using SheetGit is less than using Excel and Spreadsheet Compare.Measures needed. Time taken to perform the tasks.
Get Your Spreadsheets Under (Version) Control 9
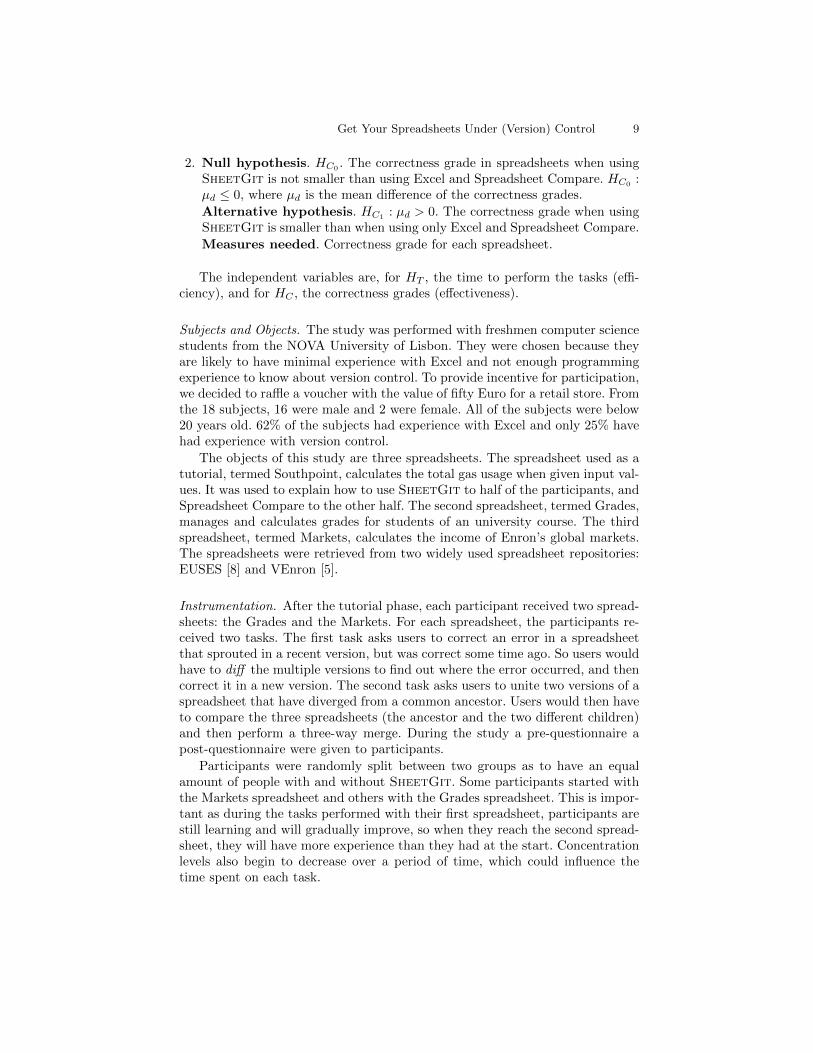
2. Null hypothesis. HC0. The correctness grade in spreadsheets when using
SheetGit is not smaller than using Excel and Spreadsheet Compare. HC0:
µd ≤ 0, where µd is the mean difference of the correctness grades.
Alternative hypothesis. HC1: µd > 0. The correctness grade when using
SheetGit is smaller than when using only Excel and Spreadsheet Compare.
Measures needed. Correctness grade for each spreadsheet.
The independent variables are, for HT , the time to perform the tasks (effi-ciency), and for HC , the correctness grades (effectiveness).
Subjects and Objects. The study was performed with freshmen computer sciencestudents from the NOVA University of Lisbon. They were chosen because theyare likely to have minimal experience with Excel and not enough programmingexperience to know about version control. To provide incentive for participation,we decided to raffle a voucher with the value of fifty Euro for a retail store. Fromthe 18 subjects, 16 were male and 2 were female. All of the subjects were below20 years old. 62% of the subjects had experience with Excel and only 25% havehad experience with version control.
The objects of this study are three spreadsheets. The spreadsheet used as atutorial, termed Southpoint, calculates the total gas usage when given input val-ues. It was used to explain how to use SheetGit to half of the participants, andSpreadsheet Compare to the other half. The second spreadsheet, termed Grades,manages and calculates grades for students of an university course. The thirdspreadsheet, termed Markets, calculates the income of Enron’s global markets.The spreadsheets were retrieved from two widely used spreadsheet repositories:EUSES [8] and VEnron [5].
Instrumentation. After the tutorial phase, each participant received two spread-sheets: the Grades and the Markets. For each spreadsheet, the participants re-ceived two tasks. The first task asks users to correct an error in a spreadsheetthat sprouted in a recent version, but was correct some time ago. So users wouldhave to diff the multiple versions to find out where the error occurred, and thencorrect it in a new version. The second task asks users to unite two versions of aspreadsheet that have diverged from a common ancestor. Users would then haveto compare the three spreadsheets (the ancestor and the two different children)and then perform a three-way merge. During the study a pre-questionnaire apost-questionnaire were given to participants.
Participants were randomly split between two groups as to have an equalamount of people with and without SheetGit. Some participants started withthe Markets spreadsheet and others with the Grades spreadsheet. This is impor-tant as during the tasks performed with their first spreadsheet, participants arestill learning and will gradually improve, so when they reach the second spread-sheet, they will have more experience than they had at the start. Concentrationlevels also begin to decrease over a period of time, which could influence thetime spent on each task.

10 J. N. Macedo et al.
Fig. 4. Box plots for the Grades tasks time (first/second task on the left/right chart).
Fig. 5. Box plots for the Markets tasks time (first/second task on the left/right chart).
4.2 Results Analysis
Time spent (efficiency). There are noticeable differences in the time the par-ticipants used to perform the study. Figure 4 shows the time it took for theparticipants to perform Grades spreadsheet tasks. The Y axis contains the timein seconds and the X axis defines if SheetGit (box with label true) or Spread-sheet Compare was used (box with label false).
Figure 5 presents the times for the Markets spreadsheet.
Correctness grade (effectiveness). In regards to correctness, we divided the typeof errors participants could perform into two categories: having incorrect valuesinputted in the correct version and inputting the correct values in a wrongversion. As such, the bar chart in Figure 6a shows the number of participantswho committed the former error, while Figure 6b the latter. The charts show allthe spreadsheets’ results together.

Get Your Spreadsheets Under (Version) Control 11
(a) Wrong values in the right version. (b) Correct values in wrong version.
Fig. 6. Errors produced by the participants.
Hypothesis Testing. To test our hypothesis on efficiency, we ran a Welch unequalvariances t-test to determine if there is any statistical significance [10].
For Grades task 1, p = 0.682, task 2, p = 0.001, and for Markets task 1,p = 0.116, task 2, p = 0.004.
We also calculated Cohen’s d to determine our effect size [10].For Grades task 1 the results if 0.196974, task 2 2.499612, and for Markets
task 1 0.784395, task 2 1.819253.
Comparison of times. From the t-test results we can deduce that only task 2has statistical significance for both spreadsheets. For the task 1, there was nostatistical significance within the study.
Through Cohen’s d we can see that in task 2 for both spreadsheets thedifference between the two means can be classified as very large (> 0.8). SoSheetGit in these tasks helped the participants in a scale of more than onestandard deviation, which is very impressive.
Comparison of correctness. A couple of different tests were conducted, suchas the Pearson Chi-Square and Fisher’s Exact Test but no statistical relevancecould be found, mostly due to the low count of errors in both cases.
4.3 Results Interpretation
The results from the analysis suggest that SheetGit does improve user per-formance while performing these tasks. The second task, related to merging inversion control, had strong statistical relevance, being noticeably superior overnot using SheetGit. This is likely because SheetGit actually introduces anew method that directly aids users in the merging process. An example wouldbe how it pinpoints conflicting cells while the counterpart users would have tosearch for them manually. SheetGit also automates parts of the merging pro-cess when possible to perform decisions without user input, which helps greatlylower the time, difficulty and possibility of errors within the task.

12 J. N. Macedo et al.
Regarding the first task, related to diffing and correcting errors, there wasno statistical significance found, though the average time required to solve thetask was inferior for SheetGit users. This is likely because while SheetGitallows one to move between versions and diff without changing windows, it isnot that much faster than performing a diff with Spreadsheet Compare. Evenif the interface proves to be simpler, both sides of the participants receivedtutorials for their tools, so provided they understood the tool, it would be likelyfor the difference to be small. The results can also be attributed to the fact thatthere were few versions to compare, which can provide an edge to SpreadsheetCompare, which displays all differences between two versions instantaneously.SheetGit instead shows the changes one by one, though it can group changesfrom multiple versions in a single diff. In this scenario, SheetGit would likelybe even faster because those without it would have to navigate through menusseveral times to change the versions to compare.
While no statistical relevance was obtained from analyzing the correctness ofthe tasks, SheetGit had less errors in terms of wrong values overall. This maybe because of the unified interface, all inside Excel, which keeps the users focusedand can lead to less human error. The lower average time when performing thetasks would also help in terms of focus. It is interesting to note that SheetGitdid indeed have more errors when it comes to users inputting the correct values,but in wrong versions. What this means is that they corrected what error theyhad to find, but in an old version. So the new resulting version did not haveany of the changes that occurred between that old version and the latest. All ofthese errors occurred in the exact version where the error had, which means theusers just did not return to the latest version to correct it there.
4.4 Threats to validity
A few threats to validity deserve being analyzed.Regarding internal validity, in order to minimize any effects on the indepen-
dent variables that would reflect on the causality, several actions were taken.First, half the participants started with the Markets spreadsheet, and the otherhalf with Grades. This would minimize any learning effects from happeningthroughout the session. Second, the study was intentionally short in order toprevent the participants from losing focus while performing their tasks. Third,the study was performed over two sessions, one in which half the participantsused SheetGit and the other where the latter half did not. Fourth, all partici-pants executed the exact same tasks, so no group received special treatment.
For conclusion validity, a concern is the low amount of participants, whichleads to a lower statistical power for the study. When calculating the correctnessgrade, we grouped the tasks’ errors together to increase the statistical power.
As for construct validity, participants were informed beforehand that theywere not under any sort of evaluation to guarantee they would not be affectedby the study itself. The tasks we asked the participants to perform are commonissues that are solved by the use of version control, either with or without ourtool, such as merging and diffing spreadsheets. By choosing these sort of tasks,

Get Your Spreadsheets Under (Version) Control 13
our study construct can evaluate whether or not users are more effective andefficient while using SheetGit.
Finally, regarding external validity, related to the strength to generalize theresults of this study to industrial practice, we have selected two spreadsheets fromthe real-world: one from an actual company and another from the EUSES corpus,which in turn retrieved it from a Google search as part of a real-world example.Although the spreadsheets are real-world spreadsheets, the environment is not.Nevertheless, the participants represent a wide range of spreadsheet users, andthus, we believe that results are generalizable.
4.5 Discussion
The empirical study we conducted reveals promising results for SheetGit.Most participants wrote on the post-questionnaire that SheetGit helped themgreatly in performing their tasks and that they thought it was a necessary tool.
Despite that participants had a short amount of time to learn a completelynew perspective on managing backups and versions with our add-in, they ac-complished their tasks on average faster than those that did not use SheetGit.Even if the first task did not achieve statistical significance, the users did in factfinish on average faster than those without SheetGit, which is impressive if oneconsiders that they had to learn a new interface and perspective on Excel. Thatsaid, it could be faster by, for example, giving ahead of time a small highlight toevery cell that would be changed. This way, users have a much better notion ofthe version in its entirety and the train of thought behind the changes.
Regarding errors, most found were related to users correcting errors on ver-sions that were not the latest. This may be due to a lack of understanding orjust an honest mistake due to the seamless nature of the interface, as this sortof situation happened even with users that finished both tasks fairly fast andotherwise correctly. A warning could be shown in case changes are attemptedon versions that are not the latest to prevent this sort of error. The version treecould also be better labeled, much like SheetGit’s diff tab, which has a detailedexplanation of its functionality and appearance directly on the interface.
5 Conclusion
Spreadsheets are the most used programming environment in the world. How-ever, they still lack many of the advanced features that modern programmingenvironments offer, and in particular lack a proper version control system. Wechose to alleviate this problem by bringing SheetGit to Excel. SheetGit func-tions as an integrated add-in for Excel and aids users by providing various func-tionalities of version control, such as automated version creation, collaboration,version comparison, and uniting two versions together in one spreadsheet. Weoffer all these features directly in Excel in a graphical and intuitive manner.
The empirical validation we performed showed that SheetGit does improvethe users’ efficiency when performing some tasks, while receiving praise from theparticipants for its concept, ease of use and necessity in the spreadsheet world.

14 J. N. Macedo et al.
Version control systems still have some features which were not included inSheetGit such as cherry picking, rebase and many others. But careful consid-eration must be put into these more advanced control versions features as theymust be abstracted and adapted to spreadsheets and their end-user developers.Otherwise the user interface will just become more complex which is against theoriginal purpose of the application. As future work we plan to study how suchadvanced features can be incorporated to SheetGit.
References
1. Abraham, R., Erwig, M.: Autotest: A tool for automatic test case generation inspreadsheets. In: Proceedings of the 2006 IEEE Symposium on Visual Languagesand Human-Centric Computing (VL/HCC ’06). pp. 43–50. IEEE CS (2006)
2. Abraham, R., Erwig, M.: Mutation operators for spreadsheets. IEEE Trans. Soft-ware Eng 35(1), 94–108 (2009), http://dx.doi.org/10.1109/TSE.2008.73
3. Bradley, L., McDaid, K.: Using bayesian statistical methods to determine the levelof error in large spreadsheets. In: 31st International Conference on Software Engi-neering. pp. 351–354. IEEE (2009)
4. Cunha, J., Fernandes, J.P., Mendes, J., Saraiva, J.: Embedding, evolution, and val-idation of model-driven spreadsheets. IEEE Transactions on Software Engineering41(3), 241–263 (March 2015). https://doi.org/10.1109/TSE.2014.2361141
5. Dou, W., Xu, L., Cheung, S., Gao, C., Wei, J., Huang, T.: Venron: A versionedspreadsheet corpus and related evolution analysis. In: 2016 IEEE/ACM 38th In-ternational Conference on Software Engineering Companion. pp. 162–171 (2016)
6. Engels, G., Erwig, M.: Classsheets: Automatic generation of spreadsheet applica-tions from object-oriented specifications. In: Procs. of the 20th IEEE/ACM Int.Conf. on Automated Software Engineering. pp. 124–133. ACM (2005)
7. Erwig, M., Burnett, M.: Adding apples and oranges. 4th Int. Symp. on PracticalAspects of Declarative Languages pp. 173–191 (2002)
8. Fisher, M., Rothermel, G.: The euses spreadsheet corpus: A shared resource for sup-porting experimentation with spreadsheet dependability mechanisms. SIGSOFTSoftw. Eng. Notes 30(4), 1–5 (2005)
9. Hermans, F., Murphy-Hill, E.: Enron’s spreadsheets and related emails: A datasetand analysis. In: Proceedings of the 37th International Conference on SoftwareEngineering. pp. 7–16. ICSE ’15, IEEE Press, Piscataway, NJ, USA (2015)
10. Kitchenham, B., Madeyski, L., Budgen, D., Keung, J., Brereton, P., Charters, S.,Gibbs, S., Pohthong, A.: Robust statistical methods for empirical software engi-neering. Empirical Software Engineering 22(2), 579–630 (Apr 2017)
11. Kuttal, S.K., Sarma, A., Rothermel, G.: On the benefits of providing versioningsupport for end users: An empirical study. ACM Trans. Comput.-Hum. Interact.21(2), 9:1–9:43 (Feb 2014). https://doi.org/10.1145/2560016
12. Moreira, R.: Sheetgit: A tool for collaborative spreadsheet development. In: Mi-lazzo, P., Varro, D., Wimmer, M. (eds.) Software Technologies: Applications andFoundations. pp. 415–420. Springer International Publishing, Cham (2016)
13. Scaffidi, C., Shaw, M., Myers, B.: Estimating the numbers of end users and end userprogrammers. In: Visual Languages and Human-Centric Computing, 2005 IEEESymposium on. pp. 207–214 (Sept 2005). https://doi.org/10.1109/VLHCC.2005.34