get in the zone -- how to visualize success quickly
TRANSCRIPT

Grab some coffee and enjoy the pre-show banter before the top of the hour!
The Briefing Room
Get in the Zone – How to Visualize Success Quickly
Twitter Tag: #briefr The Briefing Room
! Reveal the essential characteristics of enterprise software, good and bad
! Provide a forum for detailed analysis of today’s innovative technologies
! Give vendors a chance to explain their product to savvy analysts
! Allow audience members to pose serious questions... and get answers!
Mission
Twitter Tag: #briefr The Briefing Room
Topics
2014 Editorial Calendar at www.insideanalysis.com/webcasts/the-briefing-room
This Month: INNOVATIVE TECHNOLOGY
August: BIG DATA ECOSYSTEM
September: INTEGRATION

Twitter Tag: #briefr The Briefing Room
Analyst: Robin Bloor
Robin Bloor is Chief Analyst at The Bloor Group
[email protected] @robinbloor
Twitter Tag: #briefr The Briefing Room
IBM
! IBM offers a full suite of business analytics products, from BI and dashboards to predictive and advanced analytics
! IBM Cognos includes the Rapidly Adaptive Visualization Engine (RAVE), a flexible and extensible solution designed to enhance insight through advanced visuals and graphics
! RAVE is the engine behind Many Eyes, a free web-based tool that allows users to upload public data sets, create complex visualizations and publish back out to the Web
Twitter Tag: #briefr The Briefing Room
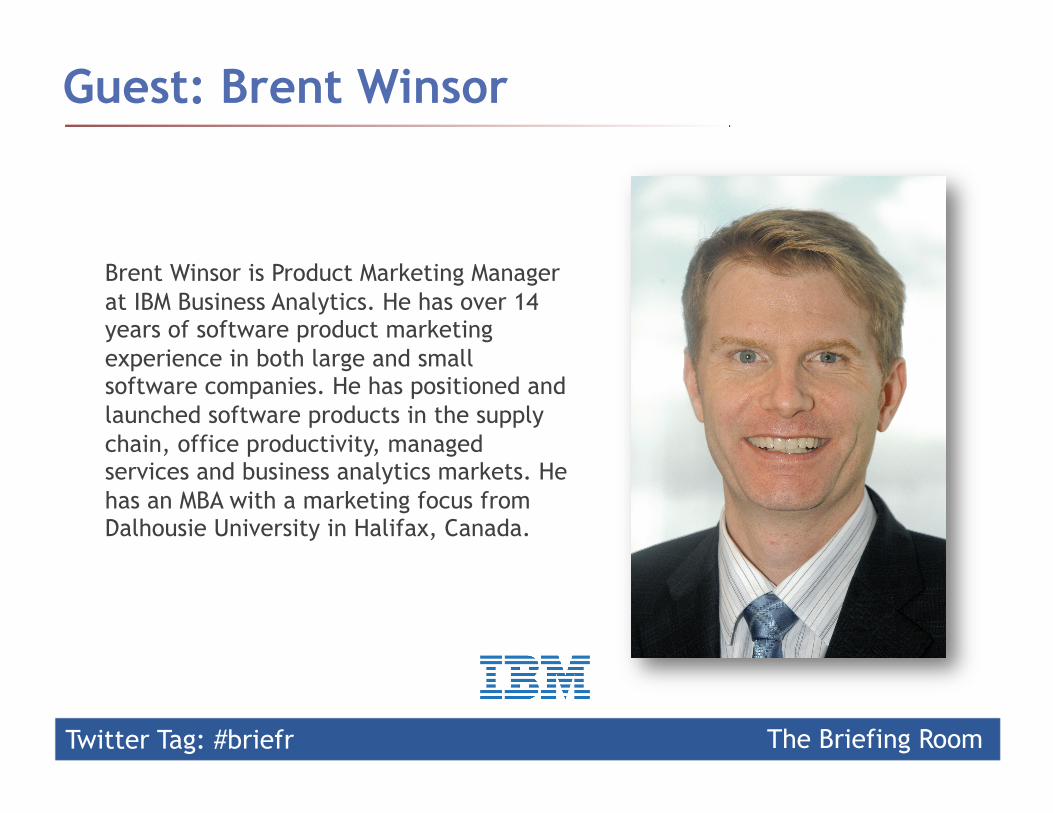
Guest: Brent Winsor
Brent Winsor is Product Marketing Manager at IBM Business Analytics. He has over 14 years of software product marketing experience in both large and small software companies. He has positioned and launched software products in the supply chain, office productivity, managed services and business analytics markets. He has an MBA with a marketing focus from Dalhousie University in Halifax, Canada.
© 2014 IBM Corporation
Visualization – Gaining Value From Your Data
June 17, 2014
© 2014 IBM Corporation 11
GAINING VALUE FROM YOUR DATA
Visualization
Importance of visualization
Understanding data
RAVE extensible visualization
Creating effective visualizations
© 2014 IBM Corporation 12
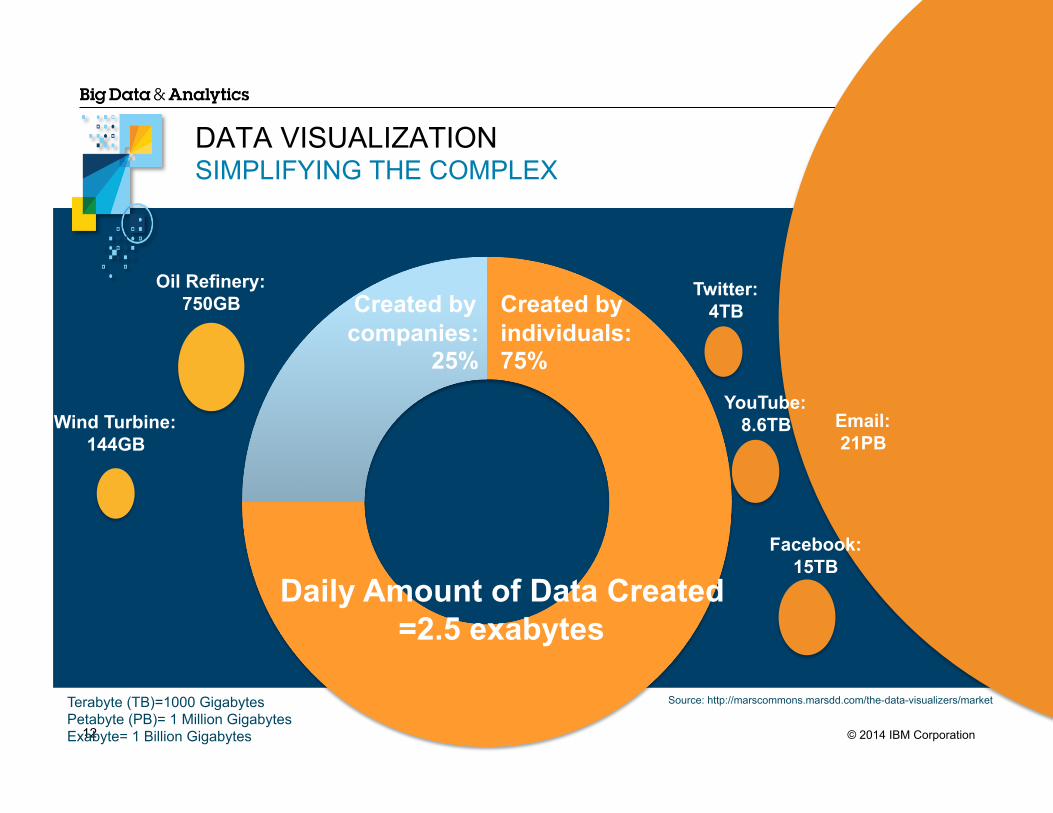
DATA VISUALIZATION SIMPLIFYING THE COMPLEX
Daily Amount of Data Created =2.5 exabytes
Created by companies:
25%
Created by individuals: 75%
Oil Refinery: 750GB
Wind Turbine: 144GB
Twitter: 4TB
YouTube: 8.6TB
Facebook: 15TB
Email: 21PB
Terabyte (TB)=1000 Gigabytes Petabyte (PB)= 1 Million Gigabytes Exabyte= 1 Billion Gigabytes
Source: http://marscommons.marsdd.com/the-data-visualizers/market

© 2014 IBM Corporation 14
VISUALIZING 600,000 TRANSACTIONS
© 2014 IBM Corporation 15
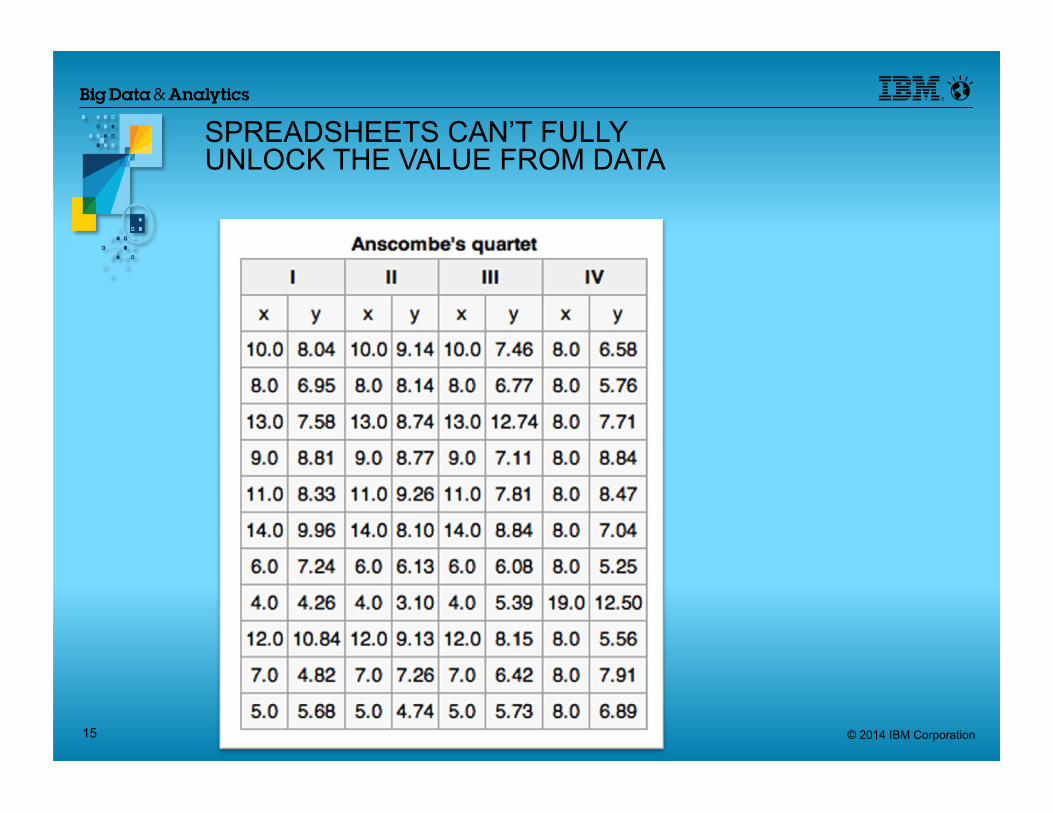
SPREADSHEETS CAN’T FULLY UNLOCK THE VALUE FROM DATA
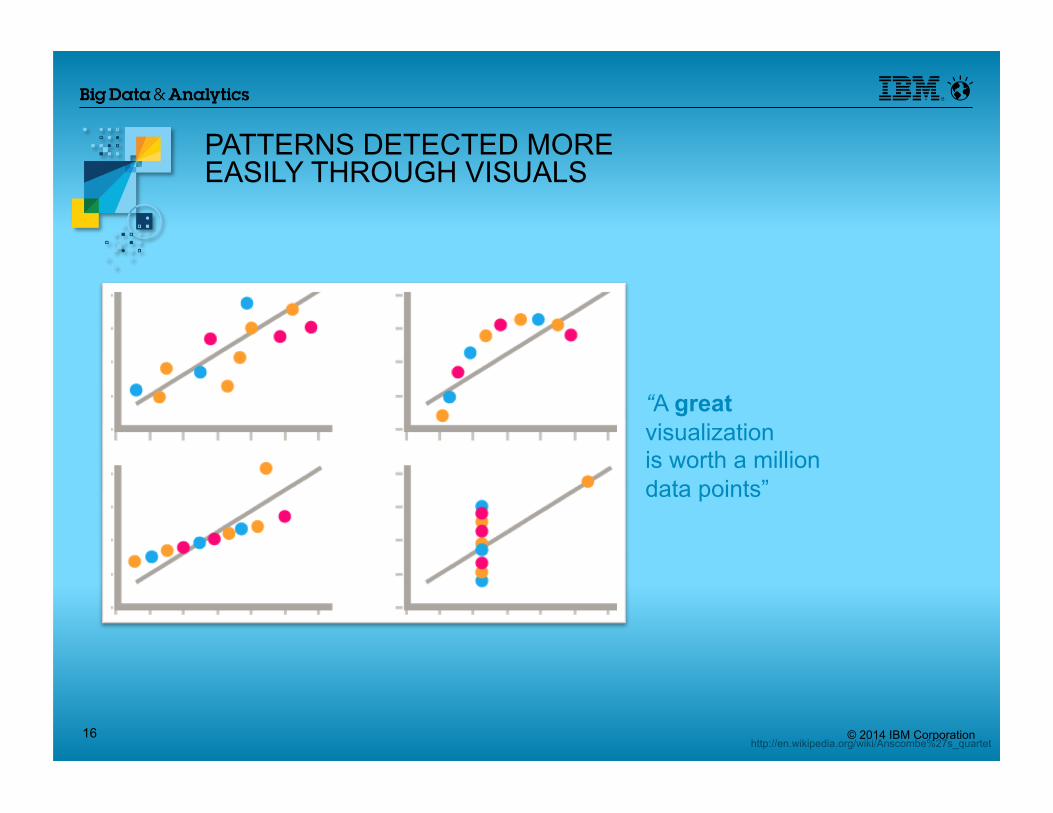
© 2014 IBM Corporation 16
“A great visualization is worth a million data points”
http://en.wikipedia.org/wiki/Anscombe%27s_quartet
PATTERNS DETECTED MORE EASILY THROUGH VISUALS
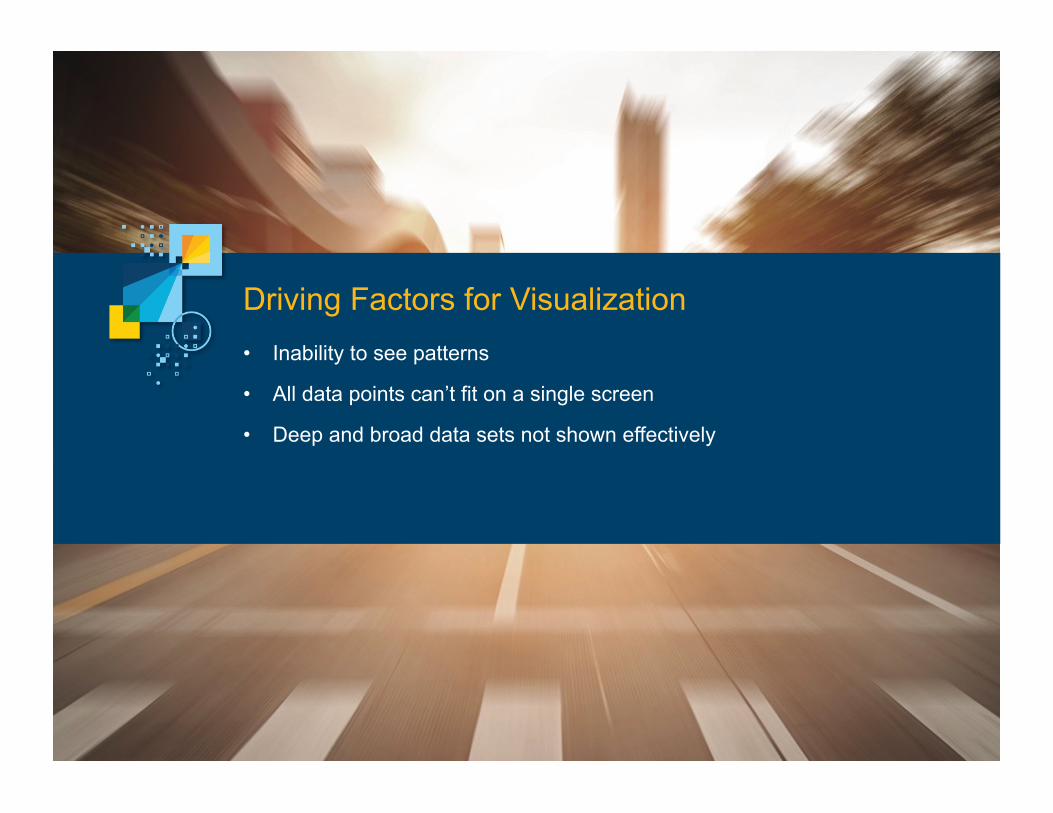
• Inability to see patterns
• All data points can’t fit on a single screen
• Deep and broad data sets not shown effectively
Driving Factors for Visualization
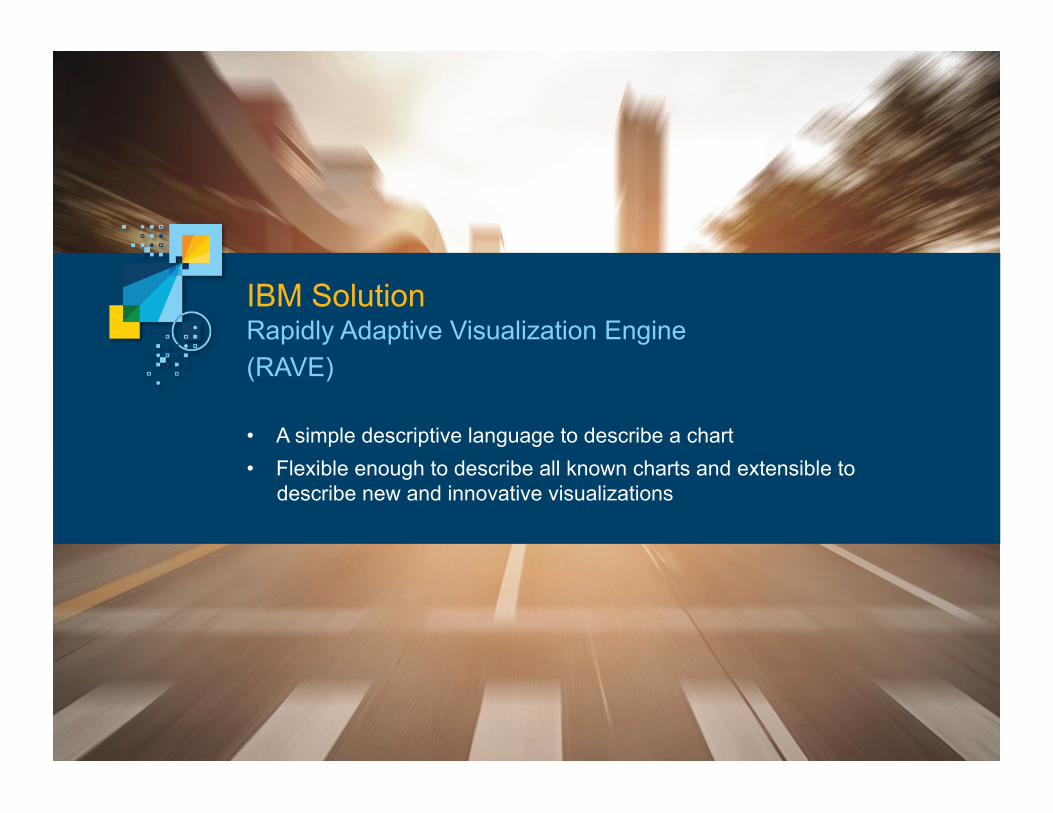
IBM Solution Rapidly Adaptive Visualization Engine (RAVE)
• A simple descriptive language to describe a chart • Flexible enough to describe all known charts and extensible to
describe new and innovative visualizations

© 2014 IBM Corporation 19
SPSS Analytic Catalyst
Cognos Insight
Analytical Decision Management
Cognos Business Intelligence
RAVE– The Engine Driving IBM Visualizations
© 2014 IBM Corporation 20
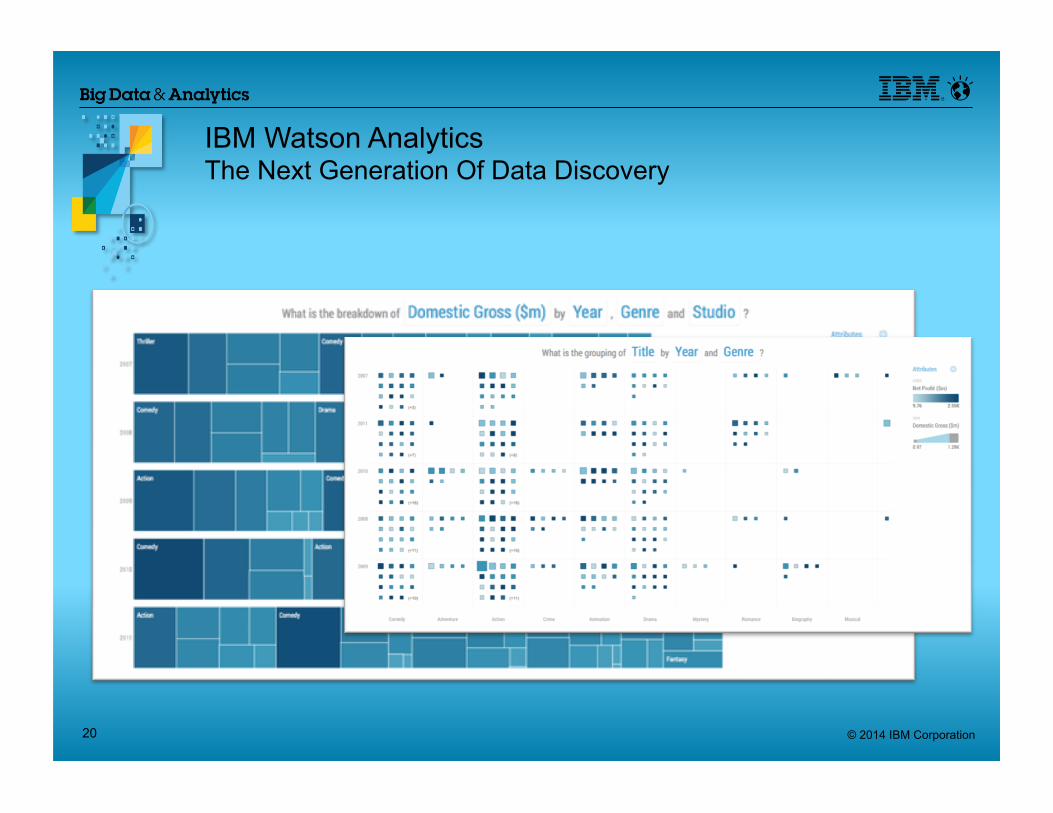
IBM Watson Analytics The Next Generation Of Data Discovery
© 2014 IBM Corporation 21
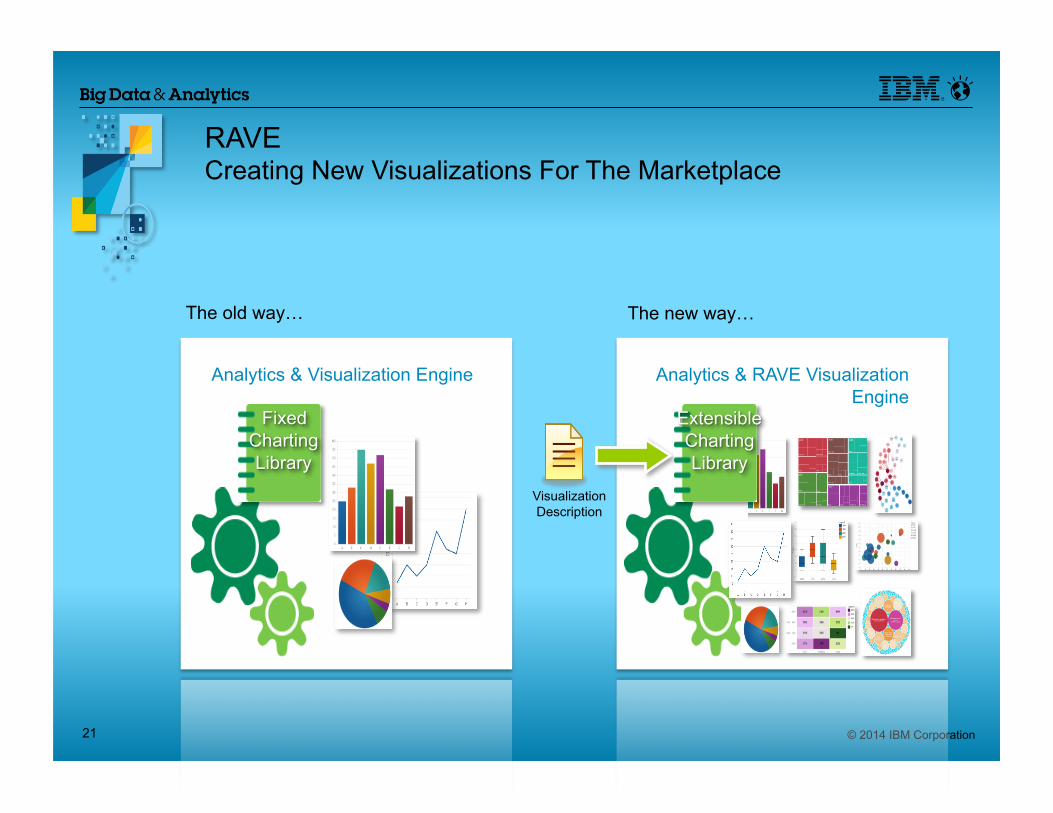
The new way… The old way…
Analytics & Visualization Engine
Visualization Description
Analytics & RAVE Visualization Engine
RAVE Creating New Visualizations For The Marketplace
© 2014 IBM Corporation 22
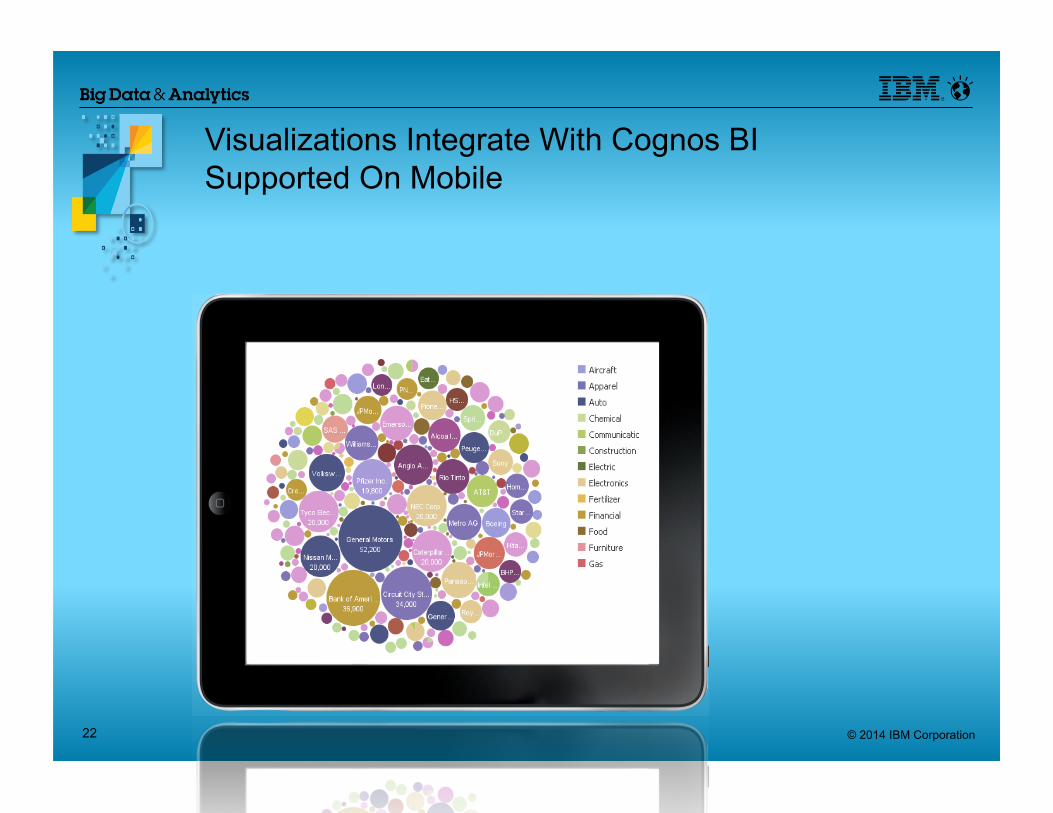
Visualizations Integrate With Cognos BI Supported On Mobile
© 2014 IBM Corporation 23
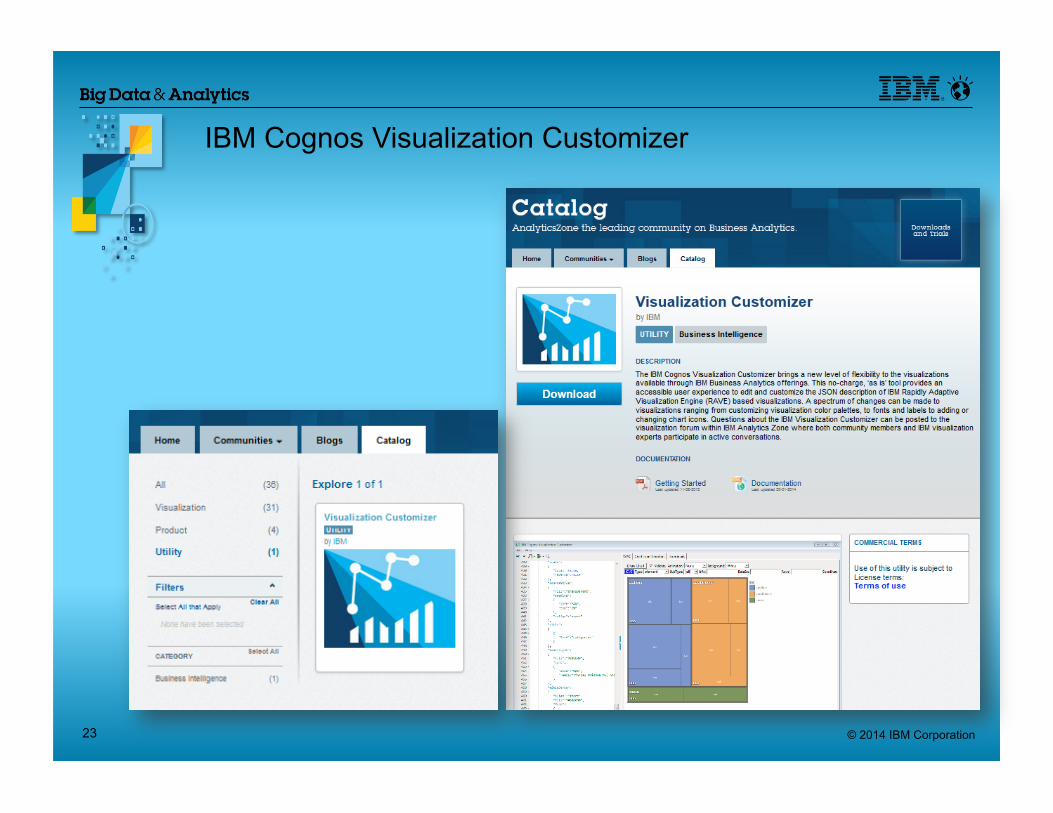
IBM Cognos Visualization Customizer

© 2014 IBM Corporation 24
DEMO - Leveraging RAVE Visualizations in Cognos Business Intelligence
© 2014 IBM Corporation 25
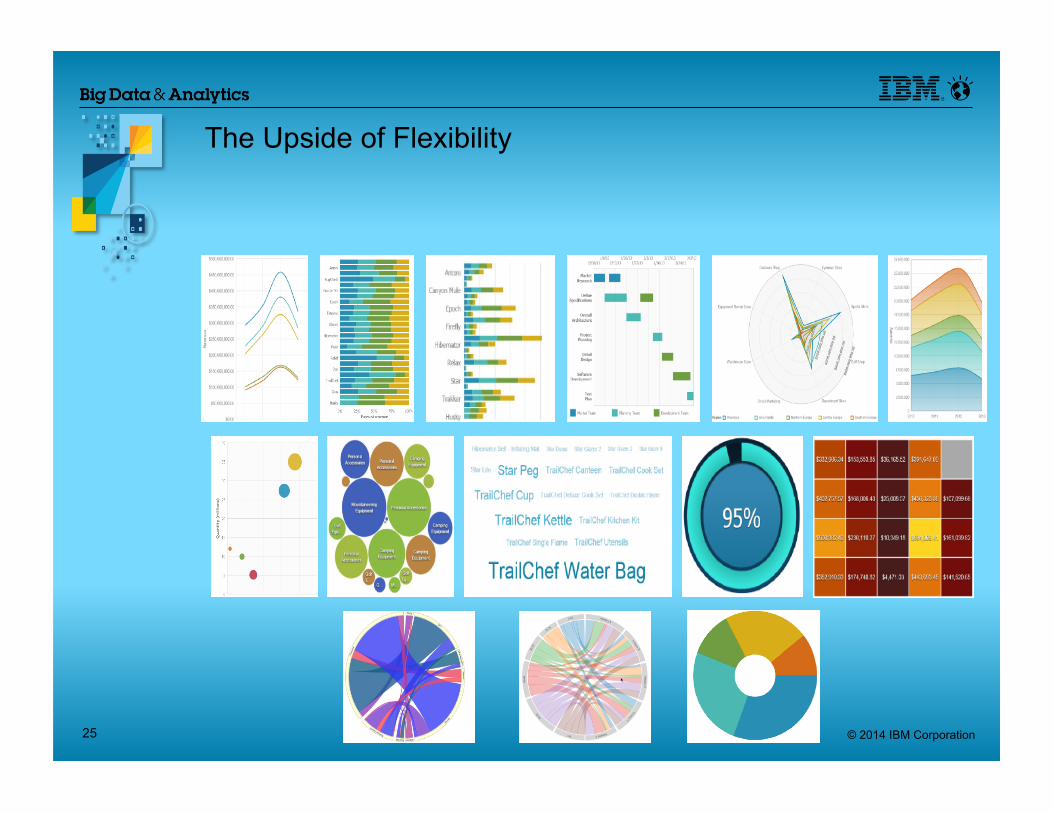
The Upside of Flexibility
© 2014 IBM Corporation 26
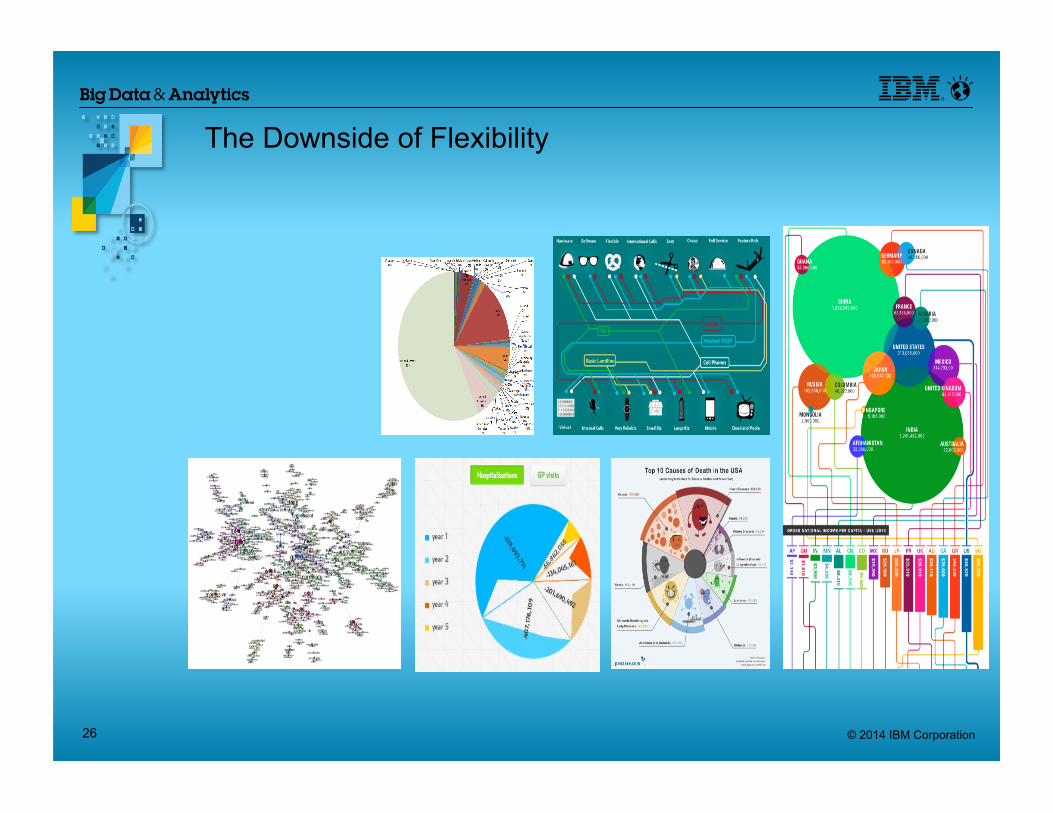
The Downside of Flexibility
© 2014 IBM Corporation 27
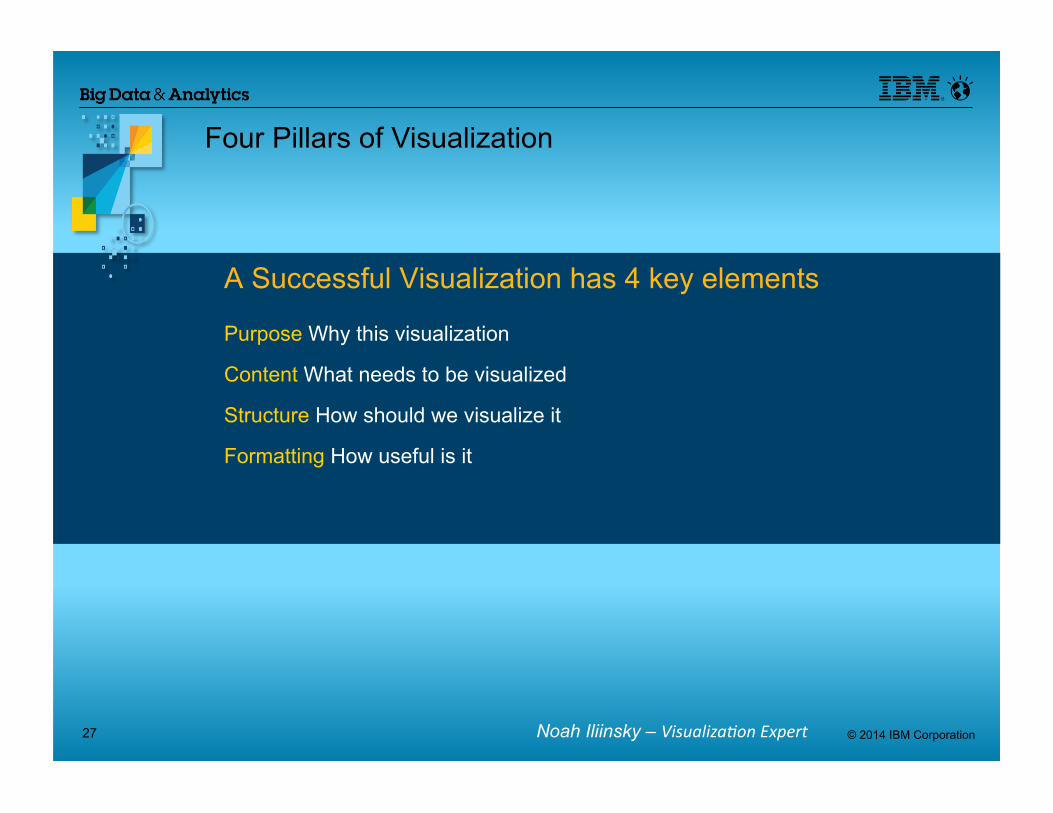
A Successful Visualization has 4 key elements
Purpose Why this visualization
Content What needs to be visualized
Structure How should we visualize it
Formatting How useful is it
Noah Iliinsky – Visualiza(on Expert
Four Pillars of Visualization
© 2014 IBM Corporation 28
Four Pillars of Visualization
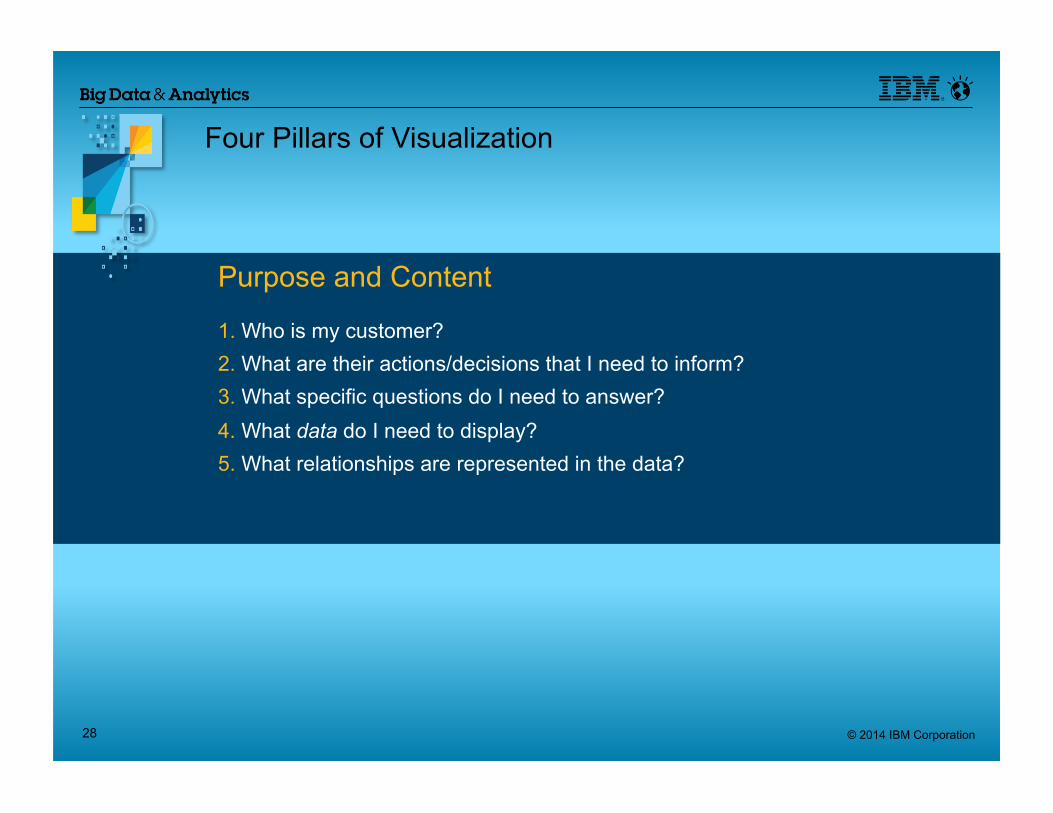
Purpose and Content
1. Who is my customer? 2. What are their actions/decisions that I need to inform? 3. What specific questions do I need to answer? 4. What data do I need to display? 5. What relationships are represented in the data?
© 2014 IBM Corporation 29
Four Pillars of Visualization
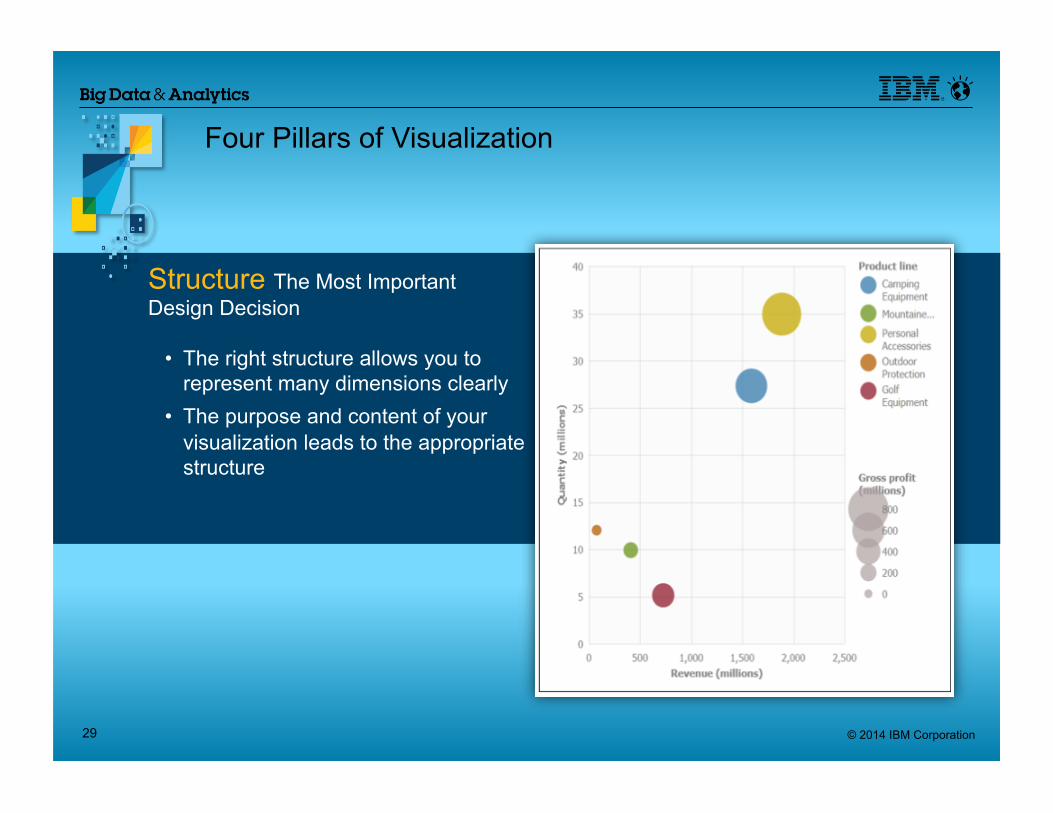
• The right structure allows you to represent many dimensions clearly
• The purpose and content of your visualization leads to the appropriate structure
Structure The Most Important Design Decision
© 2014 IBM Corporation 30
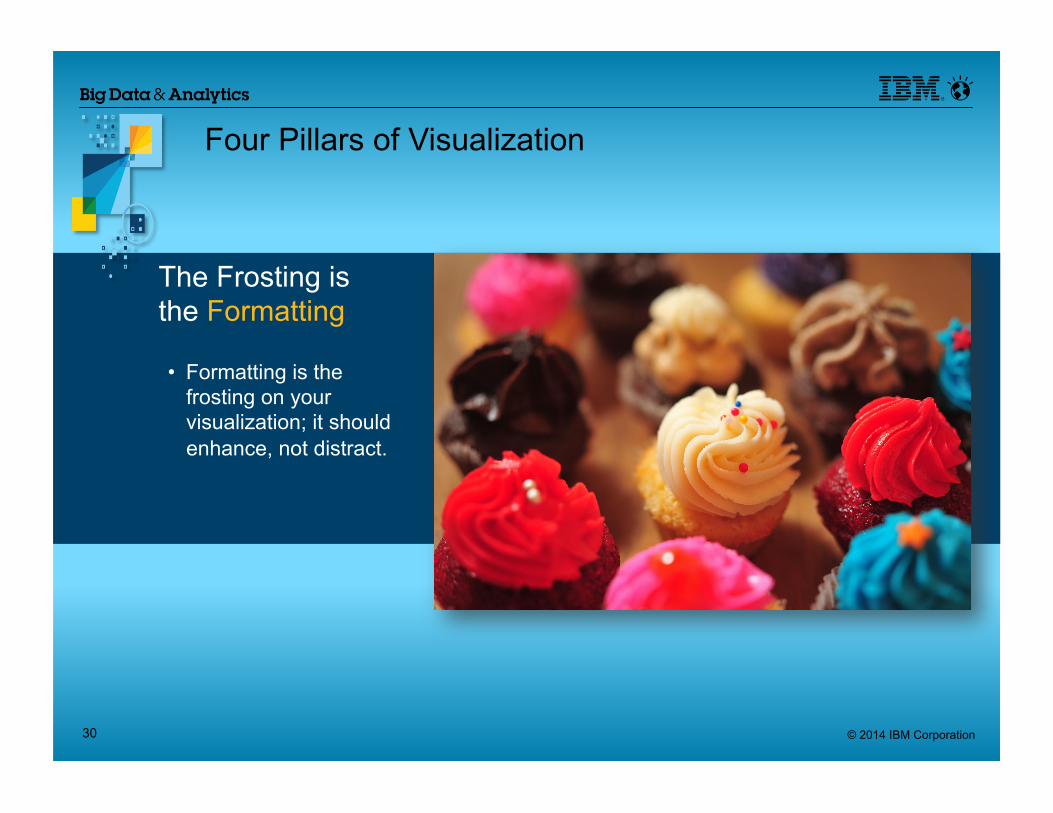
• Formatting is the frosting on your visualization; it should enhance, not distract.
The Frosting is the Formatting
Four Pillars of Visualization
© 2014 IBM Corporation 31
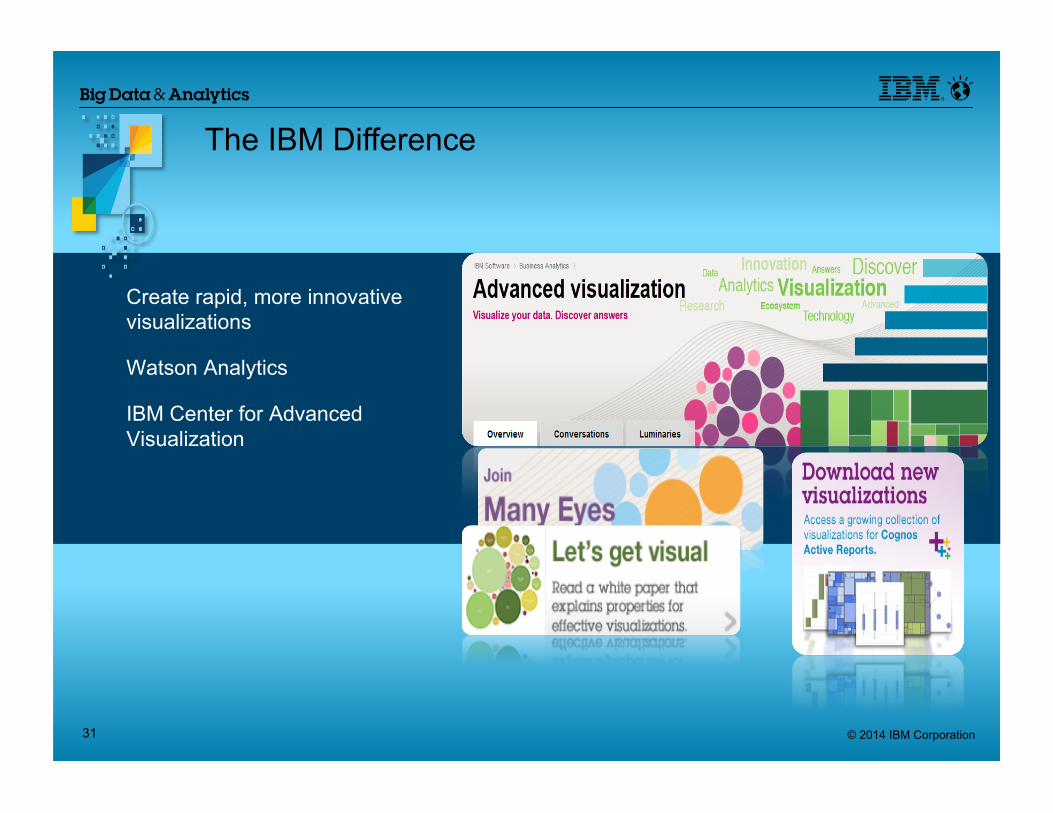
Create rapid, more innovative visualizations
Watson Analytics
IBM Center for Advanced Visualization
The IBM Difference
© 2014 IBM Corporation 32
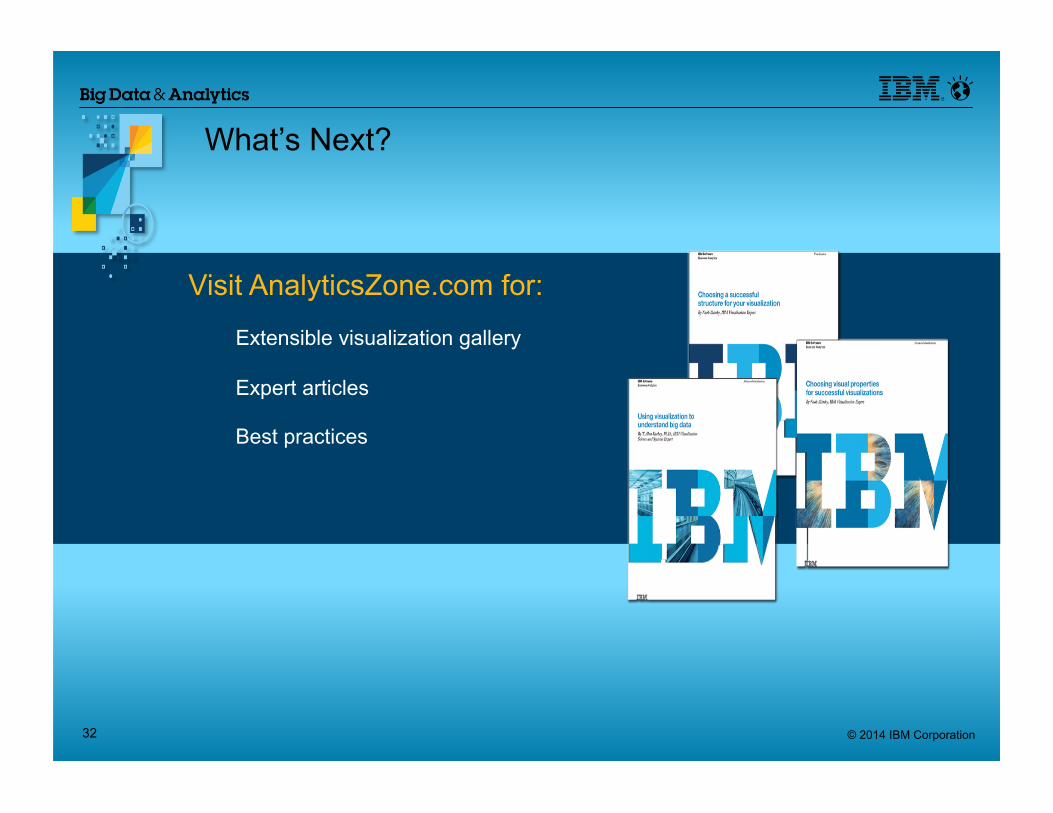
Visit AnalyticsZone.com for:
Extensible visualization gallery
Expert articles
Best practices
What’s Next?
Twitter Tag: #briefr The Briefing Room
Perceptions & Questions
Analyst: Robin Bloor
Twitter Tag: #briefr The Briefing Room
Twitter Tag: #briefr The Briefing Room
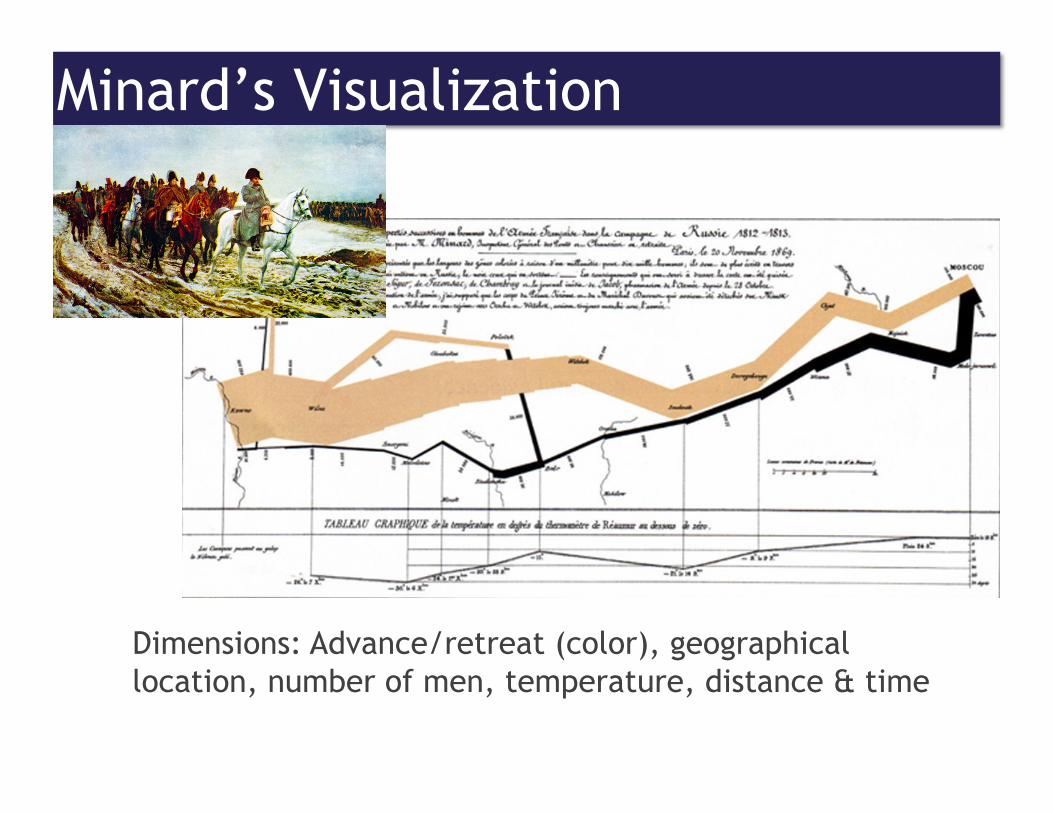
Minard’s Visualization
Dimensions: Advance/retreat (color), geographical location, number of men, temperature, distance & time
Twitter Tag: #briefr The Briefing Room
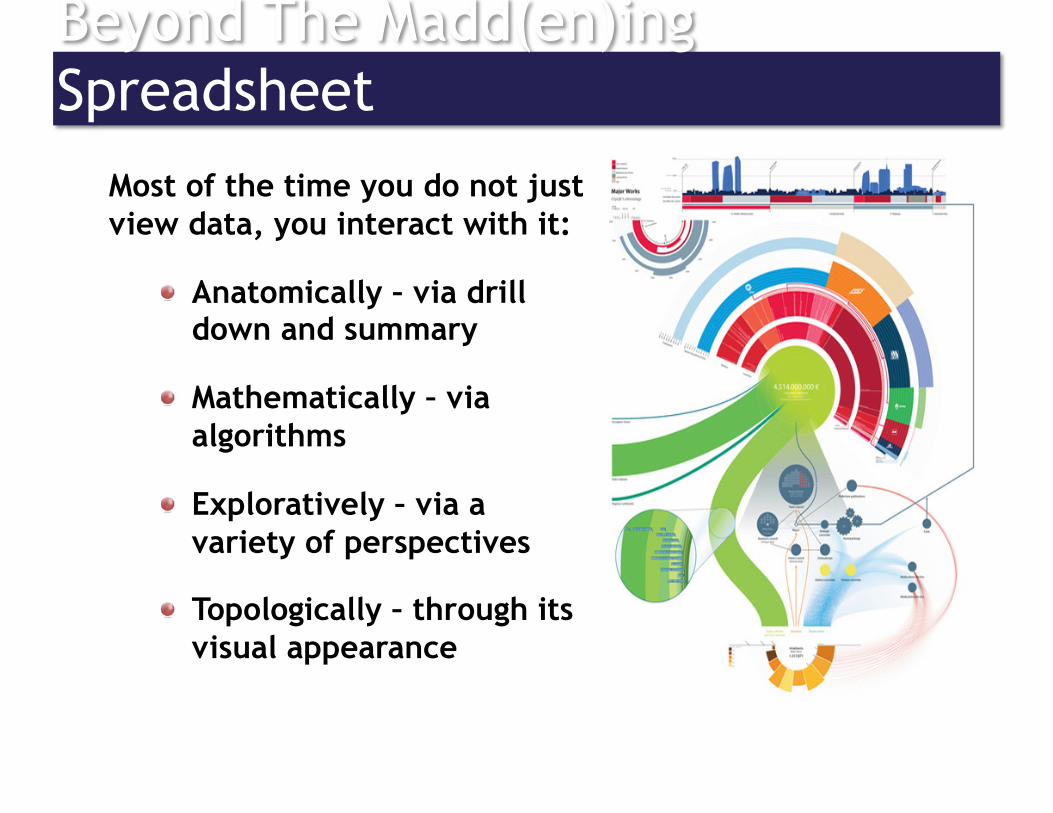
Beyond The Madd(en)ing Spreadsheet
Most of the time you do not just view data, you interact with it:
! Anatomically – via drill down and summary
! Mathematically – via algorithms
! Exploratively – via a variety of perspectives
! Topologically – through its visual appearance
Twitter Tag: #briefr The Briefing Room
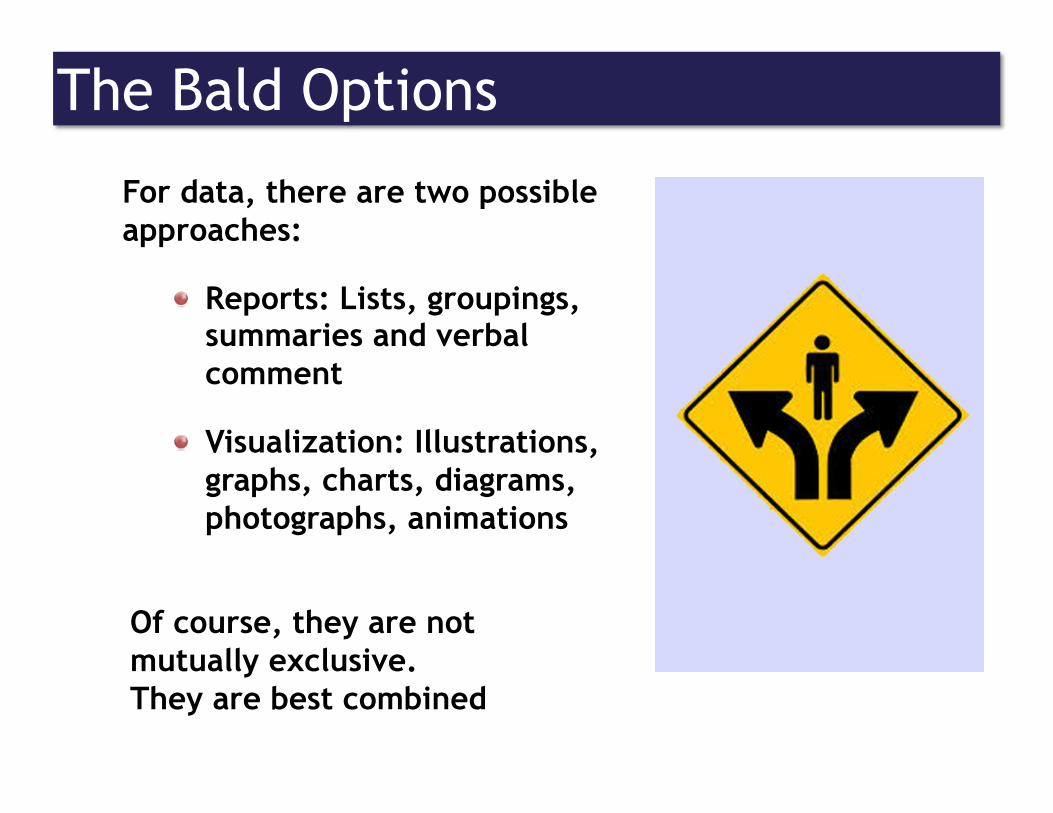
The Bald Options
For data, there are two possible approaches:
! Reports: Lists, groupings, summaries and verbal comment
! Visualization: Illustrations, graphs, charts, diagrams, photographs, animations
Of course, they are not mutually exclusive. They are best combined

Twitter Tag: #briefr The Briefing Room
Consumers & Explorers
SPECIFIC USER
TYPES: Needs to be informed/enabled in an easily digested manner
THE CONSUMER
Needs to be provided with: • an exploratory
capability • a versatile set of tools • a versatile set of
visualizations • training/education
THE EXPLORER
Twitter Tag: #briefr The Briefing Room
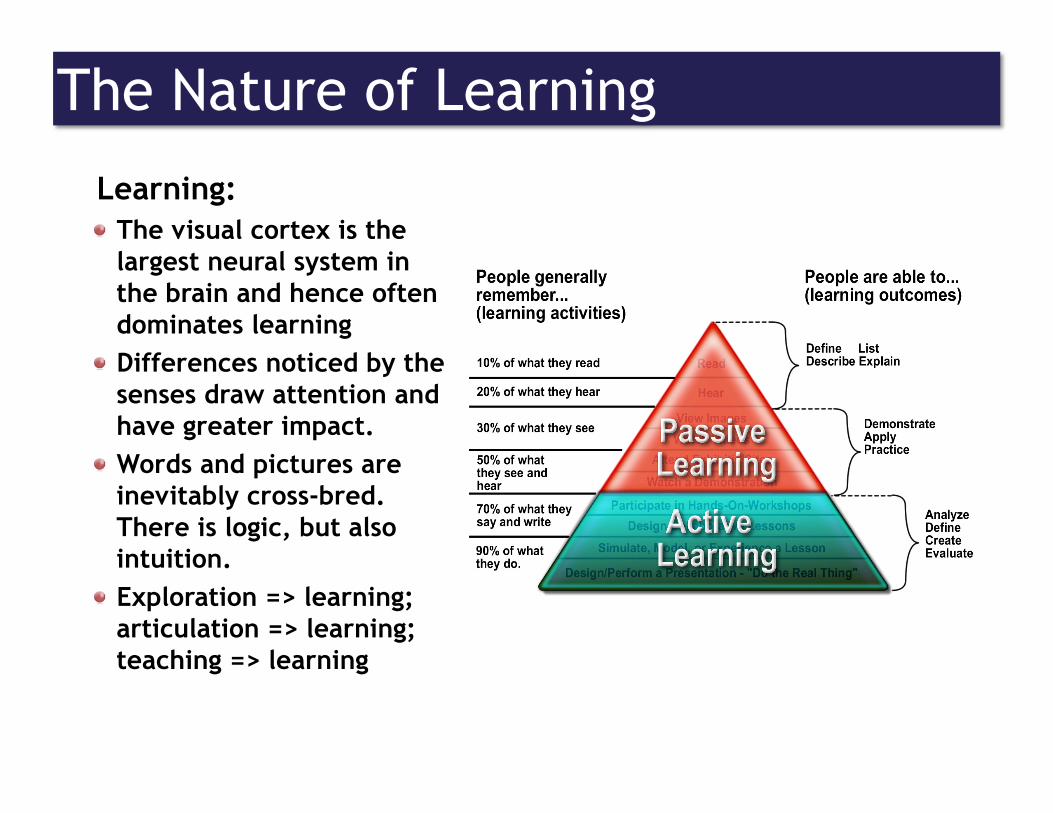
The Nature of Learning
Learning: ! The visual cortex is the
largest neural system in the brain and hence often dominates learning
! Differences noticed by the senses draw attention and have greater impact.
! Words and pictures are inevitably cross-bred. There is logic, but also intuition.
! Exploration => learning; articulation => learning; teaching => learning

Twitter Tag: #briefr The Briefing Room
! What does IBM know about the effectiveness of any specific visualization and how do we know it? How is it measured?
! Is there a relationship between visualization and data volumes? If so, what is it?
! What does IBM know about animation and cognition, if anything? Does RAVE enable animation? What new visualizations have been created?
Twitter Tag: #briefr The Briefing Room
! Are some people poor at deriving meaning from visualization – and yet skilled in other ways?
! What is the learning dimension and how is it characterized?
! You suggest that there are best practices. How do we know – what research has been done? Are there cultural variances?

Twitter Tag: #briefr The Briefing Room
Twitter Tag: #briefr The Briefing Room
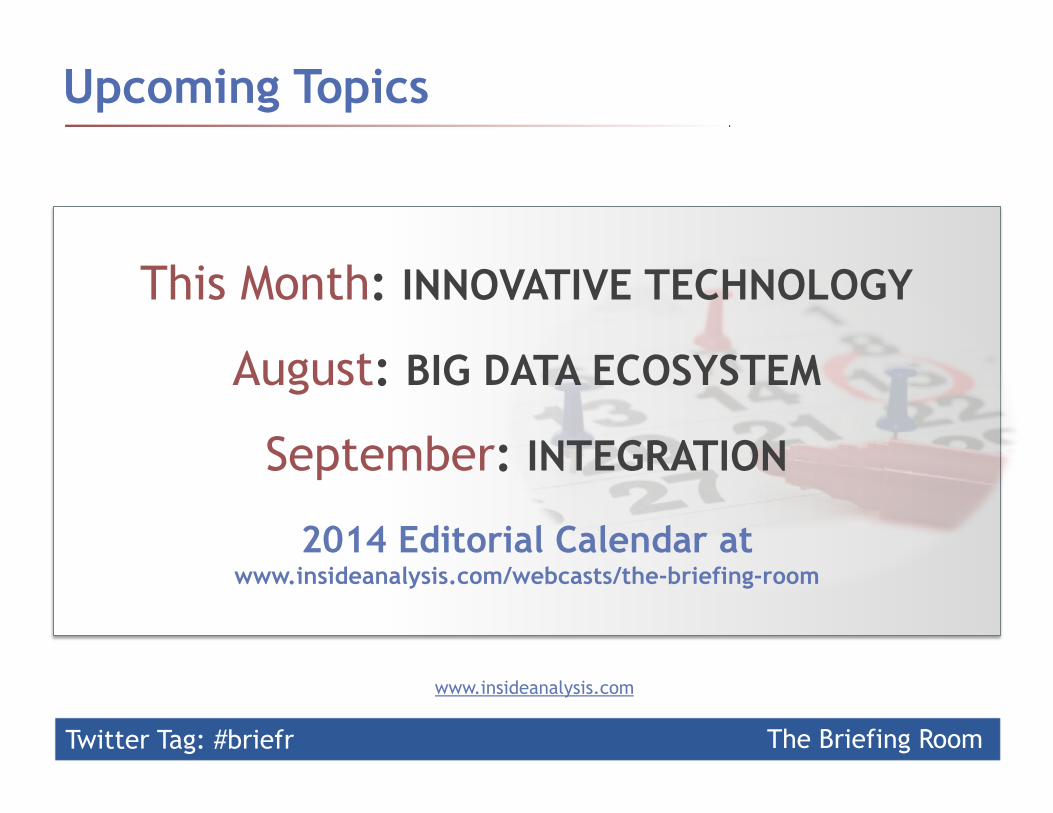
Upcoming Topics
www.insideanalysis.com
2014 Editorial Calendar at www.insideanalysis.com/webcasts/the-briefing-room
This Month: INNOVATIVE TECHNOLOGY
August: BIG DATA ECOSYSTEM
September: INTEGRATION
Twitter Tag: #briefr The Briefing Room
THANK YOU for your
ATTENTION!