gesi mobile carbon impact · special thanks goes to machina research for providing access to m2m...
TRANSCRIPT

How mobile communications technology is enabling carbon emissions reduction
GeSI MobileCarbon Impact

Acknowledgements 3Key findings 5Foreword from GeSI 7Foreword from the Carbon Trust 8Executive summary 9Background 13About the research 15Findings from research 19 Connected Agriculture 22 Connected Buildings 26 Connected Cities 31 Connected Energy 35 Connected Health 39 Connected Industry 43 Connected Living 47 Connected Transportation 55 Connected Working 63 Physical-to-Digital 68Conclusion and discussion 74Appendix 1: Methodology for assessing carbon abatement 77 Overview of methodology 77 Scope 77 M2M connections data 81 Sources and references 82 Review process 82 Considerations and limitations to methodology 83 Applying the methodology at a company level 87Appendix 2: Table of carbon abatement factors 88Appendix 3: Data sources and assumptions 91Appendix 4: References for data sources and assumptions 116Appendix 5: Findings from consumer research 123Appendix 6: Rebound effects 137Glossary 138
Table of Contents

3Mobile Carbon Impact
Acknowledgements
Lead authors:
Andie Stephens, Marta Iglesias, Jamie Plotnek
The Carbon Trust team:
Martin Barrow, Jamie Clark, Andrea Dahlén, Daisy Goaman, Hugh Jones, Ainslie Macleod, Ana Muñoz, Simon Pickstone, Susan Poupard, Dheeya Rizmie, David Sanders, Aleyn Smith-Gillespie, Paul Swift, Veronika Thieme, Joseph Thornton
The Carbon Trust would like to thank the many individuals and organisations that have contributed to the development of this report by sharing their expert knowledge and guidance, including:
Anders Andrae, Huawei; Dustin Benton, Green Alliance; Pernilla Bergmark, Ericsson; Emily Bosland, Verizon; Craig Donovan, Ericsson; Simon Driver, Future Thinking; Jens Malmodin, Ericsson; Emma Fryer, techUK; Gabrielle Ginér, BT; Solène Hanquier, Bell Canada; Louise Harry, EE; Saul Jamieson, Telefónica UK; Jonathan Koomey, Stanford University; Jan Kristensen, Telenor; Chris Lloyd, Verizon; John Ponter, EE; Pascal Salina, Swisscom; Mark Shackleton, BT; Markus Terho; Chiara Venturini, GeSI; Dominic Vergine, ARM; Nicki Woodhead, Vodafone
This report was funded by:
Special thanks goes to Machina Research for providing access to M2M data and supporting analysis.

4Mobile Carbon Impact
About GeSI
The Global e-Sustainability Initiative (GeSI) is a strategic partnership of Information and Communication Technology (ICT) companies and organizations committed to creating and promoting technologies and practices to foster economic, environmental and social sustainability.
Formed in 2001, GeSI’s vision is a sustainable world through responsible, ICT-enabled transformation. GeSI fosters global and open cooperation, informs the public of its members’ activities to improve their sustainability performance, and promotes innovative technologies for sustainable development. GeSI’s membership includes over 30 of the world’s leading ICT companies; the organization also collaborates with a range of international stakeholders committed to ICT sustainability objectives.
These partnerships include the United Nations Environment Program (UNEP), the United Nations Framework Convention on Climate Change (UNFCCC), the International Telecommunications Union (ITU), and the World Business Council for Sustainable Development (WBCSD). Such collaborations help shape GeSI’s global vision on evolution of the ICT sector, and how it can best meet the challenges of sustainable development.
For more information see www.gesi.org.
About the Carbon Trust
The Carbon Trust’s mission is to accelerate the move to a sustainable, low carbon economy.
We are an independent, expert partner of leading organisations around the world, helping them contribute to and benefit from a more sustainable future.
• We advise businesses, governments and the public sector on their opportunities in a sustainable, low carbon world.
• We measure and certify the environmental footprint of organisations, supply chains and products.
• We develop and deploy low carbon technologies and solutions, from energy efficiency to renewable power.
We have approximately 180 staff with 30 different nationalities, based in the UK, China, Mexico, Brazil, South Africa and the USA. The Carbon Trust’s experts come from a diverse range of professional backgrounds, including engineering, policy, academia, and business.

5Mobile Carbon Impact
Key findings
• Thecarbonemissionsabatementenabledbymobilecommunicationstechnologytodayisapproximatelyfivetimesgreaterthanthecarbonemissionsfrommobilenetworks.
• Useofmobilecommunicationstechnologyiscurrentlyenablingatotalreductionof180 million tonnes of CO2e ayearacrosstheUSAandEurope.ThisamountisgreaterthantheannualcarbonemissionsfromtheNetherlandsandequivalentto1.5 percent ofallgreenhousegasemissionsfromtheUSAandEurope.
• 70 percent ofcurrentabatementcomesfromtheuseofmachine-to-machine(M2M)technologiesinthebuildings,transportandenergysectors,wheredevicesareabletocommunicateautomaticallywitheachotherwithoutrequiringhumanintervention.
• 20 percentofcurrentabatementcomesfromuseofsmartphonestoenablebehaviouralchangesinlifestylesandworkingpatterns.
• Significantfutureopportunitiesexisttoreduceemissionsfromcities,healthcareandagriculturethroughtheuseofmobilecommunicationstechnology,althoughtheimpactoftheseareastodayisrelativelysmall.
• Thetotalcarbonemissionsabatementfrommobilecommunicationstechnologyisexpectedtogrowatleastthreetimeslargeroverthenextfiveyears(toabout500 million tonnesofcarbonemissionsabatementperyearacrosstheUSAandEurope),givencurrentprojectionsoftheincreaseindeploymentofM2Mtechnologies.
• Internationalconsumerresearchshowshighlevelsofwillingnessforsmartphoneuserstoadoptbehavioursthatwillresultinreducedpersonalcarbonemissions,enabledbyfunctionsorappsontheirmobiledevices.Thegreatestimpacttodayisthroughconnectingwithfamilyandfriendsusingvoiceorvideocalls,replacingphysicaljourneys.

6Mobile Carbon Impact
mobile devices toenable behaviouralchanges in lifestyleand workingpatterns.
milliontonnesCO2eperyear

7Mobile Carbon Impact
Foreword from GeSI
Currently the greenhouse gas emissions from these regions are being reduced by around 1.5 percent thanks to mobile, an amount greater than the entire annual national emissions from the Netherlands. This is impressive, but it is also only a fraction of the full potential for the technology.
These findings are timely because 2015 is an important year for global agreements on climate change, with political leaders gathering in Paris to decide how to avoid dangerous climate change at the same time as we continue to grow national economies and improve prosperity.
It is commonly believed that any agreement that is reached will require difficult trade-offs. But the fact that the deployment of mobile communications technology is enabling carbon emissions reduction at the same time as improving economic and social progress indicates that there are plenty of win-win situations.
We believe that a global ICT transformation, with mobile as a key element, will put the world in a better position to meet the challenges of climate change and sustainable development. If businesses, policymakers and citizens actively support this transformation then over the next decade the impact can be magnified and multiplied many times over.
We encourage you to join us in making this transformation a reality.
I hope you will find this report interesting and informative.
Luis Neves
Chairman GeSI
A decade ago a number of leading organisations from across the Information and Communications Technology (ICT) sector came together to create the Global e-Sustainability Initiative (GeSI). Our purpose is to work collaboratively to find solutions to the environmental and social challenges faced by the world. We do this by harnessing our industry’s capacity for innovation and technology deployment to promote low carbon growth and shared prosperity in the developing and developed world.
In the decade since GeSI was founded, mobile communications has gone through a period of rapid technological advancement and tremendous growth. As governments, businesses and individuals have realised the potential uses for this technology, it has increasingly become an important building block to help create a better society and grow the economy.
This report details, for the first time, the actual impact that mobile communications technology is having today on reducing carbon emissions. In the USA and Europe this is approximately five times greater than the total direct emissions associated with mobile, creating a net positive effect.

8Mobile Carbon Impact
Foreword from the Carbon Trust
For some years now there have been inspiring discussions about the opportunities that might exist in areas such as big data, smart cities and the sharing economy. Commentators have described how technology could make the world a better and more sustainable place to live. And now those possibilities are becoming a reality.
At the Carbon Trust we are pleased to be working with GeSI to undertake the most detailed analysis to date to quantify the actual impact that mobile is having on reducing carbon emissions today. This has established that mobile communications technology is doing a lot more than just opening up new possibilities. It is already having a very real impact today in enabling global efforts to mitigate the impacts of climate change, the equivalent of abating the entire annual carbon emissions from an advanced economy the size of the Netherlands every single year.
Despite this remarkable progress, the research we have done highlights that what is happening today is only a fraction of what is theoretically possible through the use of mobile communications technology. Climate change is an urgent and formidable challenge. There is therefore a real need to demonstrate what works and deploy it at scale, so that the greatest possible enablement effect can be achieved as soon as possible.
We encourage businesses and governments to recognise this clear opportunity and to seize it.
Hugh Jones
Managing Director, Advisory The Carbon Trust
Amongst global businesses, ICT and telecommunications companies have been some of the most progressive and collaborative when it comes to sustainability. This goes beyond being merely responsible. These businesses recognise the fact that their core products and services have a major role to play in enabling a sustainable, low carbon future. There is a real business case for accelerating the transition.
Innovation has been key to the success of the sector, because successful innovation brings tangible rewards. This is especially true when it comes to low carbon innovation, where economic benefits are accompanied by reduced environmental impacts. And thanks to continued investment into developing and advancing mobile communications technology, a wave of low carbon innovation has been unleashed across many other sectors of industry and society.
Greater levels of mobile network availability and higher bandwidth speeds, have combined with improved processing power and falling technology costs in everything from sensors to smartphones, to create a multitude of new possibilities.

9Mobile Carbon Impact
Mobile communications technology has long been recognised to have considerable potential to enable carbon emissions reduction across a variety of applications in a wide range of sectors. But this enablement effect is already having a meaningful impact on global carbon emissions, with the opportunity to grow this impact many times over as new technologies are adopted more widely.
The Carbon Trust has completed the first ever bottom-up quantification of the significant areas of carbon emissions abatement enabled by mobile communications technology across the USA and Europe. This analysis has found that currently, annual savings are in excess of 180 million tonnes of carbon dioxide equivalent (CO2e). To put this number in context, a country with annual emissions of this size would be amongst the world’s top 30 national emitters, ranking above countries such as the Netherlands, Vietnam and Pakistan.1
Comparing this annual saving with the emissions resulting from mobile networks,2 means that the carbon emissions abatement enabled by mobile communications technology is approximately five times greater than the carbon emissions associated with mobile networks.
Additional analysis completed for the UK, Germany, Spain and France found that over 35 million tonnes of carbon emissions abatement can be attributed to the use of mobile in those four countries. This amount is similar to the annual carbon emissions from Ireland or Switzerland.3
10+14+7+7+92+93
1 This comparison uses 2011 data from the World Bank, available at: http://data.worldbank.org/indicator/EN.ATM.CO2E.KT/. 2 Emissions from mobile networks have been calculated from other studies. See box on page 17 for details. 3 World Bank (2011), op cit.
Executive summary
CARBON ABATEMENT (MtCO2e/year) UK, Germany, Spain, France, USA, Europe
All EuropeUK Germany Spain France USA
9.6 14.46.5 6.6
92.2 92.4
The Carbon Trust’s research identified ten categories where mobile communications technology is having a material carbon emissions abatement impact. Within these ten categories over one hundred individual mechanisms were identified, of which some sixty mechanisms were analysed in detail as they were shown to have a clear abatement mechanism with credible data to support the carbon abatement calculations.

10Mobile Carbon Impact
28+29+14+13+7+3+2+2+1+1RELATIVE SIZES OF CARBON ABATEMENT BY CATEGORY
Total: 180 MtCO2e for Europe and the USA
3%2%2%1%1%
29%
28%
13%
7%
14%
Connected Buildings
Connected Transportation
Connected EnergyConnected Working
Connected Cities
Connected Health
Connected Agriculture
Connected Industry
Physical-to-Digital
Connected Living
For all the mechanisms, the estimated carbon abatement has been enabled by mobile. Within the context of this report mobile has been defined broadly, to include both machine-to-machine (M2M) connections and the functionality of smart devices.4 Each of the mechanisms analysed was grouped within one of the ten categories, which are:
Connected Agriculture: improving the efficiency of farming methods and increasing yields.
Connected Buildings: more effective monitoring and management of electricity use, heating and cooling.
Connected Cities: enhancing city infrastructure and the provision of public services by government or local government.
Connected Energy: enabling a more efficient distributed system of low carbon energy generation and smart grids.
Connected Health: remotely providing non-emergency healthcare or home care and improving health and wellbeing.
Connected Industry: supporting more efficient business operations and supply chain management in sectors including
manufacturing and construction.
Connected Living: using smart devices or digital services that enable individuals to have lower carbon lifestyles.
Connected Transportation: improving logistics, vehicle use, vehicle efficiency and use of public transportation.
Connected Working: enabling more effective remote working or education.
Physical-to-Digital: multifunctional devices and digital services replacing physical products.
The total carbon abatement for these categories has been quantified for the USA and Europe.5 The figures for Europe have been based on specific calculations that were completed for the national carbon emissions abatement in four countries: the UK, Germany, Spain and France.
70 percent of the savings currently being made come from the use of machine-to-machine (M2M) technologies. These savings are most prominent in the operation of buildings and transportation, thanks to improvements in areas such as building management and route planning, which lead to reduced energy and fuel use.
The other key area for M2M technology, which is of growing importance, is in enabling smart electricity grids. This allows for the effective connection of distributed sources of energy generation, such as small-scale renewables, in order to provide a low carbon electricity infrastructure.
4 A more detailed explanation of what has been included in the definition of mobile within this report can be found in the About the Research section on page 15 and in Appendix 1. Similar effects may also be achieved through fixed connections. However, the carbon abatement figures presented in this report only relate to mobile connections.5 This includes all countries in Europe, including Russia and the Caucasus republics, Turkey, Greenland and Iceland.

11Mobile Carbon Impact
There also appears to be significant potential for individuals to live more sustainable lives thanks to the use of smart devices. As part of this research, the Carbon Trust commissioned a global study of 4,000 smartphone users across the USA, UK, Spain, South Korea and Mexico. These countries were selected to provide a global sample of smartphone use in countries with relatively high levels of device penetration and existing mobile data infrastructure.
The survey data showed a number of areas of behaviour change being adopted that are making people’s lives easier and are also delivering significant carbon savings. The data collected was used in part to support quantitative analysis. This found that behavioural changes in lifestyle and working patterns, enabled by the use of smartphones, are responsible for 20 percent of the total carbon abatement identified. These include the use of mobile banking, accommodation sharing services, satellite navigation apps, and replacing visits to family and friends with voice or video calls.
WILLINGNESS TO USE MOBILE DEVICES RESULTING IN REDUCED PERSONAL CARBON EMISSIONS
0%
10%
20%
30%
40%
50%
60%
70%
80%
90%
100%Already do this
Mobile banking Accomodation sharing
Family & friends
Willing to do this
Not willing to do this

12Mobile Carbon Impact
Consumer research also found high levels of willingness to adopt behaviours that could result in even more substantial future reductions to personal carbon emissions. Responses suggest that a number of technological advances and digital services that are currently under development, or not yet widely adopted, could rapidly accelerate the growth of the carbon abatement effect from smart devices in the next few years.
In some other categories that have been considered in this report – such as agriculture, health and industry – the data does not demonstrate a significant impact on carbon emissions today. However, these sectors have been identified as areas with very high opportunity for future carbon abatement through the use of mobile communications technology.
Although the focus of this report is on quantifying the present level of carbon abatement for 2015, it is possible to use the analysis to create a simple projection for what the scale of abatement might be in 2020. This was done by considering the impact from the expected growth in M2M connections,6 then taking today’s impact from M2M and scaling it up appropriately. By doing this it is possible to predict an annual carbon abatement of about 500 million tonnes of CO2e in 2020, which is nearly three times the figure for 2015.
To fully leverage the potential of mobile, the report outlines a number of key barriers and opportunities which are highlighted in more detail in the body of the report. The Carbon Trust’s research has highlighted four main areas where action can be taken to accelerate the benefits of mobile communications technologies on carbon emissions abatement:
• Enabling technology: there is a need to invest in innovative or disruptive new technologies that enable better, low energy access to mobile communications, as well as creating the enabling network infrastructure for connections around the world.
• Implementing solutions: businesses and governments need to adopt and scale up the mechanisms that are effective in reducing carbon emissions today, as well as exploring novel uses for mobile communications technology that can achieve further reductions.
• Policy landscape: governments can accelerate progress by supporting common standards and developing appropriate regulatory oversight, as well as advancing deployment by the use of incentives and disincentives, such as support for improved connectivity or putting a strong price on carbon emissions through cap-and-trade schemes and taxes.
• Changing behaviour: there is a significant opportunity to use mobile to support organisations and individuals by developing simple, useful tools that offer lower carbon options and services.
This report finds that the use of mobile communications technology is already having a substantial positive influence on reducing global carbon emissions, which is far greater than the direct emissions related to providing the technology. It is having a net positive impact and there is a clear potential for the power of this abatement effect to continue multiplying.
Given the urgent importance of mitigating the worst effects of climate change, the world needs to rapidly reduce carbon emissions across every sector of society. Mobile communications technology is a powerful tool to help achieve these reductions. Serious consideration should be given by government and industry on how to strengthen its deployment and increase its effect in addressing one of the greatest environmental, social and technical challenges ever faced by human civilization.
6 M2M connection data (both actual and predicted) was provided by Machina Research.

13Mobile Carbon Impact
Mobile communications technology has gone through a period of explosive growth over the past decade. According to the International Telecommunication Union (ITU), the United Nations agency for information and communications technology, there are 7.1 billion mobile connections in the world in 2015, up from 2.2 billion in 2005.7 This is allowing unprecedented levels of connectivity and information sharing, which can unlock new efficiencies and enable different behaviour patterns.
This step change in the availability of mobile communications technology is having a transformative effect. It is changing how society functions, allowing businesses, governments and individuals to find new ways of doing things more productively or efficiently.
It has been argued that the growth in mobile is enabling and accelerating the adoption of a new techno-economic paradigm of mass connectivity.8 The impact from this is fundamentally changing the structure and infrastructure of the economy, in a way that is not dissimilar to the scale of impact from the steam engine, the railway or the computer.
The underlying network infrastructure required to provide access to increasingly large amounts of data around the world does have an environmental impact. However, efficiency is improving rapidly and many mobile operators are transitioning to the use of cleaner energy sources to operate their network infrastructure. The recent SMARTer 2030 report produced by Accenture for GeSI projected that, despite the expected growth of the ICT sector, which includes mobile operators, the relative carbon footprint is anticipated to remain around 2 percent of total global emissions as far ahead as 2030. More importantly, the future carbon emissions abatement potential of the ICT sector as a whole, including mobile, was estimated at 20 percent of global CO2e emissions by 2030.9
However, alongside the growth of mobile, the world faces an enormous challenge: to create a system that meets the needs and wants of a growing global population, at the same time as addressing the risks of climate change. It is therefore critically important that socio-economic advancements are decoupled from growth in carbon emissions, helping to meet the long term challenges faced by society.
Mobile communications technology can support carbon emissions reduction and the creation of a low carbon economy, by enabling new and less environmentally damaging ways of doing things. But although there have been predictions and projections about the future potential for mobile to cut carbon emissions, very little work has been done on quantifying the actual impact the technology is having today.
In order to better understand the scale of this enablement effect, the Carbon Trust was commissioned by GeSI to produce this report on how mobile is already helping to tackle climate change today by enabling carbon emissions reduction globally.
The Carbon Trust’s comprehensive assessment looks at the various ways in which mobile is enabling carbon emission abatement across a variety of sectors and industries. This includes a quantification of where the most substantial impacts are happening today. It also provides a perspective on where the greatest opportunities could exist in the future, as technological advancement and global connectivity continue on their rapid growth trajectories. It is hoped that this assessment will provide a useful guide for businesses and policymakers to ensure that mobile communications technology can be effectively harnessed as a tool to help solve the challenges of climate change. To support this, significant opportunities and barriers have been highlighted within the analysis, with recommendations provided within the conclusion on some of the actions that could be taken to further accelerate progress.
Background
62+65+80+71+577 ITU (2015) Key 2005-2015 ICT data for the world, by geographic regions and by level of development. 8 Perez, C. (2009) Technological revolutions and techno-economic paradigms. Cambridge Journal of Economics, vol. 34(1), pp.185-202. 9 Accenture Strategy (2015) SMARTer2030: ICT Solutions for 21st Century Challenges. Global e-Sustainability Initiative. Brussels.

14Mobile Carbon Impact
0
500
1,000
1,500
2,000
2,500
3,000
3,500
4,000
4,500
France
USA
All Europe
M2M connections included in analysis
(2015)
M2M connections included in analysis
(2020)
All M2M connections
(2015)
All M2M connections
(2020)
Germany
SpainUKPROJECTED GROWTH IN M2M CONNECTIONS
M2M
con
nect
ions
(mill
ions
)
M2M connections included in the analysis for this report are only those that are attributable to mobile, and have a carbon abatement associated with them.
All M2M connections include those using both the fixed-line and mobile connectivity.
M2M connection data (both actual and predicted) was provided by Machina Research.
62+65+80+71+57SMARTPHONE PENETRATION 10
65%
57%
80%
71%62%
France Germany Spain UK USA
10 Data from Google’s Consumer Barometer with surveys administered by TNS Infratest between January-March 2015. Available at: http://www.consumerbarometer.com.

15Mobile Carbon Impact
Mobile communications technology has a wide variety of current and potential applications across a broad range of economic and social activities. Many of these applications could result in some measure of carbon emissions reduction.
In order to quantify how mobile is enabling carbon emissions reduction today, the Carbon Trust has taken a bottom-up approach to identify and include the most significant areas of impact, where data was also available or could be readily collected.
Alongside this, the research process provided the opportunity to highlight potential areas of future impact and best practice case studies. These help to illustrate the areas where the current influence of mobile on carbon emissions is limited, but the future opportunities are significant.
About the research
What is mobile? Within the context of this report the term mobile is used as a shorthand way to refer to a variety of mobile communications technologies that allow for the transfer of information without fixed lines.
These include:
• mobile phone networks;
• public Wi-Fi networks;
• metropolitan area networks;
• Low Power Wide Area networks (LPWAN); and
• satellite networks.
The assessment looks at various devices that make use of these networks. This goes beyond just looking at mobile phone usage and incorporates a range of machine to-machine (M2M) communications.
The definition of mobile used here also includes the functionality and features of mobile phones or smartphones, including the use of smartphone apps.
Allocation of abatement impacts to mobileCarbon abatement is included from mechanisms where mobile has a fundamental role in providing the enabling effect (in other words the outcome would not happen without the existence of the mobile technology). No attempt has been made to allocate the abatement between different technologies in cases where mobile technology is only partly responsible for the carbon abatement and other technologies such as laptop computers or software systems also contribute to the carbon abatement.
However, in the cases where the effects of the abatement mechanisms can be achieved through the use of either fixed-line or mobile connections, then the analysis only considers the abatement that is attributable to mobile. Where the abatement mechanism is based on M2M technology then the allocation between fixed and mobile uses the categorisation of the M2M connections. In other cases, assumptions have been made to allocate an appropriate percentage of the overall effect to mobile.

16Mobile Carbon Impact
In the analysis, the Carbon Trust only considered carbon abatement from mobile communications technologies, and not included that from fixed wired connections. While some mechanisms only work with mobile technologies, a number of the carbon abatement mechanisms can be achieved equally well by fixed connections.
Currently, many of the existing implementations of ICT solutions are provided by physical wired connections; however, it is expected that, in many cases, mobile and wireless networks will play an increasing role in future deployment. This is because technological advances have made these the favoured option in many cases. Wireless connection can deliver high energy efficiency, lower cost and comparative ease of installation, which makes the use of mobile more suitable for remotely located buildings where fixed connections would be a more disruptive, costly alternative.
The Carbon Trust’s research involved a number of stages, making use of both qualitative and quantitative sources. Research steps included:
• desk research and a detailed literature review of over 200 pieces of material, including peer reviewed academic research, industry studies, and influential media sources, identifying potential areas where mobile is enabling carbon emissions reduction. The desk research also included an evaluation of materiality across all the M2M categories within the Machina Research M2M Forecast Database;
• expert interviews with stakeholders from the mobile telecommunications industry, government, communications regulators, consumer and environmental groups, academia and think tanks;
• quantification and analysis of the areas where mobile is materially enabling the abatement of carbon emissions today in the USA and Europe, with a particular focus on the UK, France, Germany and Spain (see methodology detailed in Appendix 1 and data assumptions and sources detailed in Appendix 3);
• commissioning a global survey of 4,000 smartphone users across Mexico, South Korea, Spain, the UK and USA to understand current behaviour and future propensity to use mobile in a way that can enable carbon emissions reduction (see findings from consumer research in Appendix 5); and
• assessing the most promising areas for future enablement of carbon emissions reduction by mobile, as identified in the literature review, as well as identifying the key opportunities and barriers to implementation.
Because quantification only included the most significant sources of emissions, where data was also readily available, it is likely that the carbon reduction numbers presented in the report, are an underestimate of the actual impact of mobile. It is probable that the cumulative addition of the many unquantified impacts would be substantial, therefore numbers produced within this report should be seen as conservative, underestimating the real scale of impact.
Before outlining the findings below, it is also necessary to provide some brief discussion on the boundaries to the scope of the assessment undertaken by the Carbon Trust.
The results from the analysis show the total enablement effect of mobile on carbon emissions reduction. It does not include the embodied or direct carbon emissions from the production and operation of the assets required for mobile, such as data centres, mobile network equipment or phone handsets.

17Mobile Carbon Impact
In order to provide context for the abatement analysis this has been compared to network carbon emissions from previous studies to calculate a ratio of carbon abatement to the overall carbon footprint of mobile (see box).
A significant proportion of the carbon abatement quantified by the research is a result of human behavioural changes. It has been possible to quantify this using the results from the consumer research commissioned for this report (see Appendix 5), together with other data and research. The consumer research identified that there is already a significant propensity for consumers to use their smartphones to access services and engage in mobile enabled activities. This has a direct impact on lower carbon emissions associated with certain behaviours. The consumer research also showed that there is an even higher percentage of people who would be prepared to adopt these behaviours in the future.
There are some limitations to the research that should be noted. The bottom-up methodology that has been used in this report is effective for quantifying the carbon emissions abatement that can be attributed specifically to mobile today, as it is based on current available technology. Applying it to future scenarios does not consider progress of technology and business model innovation nor the additional impact gained through increased adoption of mobile enabled services.
Previous work, completed by GeSI and others, has tried to understand the positive effect that ICT as a whole – including mobile – can have on future carbon emissions reduction and sustainable development. Therefore, this report does not provide a more detailed projection of future carbon emissions abatement from mobile. Nonetheless, areas of opportunity are discussed more broadly.
Carbon footprint of mobile networksThe GSMA11 calculates the global annual carbon footprint due to the energy from mobile networks as 70 MtCO2e, and a report by Fehske et al12 calculates the total annual global footprint (including energy and embodied carbon) at 170 MtCO2e. Allocating this footprint (including the embodied carbon) to the USA and Europe gives a carbon footprint of about 40 MtCO2e, which when compared to the carbon abatement calculated, gives the ratio of nearly 5:1.
A more detailed explanation of this calculation can be found in Appendix 1.
Predicting the futureThe focus of this report is on calculating the current carbon abatement that mobile communications technologies are enabling today. However, it is possible to use the analysis to also create a broad estimate for what this abatement might be in 2020. This has been done by using predictions for the number of M2M connections in 2020 and applying these to the same factors used for the 2015 analysis. This results in a prediction of about 500 MtCO2e annual carbon abatement in 2020, nearly three times the figure for 2015.
This is likely to be an underestimate, as it only accounts for the growth in M2M connections, and has not considered any increase in carbon abatement from further behavioural changes in use of mobile phone technology. Additionally different emission factors have not been applied (for grid electricity and transport), which are likely to reduce as the economy begins to decarbonise in the next 5 years.
11 GSMA (2012), Mobile’s Green Manifesto 2012. 12 Fehske et al. (2011), Global Footprint of Mobile Communications: The Ecological and Economic Perspective. IEEE Communications Magazine, August 2011, pp 55-62.
18Mobile Carbon Impact
It is also highly likely that access to mobile communications has improved absolute economic productivity, which can lead to an increase in overall economic activity. This has its own associated additional emissions impacts,13 commonly known as rebound effects. There is a growing field of literature that has attempted to determine where some of these rebound effects may be taking place, as well as the extent to which they are having an impact on energy use and carbon emissions.14
Some examples of rebound effects include: providing real time data on parking spaces, which would reduce driving emissions from driving around to find a space, but may encourage greater levels of car use as a transport mode; distant family and friends can keep in touch with video calls, which in some cases can reduce travel, but in others may maintain stronger relationships that would encourage more visits than would have happened otherwise; and mobile shopping may reduce travel to the shops, but may encourage more overall shopping resulting in increased consumption.
Due to the high levels of uncertainty and complexity in calculating or quantifying the rebound effect for each of the enablement mechanisms considered in this report, potential rebound effects from mobile have not been assessed. There is further discussion of rebound effects in Appendix 6.
13 This is commonly referred to as the Jevons paradox, following the economist William Stanley Jevons who identified in 1885 that technology enabling greater efficiency in the use of a resource (in that case coal) actually resulted in a greater total use of that resource. 14 Gossart, C. (2015) Rebound Effects and ICT: A Review of the Literature, pp. 435–448 in: Hilty, L.M. & Aebischer, B. (eds.) ICT Innovations for Sustainability. Advances in Intelligent Systems and Computing. Springer International Publishing. Cham.

19Mobile Carbon Impact
Analysis has been completed across ten categories to understand the current impact of mobile communications technology to enable reductions in national greenhouse gas emissions in Germany, France, Spain, the UK and the USA, as well as across the entirety of Europe.15
The full methodology for the quantification is contained in detail in Appendix 1, with the data sources and assumptions listed in Appendix 3.
Analysis indicates that the greatest impacts are currently in the buildings, transportation and energy sectors, as well as those arising from changing working patterns and enabling lower carbon lifestyles. The other areas assessed are currently showing comparatively limited contributions to greenhouse gas reductions, although in some cases significant potential exists for future contributions.
Category UK Germany Spain France USA Europe
ConnectedAgriculture
53,000 125,000 28,000 170,000 2,125,000 1,043,000
ConnectedBuildings
2,916,000 1,148,000 2,120,000 754,000 32,300,000 21,333,000
ConnectedCities
435,000 498,000 226,000 383,000 1,990,000 3,018,000
ConnectedEnergy
1,536,000 5,255,000 939,000 221,000 9,265,000 15,523,000
ConnectedHealth
47,000 89,000 29,000 51,000 3,540,000 406,000
ConnectedIndustry
88,000 196,000 65,000 32,000 1,837,000 808,000
ConnectedLiving
1,259,000 1,412,000 1,079,000 1,163,000 8,889,000 16,123,000
ConnectedTransportation
2,340,000 4,255,000 1,197,000 2,709,000 24,756,000 26,173,000
ConnectedWorking
810,000 1,340,000 759,000 1,084,000 6,714,000 7,096,000
Physical-to-Digital
90,000 109,000 72,000 63,000 743,000 891,000
Total 9,574,000 14,427,000 6,514,000 6,630,000 92,159,000 92,414,000
Percapitaabatement(kgCO₂e): 149 179 140 101 292 124
Findings from research
CARBON EMISSIONS ABATEMENT BY CATEGORY AND GEOGRAPHY (tCO2e/year)
15 The definition of Europe used includes all countries in Europe, including Russia and the Caucasus republics, Turkey, Greenland and Iceland.

20Mobile Carbon Impact
The per capita abatement figures provide some context to understand and compare the numbers. However, they also reflect the individual circumstances of the different countries. Thus France has the lowest carbon abatement per capita which reflects the fact that France has a low grid electricity emission factor (due to the high proportion of nuclear electricity generation). Germany has a high carbon abatement per capita largely due to the high amount of renewable microgeneration because of the very successful feed in tariff programme that was supported by the German government. The USA figure is large partly reflecting the relatively high grid electricity emission factor, and partly because the baseline emissions are greater than in Europe, so the same percentage saving equates to a higher absolute carbon emissions reduction.
Con
nect
ed B
uild
ings
Con
nect
ed T
rans
port
atio
n
Con
nect
ed E
nerg
y
Con
nect
ed W
orki
ng
All EuropeC
onne
cted
Citi
es
Con
nect
ed H
ealt
h
Con
nect
ed A
gric
ultu
re
Con
nect
ed In
dust
ry
Phy
sica
l-to
-Dig
ital
USA
Con
nect
ed L
ivin
g
CARBON ABATEMENT (tCO2e/year) USA and Europe
Car
bon
Abat
emen
t tC
O2e
/yea
r
0
5,000,000
10,000,000
15,000,000
20,000,000
25,000,000
30,000,000
35,000,000

21Mobile Carbon Impact
CARBON ABATEMENT (tCO2e/year) UK, Germany, Spain, France UK
Germany
Spain
France
Con
nect
ed B
uild
ings
Con
nect
ed T
rans
port
atio
n
Con
nect
ed E
nerg
y
Con
nect
ed W
orki
ng
Con
nect
ed C
ities
Con
nect
ed H
ealt
h
Con
nect
ed A
gric
ultu
re
Con
nect
ed In
dust
ry
Phy
sica
l-to
-Dig
ital
Con
nect
ed L
ivin
g
The following sections in this report provide more detail on the various categories of carbon emissions abatement enabled by mobile communications technology that have been assessed. This includes a more detailed explanation of the practical mechanisms used to quantify carbon emissions reduction. Where certain mechanisms overlap between multiple categories, these have been allocated to the most appropriate, in order to avoid double counting. The following sections also incorporate a broader discussion of current activities and opportunities within each category. Selected case studies and findings from consumer research have been included, where appropriate, to illustrate some of the more promising areas where mobile can contribute to carbon emissions reduction, and have a positive impact on other areas of sustainable development.
0
2,000,000
4,000,000
6,000,000
8,000,000
10,000,000
12,000,000
Car
bon
Abat
emen
t tC
O2e
/yea
r
22Mobile Carbon Impact
Agriculture and the use of mobile
Connected Agriculture refers to the use of mobile communications technologies to help improve the efficiency of farming and forestry. These range from the simple dissemination of general information related to weather or good farming practices, through to providing highly granular data allowing for advanced decision-making.
The key technologies enabling emissions savings today are the use of positioning systems such as Global Navigation Satellite Systems (GNSS), auto-guiding systems for farm machinery and technologies which enable a variable application rate to optimise fertiliser and pesticide use. These technologies have been widely used across arable farms with large field sizes in the main growing areas of developed countries, with the aim of maximising profitability.
The combination of monitoring crops with satellites, airborne thermal imaging and ground-level sensors is commonly referred to as precision agriculture. Data that is collected can help to inform decisions to optimise yields with a minimum of resource input in areas such as fertiliser and pesticide use, as well as improving water efficiency in irrigation. This allows a farmer to respond precisely to variability between fields, and within fields, instead of taking a uniform approach, particularly when data is analysed through advanced Decision Support Systems (DSS).
The main areas of emissions savings from use of mobile today are in yield increase which can result in a lower demand for agricultural soil, decrease in fertiliser use and lower water consumption used for irrigation. Indirectly, variable fertiliser application can also lead to reducing nitrate leaching and groundwater contamination. More efficient farming techniques and improved operation of machinery also results in less use of energy, typically diesel fuel.

23Mobile Carbon Impact
The reduction in fertiliser use is key, as this is a major source of agricultural greenhouse gas emissions. Where manure is used this results in methane and nitrous oxide from aerobic and anaerobic decomposition. Synthetic fertilisers tend to require substantial amounts of fossil fuels in their manufacture, and can result in nitrous oxide emissions from their use on soil.
Abatement mechanisms
There are two specific mechanisms for which material carbon emissions abatement from mobile have been quantified. These are:
• Enhanced agricultural equipment logistics: more efficient operational use of farm machinery such as tractors, harvesters and compactors results in a reduction in fuel use through automatic machine setting, autonomous guidance, steering systems and telemetry.
• Improved crop management: providing information to farmers, controlling irrigation remotely and monitoring soil conditions to allow for less use of fertiliser, which can result in an overall increase in productivity and yields alongside reduced wastage.
UK Germany Spain France USA Europe
Connected Agriculture 53,000 125,000 28,000 170,000 2,125,000 1,043,000
Agriculturalequipmentlogistics 5,000 12,000 7,000 22,000 235,000 121,000
Cropmanagement 48,000 113,000 21,000 149,000 1,890,000 923,000
Future opportunities
Agriculture, forestry and other land use accounts for around 24 percent of all global anthropogenic greenhouse gas emissions.17 Mobile has significant potential to help reduce these emissions through mechanisms that have been identified but that are not quantified here. This is because either the impact today is not material or there is insufficient available data. But many of these advances will have a role to play in enhancing food security and resilience to climate change, as well as meeting other serious sustainability challenges such as freshwater availability, biodiversity loss and nutrient pollution.
For example, mobile is already being used at some scale to: support more efficient livestock farming;18 track illegal deforestation; provide best practice guidance to smallholder farmers in the developing world; manage pests more effectively to minimise the impact of pesticide on biodiversity; and use sensors to accurately measure carbon sequestration.
CARBON EMISSIONS FROM CONNECTED AGRICULTURE ABATEMENT16 (tCO2e/year)
16 Note: Due to rounding, totals may not sum exactly. (Figures above 1,000 have been rounded to the nearest 1,000 and below 1,000 rounded to the nearest 10). This also applies to all carbon abatement figures in the report.17 IPCC (2014) Summary for Policymakers. In: Climate Change 2014: Mitigation of Climate Change. Contribution of Working Group III to the Fifth Assessment Report of the Intergovernmental Panel on Climate Change. Cambridge University Press. Cambridge, United Kingdom and New York, NY, USA.34 18 Gerber, P.J. et al. (2013) Tackling climate change through livestock: a global assessment of emissions and mitigation opportunities. Food and Agriculture Organization of the United Nations. Rome.

24Mobile Carbon Impact
However, in practice levels of success vary significantly by land and crop type, as well as between farmers. Large differences between the actual and potential yields can be attributed to suboptimal management, inappropriate technology and a lack of training. It is expected that as these technologies become more commonplace, intuitive and user-friendly, that best practice will be adopted and emissions reductions will increase.
Despite being a major source of global emissions, agriculture is also a key sector for reducing emissions, as forests, crops and grassland all act as sinks to sequester atmospheric carbon dioxide. But it is also one of the areas of the greatest uncertainty within scientific knowledge of climate change. Emissions uncertainty for agriculture, forestry and other land use ranges from 10 to 150 percent, which is a significantly greater margin than for fossil fuels which range from 10 to 15 percent.19 Greater use of sensors, enabled by mobile, would provide valuable scientific data which could help to increase sequestration rates.
One of the greatest barriers to reaching mobile’s potential in the sector has been identified as a lack of common standards and limits on the exchange of data between systems. This is compounded by the fragmentary nature of agriculture, suggesting that standardised solutions are not always appropriate. There is significant variability between farming methods and land types, which means that development costs are high for new mobile solutions and may face long sales cycles before becoming commercially viable.
In developing countries, the major barrier to the adoption of precision agriculture technology is the relative cost of labour and scale of individual farms. In low wage rural economies, people are seen as a cheaper solution than capital investment into technology, which in any event could result in the loss of valuable employment opportunities. Availability of independent advice, better quantification of environmental benefits and improved knowledge on the determinants of yields have been identified as ways to overcome these barriers. But investment in solutions is likely to be determined by commodity price fluctuations, labour prices, energy prices and environmental regulation. It may also only occur in circumstances where replacement is required.
19 Tubellio, F.N. et al. (2014) Agriculture, Forestry and Other Land Use Emissions by Sources and Removals by Sinks. Food and Agriculture Organization of the United Nations. Rome.

25Mobile Carbon Impact
Smarter farmingMobile phone penetration is now reaching some of the least developed areas in the world, many of which rely on agriculture both for subsistence and as their main economic activity. Access to mobile is helping to improve sustainability by providing these rural communities with improved information on agricultural methods, more accurate weather forecasts and information about market prices for agricultural commodities. This is helping to improve yields, reduce environmental impact, prevent food wastage through post-harvest losses and support economic development.
Innovative platforms such as WeFarm are helping to connect farmers without internet access in rural areas of Africa and Latin America, enabling peer-to-peer sharing of knowledge and best practice through SMS messages.
Similarly, the Vodafone Farmers Club in Turkey provides farmers with SMS alerts about weather forecasts, crop prices and other information that is tailored to their local area and crop types. They also get access to a mobile marketplace that enables them to sell their produce directly to buyers. Since its launch in 2009, the service has benefitted more than 1.25 million farmers in Turkey. To date, more than 700 million SMS alerts have been sent to members.
Another example is the SMS-based iCow app, delivered by Safaricom, which is helping 500,000 farmers in Kenya increase yields, income and productivity by sharing best practice tips and providing support for efficient farm management.
Connected cowsLivestock production is one of the most significant contributions to greenhouse gas emissions, accounting for around 14.5 percent of the total, which is more than the direct emissions from the entire transportation sector. With global demand expected to continue increasing, mobile has an important role to play in helping to minimise supply-side emissions.
The use of precision techniques are less well established in livestock farming when compared with arable crops, but there is a growing trend of mobile technology being used to increase farm profitability and reduce environmental impact. Mobile is used for automatic monitoring of individual animals through sensors. This is helpful to improve the efficiency of meat, dairy and egg production by monitoring overall animal productivity, behaviour and health.
For example, Deutsche Telekom and NTT DOCOMO use connected sensors to monitor pregnant cows and ensure the safe delivery of calves. The service has been deployed for 30,000 cows, alerting farmers to changes in temperature as an indication that delivery is about to begin. This has helped to reduce calf mortality rates from 10 percent to less than 1 percent.
A number of app-based solutions for farmers are now reaching the market. The Silent Herdsman app provides wirelessly connected collars to monitor a cow’s temperature and behaviour. This is used to alert farmers to the best time for insemination, as well as providing details on milk yields and alerting the early onset of illnesses. Similarly, a company called Vital Herd uses an electronic pill that is swallowed by the cows, while another called Quantified Ag uses biometric ear tags.
Smartphones and sensors are also used in more general herd management, where the Brazilian company Bovcontrol has created an app that makes use of RFID chips to track location, provide vaccine management and assist with pasture rotation. Good pasture management can have a positive impact on land degradation and deforestation.

26Mobile Carbon Impact
Buildings and the use of mobile
Connected Buildings refers to the use of a variety of technologies to optimise energy use within buildings, such as building management systems, advanced lighting and thermal controls. It is also the area where the greatest impact is being realised today in terms of carbon emissions reduction from mobile communications technology.
The main areas of carbon emissions abatement are from reduced gas and electricity use. This is being achieved through the installation of intelligent systems that either automatically control settings, or allow for more effective human monitoring and control of energy use through wall-mounted panels or touchscreen devices.
M2M connectivity is of particular importance in this area, as it allows for the automation and monitoring of various systems remotely. This enables communication between systems to provide intelligent responses in one system to changes detected in another, which do not rely on the active involvement of users. For example, it allows for systems to be switched on and off depending on occupancy or temperature. It can also apply analytical tools for predictive maintenance and more sophisticated building control policies, such as adjusting heating in line with the weather forecast and historical comfort data.

27Mobile Carbon Impact
Abatement mechanisms
There are three groups of mechanisms for which material carbon emissions abatement from mobile have been quantified. These are:
• Advanced building energy management systems: automated energy management systems using smart meters, which track energy use and provide information that allows optimised use of electricity and heating, resulting in energy savings.
• Improved HVAC (heating, ventilation and air conditioning) controls: more effective monitoring and control of HVAC systems using connected sensors, including automatic response to occupancy levels of areas within buildings, leading to overall reductions in building energy consumption.
• Smart meter installation: providing greater visibility through detailed monitoring of energy and water use raises awareness of where savings can be achieved, helping to positively encourage energy saving behaviour.
CARBON EMISSIONS ABATEMENT FROM CONNECTED BUILDINGS (tCO2e/year)
UK Germany Spain France USA Europe
Connected Buildings 2,916,000 1,148,000 2,120,000 754,000 32,300,000 21,333,000
Buildingenergymanagementsystems(electricitycommercial)
470,000 78,000 1,079,000 19,000 7,716,000 5,347,000
Buildingenergymanagementsystems(gascommercial)
1,001,000 22,000 39,000 22,000 1,421,000 4,281,000
HVACcontrol-commercialbuildings
1,211,000 971,000 670,000 685,000 12,724,000 8,722,000
HVACcontrol-residentialbuildings
29,000 31,000 7,000 11,000 395,000 146,000
Smartmeters-watercommercial
50 250 1,000 230 9,000 6,000
Smartmeters-waterresidential
30 80 470 110 9,000 2,000
Smartmeters(electricityresidential)
109,000 44,000 318,000 15,000 9,849,000 2,557,000
Smartmeters(gasresidential)
95,000 2,000 5,000 2,000 175,000 273,000

28Mobile Carbon Impact
Future opportunities
Buildings are responsible for 19 percent of all anthropogenic greenhouse gas emissions. And most of these emissions come from energy demand for heating, ventilation and air conditioning (HVAC) and electricity in those buildings.20
Automated control over HVAC and lighting systems using connected systems appears to offer the greatest immediate potential for energy saving. Automation improves reliability and efficiency, versus manual control, and it lowers personnel costs and does not depend on individual users commitment to change.
Increasing levels of building automation are driven by a desire to reduce energy costs, which is supported by government regulation, building standards or energy efficiency incentives that aim to reduce carbon emissions on a national level. Energy utilities have been key to supporting the roll out of smart meters, particularly in the USA, which has allowed them to introduce dynamic pricing and shift loads away from periods of peak demand.
In some markets further impetus has been provided on a local government level as part of a wider effort to develop connected smart cities, with intelligent buildings as a key element. There is also a trend, especially in new builds, towards fully integrated building automation systems that go beyond just managing energy use to also control security, access, communications and safety systems.
Retrofit of these technologies into existing buildings will also have a key role to play in tackling climate change. This is particularly the case in developed countries, as it is likely that a large proportion of buildings in existence today will be around for decades to come. Using mobile rather than fixed-line communications for this retrofit should be attractive, as it can reduce the overall costs of installation by not requiring disruption from installing additional wiring.
Future potential for savings will arise when data from sensors can use advanced data analytics to provide deep insight into energy underperformance in buildings. This could be used to provide tailored, actionable advice to non-domestic customers without the need for site audits.
In the longer term, connected buildings will allow for rapid demand response to shifts in energy demand, allowing more intermittent renewable energy generation to be effectively integrated into the electricity grid. By reducing levels of peak demand this will also reduce the overall requirements for backup generation infrastructure, which will help countries to deal with rising electricity demand, particularly in the developing world.
Some of the major barriers to deployment include the initial installation costs for connected technology, as well as the long replacement cycles for building infrastructure, which can be measured in decades in some cases. Other barriers include the lack of effective governmental support in some countries, as well as the existence of multiple standards for building automation and smart meters. There are also concerns about cybersecurity, with the risk of connected building systems being disrupted.
The consumer research found a significant willingness for people to use their smartphone to control their energy use at home, which indicates that the potential for carbon savings exists as the technology becomes more widely adopted.
20 IPCC (2014) op.cit.

29Mobile Carbon Impact
14+68+18 Are you, or would you be willing in future, to use a mobile device to control your electrical appliances and heating/cooling at home?
Already do this
Willing to do this
Not willing to do this
Base: All respondents (4,000)68%
18% 14%

30Mobile Carbon Impact
Homes of the futureThe Weissenhoff Estate in Stuttgart, Germany is home to the B10 Aktivhaus, designed for the Stuttgart Institute of Sustainability. This house was built to demonstrate the potential for modern technology to create an extremely sustainable living space, and to go beyond even the renowned Passivhaus concept in terms of energy performance. It is designed to produce up to twice the energy that it needs and can use the excess to power electric cars, bikes and the house next door, or return it to the grid.
The house is operated by a predictive, self-learning energy management system that is connected to the internet and controlled by a mobile app. This system is able to track occupancy. When the house is empty then all systems are put into energy management mode. The system also tracks electric cars by GPS, so it can prepare for the occupants’ return home by turning on the heating, lighting and raising or lowering the blinds.
The mobile app connects by Wi-Fi when the occupier is inside the house and by mobile signal when they are away from the house. The app interface changes depending on the time of the day or year, to put an emphasis on the most likely features to be used. For example lighting controls become prominent when it gets dark. This allows the resident to monitor energy performance and manually control features.
While the B10 Aktivhaus pushes the boundaries of what is possible, home automation technology is a growing market, with an increasing number of systems available to allow for remote control of energy and electric appliances. These include Nest, Hive and Loxone. However, questions still exist over the levels of consumer demand for connected home functionality beyond the early adopters. More support may be required to explain the benefits and encourage the uptake of these systems.
Smarter workplacesASB Bank, one of New Zealand’s largest banks, worked with Vodafone to install over 200 M2M smart meters across its branches, offices and data centre. These meters collect data from power sources at 15 minute intervals, continuously feeding back to a central server every 30 minutes.
Thanks to the smart meters the bank was quickly able to discover that the remote monitoring controls they had been using were not working as expected, leading to lights, display signage and air conditioning units being left switched on out of hours. This helped them to immediately make significant energy savings and set new benchmark targets for different types of branches.
Using the smart meters, engineers are now able to monitor real-time performance and make changes at short notice, helping to maintain optimum performance. An employee intranet portal also allows staff to monitor their own workplace.
The smart meters have been used to track the actual impact of energy saving technologies that have been trialled, such as insulation, occupancy sensors, delay timers and higher performance window films. This allows the bank to get a clear picture of the actual return on investment if these technologies were rolled out across their entire estate.
After one year the smart meters had helped to save approximately NZ$675,000, with total cumulative savings after three years of NZ$2,650,000. Like-for-like energy consumption was reduced by 23 percent, resulting in saving more than 1,000 tonnes of carbon emissions a year.

31Mobile Carbon Impact
Cities and the use of mobile
Connected Cities refers to embedding smart M2M technology into city infrastructures, which allows a central control system to remotely monitor, analyse and act upon data from multiple different sources and utilities. However, it does not include some mechanisms related to energy generation and transportation infrastructure, which are covered elsewhere in the report. Currently cities bring together a lot of separate infrastructure projects and services, each of which have to be controlled and managed separately by local or national government. This often involves a great deal of manual intervention.
The main areas of carbon emissions abatement enabled by mobile communications technology today are in reducing fuel use from vehicles and electricity use from street lighting. Reducing fuel use includes avoiding traffic congestion, where vehicles are not moving but continuing to expend fuel, as well as managing speed, which can be particularly effective as it strongly influences the level of fuel consumption per journey. It also includes helping drivers to find a parking space, preventing unnecessary additional fuel use at the end of journeys. Additional environmental and social benefits include improving air quality and reducing noise pollution, as well as increased productivity.
Intelligent Transportation Systems (ITS) make use of sensors with M2M connectivity. These can be used to monitor traffic volumes, provide information to drivers and adjust traffic signals to optimise traffic flow. In some more advanced scenarios it is also possible to simulate traffic outcomes to make predictions and plan what to do in the event of road improvements, congestion or an accident. It also enables the implementation and enforcement of a number of traffic control measures, such as congestion charging or road tolls, or specific lanes for vehicles with multiple occupancy.

32Mobile Carbon Impact
Abatement mechanisms
There are four mechanisms for which it has been possible to quantify carbon emissions abatement from mobile. These are:
• Parking space monitoring: tracking car parking space availability can provide information or feedback to vehicles helping to route them towards available spaces, which saves fuel use from driving around looking for spaces.
• On-demand refuse connection (smart bins): using smart bins that are able to report when they are in need of emptying can help to make refuse collection more efficient, allowing for the optimisation of routes used and avoiding fuel use from unnecessary collections.
• Intelligent street lighting: energy demand for street lighting is being reduced thanks to new lamps that contain sensors and can be controlled remotely in order to switch off or dim lighting when it is not required, saving electricity use.
• Smart traffic management: with remote monitoring of traffic conditions, mobile technology can be used to dynamically change road signs or traffic signals in order to avoid congestion or curb excessive speed, give preference to public transportation, or to enforce a congestion charging policy, helping to avoid additional fuel use from vehicles.
UK Germany Spain France USA Europe
Connected Cities 435,000 498,000 226,000 383,000 1,990,000 3,018,000
Parkingspacemonitoring
9,000 12,000 6,000 12,000 260,000 74,000
Smartbins 20 20 10 10 70 100
Streetlighting 108,000 42,000 8,000 5,000 31,000 202,000
Trafficcongestionmanagement
38,000 61,000 40,000 45,000 212,000 403,000
Trafficcongestionmonitoring(roadsigns)
149,000 204,000 92,000 170,000 372,000 1,281,000
Trafficcongestionmonitoring(trafficlights)
131,000 179,000 81,000 150,000 1,116,000 1,057,000
CARBON EMISSIONS ABATEMENT FROM CONNECTED CITIES21 (tCO2e/year)
21 The quantification for reduced carbon emissions from traffic are not solely confined to urban environments, as the data used includes the national networks of highways and motorways which link cities.

33Mobile Carbon Impact
Future opportunities
Over half of the global population now live in urban areas, up from a third in 1960. And by 2050 two-thirds of humans are expected to live in urban areas.22 As such, addressing the carbon emissions from cities will be an absolutely crucial part in tackling climate change.
One of the greatest challenges for cities will be to put in place adequate infrastructure and services at a pace that can meet the demands of a rapidly growing urban population, making more efficient use of limited resources while reducing carbon emissions. There are also challenges in balancing the needs of multiple stakeholder groups with potentially divergent interests. This will be particularly problematic when retrofitting existing cities with smarter infrastructure, which will require long term planning and considerable amounts of finance.
High smartphone penetration rates could create a big role for citizens to directly participate and collaborate in smart city initiatives. This may involve providing feedback either automatically or manually, related to their location, which could provide valuable data for the city to use.
A key barrier to adoption is effectively integrating old or legacy infrastructure within new connected cities projects. In order to overcome this, open standards and solutions may be of assistance, although these may be difficult to implement universally given the fragmentation between city environments.
There are also issues with governance, as fully integrated projects may cut across multiple independent areas of authority, so ownership of projects may not always be clear and transparent. This lack of control could result in delays in rolling out upgrades, or in other circumstances it could mean that services will suffer long delays or be implemented in a suboptimal manner. It also raises concerns about data security and privacy.
A small but interesting example of public services being provided through mobile technology is ‘Smart Justice’, where minor court cases such as motoring offences can be handled online, reducing travel, paper work and bureaucracy.23 A more controversial example is using M2M technology for monitoring convicted offenders, allowing them to remain in society rather than being held in prison. This reduces the prison population and therefore reduces the carbon emissions of prisons, however this needs to be offset against the carbon emissions from the offender living at home and travelling in the community.
The consumer research found a significant willingness for people to use their smartphone to access public services, which indicates that the potential for carbon savings exists as the technology becomes more widely adopted.
22 United Nations Department of Economic and Social Affairs, Population Division (2014) World Urbanization Prospects: The 2014 Revision.23 Coleman, C. (2015) Online motoring service launched. BBC News. [Available at: http://www.bbc.co.uk/news/uk-31653760]
22+63+15 Are you, or would you be willing in future, to use a mobile device to access public services (e.g. voting, obtaining parking permits, paying fines, renewing driving license)?
Already do this
Willing to do this
Not willing to do this
Base: All respondents (4,000)63%
15% 22%

34Mobile Carbon Impact
Intelligent street lightingSmart street lighting is being rolled out in a number of cities around the world, helping to reduce local government electricity costs through greater connectivity. This allows the brightness of lights to be adjusted based on current conditions and need, for example they can be dimmed during a bright dawn or turned up for dealing with an emergency situation.
The city of San Diego in the USA is estimated to be saving more than $250,000 a year thanks to the implementation of an intelligent LED lighting system by GE Lighting, replacing bulbs within 3,000 decorative historical street lights around the city, which are now embedded with wireless control technology. These lights use innovative GPS location features to allow an accurate measurement of energy use by each individual street light.
As well as allowing for customisable levels of brightness, accurate energy metering means that the municipality will only pay for the energy they actually use. The connection also provides immediate notification for when maintenance is required. The lights are tied into GE Lighting’s ‘Intelligent Cities’ system, which is a software platform that can support advanced lighting control, optimising traffic management and parking, and environmental monitoring and analysis.
Smart parkingMilton Keynes Council in the UK worked with BT and the Open University to pilot a smart parking initiative that could help to reduce fuel use and vehicle emissions across the whole city. There are approximately 25,000 parking spaces in Milton Keynes, with forecasts that a further 12,000 may be required by 2020 to meet the city’s growth. But currently around 7,000 parking bays are empty at any one time, mostly because people don’t know where to find them. The cost of creating a new parking bay is around £15,000.
The pilot made use of sensors at the city’s railway station that could tell when a bay was occupied. These sensors wirelessly beam data to solar-powered receivers on lampposts, which are then relayed to a central data hub for analysis. This analysis is then displayed on a public information dashboard, as well as being available as an overlay to Google maps on a web browser, colour coding bays to show when they are free.
Seeing the impact of the pilot, the Council is now planning to extend the network to a further section of the city with 250 sensors. Full deployment across all of the city could result in a capital saving of £105 million for the city, as well as resulting in meaningful reductions in fuel use and vehicle emissions.

35Mobile Carbon Impact
Energy and the use of mobile
Connected Energy currently refers to the use of ICT, including mobile, in order to enable the creation of a low carbon energy generation and transmission infrastructure. This newly emerging, cleaner system is proving to be more decentralised, distributed and intermittent than what has previously existed.
It is here that mobile is also playing a key role, enabling the creation of smart grids that use advanced technology to actively manage and monitor the transport of electricity to meet varying levels of demand. This is helping to coordinate the needs of generators, grid operators, end users and electricity market stakeholders to minimise cost and environmental impact, while maximising system reliability, resilience and stability.
The most material impacts being made mobile on carbon emissions today are in M2M connections accommodating smaller scale electricity generation within the wider system. This is enabling individuals and smaller players to participate economically, creating new markets for greener, local energy. Short-range wireless technologies allow owners to access installation diagnostics, performance monitoring and the collection of environmental metrics. Finally, mobile connections are being integrated into the nascent infrastructure that will allow for the electrification of transportation. Electric vehicle users are able to access and pay for the growing networks of charging points thanks to these connections, which allow those points to be activated by use of smartphone apps, swipe cards or cards containing RFID chips.

36Mobile Carbon Impact
Abatement mechanisms
There are three mechanisms for which it has been possible to quantify carbon emissions abatement from mobile. These are:
• Electric vehicle infrastructure: mobile has an important role to play in supporting the use of electric vehicles, enabling charging point connection to electricity grids, and helping to facilitate the transition to low carbon transportation.
• Connection of decentralised energy generation (microgeneration): enabling low carbon microgeneration of energy by individuals and businesses to be exported to the grid by communicating capacity and pricing, as well as facilitating payment. Technologies assessed include combined heat and power (CHP), solar photovoltaics and wind turbines.
• Managed smart grids: by monitoring the distribution of an electricity or gas network, utilities can identify points of loss and improve efficiency.
UK Germany Spain France USA Europe
Connected Energy 1,536,000 5,255,000 939,000 221,000 9,265,000 15,523,000
Electricvehicleconnection 840 1,000 650 3,000 1,000 11,000
Micro-generation(CHPbusiness)
40 80 9 5 180 180
Micro-generation(CHPresidential)
7 10 2 1 50 40
Micro-generation(solarbusiness)
458,000 3,340,000 517,000 125,000 1,817,000 8,711,000
Micro-generation(solarresidential)
426,000 1,441,000 210,000 51,000 747,000 3,797,000
Micro-generation(windbusiness)
470,000 286,000 82,000 6,000 3,623,000 1,445,000
Micro-generation(windresidential)
58,000 45,000 8,000 990 347,000 165,000
SmartGrids-electricnetworkmanagement
98,000 114,000 102,000 19,000 2,434,000 1,117,000
SmartGrids-gasnetworkmanagement
25,000 28,000 19,000 15,000 296,000 277,000
CARBON EMISSIONS ABATEMENT FROM CONNECTED ENERGY (tCO2e/year)

37Mobile Carbon Impact
Future opportunities
The existing electricity system in most parts of the world has been designed for scale and centralisation. Universal grids provide energy from a small number of nodes in a network, with infrastructure built to meet peak levels of demand. This is well suited to fossil fuel and nuclear energy generation, where the economies of scale possible at larger sizes have shaped the utility business models that deliver current electricity supply.
This model is not well suited, however, to the development of a decentralised low carbon energy system. The need to take action on climate change has spurred significant investment into renewables and other technologies that can reduce greenhouse gas emissions by providing cleaner energy, greater efficiency or lower peak demand.
The creation of a sustainable, low carbon energy system is no easy challenge. Global demand for electricity continues to rise and this is mostly still being provided by ageing infrastructure built for an era of abundant fossil fuels. Connectivity is key to creating a resilient, low carbon electricity system at the lowest possible cost, which accommodates a range of generation and storage options.
Within the utility sector, mobile communications technologies are starting to be deployed to optimise the use and operating efficiency of generation and transmission assets, constantly monitoring for when things are not working as they should be, allowing for remote control and pre-emptive maintenance. These assets are typically expensive and have a significant cost associated with their failure, often far greater than the cost of M2M modules, which should lead to a far greater use of mobile in future. Mobile also allows utilities to aggregate multiple distributed sources of renewable energy and CHP into single virtual power plants, controlled from a central location.
Mobile is starting to enable a higher level of economic participation in electricity systems outside the utility sector, from the household with solar panels on the roof to the data centre powered by its own wind farm. Governments have been key to facilitating this transition, particularly through the introduction of feed-in tariffs. In developing countries, mobile is also supporting more affordable off-grid access to clean energy, helping address fuel poverty and improve health outcomes.
Taking a whole-system perspective, mobile is helping to reduce energy demand through smart grids. Currently energy infrastructure is designed to meet the highest level of simultaneous demand. This means that most of the time, the system is underutilised. Mobile connections provide the ability to reduce peak loads by dynamically responding to demand, increasing prices or automatically switching off non-critical systems for a short time. This can negate the need to build larger amounts of infrastructure, which is a particular benefit in the developing world where demand growth is very high, as well as in countries with existing, ageing systems that need to be maintained and taken off line while integrating new technologies.
The ability to collect and act on almost real time data thanks to mobile will allow better overall system planning, increasing options for integrating new loads such as electricity storage (including electric vehicles) and intermittent renewable generation. Increasing the geographic distribution of the electricity system, as well as the range of energy technologies used, also provides a greater resilience to disturbances, attacks and natural disasters.
As with any major changes to an incumbent system, the transition to a low carbon energy system and smart grids will face a number of serious barriers. The size of the challenge is magnified in this case by the physical and institutional complexity of the existing electricity system, the high capital costs of deployment, long development and replacement cycles for infrastructure, consumer privacy issues and other political sensitivities.

38Mobile Carbon Impact
These issues are compounded by an inertia in decision-making, as rapid innovation and cost-reduction curves across a variety of technologies risk making a major project look out-of-date or overly expensive by the time it reaches fruition. Within developing countries there are further issues related to lack of technical skills or availability of capital, as well as high installation costs that cannot be justified economically in the absence of subsidies.
These barriers are gradually being overcome as small and large scale pilot projects are demonstrating the successful use of mobile communications technology to enable low carbon energy. This is helping to empirically prove the extent to which smart grid technology can provide equal or improved levels of power quality and reliability.
In most cases government intervention is required to drive the transition to create the market conditions for a lower carbon energy system, through regulations, subsidies or grants. However, some innovative business models are demonstrating that mobile communications technology can directly enable savings in areas such as demand response. For example, in the UK companies such as Open Energi and KIWI Power act as aggregators, managing the load of multiple large electricity users in order to temporarily turn down energy consumption to balance the grid and reduce peak demand.
Mobile business models BBOX is a company founded by three former students of Imperial College London, with the ambition of helping to provide off-grid renewable energy in the developing world. Mobile connectivity is a fundamental element that helps to run the company’s business model effectively, by allowing solar panels to be monitored, managed and controlled remotely.
Solar panels are provided on credit finance, with users commonly providing monthly payments to match what they would have previously paid for kerosene, batteries and phone charging services. This allows them to access clean renewable energy while working towards eventual ownership of the solar panels, for no additional energy cost.
Working with Vodafone, BBOX is able to remotely connect its units distributed in rural areas across Kenya, Uganda and Rwanda by using M2M SIMs. Each panel can then be activated, updated and managed from the company’s London headquarters, with access to real-time data on customer usage, payments and hardware faults. In order to maintain repayment schedules panels can be turned off when required.
The model has already proved to be successful in helping hundreds of thousands of people in the developing world to leapfrog the need for conventional grid connection and access low carbon renewable energy. BBOX currently distributes products to over 40 countries and aims to have 100,000 units in the market by the end of 2016.

39Mobile Carbon Impact
Health and the use of mobile
Connected Health explores the impact that mobile is having on human health and access to healthcare. These have been substantially improved in many ways through the use of ICT and access to mobile communications technology. But much of what has been made possible is new or additional to what was previously available, meaning that it has not resulted in readily quantifiable direct reductions to greenhouse gas emissions.
The major abatement mechanism that has been quantified has been the avoidance of carbon emissions from transport thanks to the remote delivery of healthcare. As quantification has only taken place in the USA and Europe – regions with comparatively developed healthcare infrastructure – in many cases those avoided journeys are of a comparatively short distance. However, in developing or geographically remote regions of the world, where greater distances need to be travelled to access services, the abatement potential may be considerably larger.
It has also been possible to recognise benefits from reduced stays in hospital, which can be more resource intensive than remaining at home. Reductions in carbon emissions are attributed to reducing journeys to and from the hospital by visitors, as well as the fact energy use per person is higher hospitals than in the home.

40Mobile Carbon Impact
Abatement mechanisms
There are two mechanisms for which it has been possible to quantify carbon emissions abatement from mobile. These are:
• Smart home care: monitoring chronic or high risk patients at home with mobile technology can avoid repeated car journeys to hospital by the patient, or by health professionals to the patient’s home, as well as provide better pre-emptive medical intervention to reduce the total number of days spent in hospital.
• Connected out of hospital care: remote monitoring and assisted living for patients out of hospital (compared to no remote monitoring) helps to reduce the number of days needed to be spent by patients in hospital and can help to avoid additional journeys and reduce resource consumption per patient.
UK Germany Spain France USA Europe
Connected Health 47,000 89,000 29,000 51,000 3,540,000 406,000
SmartHealth-homecare
43,000 82,000 26,000 46,000 3,361,000 372,000
SmartHealth-outofhospitalcare
4,000 7,000 3,000 4,000 179,000 33,000
Future opportunities
There are already a number of nascent technologies being developed that are allowing healthcare to be provided remotely, thanks to the use of mobile. These include sensors that can be attached to smartphones to test blood, DNA and urine. This is allowing care to be provided in increasingly remote locations, which is particularly beneficial in developing countries and remote areas.
However, it would appear that the greatest future opportunities for mobile to have an impact on greenhouse gas emissions in healthcare is through its potential to stop medical conditions from arising in the first place. Smartphones and other smart devices, such as watches, are now being used to track fitness and diet, encouraging more healthy lifestyles and helping prevent non-communicable diseases such as obesity or diabetes. According to a report from the McKinsey Global Institute the global cost of obesity is around $2 trillion, accounting for between two and seven percent of healthcare spending in developed economies and rising to as much as 20 percent when accounting for associated diseases.24
It is also worth mentioning that mobile is helping to reduce the direct and indirect impacts of providing healthcare through its use of buildings, transport and manufactured products. Although it has not been possible to separate out and quantify that impact within this section, it forms a significant part of the quantification in other categories.
CARBON EMISSIONS ABATEMENT FROM CONNECTED HEALTH (tCO2e/year)
24 Dobbs et al (2014) How the world could better fight obesity. McKinsey Global Institute.

41Mobile Carbon Impact
For example, the National Health Service (NHS) in the UK measured its end-to-end carbon footprint for 2012 and found that it was 25 million tonnes, which is approximately one third of the annual emissions from heating every home in the UK. This was composed of the goods and services it procured (61%), building energy use (17%), travel (13%) and commissioned health services from outside the NHS (9%).
The consumer research found a significant willingness for people to use their smartphone to access health remotely, saving time and travel for visits to a doctor.
58%
22% 20%
20+58+2210+63+27
Are you, or would you be willing in future, to replace a non-emergency visit to the doctor by making a phone call?
Already do this
Willing to do this
Not willing to do this
Are you, or would you be willing in future, to replace a non-emergency visit to the doctor by making a video call?
Already do this
Willing to do this
Not willing to do this
Base: All respondents (4,000)
Base: All respondents (4,000)63%
27%
58%
22% 20%
10%

42Mobile Carbon Impact
23+60+17 Already do this
Willing to do this
Not willing to do this
Are you, or would you be willing in future, to use a mobile device to seek health advice?
Base: All respondents (4,000)60%
16% 23%
23+62+15Are you, or would you be willing in future, to use a mobile device to monitor your fitness and health?
Already do this
Willing to do this
Not willing to do this
Base: All respondents (4,000)
62%
15% 23%
Remotely improving patient outcomesTelehealth is the rapidly growing field of providing medical services through communications technology. This ranges from video consultations with general practitioners, through to actively tracking chronic conditions and alerting risks.
For example, it is possible to wirelessly track blood pressure and heart rate, allowing patients to monitor and manage conditions from their own home, or have readings relayed to a monitoring centre. In Bangalore, India, Vodafone has supported the company Diabetacare to complete a successful pilot to remotely monitor the blood-sugar levels of 800 individuals with diabetes using M2M connections.
BT has also been a pioneer in this area, helping to enable telehealth services within the UK. The company currently provides services for Cornwall Council in the sparsely populated southwest of the country. This is helping to substantially reduce the number of visits to the doctor from certain patient groups, as well as reducing emergency visits to hospital and ambulance call-outs. Trials by the Department of Health in the UK have found that use of telehealth services helped to materially reduce mortality rates and overall costs per patient.

43Mobile Carbon Impact
Industry and the use of mobile
Connected Industry refers to the use of mobile communications technologies, particularly M2M connections, to support economic activity concerned with the extraction and processing of raw materials into finished products or services. In addition to the manufacturing industry, this includes the construction and utilities sectors, as well as the supply chain management activities for the transportation and storage of raw materials, intermediates and products. In industry there have been a wide variety of ICT innovations enabling faster, more efficient and more flexible processes to produce higher-quality goods at reduced costs, reducing resource consumption and lowering carbon emissions. These include: improved energy monitoring and management systems with better data capture and analysis tools; new wireless sensors that send information to a central system for analysis; virtual process testing and simulation; improved automation and synchronisation of processes, resulting in less waste; improved detection of machine wear and maintenance requirements; more effective implementation of produce-to-demand strategies; improved quality control; and less off-specification production.

44Mobile Carbon Impact
Abatement mechanisms
There are five main mechanisms for which it has been possible to quantify material carbon emissions abatement from mobile. These are:
• Automating industrial processes: the use of M2M connections helps to improve the efficiency and productivity of industrial processes, helping to reduce energy consumption.
• Field force automation: improved connectivity helps to increase productivity and reduce travel by mobile work teams, reducing overall vehicle fuel use.
• Improved supply chain and inventory management: mobile can be used to monitor goods and equipment helping to improve efficiency in logistics and reduce wastage, particularly for perishable goods. This includes connected vending machines that can be remotely monitored, improving the logistics for restocking.
• Enabling cashless payment (point of sale): mobile is used to facilitate payment at point of sale, helping the economy to use less physical cash and to avoid fuel use from its production and transportation.
• Enhanced detection of inefficiency (water grid): sensors can help to identify areas of loss and enable rapid repairs, preventing unnecessary resource use, for example where utilities are able to use mobile to detect leaks in the water grid.25
UK Germany Spain France USA Europe
Connected Industry 88,000 196,000 65,000 32,000 1,837,000 808,000
Automationinindustrialprocesses
37,000 92,000 20,000 7,000 324,000 319,000
Fieldforceautomation
5,000 5,000 5,000 7,000 101,000 30,000
Supplychainmanagement
4,000 5,000 3,000 4,000 23,000 44,000
Inventorymanagement
37,000 85,000 32,000 8,000 1,309,000 364,000
Vendingmachines 6,000 9,000 5,000 6,000 79,000 47,000
Pointofsale 290 170 270 310 2,000 3,000
Watergrid-leakdetection
1 10 3 3 50 40
25 Construction equipment monitoring and construction materials monitoring have not been quantified in the report, due to the relatively low contribution to carbon emissions reduction.
CARBON EMISSIONS ABATEMENT FROM CONNECTED INDUSTRY (tCO2e/year)

45Mobile Carbon Impact
Future opportunities
The future potential for mobile enabled improvements in emissions here is considered to be very large. This is because the technology has a range of applications, from supplier to customer, as well as vertically, across different company functions and value chains.
ICT solutions can enable increases in productivity and efficiency, as well as a significant simplification of processes. As such, many traditional industrial sectors are experiencing an era of innovation thanks to the power of advanced computing, improved analytics, low-cost sensor technology and new levels of connectivity between products, value chains and business models. Many of these solutions can be delivered either through fixed connections or mobile, with the latter increasingly becoming the preferred option.
This new era of connectivity is commonly referred to as the fourth industrial revolution or Industry 4.0, which was originally the name of a programme under the German government’s High-Tech Strategy, focusing on the use of ICT in manufacturing industry to improve efficiency.
However, there are some significant barriers to opportunities being fully exploited. As might be expected in sometimes highly competitive industries, data is closely guarded and access is limited. This lack of data availability and transparency makes it difficult for comparisons to be made, which could otherwise highlight inefficiencies.
In some parts of the world there are counterproductive policies, which prevent technologies being adopted. For example, if an industry has energy costs heavily subsidised then there are lower incentives for taking action to improve efficiency.
Adoption rates for available technologies are slowed in some industries by the high capital costs of plant and machinery, which are expected to operate over long lifecycles. This creates an inertia that holds back process change or upgrade cycles in some areas.
Governments and industry associations have a role to play in driving change, which can be accelerated by regulations or standards encouraging greater levels of energy efficiency or emissions reductions. Ultimately, businesses will be driven by the strength of the business case to act to improve efficiency. As technology becomes cheaper and more easily integrated, or solutions are demonstrated and deployed at scale, this will increase the use of mobile-enabled technology that can reduce emissions.

46Mobile Carbon Impact
Industrial internetA 2014 report from Strategy& and PwC based on a survey of 235 German industrial companies investigating the potential of the industrial internet, found that businesses were particularly optimistic about the opportunities for increased productivity and resource efficiency. The survey revealed that over the next five years these companies were expecting to spend an average of 3.3 percent of their annual revenues on industrial internet solutions.
Although only one fifth of companies surveyed had already digitised key processes along the value chain, in five years’ time 85 percent expect to have done so across all important business divisions. This is associated with an average increase in productivity of 18 percent over the five years, leading to growing revenues by two to three percent a year.
Out of the benefits listed by companies, better planning and control in production and logistics, as well as improved quality, can be directly linked to a reduction in energy use. These two categories together make up 34 percent of the total ICT-enabled improvements expected. This is likely to involve significant use of mobile, particularly in logistics where RFID and NFC technologies are commonly used.
Smart factoriesIncreasing levels of digitisation and connectivity in manufacturing are helping to deliver unprecedented levels of efficiency. For example, Polibol, a flexible packaging manufacturer in Zaragoza, Spain makes use of Microsoft’s Azure cloud platform connected to sensors made by Libelium.
These sensors monitor the temperature of critical processes, environmental variables and other parameters to track quality and working conditions. This helps to minimise the monitoring and management costs to effectively optimise the manufacturing process and increase product quality.
The scale of the potential for improvement in product quality using ICT, including mobile connections, can be seen in one of the world’s most advanced factories operated by Siemens. An electronics plant in Amberg, Germany has been created as a Digital Factory, designed in such a way that products communicate with machines, and processes are integrated, controlled and optimised using IT.
Using advanced tools for planning and managing production processes in this plant has helped to improve overall production quality to unprecedented levels of 99.99885 percent. This helps to avoid the waste, inefficiency and emissions associated with producing defective or low-quality products.

47Mobile Carbon Impact
Living and the use of mobile
Connected Living refers to consumer use of certain apps or online services which can result in a reduction in their personal carbon footprint. This category includes the use of smartphones with smart home control apps and satnav apps. The availability of mobile communications technologies is contributing to both major and minor changes in people’s behaviour in their everyday lives.
The greatest impact today that is being made in this area is making certain journeys redundant thanks to enhanced connectivity, reducing emissions from fuel use. The largest element of this is avoiding travel to visit family and friends, where in some circumstances this can be replaced with phone or video calls using mobile connections. There is also avoided travel through availability of online services, such as mobile banking or shopping.
Further reductions in transport emissions are being enabled by satnav apps which allow for better planning of routes or avoiding traffic, as well as through eco-driving apps that promote more efficient use of fuel, and ride sharing services that avoid additional journeys. It is worth noting that this refers just to use of apps on smartphones. Overlap has been avoided between mechanisms in the Connected Transportation section, where standalone or integrated satnav devices are included.
Another area where emissions are being avoided include remotely controlling heating, cooling and appliance electricity use in homes. This refers specifically to the use of smartphone apps in domestic buildings, so that overlap is avoided with mechanisms in the Connected Buildings section, which includes similar mechanisms for non-domestic buildings and the use of automated controls.

48Mobile Carbon Impact
Many of the abatement mechanisms can be used with fixed-line or mobile connections. For example, internet banking could be used on a laptop plugged into a router as well as on a mobile phone, but both can avoid physical journeys to the bank. Where this is the case then assumptions have been made in quantifications of what percentage of the impact should be allocated to mobile.
Finally, mobile is helping to enable peer-to-peer economic (as well as non-economic) activities. Unwanted goods can be sold, rented or freely given away, helping to reduce waste and avoid production of additional goods. And the provision of services can also be enabled. For example, the renting out of unused space for accommodation can help avoid carbon emissions when compared to the emissions associated with a stay in a hotel.
Abatement mechanisms
Mechanisms for which it has been possible to quantify carbon emissions abatement from mobile fall within five main areas. These are:
• Enabling the sharing economy: mobile apps are helping to overcome barriers which were preventing direct peer-to-peer sharing or exchange, for example by renting goods, finding new owners for unwanted goods, sharing car journeys or offering unused space for accommodation.
• Keeping in touch virtually (friends and family): the use of mobile devices to connect with family and friends through voice and video calling can help to reduce the frequency of travel to visit them, avoiding the associated transportation emissions.
• Remote access to goods and services (mobile banking and shopping): mobile access can avoid journeys to retail locations in order to shop for goods or access services such as banking.
• Smart home control: smartphones can be used to remotely operate appliances, heating and cooling within the home, helping to reduce electricity and gas demand.
• Improving route planning and eco-driving: map or satnav apps on smartphones can be used to plan journeys more efficiently, minimising the distance to travel and avoiding traffic. Similarly, eco-driving apps can minimise fuel use by providing guidance and supporting behaviour change.

49Mobile Carbon Impact
UK Germany Spain France USA Europe
Connected Living 1,259,000 1,412,000 1,079,000 1,163,000 8,889,000 16,123,000
Accommodationsharing 262,000 276,000 274,000 240,000 928,000 3,583,000
Ridesharing 47,000 47,000 39,000 41,000 219,000 586,000
Sharingeconomy(goodssharing)
96,000 74,000 56,000 64,000 398,000 955,000
Avoidingsocialjourneys(friends&family)
410,000 571,000 459,000 496,000 2,748,000 6,625,000
Mobilebanking 178,000 225,000 130,000 184,000 1,733,000 2,067,000
Mobileshopping 37,000 31,000 3,000 12,000 347,000 153,000
Smarthomes 104,000 54,000 21,000 19,000 1,562,000 599,000
Useofmobileasasatnav
101,000 116,000 81,000 90,000 848,000 1,304,000
Eco-driving 24,000 19,000 16,000 17,000 108,000 252,000
Future opportunities
Many of the technologies or platforms that enable the mechanisms for emissions reductions quantified within this category have only been widely available for a comparatively short time. Even in areas where digital services – such as online banking or shopping – are quite frequently used, the majority of use in developed countries is still through fixed-line connections rather than mobile. As such there has been relatively limited impact to date due to low user numbers.
However, recent experience in a number of technology areas has shown that when the user experience is of sufficient quality, the use is normalised, and a critical mass of users is established, then digital services can rapidly increase levels of public acceptance and adoption. This can be seen, for example, with a number of video and messaging apps, as well as social media networks.
Similarly, new products such as smart systems that enable remote control of home energy use are only just beginning to be adopted at scale. A number of businesses have been investing in bringing these technologies to the mass market, with products such as Tado, Honeywell’s Lyric and Evohome, Google’s Nest and Hive all supporting smartphone control. As with eco-driving or ride sharing apps, the opportunities for cost saving provide economic incentives to adopt these technologies, which can deliver environmental benefits at the same time. However, the strength of those incentives would be diminished if the cost of energy falls significantly.
CARBON EMISSIONS ABATEMENT FROM CONNECTED LIVING (tCO2e/year)

50Mobile Carbon Impact
The sharing economy and other digital services promise to disrupt a number of existing markets, by offering new levels of convenience, or by allowing individuals to access marketplaces and create economic value where previously the barriers to entry or risks were too high. It should be noted that these services tend to be of greatest application in dense clusters of population, such as cities, where there is better connectivity.
Currently a number of businesses and entrepreneurs are exploring how ICT connectivity, including the use of mobile, can be effectively used to introduce the use of products as services, or to disrupt existing business models and value paradigms across a range of sectors. In most of these cases the business opportunity comes from increasing levels of efficiency and convenience, which are frequently associated with reductions in environmental impact. This may not be the case every time and further analysis would be needed for individual circumstances, to investigate the actual impact on carbon emissions, including rebound effects.
There are, therefore, ample reasons to expect the positive growth in abatement effect to be rapid and significant for most of the mechanisms outlined above. These should be joined by new mechanisms as ICT disrupts other sectors. This is likely to parallel the expected growth in user numbers of the mobile technologies or platforms, which in many cases has already been exponential. For example accommodation sharing service, Airbnb was only founded in 2008, but at the time of publication, claims to have supported over 40 million guests to book stays across 1.5 million listings in more than 190 countries.
These opportunities for reducing personal carbon footprints require changes in behaviour. In order to facilitate these changes, the new behaviours need to be made easier or more attractive than the incumbent alternatives. To achieve this it will be important to give individuals confidence in the trustworthiness or security of the services they are using. High quality user experience, as well as industry regulation and minimum standards, will be helpful in increasing the rates of adoption.
The consumer research found that over 50 percent of people already, or would be willing to, adopt a number of behaviours using their smartphones that have carbon saving benefits. In some cases, such as mobile banking and influencing travel plans, the number of people already doing this is over 50 percent.
60+34+6Are you, or would you be willing in future, to use your mobile device to make or influence travel plans (e.g. mapping routes, checking traffic, checking public transport times)?
Already do this
Willing to do this
Not willing to do this
34%
6%
61%
Base: All respondents (4,000)

51Mobile Carbon Impact
+15+42+43
42%
31% 27%
68%28+41+15+16Do you use satnav for planning routes, following routes, and avoiding traffic congestion on a mobile device such as a smartphone?
34% 61%
Base: All drivers (3,220)
41%
27%16%
15%All of the time
Some of the time
Rarely
Never
27+42+31Are you, or would you be willing in future, to replace a visit to friends or family by making a video call using a mobile device?
Already do this
Willing to do this
Not willing to do this
Base: All respondents (4,000)42%
31% 27%
Are you, or would you be willing in future, to use your mobile device to find someone to share a car journey with?
Already do this
Willing to do this
Not willing to do this
Base: All respondents (4,000)
43%
15%
42%

52Mobile Carbon Impact
60+34+6 52+33+15
Are you, or would you be willing in future, to replace a visit to the bank by using a mobile device?
Already do this
Willing to do this
Not willing to do this
Base: All respondents (4,000)
33%
15%
52%
41+42+17Are you, or would you be willing in future, to replace a visit to the shops by using a mobile device?
Already do this
Willing to do this
Not willing to do this
Base: All respondents (4,000)
42%
17%
41%
28+50+22
Are you, or would you be willing in future, to use a mobile device to sell, rent, share items that you own?
Already do this
Willing to do this
Not willing to do this
Base: All respondents (4,000)
50%
22% 28%

53Mobile Carbon Impact
27+51+22 25+49+26
Are you, or would you be willing in future, to use a mobile device to buy or rent items from others?
Already do this
Willing to do this
Not willing to do this
Are you, or would you be willing in future, to use a mobile device to find and book accommodation in someone’s home instead of using a hotel?
Already do this
Willing to do this
Not willing to do this
Base: All respondents (4,000)
Base: All respondents (4,000)
27%
51%
22%
49%
26% 25%
14+68+18
Are you, or would you be willing in future, to use a mobile device to control your electrical appliances and heating/cooling at home?
Already do this
Willing to do this
Not willing to do this
Base: All respondents (4,000)68%
18% 14%

54Mobile Carbon Impact

55Mobile Carbon Impact
Transportation and the use of mobile
Connected Transportation refers to the use of mobile connections to optimise the route planning and increase the efficiency of use for various modes of transport. Improving efficiency includes fleet management, speed management, loading optimisation and improvement of driver behaviour. Route optimisation can include optimisation of single mode transport as well as optimising transportation between different modes (e.g. overall optimisation of train and truck transport). Transport across land, sea and air is responsible for approximately 14 percent of global greenhouse gas emissions.26
The main method of carbon emissions reduction is through decreasing fossil fuel use by shortening journeys and improving vehicle efficiency. The greatest impact is currently being had through improving driver behaviour, through monitoring and providing advice on driving technique, or enabling usage-based insurance that economically incentivises more efficient driving.
It should be noted that the quantifications in this category have explicitly excluded the personal use of satnav on smartphones for improved route planning, as well as the use of smartphone apps to increase the efficiency of driving technique in personal vehicles. This is to avoid overlap with the Connected Living category, where these mechanisms have been included. However, this category does include the impact from integrated or standalone satnav devices in personal vehicles, reductions in fleet vehicle emissions, and mechanisms where mobile enables a modal shift to public transport.
26 IPCC (2014) Summary for Policymakers. In: Climate Change 2014: Mitigation of Climate Change. Contribution of Working Group III to the Fifth Assessment Report of the Intergovernmental Panel on Climate Change.

56Mobile Carbon Impact
Electric vehicles have been included in the Connected Energy category, as they are enabled through smart grid connections and metering.
Significant reductions in emissions are currently being made from encouraging modal shift to public transport, by improving its usability through the provision of real time information via mobile connections, allowing users to plan journeys more effectively. This is done through a vehicle tracking system or Automatic Vehicle Location (AVL) technology. Mobile is also used in smart payment systems, making ticketing systems simpler and more user-friendly.
Other savings are being achieved through improved logistics, where the use of satellite navigation is important for route planning and fleet management. Smaller impacts are also being realised due to the use of mobile connections for managing fleet vehicle loads, pre-empting maintenance issues and providing access to car clubs that allow multiple users to access shared vehicles.
Abatement mechanisms
There are three groups of mechanisms for which it has been possible to quantify carbon emissions abatement from mobile. These are:
• Enabling smarter logistics: mobile technology can optimise multi-modal land and sea fleets so that they operate more efficiently through better routing, avoiding areas of travel, optimising vehicle loads and improving the fuel efficiency of road vehicles. (Includes: Fleet vehicle driver behaviour improvement, Smart Logistics - efficient routing & fleet management, Smart Logistics - loading optimisation, Sea fleet)
• Reducing the impact of breakdowns: mobile technology can optimise multi-modal land and sea fleets so that they operate more efficiently through better routing, avoiding areas of travel, optimising vehicle loads and improving the fuel efficiency of road vehicles. (Includes: Fleet vehicle driver behaviour improvement, Smart Logistics - efficient routing & fleet management, Smart Logistics - loading optimisation, Sea fleet)
• Changing individual transport choices and driving behaviour: mobile connectivity can help individuals to make lower carbon transport decisions in various ways, such as: improved route guidance using satellite navigation; supporting access to on-demand car sharing services through car clubs; helping improve public transport user experience with mobile ticketing and better journey planning; and enabling insurance policies that actively monitor driving to reduce premium costs for safer, more fuel efficient driving. (Includes: Satellite navigation, Car sharing (car clubs), Usability of public transport, Usage based car insurance)

57Mobile Carbon Impact
UK Germany Spain France USA Europe
Connected Transportation 2,340,000 4,255,000 1,197,000 2,709,000 24,756,000 26,173,000
Fleetvehicledriverbehaviourimprovement
803,000 1,060,000 203,000 1,314,000 10,059,000 5,800,000
SmartLogistics-efficientrouting&fleetmanagement
293,000 315,000 65,000 495,000 3,259,000 1,973,000
SmartLogistics-loadingoptimisation
117,000 126,000 26,000 198,000 1,303,000 789,000
Seafleet 309,000 1,803,000 116,000 109,000 517,000 8,183,000
Remotevehicleconditionmonitoring
100 150 50 120 990 900
Roadsideassistance 20 40 20 30 140 240
Satellitenavigation 23,000 23,000 6,000 31,000 27,000 184,000
Carsharing(carclubs) 86,000 309,000 86,000 86,000 341,000 589,000
Usabilityofpublictransport 536,000 466,000 567,000 364,000 8,075,000 6,556,000
Usagebasedcarinsurance 173,000 154,000 127,000 111,000 1,174,000 2,097,000
Future opportunities
The most critical element in enabling a full transition to a low carbon transportation system is the development of engine technologies that harness clean energy, such as electricity, hydrogen or biofuels. But it is likely that the development and deployment of clean engine technologies across all forms of transportation will take several decades. The use of fossil fuels in this sector is currently expected to continue well into the latter half of the twenty-first century. And mobile is already helping to ensure that this impact is minimised, by improving the efficiency of vehicles and sea fleets.
As the software for satnav technology continues to improve, there is the opportunity for it to be integrated with data from other sources, such as traffic cameras. This can provide drivers with constant updates on the most efficient routes. Software that proactively supports better driver behaviour has not yet been widely adopted, although where it is being used it is delivering very good results. But it is reasonable to expect that, as the technology advances and becomes more readily available on smartphones, more and more fleets and individuals will begin using this in order to save money on fuel costs.
CARBON EMISSIONS ABATEMENT FROM CONNECTED TRANSPORTATION (tCO2e/year)

58Mobile Carbon Impact
In the longer term mobile will have an important role to play in supporting the transition away from personal vehicle ownership, encouraging a shift towards the use of less carbon intensive modes of transport. For example, real-time transport planning apps or digital services that support a modal shift to public transport have only become common in larger cities comparatively recently.
Greater penetration of smartphones and the availability of mobile data should increase the reduction in carbon emissions through this mechanism in the future. But modal shift will not be particularly effective where public transport systems are inadequate. However, it is expected that there will be substantial future investment in public transport systems in response to the need to address climate change, meaning that use will become more commonplace.
Mobile is also enabling business models for on-demand vehicle sharing, such as the Autolib’ electric vehicle hire system operated by the city of Paris, or the company Zipcar which now operates more than 10,000 vehicles in the USA, Canada, the UK, Spain, France, Austria and Turkey. These have been enabled by the ready availability of mobile data or Wi-Fi, which can be accessed through smartphones, to allow for locating the nearest vehicle, gaining access and proving payment.
The adoption of usage-based insurance systems for vehicles allows for incentivising safer, more fuel efficient driving. Unsurprisingly a number of insurers are interested in this in order to more accurately manage risk and assess premiums based on granular individual data. Its adoption in Europe has been boosted following a recent ruling by the European Court of Justice preventing insurers from taking into account the sex of the applicant when setting premiums. This has meant that insurers have had to raise costs for younger female drivers, grouping them with typically riskier younger male drivers. However, there are some privacy concerns with the use of this system.
Finally, mobile communications technology has a role to play in enabling the emerging technology of self-driving cars. This will involve not just satellite connections for route planning, but also some measure of vehicle-to-vehicle (V2V) communications. As self-driving cars take human decision making out of the driving experience, these can be automated to be used at an optimised efficiency. Self-driving cars could potentially be used in some form of on-demand taxi or public transportation system, where smartphones are used in order to access the service.
Research conducted for this report has found that there is fairly broad support for this technology in principle around the world, particularly in Mexico where almost two-thirds are positive about it. Even in the country with the highest levels of opposition, the UK, just three in ten are completely opposed to using the technology. However, the actual rate of adoption will depend upon convincing the public of its improved safety and convenience.

59Mobile Carbon Impact
0%
10%
20%
30%
40%
50%
60%
70%
Would you consider using a self-driving car?
UK South Korea
Spain
Mexico USA
Yes Maybe Don’t knowNo
In general, the consumer research found that a majority of respondents were prepared to adopt new behaviours and new technologies that could help them to reduce their personal carbon emissions from driving cars, or by using mobile technology to help them switch to public transport more often.

60Mobile Carbon Impact
19+25+12+448+55+22+12+3
Do you use satnav for planning routes, following routes, and avoiding traffic congestion on a fixed satnav in your vehicle?
Base: All drivers (3,220)
All of the time
Some of the time
Rarely
Never
44%
19%
8%
3%
55%22%
12%
25%
12%
Would you be willing to have a device fitted to your vehicle which records the way you drive, if driving in a safer and more environmentally-friendly way reduced your car insurance?
Base: All drivers (3,220)
Yes, I already use one
Yes, I would consider it
Maybe
No
Don’t know
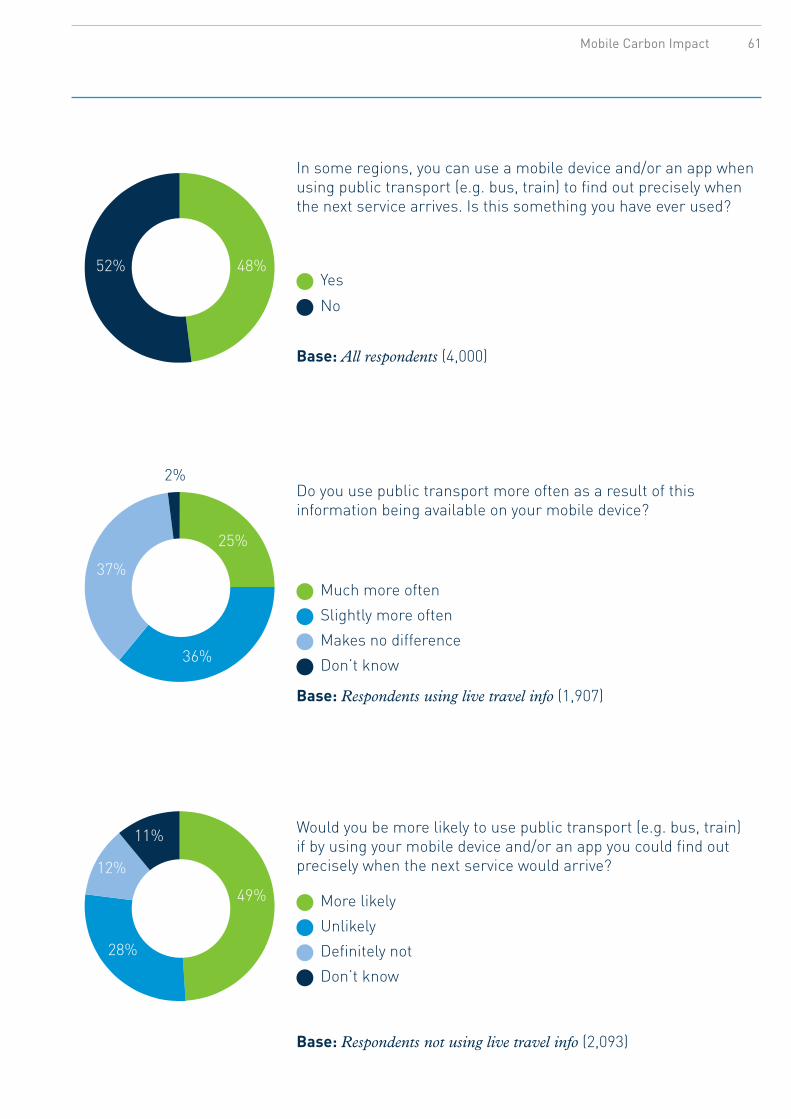
61Mobile Carbon Impact
48+52 25+36+37+249+28+12+11
Base: All respondents (4,000)
Base: Respondents using live travel info (1,907)
Base: Respondents not using live travel info (2,093)
2%
In some regions, you can use a mobile device and/or an app when using public transport (e.g. bus, train) to find out precisely when the next service arrives. Is this something you have ever used?
Yes
No
Do you use public transport more often as a result of this information being available on your mobile device?
Much more often
Slightly more often
Makes no difference
Don’t know
Would you be more likely to use public transport (e.g. bus, train) if by using your mobile device and/or an app you could find out precisely when the next service would arrive?
More likely
Unlikely
Definitely not
Don’t know
48%
25%
49%
28%
12%
11%
36%
37%
52%

62Mobile Carbon Impact++
40+40+15+55%
40%
39%
15%
Base: All drivers (3,220)
Self-driving cars are being developed. These high-tech vehicles would know their surroundings and the position of other cars and would effectively drive themselves. If they were fully developed and legal, would you consider using a self-driving car?
Yes, I would consider
Maybe
No
Don’t know
Improving driver behaviourThe HGV (heavy goods vehicle) sector accounts for 21 percent of all the UK’s carbon emissions from transport. Fuel efficiency is central to reducing this. As one of the UK’s largest haulage companies, Turners of Soham uses substantial amounts of fuel in more than 1,200 trucks. This fuel use represents one of the most significant overheads for the business, as well as accounting for the majority of the company’s carbon emissions.
In order to reduce fuel use and carbon emissions the company made use of an award-winning smartphone app, Driver Assist, as part of its innovative fleet management strategy. The app, developed in conjunction with BT and transport consultancy Dartt, was designed to assist HGV drivers with route-planning and improved driving behaviour. It operates on a standard smartphone, without the need for any specialist hardware.
The Driver Assist app informs drivers of the most appropriate location to start good coasting, where the HGV is in gear, with zero throttle and no cruise control. Using terrain data, road layout information, vehicle speed and other sensor data, the optimum driving technique is identified to maximise fuel efficiency, reducing emissions. Safety has also been taken into account, with the app using a voice interface designed to reduce driver distraction.

63Mobile Carbon Impact
Working and the use of mobile
Connected Working refers to the use of ICT, including mobile, in order to allow productive remote working from outside of the traditional workspace. Within this category ‘work’ has been defined broadly, to include not just paid employment but also education.
Practically, the enablement of remote working involves a combination of several technologies including home broadband internet access, smartphones, mobile data, productivity software and cloud computing. Because mobile communications is a part of this mix, appropriate allocations have been made for the impact of the technology within quantifications for different mechanisms, which are detailed in the methodology in Appendix 3.
The most significant carbon reductions achieved within this category are through reducing fuel use and the associated emissions from traveling back and forth from a workplace or educational establishment, or through replacing business travel to meetings thanks to audio or video connectivity. Further savings are made through reducing building energy consumption, by rationalising office space or reducing occupancy levels.

64Mobile Carbon Impact
Abatement mechanisms
There are two mechanisms for which it has been possible to quantify carbon emissions abatement from mobile. These are:
• Reducing business travel (audio conferencing): it is possible to reduce fuel use from business travel with audio and video connectivity through mobile, as well as access to collaborative working software.
• Enabling home working: improved connectivity helps to increase productivity and reduce travel by mobile work teams, reducing overall vehicle fuel use.
UK Germany Spain France USA Europe
Connected Working 810,000 1,340,000 759,000 1,084,000 6,714,000 7,096,000
Audioconferencing 207,000 55,000 6,000 66,000 1,680,000 404,000
Workingfromhome 603,000 1,284,000 754,000 1,018,000 5,034,000 6,692,000
Future opportunities
The opportunities for working outside of a traditional office environment have been discussed for a long time. The potential was first recognised in the late 1940s, as the installation of home telephones became more common. Interest was revived during the oil crisis of the 1970s and alongside the rise of affordable personal computing in the 1980s.
However, it has only been recently that many large enterprises have been seriously considering home working and the implementation of flexible working practices at scale. This shift has been driven by a number of factors, not least the availability of a range of communications technologies to allow remote collaboration and interaction. It is also likely that shifts in management techniques and a focus on the need to reduce environmental impact have played a key role in this transition.
There is a strong likelihood that the adoption of remote working practice will accelerate. For many employers it can deliver both financial and environmental benefits, which are becoming more readily accessible as the costs of the enabling technologies fall. Some of the uncertainty around the value of remote working will also be overcome by increasing awareness of the benefits, as well as examples of successful implementation.
One of the greatest barriers to the future adoption of connected working practices is a nervousness from employers and educational establishments that individuals will not perform to the same level outside of the traditional work environment. Concern has also been expressed for the wellbeing of employees, who may be encouraged to be constantly contactable outside of working hours thanks to mobile communications technology.
CARBON EMISSIONS ABATEMENT FROM CONNECTED WORKING (tCO2e/year)

65Mobile Carbon Impact
68+32
New approaches to supervision or management can be adopted to overcome these issues, such as monitoring practical outcomes rather than supervising process and attendance. A number of studies have found that concerns related to losses in productivity or quality did not actually occur when homeworking systems were implemented.27,28
There is a strong financial and environmental case for increasing levels of working outside traditional workplaces. Previous research by the Carbon Trust found that increasing the numbers of UK employees working from home could cut annual costs for employers and employees by £3 billion and save over 3 million tonnes of carbon emissions.29
One company that has made use of homeworking is Cisco, where the average employee telecommutes two days a week, or three days a week if using Cisco Virtual Office technology. This has helped avoid 35 million miles of commuting a year, as well as reducing Cisco’s emissions by 17,000 tonnes and providing estimated productivity savings of $333 million.
However, it is worth noting that there are some circumstances where there would not be positive savings from increased homeworking. Take for example an already energy efficient office within a big city, such as New York, in the winter. In this circumstance most of the employees would be likely to commute by public transportation, or other low carbon methods such as cycling.
Most of the typical savings in this category come from reducing emissions from transport and office energy use. But in these circumstances commuting emissions are comparatively low and increased office energy use is likely to be lower than the combination of heating multiple homes, which may not be as efficient as the office. It is therefore important that opportunities are considered on a case-by-case basis to evaluate the likely impact.
The consumer research found that of the people who use a mobile device as part of their work or studies, over 80 percent said that this enabled them to either work from home or work more flexibly. This increasing trend of flexible and home working is a great opportunity for saving on travel emissions.
27 BT (2007) Flexible working – Can your company compete without it?28 Bentley, T., McLeod, L. et al. (2013) Future of Work Programme – The Trans-Tasman Telework Survey. New Zealand Work Research Institute 29 Carbon Trust (2014) Homeworking: helping businesses cut costs and reduce their carbon footprint
Do you use a mobile device as part of your work/studies?
Yes
No
Base: Respondents in work or studying (2,946)
32%
68%

66Mobile Carbon Impact
62+3880+2084+16
Could you do your job/studies without your mobile device?
Yes
No
Does having a mobile device enable you to work/study from home?
Yes
No
Does having a mobile device enable you to work/study outside your normal workplace/educational establishment?
Yes
No
38% 62%
20%
80%
16%
84%
Base: Respondents using mobile device for work or study (1,993)
Base: Respondents using mobile device for work or study (1,993)
Base: Respondents using mobile device for work or study (1,993)

67Mobile Carbon Impact
Flexible working practicesO2 UK, a part of Telefónica Europe, has demonstrated how mobile communications technology can be used to help a business reduce its carbon emissions. This was done through a project known as OurSpace, which took place alongside the company’s move into new headquarters in the town of Slough in 2010. This location serves as the base for around 2,000 employees.
The project was designed to create a more sustainable workplace, using energy management, smart technology and flexible working patterns to reduce the company’s environmental impact, save money and improve productivity.
A crucial element to enable this transition was making communication flexible, whether employees were working from home or other remote locations. This involved providing all employees with smartphones with anytime, anywhere plans, allowing them to make voice or video calls, send messages or access email. Outside the office employees were also able to use low definition visual communication, through webcams and Microsoft Communicator software.
The overall results were highly impressive, with O2 achieving a 53 percent overall reduction in total emissions in its premises, as well as removing 500 desks, leading to a 36 percent reduction in average annual emissions per desk.

68Mobile Carbon Impact
Replacing physical items with the use of mobile
Physical-to-digital refers to a broad range of applications where digital services are replacing physical goods and services. This includes certain physical devices that provide a user with the functionality to do multiple tasks which would previously have required multiple standalone devices. For example a smartphone or a tablet computer can replace the need to own a separate camera, satnav device (or a map), music player, portable video player, home telephone, calculator, alarm clock and so on. The effect in this category is commonly referred to as dematerialisation.
The main mechanism for reducing emissions is preventing the emissions associated with the production of physical goods or the delivery of services, which would otherwise have been produced or delivered if mobile communications technology was not widely available today. This includes, for example, the emissions associated with extracting raw materials, processing those materials, manufacturing items, logistics and other transportation emissions, the use of items and the final disposal of items at the end of their useful life.
Overall, the largest current reductions in this category are being made in the replacement of physical media, such as newspapers, magazines, CDs and DVDs, with digital media. This reflects the major shift that is taking place within the media industry, where new formats, digital distribution and streaming services are disrupting incumbent players.However, there are currently some significant differences between countries in the findings. This may in part be down to data availability, but it also reflects the varying pace of change in consumer behaviour within different markets for comparatively recent trends.

69Mobile Carbon Impact
Abatement mechanisms
There are two grouped mechanisms for which it has been possible to quantify carbon emissions abatement from mobile. These are:
• Increasingly multifunctional devices: smartphones are replacing multiple devices that were separately produced in the past, such as cameras, calculators, music players, alarm clocks and satnavs, avoiding embodied emissions from their continued production.
• Access to digital media: mobile devices are being used to provide access to digital media such as images, news, music and video, avoiding emissions from the production and transportation of photographs, newspapers and magazines, CDs and DVDs.
UK Germany Spain France USA Europe
Physical-to-Digital 90,000 109,000 72,000 63,000 743,000 891,000
Multi-functionaldevice
9,000 41,000 66,000 36,000 132,000 556,000
Newspapers,music,DVD,storage.
81,000 68,000 7,000 27,000 611,000 335,000
Future opportunities
There is every reason to expect that the process of dematerialisation will continue in a number of areas of consumer spending. The most prominent impact to date has been seen in the media. The publishing, music, film and television industries have already gone through seismic shifts over the past decade.
This has involved major disruptions to incumbent business models alongside the growth of digital distribution methods, creating both winners and losers. Businesses focusing on devices or digital content, such as Amazon, Apple and Netflix have thrived. Companies that relied on physical media have done rather less well. For example Blockbuster had 9,000 stores and 60,000 employees at its peak in 2004 and almost ceased to exist by 2014.30
The consistent pattern has been the rapid increase in the digital consumption of media, a transition which shows no sign of slowing globally. This has no doubt been spurred on by the growing availability of mobile devices and data services that allow easy access. As marketing increases for digital content services, supported by a focus on digital business models by content producers and improvements in the quality of user experience, this should accelerate the decline of physical media.
But although there are clear and readily quantifiable emissions reductions associated with the decline of physical media, it should be noted that there are also less readily quantifiable rebound effects from the emissions associated with the consumption of digital media.
CARBON EMISSIONS ABATEMENT FROM PHYSICAL-TO-DIGITAL (tCO2e/year)
30 Harress, C. (2014) The Sad End Of Blockbuster Video: The Onetime $5 Billion Company Is Being Liquidated As Competition From Online Giants Netflix And Hulu Prove All Too Much For The Iconic Brand. International Business Times. [Available at: http://www.ibtimes.com/sad-end-blockbuster-video-onetime-5-billion-company-being-liquidated-competition-online-giants]

70Mobile Carbon Impact
The network infrastructure to support the dissemination of digital media – in particular streaming services – has a high electricity demand. Improving the availability of media may also be increasing the total consumption levels. There is therefore a need to ensure that as services are digitised, the network infrastructure providing this is powered by low carbon electricity and run as efficiently as possible, in order to keep emissions down.
The use of multiple functions on single devices is also becoming far more normal and is likely to continue to accelerate. As the adoption rates of smartphones have increased, there has been a corresponding decline in the sales of standalone devices where the functionality has been replicated on a smartphone. In 2010 the USA imported almost 24 million electrically powered alarm clocks, but by 2014 this had dropped to just over 16 million.31
Indeed, adding new functionality to smartphones can have a hugely disruptive effect and very quickly make an impact on the production of certain categories of goods. For example, group revenues at the leading manufacturer of standalone GPS devices, TomTom, plummeted after satnav was introduced as a free feature on Android smartphones through the Google Maps app: from €634 million in the last quarter of 2007 to €213 million in the first quarter of 2009.32
However, even though multifunctional devices do act to reduce the total emissions, they also have associated emissions from their own production. There is therefore still an issue related to the emissions and electronic waste attributable to multifunctional devices.
The current obsolescence of smartphones just a few years after they are produced is potentially a serious source of emissions likely to continue into the future, particularly given the growing number being produced now that market penetration is rapidly increasing in both the developed and developing world. Further work on looking at what happens to smart devices at the end of their useful life will be required, such as exploring the potential for recycling or remanufacturing. Some promising approaches are currently being developed to address this issue of obsolescence, with new modular smartphones such as Phonebloks and Google’s Project Ara being developed.
The consumer research found that a very significant percentage of people already use their smartphone as a multifunctional device, and that significant numbers of people already do or would be willing to use their smartphone functionality to replace the use of physical products.
31 UN Trade Statistics available at: http://comtrade.un.org/data/. 32 Arthur, C. (2015) Navigating decline: what happened to the TomTom?. The Guardian. [Available at: http://www.theguardian.com/business/2015/jul/21/ navigating-decline-what-happened-to-tomtom-satnav]

71Mobile Carbon Impact
71+23+6 49+38+13
Are you, or would you be willing in future, to replace the use of other devices with a smartphone (e.g. camera, alarm clock, music player, satnav)?
Already do this
Willing to do this
Not willing to do this
Are you, or would you be willing in future, to use a mobile device to replace the purchase of physical products with digital products (e.g. newspapers, books, music)?
Already do this
Willing to do this
Not willing to do this
Base: All respondents (4,000)
Base: All respondents (4,000)
71%
23%
6%
38%
13%
49%
81+74+65+63+91++374% 91% 3%65% 63%81%
Alarm clock
Music player
Video player
Satnav
Camera
None of these
Do you currently use any of the following functions on a mobile device (smartphone/mobile)? Choose all that apply.
Base: All respondents (4,000)

72Mobile Carbon Impact
+ 29+49+22 28+57+15
Are you, or would you be willing in future, to use a mobile device for payments to replace your credit/debit card or cash use?
Already do this
Willing to do this
Not willing to do this
Are you, or would you be willing in future, to use a mobile device to replace the use of tickets for travel or events?
Already do this
Willing to do this
Not willing to do this
Base: All respondents (4,000)
Base: All respondents (4,000)
49%
22%
68%
18% 14%
29%
57%
15% 28%

73Mobile Carbon Impact
Multifunctional devicesIndependently reviewed industry data shows that the carbon emissions from manufacturing a high end smartphone are significantly lower than the total of production emissions from devices it can replace.
Analysis conducted by Fraunhofer IZM in 2014 found that smartphone manufacturing emissions were less than half that of separately producing five common single-function devices: an MP3 player, compact digital camera, feature phone, portable games console and navigation system. This calculation did not factor in other devices that are often replaced by smartphones, such as alarm clocks, timers or ebook readers.

74Mobile Carbon Impact
Following the completion of the Carbon Trust’s assessment into the influence of mobile communications technology on reducing global carbon emissions across a wide range of applications, it is clear that it is already having a substantial impact. This outstrips the total direct emissions33 associated with the provision of mobile today by a factor of five. It is having a net positive impact.
The total quantified abatement of carbon emissions from mobile communications technology today in the USA and Europe is the equivalent of a reduction of 180 million tonnes of CO2e a year. This is not insubstantial. It is greater than the entire direct annual emissions of many large national economies, such as the Netherlands or Pakistan.
M2M technologies are responsible for the greatest part of these emissions reductions, with around 70 percent of the total quantified abatement accounted for by their use in the buildings, transport and energy sectors. In many ways this is an unsurprising conclusion, although the scale of the savings enabled is impressive given the relative novelty of the technologies.
Between them, the energy, transportation and buildings sectors represent almost half of global emissions. And M2M technologies are already being widely used to enable efficiencies that simultaneously deliver both commercial and environmental benefits, which can be achieved without the need for substantial behaviour change. There is therefore a strong business case driving their adoption and this is only likely to increase with further demonstrations of success, falling costs and improvements in technologies.
One of the barriers to unlocking future opportunities in sectors where M2M technologies could be widely used – such as buildings, energy, transport, cities and industry – is that substantial capital investment can be required to unlock the benefits. It is rarely a quick and cheap process to retrofit large numbers of buildings, replace commercial fleets, build new energy grids, upgrade city infrastructure or buy new industrial plant equipment.
But climate change remains a key driver that means that a lot of things will need to be changed around the world to help reduce carbon emissions. This will mobilise the capital required for change. Mobile communications technology can help to enable this and there is every reason to expect it will be integrated as a core element.
Conclusion and discussion
33 Total emissions of networks as calculated by other studies. See Appendix 1 (‘Emissions of mobile networks’) for further explanation.
Key Findings
• Thecarbonemissionsabatementenabledbymobilecommunicationstechnologytodayisapproximatelyfivetimesgreaterthanthecarbonemissionsfrommobilenetworks.
• Useofmobilecommunicationstechnologyiscurrentlyenablingatotalreductionof180 million tonnes of CO2eayearacrosstheUSAandEurope.ThisamountisgreaterthantheannualcarbonemissionsfromtheNetherlandsandequivalentto1.5 percent ofallgreenhousegasemissionsfromtheUSAandEurope.
• 70 percent ofcurrentabatementcomesfromtheuseofmachine-to-machine(M2M)technologiesinthebuildings,transportandenergysectors,wheredevicesareabletocommunicateautomaticallywitheachotherwithoutrequiringhumanintervention.
• 20 percentofcurrentabatementcomesfromuseofsmartphonestoenablebehaviouralchangesinlifestylesandworkingpatterns.
• Significantfutureopportunitiesexisttoreduceemissionsfromcities,healthcareandagriculturethroughtheuseofmobilecommunicationstechnology,althoughtheimpactoftheseareastodayisrelativelysmall.
• Thetotalcarbonemissionsabatementfrommobilecommunicationstechnologyisexpectedtogrowatleastthreetimeslargeroverthenextfiveyears(toabout500 million tonnesofcarbonemissionsabatementperyearacrosstheUSAandEurope),givencurrentprojectionsoftheincreaseindeploymentofM2Mtechnologies.
• Internationalconsumerresearchshowshighlevelsofwillingnessforsmartphoneuserstoadoptbehavioursthatwillresultinreducedpersonalcarbonemissions,enabledbyfunctionsorappsontheirmobiledevices.Thegreatestimpacttodayisthroughconnectingwithfamilyandfriendsusingvoiceorvideocalls,replacingphysicaljourneys.

75Mobile Carbon Impact
In other sectors, the quantified impact on emissions reduction today is very small because technologies are not fully mature, although they are being rapidly developed. In categories such as healthcare and agriculture, significant emerging opportunities exist. The speed with which they are adopted will depend on the willingness of practitioners to adopt new technologies. This will require some measure of behaviour change alongside the development and demonstration of innovative technologies.
Currently a smaller percentage of the overall quantified carbon emissions abatement in this report comes from use of smartphones and other communications technologies to enable behavioural changes in lifestyles and working patterns. Human behavioural change is often a slower and more complicated process than changing technology.
Fortunately, the consumer research conducted for this report shows high levels of willingness for individuals to adopt behaviours in their lives that will result in reduced personal carbon emissions. These will commonly be enabled by functions or apps on their mobile devices, many of which are currently being developed and marketed to make them more attractive to users.
While the impact today is promising, it is only a fraction of the identified potential that has been identified. Although there has been some early progress on opportunities in categories such as buildings and transportation, most of the benefits have yet to be unlocked.
This is likely to change rapidly. Based solely on projections of growth in M2M connections within the USA and Europe, without factoring in any possible changes in behaviour or increased efficiencies, the annual carbon emissions abatement calculated in this report should more than triple over the next five years.
There are good reasons to expect that the real impact is likely to be more substantial than this. Research suggests that there are numerous additional efficiencies and innovations, however it has not been possible to quantify these due to lack of data availability.
Recent estimates produced by Accenture in GeSI’s SMARTer 2030 report indicate that the ICT sector as a whole, including but not limited to mobile, could enable an annual global saving of 12 billion tonnes of carbon emissions by 2030. The SMARTer 2030 report estimates that this would be equivalent to a 20 percent reduction in global emissions at that time and is approximately 65 times greater than the abatement calculated within this report for the USA and Europe.
Mobile communications technology represents a substantial part of the expected future growth of the ICT sector, particularly in the developing world where it can obviate the need for fixed line infrastructure. But to ensure that sustainability benefits are fully realised alongside that growth it will be necessary to put in place conditions that will promote success.
To unlock the full potential of mobile communications technology to enable carbon emissions reduction, consumer and business behaviour will need to change, current solutions will need to be deployed at scale, technology innovations will be required, and regulatory obstacles across a wide range of sectors will need to be overcome.
The analysis completed for this report has highlighted four levers that can be used to accelerate the benefits of mobile communications technologies on carbon emissions abatement. These are:
• Enabling technology: there is a need to invest in innovative or disruptive new technologies that enable better, low energy access to mobile communications, as well as creating the enabling network infrastructure for connections around the world.
• Implementing solutions: businesses and governments need to adopt and scale up the mechanisms that are effective in reducing carbon emissions today, as well as exploring novel uses for mobile communications technology that can achieve further reductions.
76Mobile Carbon Impact
• Policy landscape: governments can accelerate progress by supporting common standards and developing appropriate regulatory oversight, as well as advancing deployment by the use of incentives and disincentives, such as support for improved connectivity or putting a strong price on carbon emissions through cap-and-trade schemes and taxes.
• Changing behaviour: there is a significant opportunity to use mobile to support organisations and individuals by developing simple, useful tools that offer lower carbon options and services.
Further work will be required to better understand how practical progress can be made in each of these four areas in order to unlock the full potential of the carbon abatement from mobile. More detailed discussion of some of the change-levers and significant barriers, categorised by sector and geography, can be found in GeSI’s SMARTer 2020 report written by the Boston Consulting Group.34
There are promising early indications that things are moving in the right direction. There is already strong consumer adoption of mobile devices, as well as high levels of apparent willingness to use apps that can enable low carbon behaviour. Mobile enabled business models have already disrupted the status quo in a number of industries, experiencing rapid growth in some cases, which suggests that the commercial case for action is strong. And governments are working with the ICT industry to increase coverage and connectivity, recognising this is now a critical part of a modern national infrastructure.
The climate change occurring as a result of increasing global carbon emissions is one of the greatest challenges ever faced by human civilization. There are very few easy answers on how to increase prosperity at the same time as minimising long term risks of harm to the environment and people. But greater deployment of mobile communications technology appears to be an effective tool to do both, providing a rare win-win opportunity.
Given the clear potential for mobile communications technology to be used as an effective tool in mitigating climate change, serious thought ought to be given by both government and industry into how to magnify its impact today. This will help ensure that the greatest possible benefits can be realised without undue delay, to help meet this urgent global challenge.
34 Boston Consulting Group (2012) SMARTer 2020: The Role of ICT in Driving a Sustainable Future. Global e-Sustainability Initiative. Brussels.

77Mobile Carbon Impact
Appendix 1: Methodology for assessing carbon abatement
Overview of methodology
The objective of the methodology is to calculate the current carbon abatement from mobile communications technologies at a country-by-country level for 2015.
A number of distinct mechanisms were identified that could reduce carbon emissions, and for each mechanism a calculation methodology was defined. Using data from specific studies or assumptions, a carbon abatement factor was derived. The carbon abatement factor is relevant to a volume factor that represents the quantity for the mechanism. This volume factor can be the number of relevant M2M (Machine-to-Machine) connections or could be the number of smartphones or the proportion of people using a specific application.
Carbon abatement = volume x carbon abatement factor
Scope
Definition of mobile
The scope includes any carbon abatement enabled by mobile communications technology.
This primarily includes both use of mobile phones and use of M2M technology.
Additionally, usage of Wi-Fi is included, where this is itself connected using mobile communications, or where public Wi-Fi is provided. Also other wireless frequency bands (e.g. license-free ISM) bands are included where these are then connected using mobile communications; this includes LPWA (low power wide area) networks. The future growth area for mobile communication including communication via drones, satellites and balloons is also included within the scope of the report (although of these only satellite has any significant impact at present).
Geography
The scope of this report is to calculate the carbon abatement from mobile for the USA and Europe. The carbon abatement for Europe is calculated using UK, Germany, France, and Spain as a sample of representative countries. An average of the carbon abatement factors for these four countries is then multiplied by the relevant volume factors for Europe.
The definition for Europe follows that used by Machina Research, “All of Europe including Russia, the Caucasus republics
and Turkey and all points west, including Greenland and Iceland.”
Scope of abatement
Carbon abatement is included from mechanisms where mobile has a fundamental role in providing the enabling effect (in other words the outcome would not happen without the existence of the mobile technology). Where the abatement mechanism is shared between fixed and mobile telecommunications networks, an allocation factor was used (see below section on ‘Allocation to Mobile’). For some mechanisms, the ICT or mobile technology may only be partly responsible for the carbon abatement (e.g. for example other technologies such as laptop computers, or other infrastructure may be required). No attempt was made to allocate the abatement between different technologies.
Exclusions
Mechanisms were only included where there was a clearly defined carbon abatement mechanism, which was supported by credible data or reasonable assumptions. Therefore there were a number of mechanisms that were identified but could not be included in the final analysis.
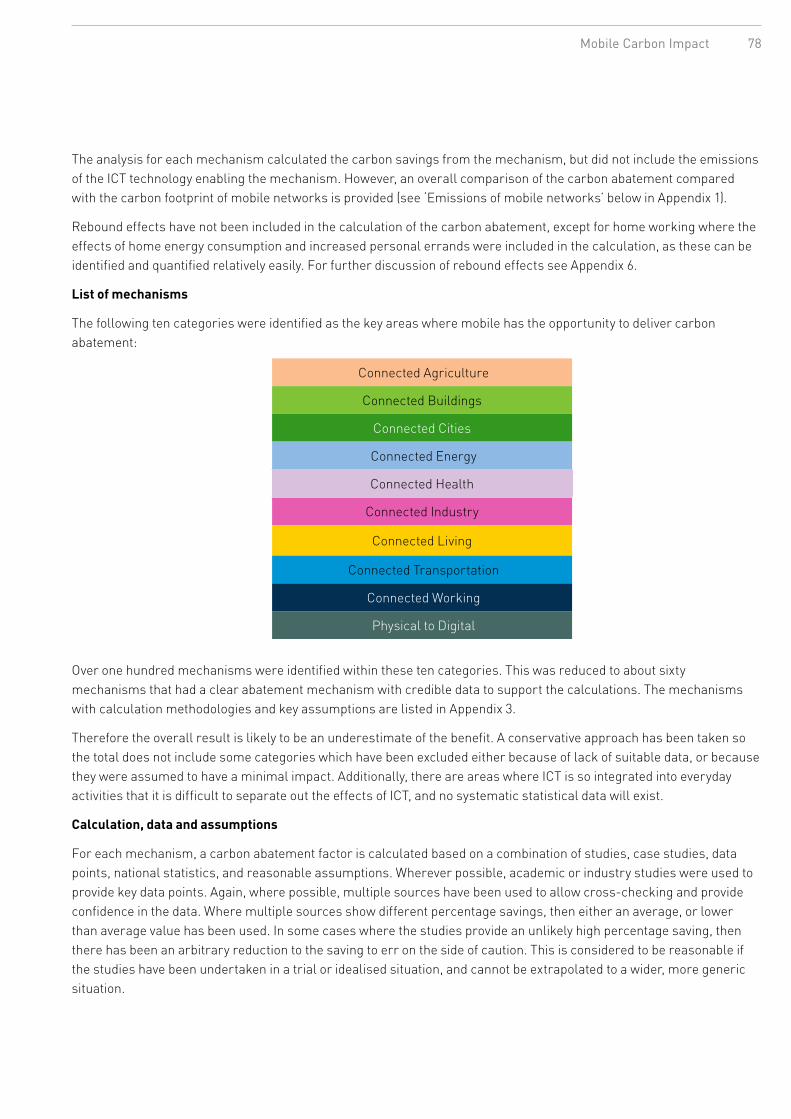
78Mobile Carbon Impact
The analysis for each mechanism calculated the carbon savings from the mechanism, but did not include the emissions of the ICT technology enabling the mechanism. However, an overall comparison of the carbon abatement compared with the carbon footprint of mobile networks is provided (see ‘Emissions of mobile networks’ below in Appendix 1).
Rebound effects have not been included in the calculation of the carbon abatement, except for home working where the effects of home energy consumption and increased personal errands were included in the calculation, as these can be identified and quantified relatively easily. For further discussion of rebound effects see Appendix 6.
List of mechanisms
The following ten categories were identified as the key areas where mobile has the opportunity to deliver carbon abatement:
Connected Agriculture
Connected Buildings
Connected Cities
Connected Energy
Connected Health
Connected Industry
Connected Living
Connected Transportation
Connected Working
Physical to Digital
Over one hundred mechanisms were identified within these ten categories. This was reduced to about sixty mechanisms that had a clear abatement mechanism with credible data to support the calculations. The mechanisms with calculation methodologies and key assumptions are listed in Appendix 3.
Therefore the overall result is likely to be an underestimate of the benefit. A conservative approach has been taken so the total does not include some categories which have been excluded either because of lack of suitable data, or because they were assumed to have a minimal impact. Additionally, there are areas where ICT is so integrated into everyday activities that it is difficult to separate out the effects of ICT, and no systematic statistical data will exist.
Calculation, data and assumptions
For each mechanism, a carbon abatement factor is calculated based on a combination of studies, case studies, data points, national statistics, and reasonable assumptions. Wherever possible, academic or industry studies were used to provide key data points. Again, where possible, multiple sources have been used to allow cross-checking and provide confidence in the data. Where multiple sources show different percentage savings, then either an average, or lower than average value has been used. In some cases where the studies provide an unlikely high percentage saving, then there has been an arbitrary reduction to the saving to err on the side of caution. This is considered to be reasonable if the studies have been undertaken in a trial or idealised situation, and cannot be extrapolated to a wider, more generic situation.
79Mobile Carbon Impact
Where there was a lack of credible data points, or to support the existing data, then reasonable assumptions have been used (see Appendix 3 for details).
For a number of the mechanisms, the carbon savings are based on consumer behaviour changes. This is particularly so for these three categories: Connected Living, Connected Working and Physical-to-Digital. In some of these cases the results from the consumer survey data commissioned by the Carbon Trust were used to support the calculations. For further details of the consumer survey see Appendix 5.
In the consumer survey, respondents were asked if they sometimes or frequently undertook certain behaviours; in these cases it was assumed that ‘sometimes’ equates to 10% use, and ‘frequently’ equates to 30% use.
Volume factors
To calculate the carbon abatement for each mechanism the carbon abatement factor is multiplied by the volume factor. For the majority of the mechanisms the volume factor is the number of M2M connections. Data on the number of M2M connections was provided by Machina Research. The categorisation of the M2M connections is described on page 81. For 15 of the categories the volume factor used is related to the number of people effecting the mechanism (e.g. number of smartphones, number of mobile phones, or population).
Carbon savings - emission factors and embodied carbon
The carbon abatement savings come primarily from savings in energy (gas or electricity) or reductions in transport. Carbon emission factors for gas, electricity and different forms of transport are used to convert the savings into CO2e figures. The emission factors used are those provided by Defra, and are full life cycle factors (i.e. electricity factors include upstream supply chain emissions and downstream distribution losses; fuel factors include upstream ‘well-to-tank’ emissions). Electricity factors are used for the different countries (UK, Germany, France, Spain and USA). Electricity emission factors are from Defra (2015), and transport emission factors are from Defra (2014).
Carbon savings due to reductions in embodied carbon have not been included except for the two ‘Physical-to-Digital’ mechanisms, where the savings are predominantly from reductions in physical devices or physical media.
Transparency
The intention of this report is to be completely transparent in how the calculations of the carbon abatement have been made, and the underlying data and assumptions. If additional information or further clarification is required regarding the calculations, the data used and the assumptions, then this can be provided by the Carbon Trust on request.
Example calculations
To help illustrate the calculations, the following two examples are explained:

80Mobile Carbon Impact
35 Vodafone(2012).ASB Bank Case Study 36 BetterBuildingsPartnership(2011).Better Metering Toolkit. A guide to improved energy management through better energy metering
Building energy management systems for commercial buildings using smart metersThe carbon abatement is from the reduction in energy use in commercial buildings from energy management systems. This is enabled through the provision of smart meters to collect energy data. The smart meters are connected using M2M technology, the assumption being that each M2M connection represents one smart meter.
Volume factor: number of smart meters used for such systems today = number of M2M connections
Data source: number of business smart meter M2M connections from Machina Research (these are factored to only include the connections related to mobile).
Carbon abatement factor: carbon reduction per smart meter. This is derived from case studies (e.g. Vodafone ASB bank case study,35 and case studies in the Better Buildings Partnership “Better Metering Toolkit”36). These give energy savings of between 7.5% and 25%. A mid-range value of 14% has been assumed. Combined with the typical number of smart meters per floor area, and typical energy consumption per floor area, an energy saving and therefore carbon saving per smart meter can be derived.
Fleet vehicle driver behaviour improvementThe carbon abatement is from the reduction in fuel use due to improved driver behaviour. This is the result of both feedback on driving performance (e.g. speed, acceleration, braking, cornering) from telematics enabled through M2M technology, and management intervention to encourage better driving techniques (e.g. training, incentives, scorecards).
Volume factor: number of connected vehicles = number of M2M connections
Data source: number of fleet management M2M connections from Machina Research.
Carbon abatement factor: carbon reduction per vehicle. This is derived from various studies that give a range of 5% to 20% for the fuel saving factor, depending on the level of intervention. A mid-range value of 10% as typical has been assumed. This is combined with average vehicle emissions per km (from Defra emission factors), and typical annual distance for vehicles (available from national statistics). A mix of vehicle types is assumed (20% car, 60% LGV, 20% HGV) based on typical split of M2M connections for fleet management, which is from Carbon Trust analysis of source data.
Detail of methodologies
Appendix 2 lists the carbon abatement factors calculated for each mechanism.
Appendix 3 lists the calculation methodologies, key assumptions and reference sources for each of the mechanisms.
All sources and references are listed in Appendix 4.

81Mobile Carbon Impact
M2M connections data
Mapping to M2M categories
For categories that have a carbon abatement related to the number of M2M connections, data has been used on the number of M2M connections provided by Machina Research. Machina Research categorise the M2M connections into the following five sectors: Car, Health, Cities, Industry, and Living & Working. Each of those sectors breaks down into a number of ‘application groups’, as illustrated in the diagram below.
Usually the relationship of M2M connections to the number of services was one-to-one. However, in some case additional conversions were applied (for example, number of connected smart meters per commercial office unit of floor area). These are explained in the assumptions listed in the table in Appendix 3.
In total there are 60 application groups. Each of those application groups break down into a number of separate applications. For instance ‘Smart Metering’ splits between gas, electricity and water for both business and residential. In total across all 6 sectors and 60 application groups, there are around 200 separate applications.
Carbon abatement mechanisms have been matched to the relevant M2M categories confirming the mapping in collaboration with Machina Research. For some mechanisms there may be multiple M2M applications that relate to the same mechanism.
The categorisation of the M2M applications is quite detailed, and each application is unique, thus there is not double counting due to overlapping M2M categories. However, there may be some M2M applications where the carbon abatement is only relevant to a sub-set of the M2M connections; in these cases there may have been an overestimation of the savings (although in selecting carbon abatement factors the approach has been conservative or used averages, which should balance out any overestimation of the applicable M2M connections).

82Mobile Carbon Impact
Allocation to mobile
For each application Machina Research provides the number of M2M connections for the following technologies: Cellular (2G, 3G, 4G); Low power wide area (LPWA); Metropolitan Area Networks (MAN); Satellite; Short range; Wide area fixed. It is considered that all cellular, LPWA and satellite connections are mobile. A percentage of MAN and short range connections are also allocated to mobile (the percentage value was provided by Machina Research). Wide area fixed were not included, as these relate only to fixed (non-mobile) connections.
Sources and references
In choosing studies for data points, the Carbon Trust has aimed to select reliable sources such as academic or industry studies. The references used are listed in Appendix 4.
For national data primarily national government statisticshave been used, including data from Defra,37 Eurostat,38 World Bank39 and UNECE.40
Review process
All the calculations were subject to internal cross-checking and review by the Carbon Trust. The methodologies, calculations, assumptions and data were all critically reviewed. The results and calculations were also reviewed by the GeSI Steering Committee.
Comparisons and cross-checks
In addition to the review process, a number of sense checks and comparisons with other studies were made.
Carbon abatement factors and methodologies were compared with other pzrojects where data has been published (these being primarily those of mobile telecommunications operators).
Total carbon abatement figures were compared with other published studies, these included studies published by mobile operators and reports such as the Mobile’s Green Manifesto,41 Carbon Connections42 Connected Agriculture,43 Spain 20.2044 and the SMARTer203045 reports. Direct comparisons were not possible as these studies were looking at different time periods or had slightly different scopes in terms of geography or categories, however useful checks were able to confirm that the results were comparable in broad terms of magnitude. Other comparisons between studies have also been undertaken and some of these are summarised in a paper by Ericsson Research.46 It is fair to say that this analysis is at a more detailed and comprehensive level than most of the other reports which have tended to take a more macro approach, and therefore direct comparisons are not necessarily helpful.
37 DepartmentforEnvironment,FoodandRuralAffairs(DEFRA),GreenhouseGasConversionFactorRepository,availableat:
http://www.ukconversionfactorscarbonsmart.co.uk/
38 StatisticalofficeoftheEuropeanUnion,Eurostatdatabase,availableat:http://ec.europa.eu/eurostat/data/database
39 TheWorldBank,WorldBankOpenData,availableat:http://data.worldbank.org/
40 UnitedNationsEconomicCommissionforEurope(UNECE),on-linestatistics,availableat:http://w3.unece.org/PXWeb/en
41 GSMA(2012),Mobile’sGreenManifesto2012.
42 Vodafone(2009),CarbonConnections:Quantifyingmobile’sroleintacklingclimatechange.
43 Vodafone(2011),ConnectedAgriculture:Theroleofmobileindrivingefficiencyandsustainabilityinthefoodandagriculturevaluechain
44 ClubdeExcelenciaenSostenibilidad(2012),Spain20.20:ICTandSustainability
45 AccentureStrategy(2015)SMARTer2030:ICTSolutionsfor21stCenturyChallenges.Globale-SustainabilityInitiative.Brussels.
46 Malmodinetal,(2014),Considerationsformacro-levelstudiesofICT’senablingpotential.

83Mobile Carbon Impact
The number of M2M connections was compared with the same studies as used for the comparison of the carbon abatement figures.
Additionally a number of “sense checks” were made with other published data, for example the number of households in a country should be greater than the number of M2M connections for households (assuming that not all households are connected).
Where anomalies were identified, then there was a re-checking of the data and assumptions used, and in some cases either additional data sources were used or the assumptions were modified.
Considerations and limitations to methodology
Uncertainty
Uncertainty describes how accurate results are or how close to the ‘true’ value a result is. Typically the uncertainty will relate to a statistical or probability assessment of the results. The calculation of the carbon abatement figures uses various data sources including the volume data (e.g. number of M2M connections, number of smartphone users, population number), and other factors to calculate the carbon savings. However, the result is highly dependent on percentage saving factors and assumptions. While the volume factors could be analysed on a statistical basis to assess their impact on the uncertainty of the result, the saving factors have insufficient data points to be analysed statistically. Therefore, in order to avoid optimistic results,conservative factors were selected from data where a range of factors were available to choose from.
Overlaps / double counting
Some of the carbon abatement mechanisms cover similar or related areas. As a result of this the Carbon Trust’s team has been careful to avoid any overlaps or double counting. For example, the mechanisms for smart meters and HVAC control both relate to energy savings in buildings. However, the mechanism for smart meters assumes behavioural changes to reduce energy consumption, while HVAC control is assuming automatic control changes. Also, the volume metrics for the two mechanisms are separate M2M categories and do not overlap.
Emissions of mobile networks
In calculating carbon abatement figures the Carbon Trust has calculated the savings in carbon emissions from the mechanisms supported by mobile communications technology. This has not included a subtraction of the emissions related to the use of the mobile technology. In practice this is likely to be small compared to the abatement for each mechanism. It is possible to put this into context by comparing the total abatement on a regional basis with the total emissions from mobile networks.
The energy used by mobile networks has been estimated by various studies, with GSMA having conducted one of the more detailed analysis. The unique difference in this study is that it is based on actual energy data provided by mobile operators, with gaps in data being interpolated and analysis has accounted for variation in key factors in population density, average ambient temperature, and data volumes. The GSMA data includes both energy consumption from grid electricity and energy consumption from diesel used to power generators for base stations.

84Mobile Carbon Impact
The GSMA Mobile’s Green Manifesto 201247 gives a total annual global figure for mobile networks of 120TWh energy consumption for the year 2010.
Other studies broadly corroborate these figures of energy consumption for mobile networks, however it is not straightforward to compare these directly. As mentioned, the GSMA figures include energy from diesel generation, which can be significant in certain countries, while most other studies only calculate the electricity consumption. A number of studies are primarily looking at forecasts of energy consumption, rather than the current measured consumption and use estimation factors to project the total energy, as opposed to the GSMA figures based on data from a variety of network operators. Also, differences in definition of what is included in the “network” will have an impact on the resulting energy figure for different studies – for example, the following may or may not be included: the network operator’s own offices, retail stores and data centers; as well as core switching sites and transmission.
After removing the energy due to diesel generation and efficiency losses, the GSMA figure is about 80TWh purely for electricity consumption. This compares closely with the figure quoted by Fehske et al48 of 77 TWh projected for the year 2013.
Other studies have also used estimation techniques based on average energy consumption: for example, Andrae and Edler49, Lambert et al50, Scheck51.
However, the energy consumption of the mobile networks is only responsible for part of the total carbon emissions from the use of the network. Other emissions are due to the embodied emissions of both the network and of the mobile devices. Fehske et al52 estimate the global carbon footprint of mobile communications for 2014 as 170 MtCO2e, attributing 38% (64.5 MtCO2e) to the operation of the mobile network. This is also similar to the figures presented in Ericsson’s Energy and Carbon Report November 201453.
The GSMA Mobile’s Green Manifesto 201254 figure of total annual global energy consumption for mobile networks of 120TWh is equivalent to 70 MtCO2e (this is for the year 2010). This includes 7.4 MtCO2e for Europe and 8.2 MtCO2e for North America.
These figures are compared in the following table and chart.
47 GSMA(2012),Mobile’sGreenManifesto2012.
48 Fehskeetal(2011),TheGlobalFootprintofMobileCommunications:TheEcologicalandEconomicPerspective
49 Andrea,A.andEdler,T.(2015),OnGlobalElectricityUsageofCommunicationTechnology:Trendsto2030
50 Lambert,S.etal(2012),Worldwideelectricityconsumptionofcommunicationnetworks.Opt.Express2012,20,B513–B524.
51 Scheck,H.(2013),Userequipmentreceiversensitivity:Theforgottenmobilenetworkefficiencyfactor.EuropeanTelecommunicationStandardsInstitute
52 Fehskeetal(2011),op.cit.
53 Ericsson(2014),EricssonEnergyandCarbonReport
54 GSMA(2012),op.cit.

85Mobile Carbon Impact
0
20
40
60
80
100
120
140
160
180
200
CARBON FOOTPRINT OF MOBILE NETWORKS (PER YEAR)
SourceScope (see
notes below)Date of Study
Year data refers to
Global carbon footprint MtCO2e
Carbon footprint Europe MtCO2e
Carbon footprint
N America MtCO2e
GSMANetworkenergyonly(seenote1)
2012 2010 70 7.4 8.2
FehskeetalNetworkenergyonly(seenote1)
2011 2014 64.5
FehskeetalTotallifecycle(seenote2)
2011 2014 170
Notes
1. Due to energy use of the network only.
2. Total life cycle footprint including energy use of the network, operation of mobile devices, embodied carbon of network and mobile
devices, operator activities and data centres.
All Europe
Emissions due to network energy only
Carbon Footprint (Fehske et al)
Carbon Footprint (GSMA)
USA
Other network emissions
Globalfootprint(networkenergyonly)
Globalfootprint(includingembodiedemissions)
MtC
O2e

86Mobile Carbon Impact
COMPARISON OF GLOBAL MOBILE NETWORK EMISSIONS
It is then possible to compare the carbon footprint of the network with the carbon abatement that has been calculated for Europe and USA. The GSMA55 gives the carbon footprint of the mobile network for Europe and North America as 7.4 and 8.2 MtCO2e respectively, compared to the carbon abatement that has been calculated of just over 90 MtCO2e for each region. (See chart below).
COMPARISON OF MOBILE NETWORK EMISSIONS (NETWORK ENERGY ONLY) AND CARBON ABATEMENT
Thus for USA and Europe, there is a carbon footprint for the network energy of 15.6 MtCO2e, compared to a carbon abatement of 185 MtCO2e. If the embodied emissions of the network are included (by factoring based on the study by Fehske et al56 then this gives a carbon footprint of about 40 MtCO2e. Thus by including the embodied emissions of the network this means that the carbon abatement is nearly five times the carbon emissions from the mobile network.
Note that this is a useful way to contextualise the carbon abatement that has been calculated in this report. However, this ratio is dependent on the carbon footprint of mobile derived from other studies. Caution should be used if trying to draw comparisons with other similar ratios, which may have used different boundaries and different assumptions.
55 GSMA(2012),op.cit.
56 Fehskeetal(2011),op.cit.
All Europe
USA
MtC
O2e
Carbon Footprint(GSMA)
Carbon Abatement (CT/GeSI)
0
20
40
60
80
100
120
140
160
180
200

87Mobile Carbon Impact
The following assumptions have also implicitly been included in calculating this ratio, and provide additional caveats when using the simplistic ratio metric:
• In the carbon abatement this has included satellite and public Wi-Fi, whereas these are not included in the carbon footprint of mobile networks.
• The carbon footprint data from the GSMA57 is the latest published data and refers to 2010. The emissions from mobile networks is likely to be larger in 2015, as mobile network emissions have generally been increasing.
• In applying the embodied emissions of mobile networks, there has been an implicit assumption that the global embodied emissions are applicable in the same ratio for the USA and Europe.
• Increased smartphone penetration since 2011 will have increased the embodied emissions (as smartphones have a higher carbon footprint than feature phones).
Applying the methodology at a company level Many telecommunications companies are already measuring the carbon abatement for their products and services, using a methodology similar to that used for this report. These include: BT, EE, Elisa, KPN, Swisscom, Telefonica-O2, Telstra, Verizon, and Vodafone.
When applying this methodology at a company level rather than at a country level, although the approach and the factors used will be similar, there will be some differences:
• The main difference is that a telecommunications operator should be able to be much more precise over the number of M2M connections and the categorisation of these. This will depend on how detailed and accessible the sales data is.
• A mobile telecommunications operator is likely to only include the carbon abatement directly related to the products and services that they sell (rather than the range of mechanisms that have been included in this report).
• A mobile telecommunications operator will typically consider the M2M connections that they sell directly, rather than the wider definition of mobile adopted in this report which includes a proportion of connections from short range and Metropolitan Area Networks that are supported by mobile cellular networks.
• Generally telecommunications operators have not included the carbon abatement from the use of mobile phone apps (i.e. primarily those mechanisms in the “Connected Living” category of this report). This is largely because of uncertainty in quantifying the number of people using the apps and the behaviour changes which deliver the carbon savings. (The calculations in this report for this category rely heavily on the new consumer research commissioned specifically for this report).
As a companion to this report, the Carbon Trust have also prepared a ‘Carbon Abatement Calculation Handbook’ to provide data and factors to support practitioners who are carrying out carbon abatement assessments of ICT products and services.
57 GSMA(2012),op.cit.

88Mobile Carbon Impact
Appendix 2: Table of carbon abatement factors
This table presents the carbon abatement factors calculated for each mechanism for each country. These are provided to allow for validation and comparison.
The assumptions and sources used to calculate the carbon abatement factors for each mechanism are presented in Appendix 3.
The factors are provided to 2 decimal places. Although this overstates the accuracy of the figures, it allows others to use these factors as they are. The Carbon Trust has rounded the resulting carbon abatement figures, and would recommend that this is done for any other use of these factors.
UK Germany Spain France USA units
ConnectedAgriculture
Agriculturalequipmentlogistics
110.92 125.00 97.18 127.11 297.76 kgCO₂e/tractor
Cropmanagement 18,881.52 18,587.70 3,646.38 14,352.69 44,058.52 kgCO₂e/farm
ConnectedBuildings
Buildingenergymanagementsystems(electricitycommercial)
528.63 312.39 554.19 54.98 837.23 kgCO₂e/smartmeter
Buildingenergymanagementsystems(gascommercial)
3,967.95 2,593.98 579.12 1,961.62 2,320.50 kgCO₂e/smartmeter
HVACcontrol-commercialbuildings 9,042.50 5,527.13 7,257.54 5,577.09 11,993.49 kgCO₂e/averageoffice
HVACcontrol-residentialbuildings 398.87 271.07 168.60 133.71 716.25 kgCO₂e/household
Smartmeters-watercommercial 15.24 15.24 15.24 15.24 20.79 kgCO₂e/smartmeter
Smartmeters-waterresidential 1.21 0.83 1.20 1.22 3.57 kgCO₂e/smartmeter
Smartmeters(electricityresidential) 64.00 56.02 45.13 12.34 197.03 kgCO₂e/smartmeter
Smartmeters(gasresidential) 56.56 29.49 11.00 25.47 42.92 kgCO₂e/smartmeter
ConnectedCities
Parkingspacemonitoring 2,666.66 2,666.66 2,666.66 2,666.66 2,666.66 kgCO₂e/parkingspace
Smartbins 5.00 5.00 5.00 5.00 5.00 kgCO₂e/smartbin
Streetlighting 122.11 126.90 80.23 16.57 162.68 kgCO₂e/streetlight
Trafficcongestionmanagement 12,943.04 15,227.10 22,079.30 13,704.39 28,724.41 kgCO₂e/traffic
monitoringdevice
Trafficcongestionmonitoring(roadsigns) 17,999.96 17,999.96 17,999.96 17,999.96 17,999.96 kgCO₂e/roadsign
Trafficcongestionmonitoring(trafficlights)
17,999.96 17,999.96 17,999.96 17,999.96 17,999.96 kgCO₂e/trafficlight

89Mobile Carbon Impact
ConnectedEnergy
Electricvehicleconnection 129.76 122.88 173.91 245.95 112.35 kgCO₂e/chargingpoint
Microgeneration(CHPBusiness) 1,125.72 1,882.94 667.66 152.71 1,384.70 kgCO₂e/installation
Microgeneration(CHPResidential) 1,125.72 1,882.94 667.66 152.71 1,384.70 kgCO₂e/installation
Microgeneration(solarbusiness) 3,752.40 6,276.48 2,225.52 509.04 4,615.68 kgCO₂e/installation
Microgeneration(solarresidential) 1,196.08 2,000.63 709.38 162.26 1,471.25 kgCO₂e/installation
Microgeneration(windbusiness) 32,833.50 54,919.20 19,473.30 4,454.10 40,387.20 kgCO₂e/installation
Microgeneration(windresidential) 5,378.44 8,996.29 3,189.91 729.62 6,615.81 kgCO₂e/installation
SmartGrids-electricnetworkmanagement 4,390.61 4,517.83 3,696.58 920.35 13,155.13 kgCO₂e/connection
SmartGrids-gasnetworkmanagement 3,741.85 6,254.86 8,886.45 5,242.18 14,326.22 kgCO₂e/connection
ConnectedHealth
SmartHealth-homecare 441.03 440.61 440.87 440.99 440.87 kgCO₂e/patient
SmartHealth-outofhospitalcare 360.56 282.17 341.13 285.27 313.62 kgCO₂e/patient
ConnectedIndustry
Automationinindustrialprocesses 942.33 990.43 633.38 129.31 1,064.12 kgCO₂e/smartmotor
Fieldforceautomation 4,736.21 4,736.21 4,736.21 4,736.21 4,736.21 kgCO₂e/connection
Inventorymanagement 7,379.93 7,756.65 4,960.40 1,012.70 22,701.14 kgCO₂e/warehouse
Pointofsale 13.53 13.53 13.53 13.53 13.53 kgCO₂e/POSterminal
Supplychainmanagement 71.50 71.50 71.50 71.50 71.50 kgCO₂e/palletof
goods
Vendingmachines 31.93 37.56 54.47 33.81 70.86 kgCO₂e/vendingmachine
Watergrid-leakdetection 0.89 4.70 2.72 1.68 6.50 kgCO₂e/connection
ConnectedLiving
Accommodationsharing 6.58 8.60 10.63 8.60 5.20 kgCO₂e/smartphone
user
Eco-driving 0.60 0.60 0.60 0.60 0.60 kgCO₂e/smartphoneuser
Avoidingsocialjourneys(friends&family) 10.27 17.78 17.78 17.78 15.41 kgCO₂e/smartphone
user
Mobilebanking 2.78 2.78 2.78 2.78 5.48 kgCO₂e/averageperson
Mobileshopping 0.58 0.38 0.06 0.19 1.10 kgCO₂e/averageperson
Ridesharing 1.17 1.47 1.52 1.47 1.23 kgCO₂e/smartphoneuser
UK Germany Spain France USA units

90Mobile Carbon Impact
Sharingeconomy(goodssharing) 2.41 2.29 2.17 2.29 2.23 kgCO₂e/smartphone
user
Smarthomes 2.61 1.67 0.80 0.67 8.76 kgCO₂e/smartphoneuser
Useofmobileasasatnav 2.52 3.62 3.14 3.24 4.75 kgCO₂e/smartphoneuser
ConnectedTransportation
Carsharing(carclubs) 26,966.72 34,321.28 26,966.72 26,966.72 26,966.72 kgCO₂e/carclubvehicle
Fleetvehicledriverbehaviourimprovement 1,643.85 1,888.40 980.35 1,667.94 1,381.04 kgCO₂e/vehicle
Remotevehicleconditionmonitoring 0.93 0.93 0.93 0.93 0.93 kgCO₂e/vehicle
Roadsideassistance 1.65 1.65 1.65 1.65 1.65 kgCO₂e/vehicle
Satellitenavigation 15.17 15.64 10.20 13.98 15.96 kgCO₂e/connectedsatnav
Seafleet 354,117.71 354,117.71 354,117.71 354,117.71 354,117.71 kgCO₂e/ship
Smartlogistics-efficientrouting&fleetmanagement
600.07 560.46 313.90 628.26 447.39 kgCO₂e/vehicle
Smartlogistics-loadingoptimisation 240.03 224.18 125.56 251.30 178.96 kgCO₂e/vehicle
Usabilityofpublictransport 13.43 14.51 21.96 13.06 45.29 kgCO₂e/smartphone
user
Usagebasedcarinsurance 203.66 208.39 154.01 191.84 211.57 kgCO₂e/connectedcar
ConnectedWorking
Audioconferencing 2.63 0.55 0.12 1.05 5.49 kgCO₂e/mobilephone
Workingfromhome 14.48 24.13 24.13 24.13 24.13 kgCO₂e/employee
PhysicaltoDigital
Multi-functionaldevice 0.23 1.29 2.54 1.29 0.74 kgCO₂e/smartphoneuser
Newspapers,music,DVD,storage 1.26 0.84 0.14 0.41 1.93 kgCO₂e/averageperson
Notes on country factors
It is noticeable that there is significant variability for some of the carbon abatement factors between countries. There can be a variety of reasons to explain why these differences exist.
Where the carbon abatement results from a reduction in the use of electricity, then the national electricity grid factor has a significant impact. For such cases the carbon abatement factor for France is significantly smaller. This is due to high level of nuclear power in France, which results in its grid emission factor being about 8 times smaller than UK and Germany.
For other cases, there are specific country characteristics that have an impact. These could be to do with the geography and average distances travelled, or typical energy consumption per square meter for buildings. For example, the average energy consumption for buildings is much higher in USA than in other countries, average farm size is smaller in Spain.
In a few cases, where specific data for the different countries were unavailable, the same assumptions were made for all countries, explaining why the carbon abatement factor does not vary between countries.
UK Germany Spain France USA units

91Mobile Carbon Impact
Appendix 3: Data sources and assumptions
The following table provides a short description, the calculation methodology and key assumptions for each mechanism. (A complete list of references used in this section is in Appendix 4.)
Label Text Reference
Category ConnectedAgriculture
Sub-category Agriculturalequipmentlogistics
MechanismBetterutilisationoffarmequipmentresultinginreductionindieselconsumedbyfarmmachinerysuchastractors,harvesters,compactors.
Methodology
Trackingsystemsenablebetterrouting,whichreducesthefuelconsumedduringharvesting,tillage,irrigationandharvesting.Averagefuelconsumptionbymachineryperyearisbasedonaverageconsumptionpermachineryanddensityofsuchmachineryperhectare.Basedonthis,togetherwiththeaveragefuelsaving,andtheemissionfactorassociatedtothefuelused,atotalsavingpermachineryiscalculated.
Assumptions
ActualfuelsavingsarisingfromtheuseofGPSguidingsystemsonfarmequipment.Thisincludesfourmainprocesses(i.e.,tillage,planting,sprayingandharvesting),whichwereequallyweighted.Anaveragesavingforallprocessesof6.315%wasused.
(Boraetal.2012)
Averagefuelconsumptionforwheatcultivationsis55.6l/ha.Thisfigurewasusedasrepresentativeoffuelconsumptionforallagriculturalmachinery.
(Schenck,R.;Huizenga2014)
Emissionfactorforfuelusedis2.299kgCO₂e/l.
Category ConnectedAgriculture
Sub-category Cropmanagement
Mechanism
Betteruseofresources(human,fuelandwater)andincreaseinproductivitycanleadtoincreasedyieldandreducedwastage.Itcanalsoleadtoareductioninfertiliserrequiredasitcanbeallocatedtotheappropriateareasaswellasreducedirrigation(e.g.,plantstweetingwhentheyneedtobewatered.)
Methodology
Fertiliserreduction:estimationbasedontheamountoffertiliserusedperfarmperyear,andthecountryspecificemissionfactoroffertilisersused.Previousstudiesgiveanestimationonthereductionoffertiliserusedasaresultofmobileenabledsoilandwatersensors.
Assumptions
Smarttechnologycanreduceexpenditureonchemicalinputsby40%perhectare.Thisfigurewasusedandassumingthatareductioninexpenditureisdirectlyequivalenttoareductioninproductquantityused.
(GSMAIntelligence2015)
SmarttechnologyhasledtoimprovementsonnitrogenefficiencyinGermanybetween10-15%.
(JointResearchCentre(JRC)oftheEuropeanCommission2014)

92Mobile Carbon Impact
Category ConnectedBuildings
Sub-category Buildingenergymanagementsystems(electricitycommercial)
Mechanism Energymanagementsystemsleadtooptimisedenergyandheatingdemandresultinginenergysavings.
Methodology
Estimatepercentagesavingofaverageofficeelectricityconsumptionduetosmartmeters.AssumemorethanoneM2Mconnectionsperoffice.Anaverageelectricitysavingperm²iscalculatedbasedonthenationalelectricityconsumptionperbusinessandtheassumedsavingpercentagefromsmartmeteruse.Consideringthenumberofmetersperm²andthenationalelectricityemissionfactor,aCO₂eabatementfactorpercountrycanbecalculated.
Assumptions14%electricitysavingfromsmartmeteruseincommercialbuildings.Thisisanaveragevaluebasedonthefollowingtwostudies:
• 12%electricitysavingfromacontrolledtrialinvolving538SMEs. (CarbonTrust2007)
• GEcasestudyresults:16%electricitysaving. (Rossetal.2011)Other case studies have energy savings from 5% to 25%, one example being the ASB Bank case study which has a 23% energy saving.
(Vodafone2012a)
Estimated0.02electricitymetersperm². CarbonTrustanalysisofLowCarbonWorkplace(LCW)data
Category ConnectedBuildings
Sub-category Buildingenergymanagementsystems(gascommercial)
Mechanism Energymanagementsystemsleadtooptimisedenergyandheatingdemandresultinginenergysavings.
Methodology
Estimatepercentagesavingofaverageofficegasconsumptionduetosmartmeters.AssumemorethanoneM2Mconnectionsperoffice.Anaveragegassavingperm²iscalculatedbasedonthenationalgasconsumptionperbusinessandtheassumedsavingpercentagefromsmartmeteruse.Consideringthenumberofmetersperm²andthegasemissionfactor,aCO₂eabatementfactorpercountrycanbecalculated.
Assumptions
12%gassavingsfromsmartmeteruseincommercialbuildings.Thisisbasedonthefollowingthreestudies(the7%figureisbasedonareasonablelargesample,butonlyconsideredSMEs,thereforeitisreasonabletoassumeahighersaving):
• 42%savingfromGEcasestudy. (Rossetal.2011)
• 4.5%gasconsumptionreductioninthenon-domesticsector. (DECC2014)
• 7%gassavingfromacontrolledtrialinvolving538SMEs.(Non-SMEsarelikelytohavehighersavings). (CarbonTrust2007)
Assume0.001gasmetersperm². CarbonTrustanalysisofLowCarbonWorkplace(LCW)data
Label Text Reference

93Mobile Carbon Impact
Category ConnectedBuildings
Sub-category HVACcontrol-commercialbuildings
MechanismMonitoringandcontrolofHVACsystems,includingautomaticreactionbasedonoccupancy,leadingtoreductioninenergyconsumption.
Methodology
EstimateaverageenergyconsumedbyHVACsysteminanaverageofficebuildingbymultiplyingtheenergyperm²bytheaveragefloorspaceandthepercentageofenergyconsumedbyHVACsystem.MultiplybythepercentagereductioninenergyconsumptioncausedbyHVACcontrolsystemsandbytheenergyemissionfactortocalculateanaverageabatementfactor.
Assumptions
27.5%energysavingfromHVACcontrolsfortheUSA.ThisisbasedonthePNNLstudy,whichsuggestsHVACcontrolswillofferenergysavingsof24%-35%incommercialbuildings.
(Wangetal.2013)
20%EnergysavingsfromHVACcontrolsforEurope.ThisisfromtheCarbonTruststudy,whichsuggestsHVACcontrolswillofferenergysavingsof20%incommercialbuildings.
(CarbonTrust2012)
Averageenergyemissionfactorof0.381(forcombinedgasandelectricityconsumption),whichassumesthattheenergymixis63%electricityand37%gas.
(DepartmentoftheEnvi-ronmentTransportandtheRegions(DETR)2000)
TheCIBSEJournalarticlequotesthatcooling&ventilationaccountsfor21%andheatingfor20%oftheaverageelectricityconsumptioninUKofficebuildings,soitwasassumedthat41%ofenergyisconsumedbyHVACsystemsincommercialbuildings.
(Dwyer2015)
Thesamplemeanofworkplacedensityis10.9m²,soitwasassumedthatistheaveragefloorspaceperworkerinm². (Bedfordetal.2013)
MachinaResearchdatausedisbasedonanaverageofficesize(donatedas‘RevenueGeneratingUnits’orRGU).MachinaResearchassumesanaverageRGUis100peoplein2013,straight-linefallingto40in2024,hencebyinterpolatingbetweenthesefigurestheaveragenumberofemployeesperRGUunitin2015is90,whichisthefigureusedtocalculateaverageofficefloorarea.
Category ConnectedBuildings
Sub-category HVACcontrol-residentialbuildings
MechanismMonitoringandcontrolofHVACsystems,includingintegrationofdomesticsystemsbasedonpersonalpresence,leadingtoreductioninenergyconsumption.
Methodology
Estimateaverageemissionsfromanaverageresidentialbuilding.ConsideringthepercentageofenergyconsumedbyHVACandthepercentagereductioninenergyconsumptioncausedbyHVACcontrolsystems,anaverageabatementfactorcanbecalculated.
AssumptionsThereferencestudyfoundthatonaveragetheHVACsystemconsumesaround39%oftotalenergyconsumptionofahousehold.Thisfigurewasusedinthecalculations.
(CenterforClimateandEn-ergySolutionsn.d.)
Label Text Reference

94Mobile Carbon Impact
• FortheenergyreductionfromHVACcontrolsystemsavalueof20%wasassumed.Thiswasbasedonthefollowingtwostudiesthatbothindicatedapotentialreductionofabout28%.Thisfigurewasadjusteddownwardstoreflectthesituationintypicalresidentialaccommodation.
• ThisstudyfoundthatuniversitiescanreducetheenergyusefromHVACsystemsinresidentialhallsby25%-32%byintroducingHVACcontrols,whichgivesamid-pointvalueof28.5%reduction.
(Anderson2011)
• Theresultsofthisstudyindicatethatthesmartthermostatcanprovidelargerenergysavingsandmorecomfortthanexistingbaselinesolutions.Thisapproachhasaverylowinitialcostoflessthan$25perhome,andcansave28%ofresidentialHVACenergyconsumptiononaverage,withoutsacrificingcomfort.
(Luetal.2010)
Category ConnectedBuildings
Sub-category Smartmeters-watercommercial
MechanismUseofsmartmeterstomonitorwaterusage,raisesawareness,highlightswastageofwaterandleadstobehaviourchangereducingwaterconsumption.
Methodology
EstimateaverageCO₂eabatementfactorbasedontheaveragewaterconsumptionperbusiness,theaveragewateremissionfactor,andthereductioninwaterconsumptionfromsmartmeteruse.
Assumptions
TheBusinessstreamreferencesuggeststhattherightwatermonitoringsolutionforbusinessescouldcutconsumptionandcostsbyupto5%.Avalueof5%watersavingwasusedinthecalculation.
(BusinessStreamn.d.)
MachinaResearchdatausedisbasedonanaverageofficesize(denotedas‘RevenueGeneratingUnits’orRGU).MachinaResearchassumesanaverageRGUis100peoplein2013,straight-linefallingto40in2024,hencebyinterpolatingbetweenthesefigurestheaveragenumberofemployeesperRGUunitin2015is90,whichisthefigureusedtocalculateaveragewaterconsumptionperbusiness.
Category ConnectedBuildings
Sub-category Smartmeters-waterresidential
MechanismUseofsmartmeterstomonitorwaterusage,raisesawareness,andleadstobehaviourchangereducingwaterconsumption.
Methodology
EstimateaverageCO₂eabatementfactorbasedontheaveragewaterconsumptionperhousehold,theaveragewateremissionfactor,andthereductioninwaterconsumptionfromsmartmeteruse.
Assumptions
AnglianWaterhastrialledsmartwatermeterswithIHDsinthehomesofover11,000customers.Resultssuggestthatcustomersreducedtheirwaterusageby3-4%.Anaveragewatersavingof3.5%wasassumedfromsmartmetersinresidentialbuildings.
(HousesofParliament2014)
Label Text Reference

95Mobile Carbon Impact
Category ConnectedBuildings
Sub-category Smartmeters(electricityresidential)
MechanismUseofSmartmetersenablesmonitoringofenergyused,raisesawareness,andleadstobehaviourchangereducingenergyconsumption.
Methodology
EstimateaverageCO₂eabatementfactorbasedontheaverageelectricityconsumptionperhousehold,theaverageelectricityemissionfactorpercountry,andthereductioninelectricityconsumptionfromsmartmeteruseinresidentialbuildings.AssumeoneM2Mconnectionperhousehold.
Assumptions
Anelectricitysavingfromsmartmeteruseof2.8%wasassumed.Thisisbasedonthefollowingthreereferences,wherealowerfigurefromtherangeprovidedbythesestudieshasbeenselected.
• Electricitysavingfromsmartmeterusefoundtobe2.8%. (DECC2010)
• Electricitysavingfromsmartmeters5-15%. (Lu2010)
• Electricitysavingfromsmartmeters2-3%. (CommissionforEnergyRegulation(CER)2011)
Category ConnectedBuildings
Sub-category Smartmeters(gasresidential)
MechanismUseofSmartmetersenablesmonitoringofenergyused,raisesawareness,andleadstobehaviourchangereducingenergyconsumption.
Methodology
EstimateaverageCO₂eabatementfactorbasedontheaveragegasconsumptionperhousehold,theaveragegasemissionfactor,andthereductioningasconsumptionfromsmartmeteruseinresidentialbuildings.AssumeoneM2Mconnectionperhousehold.
AssumptionsGassavingfromsmartmeterusefoundtobe2%forgascreditand0.5%forpre-paymentmeter.Afigureof2%gassavingfromuseofsmartmeterperhouseholdwasused.
(DECC2010)
Category ConnectedCities
Sub-category Parkingspacemonitoring
Mechanism
Smartsensorsmonitorcarparkspaceavailabilityincities.Thisinformationisfedbacktovehiclesanddriversareabletoreserveandbedirectedtotheappropriateparkingspace.Thisgreatlyreducesthetimespentdrivingaroundlookingforavailableparking.
Methodology
Theaverageparkingspaceisusedapproximately16timesperday.Ifeachtimeitisusedthedriverisabletoavoidtheneedtodrivearoundlookingforaspace,thentherewillbeatotalreductionintimespentdriving,thusemissionsareavoided.Thisoverallreductionisthesavingperparkingspace.
AssumptionsAnaverageof10minutesspentlookingforaparkingspacewasassumed(Streetlinedataisanaveragetimeof6-14mins).
(Steetline2013)
• Supportingstudy:InBarcelonaamilliondriversspendonaverage20minutesadaylookingforparking. (Bielsa2013)
Label Text Reference

96Mobile Carbon Impact
Supportingstudy:SmartParkinginMiltonKeynesthesensorsrevealedthatanaveragestayinthestationdrop-offzoneis16minutes,enablingtheCounciltoadjustthewaitlimitupwardsto20minutes.
(BritishTelecommunicationsplc2014)
Anassumptionwasmadethattheaveragestayinaparkingspaceis30mins,whichequatesto16usesperdayoveran8hourperiod.
Itwasassumedthattheaveragespeedwhenlookingforparkingspotis15km/h.
Itwasassumedthattheuseoftechnologyreducesthetimesearchingforaparkingspacefrom10minutesto2minutes.
Category ConnectedCities
Sub-category Smartbins
MechanismSmartbinsmonitortheircapacityastheycollectwaste.Thisisusedtonotifycollectionunitswhenbinsneedemptying,thusoptimisingtheroutestakenbyrefusevehicles.
Methodology
UsingthefindingsfromaMic-O-Datastudy,theannualcarbonsavingfromasampleofsmartbinsis30,000kgCO₂e.Thiswasbasedonastudyof6,000connectedbins,thusgivinganabatementperbinof5kgCO₂e.Thisistheemissionfactortobeused.
Assumptions VodafoneMic-O-Datacasestudy.30,000kgCO₂for6000smartbinsgivesanabatementfactorof5kgCO₂/smartbin. (Vodafone2012b)
Category ConnectedCities
Sub-category Streetlighting
Mechanism
Connectedstreetlightswilladjustlightoutputtosuitvariationsindemand.Bynothavingtobeatfullpowerallthetime,theenergyconsumptionofeachlightwillbereduced.Energyconsumptionperlightobtainedfromarangeofindependentsources.Carbonsavingfromtheimplementationofsmartlightoutput,notswitchingtomoreefficientLEDbulbs.
Methodology
AstudycarriedoutbyTelensaestimatedthatsmartstreetlightingreducescarbonemissionsby20%.Thissavingisappliedtotheaveragecarbonemissionsfromonestreetlight.Thisiscalculatedthroughtheaverageannualenergyconsumptionofonelight,multipliedbytheemissionfactorofthelocalgrid.
Assumptions Smartstreetlightingreducescarbonemissionsby20%. (Telensa2015)
Category ConnectedCities
Sub-category Trafficcongestionmanagement
MechanismTrafficcongestionmanagementthroughsignsandsignalscontrol,resultinginreducedtrafficcongestion,andthereforereducedfuelconsumption.
MethodologyThepercentagereductioninthenumberofvehiclesismultipliedbytheaveragejourneydistance.Thisisthenmultipliedbyanemissionfactorforanaveragecar.
Label Text Reference

97Mobile Carbon Impact
Assumptions
TransportforLondondatashowsa14%reductioninvehi-clesenteringtheLondoncongestionzonecomparedtopre-congestioncharging.Thispercentagewasusedtogetherwiththenumberofmonitoringdevicestocalculateavehiclereductionperdevice.
(TransportforLondon(TfL)2008)
Supportingdatashowingthatroadpricingresultsin16%lesscarbonemissions.
(JointExpertGrouponTrans-portandEnvironment2010)
Annualabatementisbasedon260workingdaysperyear(weekdays).Thisismultipliedbytheaverageweekdaydrivingdistancetogetanannualfigure.
AverageweekdaytripdrivingdistancedataforEuropeisfromtheEuropeanCommissionJRCreport. (Pasaogluetal.2012)
AverageweekdaytripdrivingdistanceforUSAisfromUSDepartmentofTransportationdata.
(USDepartmentofTrans-portationFederalHighwaysAdministration(FHWA)2011)
Category ConnectedCities
Sub-category Trafficcongestionmonitoring(roadsigns)
MechanismSmartmonitoringoftrafficcongestionandtraffichotspots.Connectedroadsignsdirecttrafficawayfromtheseareastoavoidfurthercongestionandoptimiserouting.
Methodology
Smarttrafficsignals’emissionssavingsarisefrombeingabletomaintainamoreconsistentspeedwhiledriving,thisisasaresultofavoidingcongestionareas.Attributetheassociatedcarbonreductiontothedistancetravelledbyanaveragecarwhile‘affected’bythesignasitpasses.Eachyearanestimatednumberofvehicleswillpasseachsign.
Assumptions A5%reductioninemissionsfromsynchronisedtrafficsignalswasassumed.
(AccentureandVodafone2009)
Itwasassumedthatonecararrivesatasignevery4secondsduringpeakperiods(7am-7pm).
Itwasassumedthatthesignimpactsjourneyfor400m.
Category ConnectedCities
Sub-category Trafficcongestionmonitoring(trafficlights)
Mechanism
Smartmonitoringoftrafficflowtocommunicatebetweenlightsandoptimisewaittimesatjunctions.Thiswillpreventtrafficdelaysandallowdriverstomaintainamoreconsistentspeed.
Methodology
Smarttrafficlightswillresultinemissionssavingsfrombeingabletomaintainamoreconsistentspeedwhilepassingthroughthetrafficlight.Attributethecarbonreductiontothedistancetravelledwhile‘affected’bythelightforanaveragecarpassingthetrafficlight.
Assumptions A5%reductioninemissionsfromsynchronisedtrafficsignalswasassumed.
(AccentureandVodafone2009)
Itwasassumedthatonecararrivesatasignevery4secondsduringpeakperiods(7am-7pm).
Itwasassumedthatthesignimpactsjourneyfor400m.
Label Text Reference

98Mobile Carbon Impact
Category ConnectedEnergy
Sub-category Electricvehicleconnection
MechanismSmartgridsenablingconnectionofelectricvehicles,thereforeincreasingshiftfrompetrolanddieselcarstoelectriccars.
Methodology
EstimatethetotalkilometresdrivenperchargingpointusingthetotalkWhchargeddividedbythetotalnumberofchargingpointsandmultiplybythekilometresdrivenperkWh.Calculatethedifferenceinemissionswhentotalkilometresaredrivenbyanaveragecarcomparedtoanelectriccar.
Assumptions ItwasassumedthattotalkWhchargedperchargingpointoverayearis244.4kWh,basedonthereferencebelow.
• TotalkWhusedovera3monthperiod:51,957(Sep2013);86,266(June2014) (TransportforLondon2014)
• CurrentnumberofChargePointsInstalledinLondon:1,392(Sep2013);1,412(June2014) (TransportforLondon2014)
Electricvehiclewall-to-wheelsenergyuseis211Wh/km,basedontheNissanLeaf,sothedistancedrivenbyanelectriccarperkWhis4.74km/kWh
(Wilson2013)
Category ConnectedEnergy
Sub-category Microgeneration(CHPbusiness)
Mechanism
Enablingelectricitytobeexportedtothegridthroughdecentralizedlowcarbonenergygeneration.Communicationofelectricitycapacity,pricingandpaymentisenabledthroughsmartmetersandM2Mconnection.
MethodologyEstimatethetypicalelectricitygenerationofacommercialCHPinstallationperyearandmultiplybytheresidualgridfactor.Assumeoneconnectionperinstallation.
Assumptions MicroCHPunitcangenerate2400kWhperyear. (UniversityofStrathclyde2015)
TheaverageresidualmixemissionfactorintheUSiscalculatedasanaverageoftheresidualmixemissionfactorsforthedifferentNERCregions.(ForEuropeRE-DISSIIdatawasused).
(CenterforResourceSolu-tions(CRS)2015)
Category ConnectedEnergy
Sub-category Microgeneration(CHPresidential)
Mechanism
Enablingelectricitytobeexportedtothegridthroughdecentralizedlowcarbonenergygeneration.Communicationofelectricitycapacity,pricingandpaymentisenabledthroughsmartmetersandM2Mconnection.
MethodologyEstimatethetypicalelectricitygenerationofaresidentialCHPinstallationperyearandmultiplybytheresidualgridfactor.Assumeoneconnectionperinstallation.
Assumptions MicroCHPunitfordomesticusecangenerate2400kWhperyear.
(UniversityofStrathclyde2015)
Label Text Reference

99Mobile Carbon Impact
Category ConnectedEnergy
Sub-category Microgeneration(solarbusiness)
Mechanism
Enablingelectricitytobeexportedtothegridthroughdecentralizedlowcarbonenergygeneration.Communicationofelectricitycapacity,pricingandpaymentisenabledthroughsmartmetersandM2Mconnection.
MethodologyEstimatethetypicalelectricitygenerationofacommercialsolarinstallationperyearandmultiplybytheresidualgridfactor.Assumeoneconnectionperinstallation.
Assumptions
10kWpcommercialSolarPVsystemcouldgeneratearound8,000kWhperyear,a20kWparound16,000kWhanda50kWparound40,000kWh.Anaverageenergygenerationof8,000kWhperyearforacommercialSolarPVwasassumed.
(CleanEnergyInstallations2015)
A50kWarraywillproduceanaverageofaround43,800kWhofenergyperyear. (RegenSW2015)
Category ConnectedEnergy
Sub-category Microgeneration(solarresidential)
Mechanism
Enablingelectricitytobeexportedtothegridthroughdecentralizedlowcarbonenergygeneration.Communicationofelectricitycapacity,pricingandpaymentisenabledthroughsmartmetersandM2Mconnection.
MethodologyEstimatethetypicalelectricitygenerationofaresidentialsolarinstallationperyearandmultiplybytheresidualgridfactor.Assumeoneconnectionperinstallation.
Assumptions ItwasassumedthatanaveragedomesticSolarPVinstallationwillbe3kW,basedonthebelowreference.
• Atypicalsystemsizeof3kWwillgiveanestimatedannualoutputof2550kWh. (Vasili2015)
Category ConnectedEnergy
Sub-category Microgeneration(windbusiness)
Mechanism
Enablingelectricitytobeexportedtothegridthroughdecentralizedlowcarbonenergygeneration.Communicationofelectricitycapacity,pricingandpaymentisenabledthroughsmartmetersandM2Mconnection.
MethodologyEstimatethetypicalelectricitygenerationofacommercialwindinstallationperyearandmultiplybytheresidualgridfactor.Assumeoneconnectionperinstallation.
AssumptionsAnaverageelectricitygenerationof70,000kWhperyearforacommercialwindinstallationwasassumed,basedonthereferencesbelow.
• Gazelle20kWWindTurbineproducesaround60,000kWhperyear. (GazelleWindTurbines2015)
• TheEnertech40kWturbinewillproduce75,000-80,000kWhperyearwith12mphavg.windspeeds. (SolarWindtek2015)
Label Text Reference

100Mobile Carbon Impact
Category ConnectedEnergy
Sub-category Microgeneration(windresidential)
Mechanism
Enablingelectricitytobeexportedtothegridthroughdecentralizedlowcarbonenergygeneration.Communicationofelectricitycapacity,pricingandpaymentisenabledthroughsmartmetersandM2Mconnection.
MethodologyEstimatethetypicalelectricitygenerationofaresidentialwindinstallationperyearandmultiplybytheresidualgridfactor.Assumeoneconnectionperinstallation.
Assumptions
Itwasassumedthatdomesticwindinstallationsarearound2.5kWto10kWinsize,basedonthereferencebelow,sotheaverageelectricitygeneratedbyadomesticwindmicrogenerationinstallationassumedis11,467kWh.
Adomestic2.5kWwindturbinecanproducearound4,000kWhperyear,5kWaround8,900anda10kWaround21,500kWhperyear.
(TheRenewableEnergyHub2015)
Category ConnectedEnergy
Sub-category Sub-categorySmartGrids-electricnetworkmanagement
Mechanism
Bymonitoringthetransmissionanddistribution(T&D)elementsofthenetwork,utilitiescanidentifypointsofloss.Thisleadstomoreefficientdistributionnetwork,resultinginreducedT&Dlosses.
Methodology
Estimatethepercentageofthegridthatissmartbyassuming100%ofthegridissmartin2050andcalculateemissionscausedfromtheproportionofthegridthatissmart.CalculatethereductioninT&Dlossespossiblewithasmartgridandapplyreductionstotheproportionofsmartgridemissions.DividebythenumberofM2Mconnectionstogetcarbonabatementperconnection.
Assumptions Anaveragefigureof7%forT&Dlosseswasused,asapercentageoftotalelectricitygeneration.
(InternationalEnergyAgency(IEA)2005)
Usingthetworeferencesbelow,itwasassumedthatreductioninT&Dlossesfromsmartgridsare7.5%.(TheUSDOEstudyhasbeentakenasmorerepresentative).
• TheSMART2020reportestimatespotentialreductioninT&Dlossesfromuseofsmartgridstobe30%.
(Globale-SustainabilityInitiative(GeSI)2008)
• USDOEsmartgridstudyestimatespotentialreductioninT&Dlossesfromuseofsmartgridstobe5-10%.
(U.S.DepartmentofEnergy(DOE)2012)
Itisassumedthatin2050,100%ofthegridissmart.Hence,thepercentageofgridestimatedtobesmartcurrentlyismeasuredbytheratioofconnectionsin2015overconnectionsin2050.Theconnectionsin2050werederivedbyassumingalinearincreaseinconnectionsfrom2030onwardsbasedonthefiguresfrom2025-2030.(DataonnumberofM2MconnectionsisfromMachinaResearchdata).
Label Text Reference

101Mobile Carbon Impact
Category ConnectedEnergy
Sub-category Smartgrids-gasnetworkmanagement
MechanismBymonitoringthegasnetwork,utilitiescanidentifypointsofloss.Thisleadstomoreefficientdistributionnetwork,resultinginreducedlossesduetoleaks.
Methodology
Estimatethepercentageofthegridthatissmartbyassuming100%ofthegridissmartin2050andcalculatethecarbonemissionscausedfromtheproportionofthegridthatissmart.Calculatethereductioningasleakspossiblewithasmartgridandapplyreductionstoproportionofsmartgridemissions.DividebythenumberofM2Mconnectionstogetcarbonabatementperconnection.
Assumptions
Itisassumedthatin2050,100%ofthegridissmart.Hence,thepercentageofgridestimatedtobesmartcurrentlyismeasuredbytheratioofconnectionsin2015overconnectionsin2050.Theconnectionsin2050werederivedbyassumingalinearincreaseinconnectionsfrom2030onwardsbasedonthefiguresfrom2025-2030.(DataonnumberofM2MconnectionsisfromMachinaResearchdata).
Itwasassumedthat0.24%ofthenaturalgasthatisproducedescapesfromdeliverysystemsoperatedbylocalnaturalgasutilities,andthatthisleakagecanbeavoidedbyuseofsmartgridmonitoring.
(NationalGrid(US)2014)
Category ConnectedHealth
Sub-category SmartHealth-homecare
Mechanism
Monitoringofchronicorhighriskpatientsathomeandthusavoidingcarjourneystohospital.Reductioninnumberofdaysneededatthehospital.Reductionintravelforhealthprofessionalstovisitpatientsathome.
MethodologyEstimationbasedonanemissionfactorforahospitalstay,andaroundtriptohospitalmultipliedbytheaverageannualreductioninhospitalvisitsperpatient.
Assumptions
Telehealthinterventionsreducehospitalisationby55%andreduceA&Eadmissionsby29%.Itwasassumedthattherewasanaveragefigureof42%reductionsinhospitaladmissions.
(PwC2013)
15,624,000hospitaladmissionsintheUKannually-thisisdividedbytheUKpopulationtogiveanaverageof0.24hospitaladmissionsperpersonperyear.Itwasassumedthatthisisrepresentativeofpeoplewithhealthmonitors-inpracticetheywilllikelyhaveahigheradmissionrate.
(NHSConfederation2015)
Hospitalstayemissionfactor(440kgCO₂eperhospitalstay)isfromCarbonTrustresearch,basedonNHSdata.
Assumedtraveltohospitalinalargecar,aslikelytobearangeofcarsandambulances.
AveragedistancestohospitalarefromOECDdatafordifferentcountries.
Label Text Reference

102Mobile Carbon Impact
Category ConnectedHealth
Sub-category SmartHealth-outofhospitalcare
Mechanism Monitoringofchronicorhighriskpatientsathomereducingthenumberofdaysneededatthehospital.
MethodologyEstimationbasedonanemissionfactorforanightspentinhospital,multipliedbytheaverageannualreductioninnightsspentinhospitalperpatient.
Assumptions Hospitalstayemissionfactor(440kgCO₂eperhospitalstay)isfromCarbonTrustresearch,basedonNHSdata.
MobileHealth(mHealth)trialshaveshowna50-60%reductioninhospitalnights. (PwC2013)
Averageannualnightsspentinhospitalforthosewithchronicconditionis12.5formenand11.3forwomen,anaverageof11.8nightswasassumed.
(Hernandezetal.2009)
AveragelengthofhospitalstayfromEurostatdatafordifferentcountries.
Category ConnectedIndustry
Sub-category Automationinindustrialprocesses
MechanismIncreasedefficiencyandproductivitythroughtheautomationofindustrialprocessesconnectedthroughM2Mconnections.
Methodology Assumingremotediagnosticsenableenergysavingsinindustrialmotors.
Assumptions
Amediumsizemotor,withmedianoutputpowerof9.5Wwasassumed,operatingatloadfactorof60%,for3000hoursperyear.DatafromIEAreport,Table15-Characteristicsofgeneralpurposemedium-sizeindustrialelectricmotors:usedinpumps,fans,compressors,conveyors,industrialhandlingandprocessing.
(InternationalEnergyAgency(IEA)2005)
StudiesbytheCarbonTrustandothersshowthatmetering,monitoringandtargeting(MM&T)cantypicallydeliverenergyusesavingsofbetween5%and15%.Anassumptionwasmadeofa10%electricitysavingforatypicalindustrialmotorwhenconnectedwitharemotemonitoring,diagnostic,controlsystem.
(CarbonTrust2011)
Category ConnectedIndustry
Sub-category Fieldforceautomation
Mechanism Reductionintravelfromproductivityimprovementsformobileworkteams(fieldforce).
Methodology Casestudiesgivingatypicalsavinginfuelpervehicleusedbyfieldforce.AssumeoneM2Mconnectionpervehicle.
Assumptions TypicalfuelsavingspervehiclederivedfromBTNorthumbrianWatercasestudy.
(BritishTelecommunicationsplc2013)
Category ConnectedIndustry
Sub-category Inventorymanagement
Mechanism
Inventorymanagementsystemsreducetheoveralllevelofinventoryneeded.Asaresult,lesswarehousestoragespaceisrequired.Smallerstoragespacerequireslessenergyforlightingandcooling.
Label Text Reference

103Mobile Carbon Impact
MethodologySMARTer2020reportidentifiesinventorysavingsof24%,thisincreasedefficiencyisappliedtotheelectricityconsumptionofatypicalwarehouse.
Assumptions Assumetheaveragemediumsizedwarehouseis20,000ft². (EIA2006)
ICTenabledinventorymanagementreducesinventorylevelsbyupto24%.Itwasassumedthatthisreducestheelectricityconsumptionperwarehouseby24%.
(Globale-SustainabilityInitia-tive(GeSI)andTheBostonConsultingGroup(BCG)2012)
Category ConnectedIndustry
Sub-category Pointofsale
Mechanism
Useofmobileconnectionsforpaymenttransactionsleadingtolessuseofcash,andreducedcashtransportation.Carbonemissionssavingsarefromreduceduseofsecurityvehiclesforcashdrops.
MethodologyEstimationbasedonacarbonabatementfactorper£transferred,multipliedbythetotalamounttransferredperpointofsale.
Assumptions 1,179,175pointofsalesintheUK(in2009). (PaymentsCouncil2010)
£114billionistransferredannuallybyPOS,fromCarbonTrustAnalysis.
140kgCO₂eisthecarbonabatementfactorper£1milliontransferredbyPOS,fromCarbonTrustanalysis.
Category ConnectedIndustry
Sub-category Supplychainmanagement
MechanismImprovedmonitoringofgoodsandequipmentthroughoutthesupplychaintoensureefficiencyandreductionofwasteofperishablegoods
Methodology
Calculatetheembodiedemissionsofanaveragepallet’sworthofgoods.EachpalletrepresentsoneM2Mconnection.Byimprovedmanagement,theamountofwastageperpalletisreduced.Thecarbonabatementistheembodiedemissionsoftheassociatedreductioninwaste.
Assumptions
Perishablegoodsrangefrom4.5-11.4%wastage,non-perishablegoodswillhaveamuchlowerwastagerate.Thisusedaconservativeassumptionsthattheoverallinventorywastagerateis5%.
(Buzbyetal.2009)
AssumeICTpreventshalfofallwastage(i.e.2.5%avoidedwastage).
Averageembodiedemissionsforgoodsassumedtobe2.86kgCO₂e/kg.Thiswasaveragedfromproductcarbonfootprintsfor250differentproducts(primarilyfoodproducts).EmissionfactorsweresourcedfromtheCarbonTrustFootprintExpertdatabase.
Assumepalletloadingis1000kg.MaximumloadcapacityofEuropeanpalletsis1000kg,dimensions120cmx80cmx180cm.
(TNT2011)
Category ConnectedIndustry
Sub-category Vendingmachines
Mechanism Remotemonitoringofvendingmachines,enablingimprovedlogisticsforrestockingofvendingmachines.
Label Text Reference

104Mobile Carbon Impact
MethodologyEstimatestheemissionsfromtheaveragenumberoftripsperyeartovendingmachinesandmultiplybythepotentialfuelsavingsfromremotelycontrollingvendingmachines.
Assumptions Assumevendingmachinesarereplenishedonaverageonceperweek. (Snack’ums2015)
Itwasassumedthatonlinemanagementofvendingmachinescansave25%offuelcosts. (Vendon2015)
Category ConnectedIndustry
Sub-category Watergrid-leakdetection
MechanismLeakdetectioninwatermains,aspartofthewaterdistributionnetwork,leadingtoreductioninwaterleakage,withresultantreductionincarbonemissions.
Methodology
1.Estimatethepercentageofthewatergridthatissmartbyassuming100%ofthegridissmartin2050andcalculatetheamountofcarbonemissionscausedfromtheproportionofthegridthatissmart.2.Calculatethereductioninwaterleakspossiblewithasmartgridandapplyreductionstotheproportionofsmartgridemissions.3.DividebythenumberofM2Mconnectionstogetcarbonabatementperconnection
AssumptionsItwasassumedthat20%ofwaterislostannuallyindistributionsystem,duetoleakage.Thisisbasedonthefollowingthreestudies:
• 15-30%leakageindevelopedworld. (Bridges&MacDonald1994)
• 15-25%leakageinUK. (ABB2011)
• 25-30%inoldercities,and3-8%innewercities. (Mutchek&Williams2014)
Itisassumedthatin2050,100%ofthegridissmart.Hence,thepercentageofgridestimatedtobesmartcurrentlyismeasuredbytheratioofconnectionsin2015overconnectionsin2050.Theconnectionsin2050werederivedbyassumingalinearincreaseinconnectionsfrom2030onwardsbasedonthefiguresfrom2025-2030.
Category ConnectedLiving
Sub-category Accommodationsharing
Mechanism
Useofmobiletechnologyfacilitatesbookingaccommodationinsharedorunusedhouses,asopposetoinhotels(suchasAirbnb).Theaveragecarbonimpactofanightinahotelismuchgreaterthanthatofaresidentialhouse.
Methodology
Airbnbreportsuggests61-89%reductioninemissionswhenusinganAirbnbroomcomparedtoahotelstay.Applythistotheaveragenumberofannualholidaynightsperperson.Futurethinkingsurveysuggests25%ofpeopleuseaccommodationfunctionality,butafrequencyfactorneedstobeappliedtothis.
Assumptions61%and89%loweremissionsinAirbnbaccommodationthanahotelstayfortheUSandEUrespectively.Averagestayis4.6nights.
(Airbnb2015)
Label Text Reference

105Mobile Carbon Impact
Averageemissionsperguestpernightforahotel=20.6kgCO₂e.
(UnitedNationsEnvironmentProgramme(UNEP)andWorldTourismOrganization(UN-WTO)2012)
Theaverage(UK)personhas3.0holidaysayear. (ABTA2014)
Onaverage16-28%ofthosesurveyedusetheirphonetobookaccommodationinhomesinsteadofhotels.Thisisdividedintothosethatdothis“frequently”,andthosethatdothis“sometimes”.
Consumersurvey–seeAp-pendix5
Ofthosethatusemobiletechnologytobooksharedaccommodation,itwasassumedthatthosethatdothis“sometimes”dosofor10%ofholidays,andthosethatdothis“frequently”dosofor30%ofholidays.
Category ConnectedLiving
Sub-category Eco-driving
Mechanism Eco-drivingappsforpersonalvehicles-leadingtobetterdrivingbehaviour,andreducedfuelconsumption.
MethodologyEstimationbasedonanassumedfuelsavingfromusingeco-drivingappsmultipliedbytheaveragedistancedrivenusinganemissionfactorforanaveragecar.
Assumptions 6548miles(10,596km)istheaveragedistancedrivenannually.
(DepartmentforTransport(DfT)2014b)
Itwasassumedthat0.5%ofsmartphoneusersuseaneco-drivingapp.
Usinganeco-drivingappleadstoa5%reductioninfuelconsumption.
Category ConnectedLiving
Sub-category Avoidingsocialjourneys(friends&family)
Mechanism Useofmobiledeviceforvideocallstofriendsandfamily,thusreducingneedfortravel.
Methodology
Applythepercentageofpeoplereplacingatriptofamilyorfriendswithvideocallingtotheaverageannualdistancetravelledbycartofamilyorfriendsandmultiplybytheaveragecaremissionfactor.Thevolumefactoristhenumberofpeoplewithasmartphone.
AssumptionsItwasassumedthataverageannualdistancetravelledwas6,983miles(11,238km)and77%ofthatdistancetravelledwasbycar.
(DepartmentforTransport(DfT)2014a)
Itwasassumedthatvisitingfriendsaccountsfor20%ofdistancetravelled.
(DepartmentforTransport(DfT)2014a)
Thisgivesanaveragedistanceof1731kmtravelledbycarforvisitingfriendsinayear.
Itwasassumedthat30%visitstofamilyorfriendsarebeingreplacedbyvideoconferencesofthosewho“frequently”dothis.
Itwasassumedthat10%ofvisitstofamilyorfriendsarebeingreplacedbyvideoconferencesofthosewhodothis“sometimes”.
PercentagesofhowmanypeoplealreadyreplacevisitingfriendsbyvideocallingaretakenfromtheFutureThinkingsurveyforeachcountry(average18%).ForGermanyandFrancetheaverageofothercountrieswasused.
Consumersurvey–seeAp-pendix5
Category ConnectedLiving
Label Text Reference

106Mobile Carbon Impact
Sub-category Mobilebanking
Mechanism Useofmobilephoneforbankingtransactions,resultinginareductioninphysicaltripstoabank.
Methodology
ThecalculationmethodologybuildsontheMonteCarlosimulationdevelopedbytheYankeeGroupforthereport‘MeasuringtheEnergyReductionImpactofSelectedBroadband-EnabledActivitieswithinHouseholds’(2012).Themainsavingmechanismisfromtravelavoidance.TheYankeeGroupmodelisusedtoderiveanabatementfactorperpersonintheaveragepopulation.ThisisthenmultipliedbytheratioofmobileloginstoPCloginstogiveamobileabatementperperson.
Assumptions MethodologyandassumptionsfromYankeeGroupStudy.
(YankeeGroupResearchInc.andtheAmericanCouncilforanEnergy-EfficientEconomy(ACEEE)2012)
Mobilebankingloginsasapercentageoftotalonlinebankinglogins(52%). (BBA2015)
Category ConnectedLiving
Sub-category Mobileshopping
Mechanism Reducedtraveltoshops,fromon-lineshoppingfromamobiledevice.
Methodology
ThecalculationmethodologybuildsontheMonteCarlosimulationdevelopedbytheYankeeGroupforthereport‘MeasuringtheEnergyReductionImpactofSelectedBroadband-EnabledActivitieswithinHouseholds’(2012).Themodelhasbeenadjustedtoassumethateverybodymovestoonlineshoppingtogetasavingperaverageperson.Thisfigureisthenmultipliedbytheonlinemarketshareoftheentireretailindustry.Thisfigureisthenmultipliedbythemobilemarketshareofthetotalonlinemarkettogiveaneffectivemobilesavingperperson.Thisabatementfactoristhenmultipliedbythepopulationineachcountry/region.
Assumptions MethodologyandassumptionsfromYankeeGroupStudy.
(YankeeGroupResearchInc.andtheAmericanCouncilforanEnergy-EfficientEconomy(ACEEE)2012)
Onlinemarketshareasapercentageofretailsalesfordifferentcountries,istakenfromtheCentreforRetailResearch(2014dataused,rangesfrom3%to13.5%fordifferentcountries).ThemobilepercentageshareoftheonlineretailmarketisalsotakenfromtheCentreforRetailResearch(2014dataused,rangesfrom9.4%to18.7%fordifferentcountries).
(CentreforRetailResearch2015)
Category ConnectedLiving
Sub-category Ridesharing
Label Text Reference

107Mobile Carbon Impact
Mechanism
SmartphoneAppsthathelppeoplewhoarealreadydrivinglongjourneystosharerideswithothers,thusavoidingtheneedforalternativetravelmodes.e.g.blablacar.com,liftshare.com
Methodology
Estimationisbasedontheproportionofthoseusingridesharingapps,andthefrequencyofjourneys,multipliedbytheemissionsofapassengertravellinganequivalentjourneyonacoach.
Assumptions Ridesharingreplacescoachtravel.
Assumedthatanaverageridesharejourneyis200km.
CarbonTrustconsumerresearchdatawasusedforthenumberofsmartphoneusersthatusetheirphonestofindlifts.Wherepossible,countryspecificfigureswereused.Theaveragefigureswere5%dothis“frequently”,and10%dothis“sometimes”.Itwasassumedthatfrequentusewas3ridesharejourneysperyear,andsometimeswasequivalentto1ridesharejourneyperyear.
Consumersurvey–seeAp-pendix5
Category ConnectedLiving
Sub-category Sharingeconomy(goodssharing)
MechanismMobiletechnologyfacilitatesamarketforsecond-handgoods.Rentingequipmentavoidsthepurchaseandmanufactureofnewgoods.
Methodology
ResultsoftheFutureThinkingsurveywereusedtoestimatetheuseofthetechnology.Assumingeachpersonrents/sharesasetnumberofindicativeproductsayear,theavoidedembodiedemissionsofpurchasinganewproductareequaltothecarbonabatement.
Assumptions
Assumeembodiedemissionsofastandard‘annualbundle’ofrented/sharedgoodsis60kgCO₂e.Thebundleofgoodsincludes:lawnmower,drill,shoes,CD,books.Carbonfootprintvaluesarefromappropriatesources.Lifetimereplacementfactorswereassumed,andtypicalnumberofrentals/sharesperyear.
CarbonTrustconsumerresearchdatawasusedforthenumberofsmartphoneusersthatusetheirphonesforgoodssharing.Wherepossible,countryspecificfigureswereused.Theaveragefigureswere9%dothis“frequently”,and18%dothis“sometimes”.Itwasassumedthat‘sometimes’equatesto10%ofrentals/sharesaremadebysmartphone,and‘frequently’equatesto30%.
Consumersurvey–seeAp-pendix5
Category ConnectedLiving
Sub-category Smarthomes
Mechanism Useofsmartphonetoremotelycontroldevicesinthehome,thusreducingenergyuse.
Label Text Reference

108Mobile Carbon Impact
Methodology
Theaverageannualemissionsperperson(forhouseholdgasandelectricityemissions)wereestimatedandthenmultipliedbythepercentageofreductioninenergyconsumptionduetoremotelycontrollingdevicesthroughservicessuchasNestorHive.
Thisemissionsreductionwasthenmultipliedbythepercentageofpeoplewhocontroldevicesinthehomeusingasmartphone.Thisgivesthecarbonabatementperpersonforthosewhoalreadycontroltheirdevicesremotely.
Thevolumefactoristhenumberofpeoplewithasmartphone.
Assumptions
Guardianarticle(byGordonKelly)testedfoursmartthermostatsandconcludedthatsmartercontrolofyourheatingandremoteaccesscanofferenergysavingsof20-30%.
(Kelly2015)
TheGuardianfigureisacombinationofdifferentestimatesfromindustryandislikelytobeestimatedbasedonperfectconditions.Therefore,thispercentagewasloweredanda12.5%energysavingwasassumedwhenremotecontrollingahome.
NumberofHomeswithsmartthermostatsin2014were2.5millionintheUS.Asapercentageofhouseholds,thismeansthatapproximately2%ofsmartphoneusersintheUSAhavesmartthermostats.Itwasassumedthatthesepeoplewillremotelycontroltheirdevices.
(TheNEWSMagazine2015)
Morethan200,000peoplearealreadyusingtheBritishGasHivesystemtowieldgreatercontrolovertheirhomeenergyuse.Thisis0.8%ofUKhouseholds.ThispercentagewasassumedfortherestofEurope.AsitonlyincludesHivefortheUK,thispercentagewasadjustedtoincludeothersystemssuchasNestto1%fortheUK.
(BusinessGreen2015)
Category ConnectedLiving
Sub-category Useofmobileasasatnav
Mechanism Reduceddistancetravelledduetouseofsmartphoneasasatnav.
Methodology
Estimationisbasedontheproportionofsmartphoneusersusingtheirphonesassatnav,multipliedbyafuelsavingfactorforsatnav,distancedriven,anaveragecaremissionfactor,andproportionofmilesdrivenwithasatnav.
AssumptionsTheSWOVStudygivesafuelsavingfactorof16%foruseofsatnavinunfamiliarareas.Asthiswasdeemedveryhigh,aconservativefactorof5%savingwasused.
(SWOV(InstituteforRoadSafetyResearch)2010)
ThepercentageofsmartphoneusersthatdrivecarsistakenfromtheCarbonTrustFutureThinkingSurvey.Figuresrangebetween68%forUKand94%forUSA.Countryspecificfigureswereused.
Consumersurvey–seeAp-pendix5
Averagevehicleannualdistancesforcarsweresourcedfromnationalgovernmentstatisticsdata.
Itwasassumedthat10%oftotaljourneysmadeareinunfamiliarareasthatwouldrequiresatnav.
ThefrequencyofuseofasmartphoneasasatnavcomesfromCarbonTrustFutureThinkingSurvey.
Consumersurvey–seeAp-pendix5
Label Text Reference

109Mobile Carbon Impact
Category ConnectedTransportation
Sub-category Carsharing(carclubs)
Mechanism
Carsharingcarclubsallowtheshareduseofacarbymultipleusers.EachvehicleownedbyacarcluboperatorisequivalenttooneM2Mconnection.Smartphonesareusedtobook,locateandunlockcarclubvehicles.Resultingreductionsincarbonemissionsareduetocarclubmembersreducingtheirannualdistancetravelledbycar,andimprovedfuelefficiencyofcarclubcarscomparedtoprivatecars.
Methodology
Beinginacarclubreducesindividualtravelasnon-essentialjourneysarenolongermadebycar.Savingspermemberarecalculatedbymultiplyingtheaveragedistancereducedbyanaveragecaremissionfactor.Thisisthenmultipliedbytheaveragenumberofmemberspercartocalculatethecarbonabatementpercar.
Thesavingsfrommoreefficientcarsiscalculatedbymultiplyingtheaveragecarclubannualdistancebythedifferenceinemissionfactorsforcarclubcarcomparedtoatypicalaverageprivatecar.
Assumptions AverageZipcaremissionsare110gCO₂e/km. (Zipcar2014)
33memberspercarclubcarinEnglandandWales(outsideofLondon),andaveragenetreductioninmileageis1910miles(3074km)permember.Totalaveragemileageis3500permember.
(Carplus2015)
9000carsharingvehiclesand380,000members.Equatesto42memberspercarclubcarinGermany.ThisfigurewasusedforGermanyand33forallothercountries.
(BundesverbandCarSharinge.V2015)
Itwasassumedthattheaverageclubcartravels20,000milesperyear(32,186km),thisequatesto606miles(975km)permember.
Category ConnectedTransportation
Sub-category Fleetvehicledriverbehaviourimprovement
Mechanism Improvementofdriverbehaviourthroughtelematics-leadingtoreducedfuelconsumption.
Methodology
Calculateaverageemissionspervehicleforcars,LGVsandHGVs,usingnationaldataontotaldistance,numberofvehicles,andstandardemissionfactors.Calculateweightedaveragevehicleemissionsassumingmixofcar/LGV/HGVforM2Mconnections.Multiplyaverageemissionspervehiclebypercentagefuelsaving(basedonvariousstudies).
Assumptions
A10%fuelsavingwasassumedduetoimproveddriverbehaviour.Variouspublishedandunpublishedstudiesindicatesavingsfrom5-15%,dependantonlevelofintervention.Examplesofsomepublishedsources:
• 2-10%fuelsaving,JürgenHase,VPofM2MCompetenceCentreatDeutscheTelekom. (O’Flaherty2013)
• 9%savinginallfleet (FleetNews2011)
• 10-15%savings (EnergySavingTrust2011)
• upto20%saving (Fleetindustryadvisorygroup2014)
Label Text Reference

110Mobile Carbon Impact
• 10%-15%saving,JariSalminen,Vodafoneheadofbusinessdevelopment,M2M (O’Flaherty2013)
• anaverageof5-10%savingsonfuelcosts-inmanycases,thissavingreaches15% (MixTelematics2015)
• 14%saving (FleetNews2011)
• 20%saving (HetnieuRijden2015)
• 10%saving (ANWB2015)
• 15%saving (EcoDrive2015)
• 11.5%-18.3%saving (Sycada-Green2010)
Averageannualdistancesforcars/LGVs/HGVswereusedbasedonnationalstatisticsandemissionfactors.
Amixofvehicletypeswereassumed(20%car,60%LGV,20%HGV)basedontypicalsplitofM2MconnectionsforFleetManagement.(CarbonTrustanalysis).
Category ConnectedTransportation
Sub-category Remotevehicleconditionmonitoring
MechanismRemotevehicleconditionmonitoring,allowingadvancemaintenanceplanningthatreducesbreakdownsandreducedcall-outjourneysbybreakdownvans.
MethodologyEstimationisbasedonareductioninaveragecallouts,multipliedbytheaveragedistanceofacalloutusingavanemissionfactor.
Assumptions Assumedaveragedistanceofacalloutis15km.
Assumedthatpeoplecalloutbreakdownvansonaverage0.5timesayear.
CleverDevicessuggestthatAutomaticVehicleMonitoringreducescalloutsby25-40%.Afigureof25%reductionincalloutswasassumed.
(CleverDevices2015)
Category ConnectedTransportation
Sub-category Roadsideassistance
Mechanism
Vehicleconditionmonitoring,allowingbreakdowncompaniestoplanbettercallouttrips.Resultingreductionincarbonemissionsisfromusingmotorbikesinsteadofvanstofixflatbatteries.
Methodology
Estimationisbasedontheaveragecalloutsforbatteryrelatedissuesmultipliedbytheemissionsofanaveragecalloutonamotorbike,subtractedfromtheemissionsofanaveragecalloutusingavan.
Assumptions Averageannualbatteryrelatedcallsisassumedtobe0.3calloutspermember.
Averagedistanceofacalloutisassumedtobe15km.
Category ConnectedTransportation
Sub-category Satellitenavigation
Mechanism Useofsatellitenavigation(satnav)incars,reducingdistancetravelled,incorporatingtrafficinformation.
MethodologyEstimationisbasedonafuelsavingfactorforsatnav,annualdistancedriven,anaveragecaremissionfactor,andproportionofmilesdrivenwithasatnav.
Label Text Reference

111Mobile Carbon Impact
AssumptionsTheSWOVStudygivesafuelsavingfactorof16%foruseofsatnavinunfamiliarareas.Asthiswasdeemedveryhigh,aconservativefactorof5%savingwasused.
(SWOV(InstituteforRoadSafetyResearch)2010)
Itwasassumedthat10%oftotaljourneysmadeareinunfamiliarareasthatwouldrequiresatnav.
Category ConnectedTransportation
Sub-category Seafleet
Mechanism
TrackingofSeafleetsandreal-timeinformationupdates,allowingforoptimisedroutings,directionofshipstomostappropriateport,reducingwaitingandloadingtimesatdocks.Resultinginoverallsavingsintransportfuelused.
Methodology
SEMAFORSoptimisedshiproutingestimatesfuelsavingsofupto5%.Usingthisinformationandtakingaconservativeestimateofrealsavingsof2%,applythistotheaverageemissionsofacommercialship.Theaverageiscalculatedfromtheoverallglobalshippingemissionsdividedbythenumberofvessels.ThisinformationisobtainedfromtheIMO(InternationalMaritimeOrganization).
Assumptions Totalannualemissionsfromtheglobalshippingfleetwere972,000,000tCO₂e.Thisisbasedon54,897vessels.
(InternationalMaritimeOrganisation(IMO)2014)
Assumeaconservativeestimateof2%savings. (Semafors2013)
Category ConnectedTransportation
Sub-category Smartlogistics-efficientrouting&fleetmanagement
MechanismBetterroutingandcoordinationofvehiclefleets,resultinginreductionoftotaldistancetravelled,avoidingareasofhighcongestionandoptimisingfuelusage.
Methodology
Calculateaverageemissionspervehicleforcars,LGVsandHGVs,usingnationaldataontotaldistance,numberofvehicles,andstandardemissionfactors.Calculateweightedaveragevehicleemissionsassumingmixofcar/LGV/HGVforM2Mconnections.Multiplyaverageemissionspervehiclebypercentagefuelsaving(basedonvariousstudies).
Assumptions A5%fuelsavingwasassumed(varioussourcessuggest2-15%savings)-e.g.
• 2-10%fuelsaving (O’Flaherty2013)
• 9%savinginallfleet (FleetNews2011)
• 10-15%savings (EnergySavingTrust2011)
• upto20%saving (Fleetindustryadvisorygroup2014)
• 10%-15%saving,JariSalminen,Vodafoneheadofbusinessdevelopment,M2M (O’Flaherty2013)
Averageannualdistancesforcars/LGVs/HGVswereassumedbasedonnationalstatisticsandemissionfactors.
Amixofvehicletypeswasassumed(20%car/60%LGV/20%HGV)basedontypicalsplitofM2MconnectionsforFleetManagement.(CarbonTrustanalysis).
Itwasassumedthatroutingsavingsareonlyapplicabletogoodsvehicles.
Label Text Reference

112Mobile Carbon Impact
Category ConnectedTransportation
Sub-category Smartlogistics-loadingoptimisation
MechanismRemotemonitoringofvehicleloading,allowingbetterutilisationofvehiclesandhencereducedoveralljourneydistances.
Methodology
Calculateaverageemissionspervehicleforcars,LGVsandHGVs,usingnationaldataontotaldistance,numberofvehicles,andstandardemissionfactors.Calculateweightedaveragevehicleemissionsassumingmixofcar/LGV/HGVforM2Mconnections.Multiplyaverageemissionspervehiclebypercentagefuelsaving(basedonvariousstudies).
Assumptions
A2%fuelsavingwasassumedforloadingoptimisationofgoodsvehicles.Referenceindicatesthat10%ofmilesintheUSAofleasedfreightisempty.Itwasassumedthatafifthofthe10%figure(i.e.2%)canbesavedduetotelematics.Variousothersourcessuggest2-15%savingsduegenericallytotelematicsinvehicles.-e.g.
(CarbonWarRoom2012)
• 2-10%fuelsaving (O’Flaherty2013)
• 9%savinginallfleet (FleetNews2011)
• 10-15%savings (EnergySavingTrust2011)
• upto20%saving (Fleetindustryadvisorygroup2014)
• 10%-15%saving,JariSalminen,Vodafoneheadofbusinessdevelopment,M2M (O’Flaherty2013)
Averageannualdistanceswereusedforcars/LGVs/HGVsbasedonnationalstatisticsandemissionfactors.
Amixofvehicletypeswereassumed(20%car/60%LGV/20%HGV)basedontypicalsplitofM2MconnectionsforFleetManagement.(CarbonTrustanalysis).
Itwasassumedthatloadingoptimisationsavingsareonlyapplicabletogoodsvehicles.
Category ConnectedTransportation
Sub-category Usabilityofpublictransport
Mechanism
Useofrealtimeuseraccesstoinformationonpublictransportservicesonamobiledeviceencouragesgreateruseofpublictransport.Thisresultsinamodalshiftfromcartopublictransport.
Methodology
Considerationwasmadeofthepercentageoftypicalsmartphoneusersthatdrivetoworkandtheiraveragecommutingdistancebycar.Takingtheresultsfromtheconsumerresearchsurvey,thisismultipliedbythepercentageofpeoplewhosaythattheyusepublictransportmoreoften.Itwasassumedthatforthosethatdoshiftsomeoftheirjourneystopublictransport,thattheydothisfor10%oftheirjourneys.Savingsareappliedonlytodailycommutejourneys.
Assumptions AveragecommutedistancesbycarforEuropeancountriestakenfromtheEuropeanCommissionJRCreport. (Pasaogluetal.2012)
AveragecommutedistancesbycarforUSAtakenfromtheUSDOTNHTSreport.
(USDepartmentofTransportationFederalHighwaysAdministration(FHWA)2011)
Label Text Reference
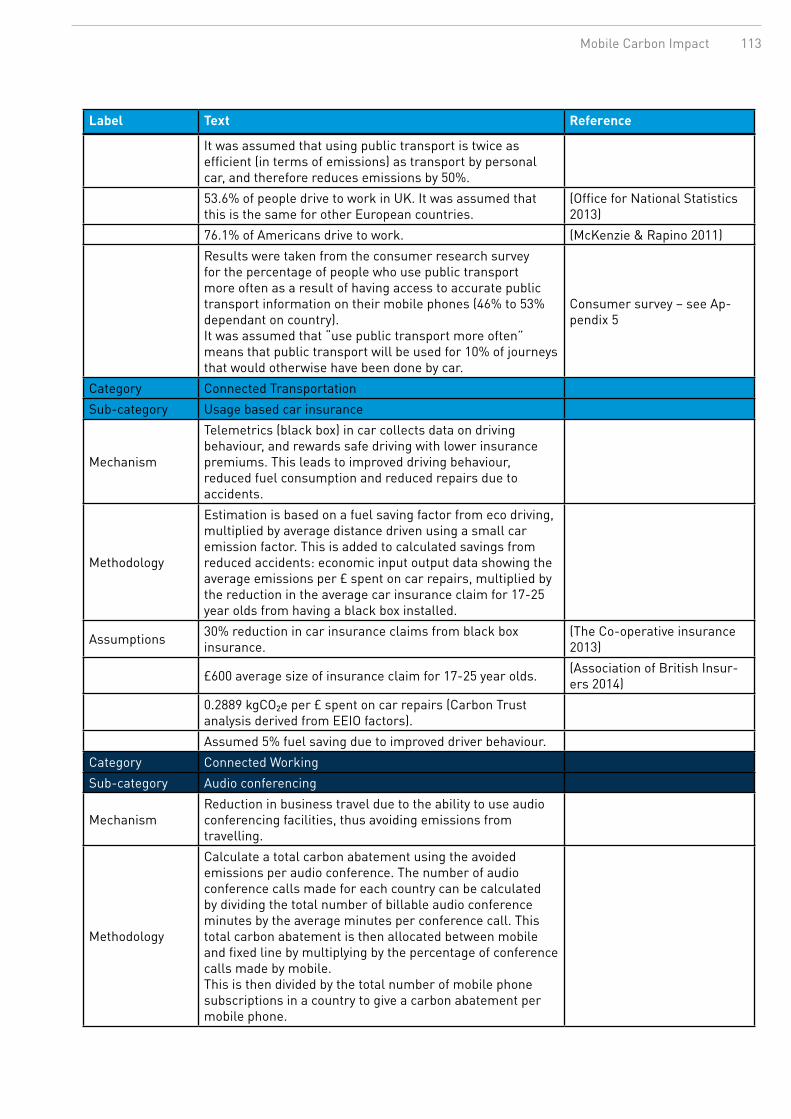
113Mobile Carbon Impact
Itwasassumedthatusingpublictransportistwiceasefficient(intermsofemissions)astransportbypersonalcar,andthereforereducesemissionsby50%.
53.6%ofpeopledrivetoworkinUK.ItwasassumedthatthisisthesameforotherEuropeancountries.
(OfficeforNationalStatistics2013)
76.1%ofAmericansdrivetowork. (McKenzie&Rapino2011)
Resultsweretakenfromtheconsumerresearchsurveyforthepercentageofpeoplewhousepublictransportmoreoftenasaresultofhavingaccesstoaccuratepublictransportinformationontheirmobilephones(46%to53%dependantoncountry).Itwasassumedthat“usepublictransportmoreoften”meansthatpublictransportwillbeusedfor10%ofjourneysthatwouldotherwisehavebeendonebycar.
Consumersurvey–seeAp-pendix5
Category ConnectedTransportation
Sub-category Usagebasedcarinsurance
Mechanism
Telemetrics(blackbox)incarcollectsdataondrivingbehaviour,andrewardssafedrivingwithlowerinsurancepremiums.Thisleadstoimproveddrivingbehaviour,reducedfuelconsumptionandreducedrepairsduetoaccidents.
Methodology
Estimationisbasedonafuelsavingfactorfromecodriving,multipliedbyaveragedistancedrivenusingasmallcaremissionfactor.Thisisaddedtocalculatedsavingsfromreducedaccidents:economicinputoutputdatashowingtheaverageemissionsper£spentoncarrepairs,multipliedbythereductionintheaveragecarinsuranceclaimfor17-25yearoldsfromhavingablackboxinstalled.
Assumptions 30%reductionincarinsuranceclaimsfromblackboxinsurance.
(TheCo-operativeinsurance2013)
£600averagesizeofinsuranceclaimfor17-25yearolds. (AssociationofBritishInsur-ers2014)
0.2889kgCO₂eper£spentoncarrepairs(CarbonTrustanalysisderivedfromEEIOfactors).
Assumed5%fuelsavingduetoimproveddriverbehaviour.
Category ConnectedWorking
Sub-category Audioconferencing
MechanismReductioninbusinesstravelduetotheabilitytouseaudioconferencingfacilities,thusavoidingemissionsfromtravelling.
Methodology
Calculateatotalcarbonabatementusingtheavoidedemissionsperaudioconference.Thenumberofaudioconferencecallsmadeforeachcountrycanbecalculatedbydividingthetotalnumberofbillableaudioconferenceminutesbytheaverageminutesperconferencecall.Thistotalcarbonabatementisthenallocatedbetweenmobileandfixedlinebymultiplyingbythepercentageofconferencecallsmadebymobile.Thisisthendividedbythetotalnumberofmobilephonesubscriptionsinacountrytogiveacarbonabatementpermobilephone.
Label Text Reference

114Mobile Carbon Impact
Assumptions Avoidedemissionsfromoneaudioconferencecall=28.1kgCO₂e. (CarbonTrust2015)
21.2%ofaudioconferencecallsaremadefromamobile. (Collins2014)
Marketdata(bycountry)onannualbillableaudioconferenceminutesprovidedbyBT.Assumedaveragelengthofconferencecallof55minutes,with4.5participantspercall,andthatthisisthesameforallcountries.
Category ConnectedWorking
Sub-category Workingfromhome
Mechanism
Peopleworkingfromhomeratherthantravellingtoanoffice,resultinginareductionincommutingtransportandreductioninofficeenergyconsumption.(Reboundeffectsofincreasedhomeenergyconsumptionandincreasedpersonalerrandswereincludedinthecalculation).
Methodology
UsingasabasispreviousCarbonTrustresearch,andCarbonTrustresearchforVodafoneNetherlandstocalculateaveragecarbonsavingspertelecommuter.Theseconsideredsavingsfromreducedcommuting,savingsfromreducedofficeenergy,andincreasedhomeenergyuse.Apportionthistomobilebasedonthepercentageoftelecommutersforwhommobileisimportanttocarryouttheirwork.Convertthe‘pertelecommuter’figuretoa‘perworkingperson’figurebymultiplyingbythepercentageoftelecommutersofthetotalworkforce.
AssumptionsAssumedaveragetelecommuterworks2daysperweekfromhomeinUKand1.4daysperweekinNetherlands(basedonsurveydata).
AveragecarbonsavingsfromtelecommutinginUKperyear:617kgCO₂epertelecommuter. (CarbonTrust2014)
AveragecarbonsavingsfromtelecommutinginNetherlandsperyear:348kgCO₂epertelecommuter. (VodafoneNetherlands2015)
TheaverageoftheUKandNetherlandsfigureswereusedtogiveacarbonsavingof482.5kgCO₂epertelecommuter,andappliedthistoallcountries.
Forthepercentageofthetotalworkingpopulationthataretelecommuters,a12%figurewasusedfortheUK,and20%forothercountries.(20%beingtheaverageoftheUK(12%)andNetherlands(28%)figures).Datafromnationalstatistics.
ResultsfromasurveycommissionedbyVodafoneNetherlandsshowthat“25%oftheworkingpopulationworkfromhomeforeitherfullorpartdaysandconsiderthateitheramobilephoneoradongleisimportantforthemtocarryouttheirwork”.Thisfigureof25%wasusedanditwasappliedtoallcountries.
(VodafoneNetherlands2015)
Category Physical-to-Digital
Sub-category Multi-functionaldevice
Mechanism
Useofsmartphonetoreplacemultipledevices(e.g.camera,calculator,non-smartphone,musicplayer,gameconsole,alarmclock,satnav).Leadingtoreducedembodiedemissionsofmultipledevices.
Label Text Reference

115Mobile Carbon Impact
Methodology
1.Usingresultsfromconsumersurveygivespercentageofsmartphoneusersthatsaytheyreplacedeviceswithasmartphone.2.Calculateembodiedcarbonavoided,byconsideringthecarbonfootprintofeachdeviceandweightingitbythepercentageofpeoplethatusethatfunction.3.Multiplypercentagefrom(1)byembodiedcarbonavoided(2)anddividebyassumedreplacementperiodinyears.
Assumptions
Percentageofsmartphoneusersthatsaytheyreplacedeviceswithasmartphoneistakenfromconsumersurvey.UK:58%,USA62%,Spain70%,Average64%.
Consumersurvey–seeAppendix5
Embodiedcarbonfootprintfordifferentdevicesfromindustrystudy.Featurephone:5.4kgCO₂e.MP3player:10.3kgCO₂e.Camera:19kgCO₂e.Gameconsole:31.6kgCO₂e.Satnavdevice:18.6kgCO₂e.Smartphone:41.9kgCO₂e.
Percentageofsmartphoneusersthatuseotherfunctionsontheirsmartphone-figuresfromconsumerresearch.
Consumersurvey–seeAppendix5
Assumetypicalreplacementperiodfordevicesof2years.
Category Physical-to-Digital
Sub-category Newspapers,music,DVD,storage
Mechanism
Useofmobiledevicestoreplacephysicalmediawithdigitalmediaforthefollowing:newspapers,musicCDs,videoDVDs,andphotos.Thecarbonsavingsarefromnolongerhavingthephysicalmedia.
Methodology
ThecalculationmethodologybuildsontheMonteCarlosimulationdevelopedbytheYankeeGroupforthereport‘MeasuringtheEnergyReductionImpactofSelectedBroadband-EnabledActivitieswithinHouseholds’(2012).Themodelhasbeenadjustedtocalculatetheaveragecarbonsavingperpersonifeverybodyadopteddigitaltoreplacephysicalmedia.ThisiscalculatedforEuropeandUSA.Thisfigureisthenmultipliedbytheonlinemarketshareoftheentireretailindustry,tocalculatethecarbonsavingsfromon-lineactivity.Theresultingfigureisthenmultipliedbythemobilemarketshareofthetotalonlinemarket,whichgivesacarbonsavingfrommobileuseperperson.
Assumptions MethodologyandassumptionsaretakenfromtheYankeeGroupStudy.
(YankeeGroupResearchInc.andtheAmericanCouncilforanEnergy-EfficientEconomy(ACEEE)2012)
Thedataforpercentageofretailsales,onlinemarketshare,andmobilepercentageshareofonlinemarketaretakenfromtheCentreforRetailResearchforeachspecificcountrythatisanalysed.
(CentreforRetailResearch2015)
Label Text Reference

116Mobile Carbon Impact
Appendix 4: References for data sources and assumptions
ABB, 2011. Leakage monitoring: Reducing leakage through effective flow measurement, Available at: https://library.e.abb.com/public/e0cc9b7d337e577dc125790d0027c37b/AG_LEAKAGE-EN.pdf
ABTA, 2014. The Consumer Holiday Trends Report. ABTA Consumer Survey 2014, Available at: https://abta.com/resource-zone/publication/the-consumer-holiday-trends-report-2014.
Accenture and Vodafone, 2009. Carbon Connections: Quantifying mobile’s role in tackling climate change, Available at: http://www.vodafone.com/content/dam/vodafone-images/sustainability/downloads/carbon_connections.pdf.
Airbnb, 2014. Environmental impacts of home sharing. Available at: http://blog.airbnb.com/environmental-impacts-of-home-sharing/.
Anderson, D., 2011. Maximizing Dorm Energy Savings with Intelligent HVAC Controls. In Association for the Advancement of Sustainability in Higher Education (AASHE). Available at: http://www.aashe.org/resources/conference/maximizing-dorm-energy-savings-intelligent-hvac-controls-0 [Accessed September 3, 2015].
ANWB, 2015. Economisch rijden: bespaar brandstof. Available at: http://www.anwb.nl/auto/besparen/zuiniger-rijden/economisch-rijden [Accessed September 1, 2015].
Association of British Insurers (ABI), 2014. Age and Insurance, Available at: https://www.abi.org.uk/~/media/Files/Documents/Publications/Public/2014/Risk pricing/Age and Insurance 2014.pdf.
BBA, 2015. Mobile phone apps become the UK’s number one way to bank. Available at: https://www.bba.org.uk/news/press-releases/mobile-phone-apps-become-the-uks-number-one-way-to-bank/#.VdrllBRVhHx.
Bedford, M. et al., 2013. Occupier Density Study 2013, Available at: http://www.architectsjournal.co.uk/Journals/2013/09/10/c/y/n/BCO-Occupier-Density-Study---Final-report-2013.pdf.
Bielsa, A., 2013. Smart Parking and environmental monitoring in one of the world’s largest WSN. Available at: http://www.libelium.com/smart_santander_smart_parking/ [Accessed August 27, 2015].
Bora, G.C., Nowatzki, J.F. & Roberts, D.C., 2012. Energy savings by adopting precision agriculture in rural USA. Energy,
Sustainability and Society, 2(1), p.22. Available at: http://www.energsustainsoc.com/content/2/1/22 [Accessed June 29, 2015].
Bridges, G. & MacDonald, M., 1994. Leakage control—the neglected solution? 20th WEDC Conference. Available at: http://wedc.lboro.ac.uk/resources/conference/20/Bridges.pdf [Accessed August 13, 2015].
British Telecommunications plc, 2014. Case Study: Smart Parking in Milton Keynes. Innovative parking space optimisation
pilot project, Available at: http://www.globalservices.bt.com/static/assets/pdf/case_studies/EN_NEW/milton_keynes_case_study.pdf.
British Telecommunications plc, 2013. Northumbrian Water Case Study, Available at: http://www.globalservices.bt.com/uk/en/casestudy/northumbrian_water.

117Mobile Carbon Impact
Bundesverband CarSharing e.V, 2015. Auf dem Weg zu einer neuen Mobilitätskultur - mehr als eine Million CarSharing-
Nutzer, Available at: http://carsharing.de/sites/default/files/uploads/ueber_den_bcs/pdf/bcs_jahresbericht_2014_final.pdf.
Business Green, 2015. British Gas refreshes Hive smart home range. Available at: http://www.businessgreen.com/bg/news/2417983/british-gas-refreshes-hive-smart-home-range.
Business Stream, How does 30% break down? Available at: https://www.business-stream.co.uk/water-efficiency/why-be-water-efficient/how-does-30-break-down
Buzby, J.C. et al., 2009. Supermarket Loss Estimates for Fresh Fruit, Vegetables, Meat, Poultry, and Seafood and Their Use in the ERS Loss-Adjusted Food Availability Data. Economic Information Bulletin. Available at: http://ideas.repec.org/p/ags/uersib/58313.html [Accessed September 21, 2015].
Carbon Trust, 2007. Advanced metering for SMEs Carbon and cost savings, Available at: https://www.carbontrust.com/media/77244/ctc713_advanced_metering_for_smes.pdf.
Carbon Trust, 2015. BT’s Net Good 3:1 carbon abatement methodology, Available at: http://www.btplc.com/Betterfuture/NetGood/OurNetGoodgoal/BTNetGoodMethodology2015.pdf.
Carbon Trust, 2011. Energy management. A comprehensive guide to controlling energy use, Available at: http://www.carbontrust.com/media/13187/ctg054_energy_management.pdf.
Carbon Trust, 2012. Heating, ventilation and air conditioning (HVAC) equipment, Available at: https://www.gov.uk/government/uploads/system/uploads/attachment_data/file/376178/ECA762_Heating__Ventilation_and_Air_Conditioning_Equipment.pdf.
Carbon Trust, 2014. Homeworking: helping businesses cut costs and reduce their carbon footprint, Available at: https://www.carbontrust.com/media/507270/ctc830-homeworking.pdf.
Carbon War Room, 2012. Road Transport: Unlocking Fuel-Saving Technologies in Trucking And Fleets, Available at: http://carbonwarroom.com/sites/default/files/reports/Unlocking Fuel Saving Technologies in Trucking and Fleets (Carbon War Room)_0.pdf.
Carplus, 2015. Carplus annual survey of car clubs 2014/15. England and Wales (excluding London), Available at: http://www.carplus.org.uk/wp-content/uploads/2015/04/Carplus-Annual-Survey-of-Car-Clubs-2014-England-and-Wales_Final1.pdf.
Center for Climate and Energy Solutions, Buildings and Emissions: Making the Connection. Available at: http://www.c2es.org/technology/overview/buildings.
Center for Resource Solutions (CRS), 2015. 2015 Green-e Energy Residual Mix Emissions Rates, Available at: http://www.green-e.org/docs/energy/ResidualMix2015.pdf.
Centre for Retail Research, 2015. Online Retailing: Britain, Europe, US and Canada 2015. Available at: http://www.retailresearch.org/onlineretailing.php.

118Mobile Carbon Impact
Clean Energy Installations, 2015. Commercial Solar PV Installation. Available at: http://www.smconsult.co.uk/commercial-solar-pv-installation/
Clever Devices, 2015. Automatic Vehicle Monitoring® Reduces Vehicle Maintenance and Repair Costs. Available at: http://www.cleverdevices.com/products-vehicle-health-monitoring.htm [Accessed September 1, 2015].
Collins, D., 2014. Mobile Conferencing Trends for 2014 (Infographic). Available at: http://www.intercall.com/blog/mobile-conferencing/mobile-conferencing-changing-work-infographic [Accessed September 1, 2015].
Commission for Energy Regulation (CER), 2011. Smart Metering Information Paper 4 Results of Electricity Cost-Benefit
Analysis, Customer Behaviour Trials and Technology Trials, Available at: http://www.cer.ie/docs/000340/cer11080.pdf.
DECC, 2010. GB-wide smart meter roll out for the domestic sector, Available at: https://www.ofgem.gov.uk/ofgem-publications/63551/decc-impact-assessment-domestic.pdf.
DECC, 2014. Smart meter roll-out for the domestic and small and medium non-domestic sectors (GB). Available at: https://www.gov.uk/government/uploads/system/uploads/attachment_data/file/276656/smart_meter_roll_out_for_the_domestic_and_small_and_medium_and_non_domestic_sectors.pdf.
Department for Transport (DfT), 2014a. National Travel Survey: England 2013, Available at: https://www.gov.uk/government/uploads/system/uploads/attachment_data/file/342160/nts2013-01.pdf.
Department for Transport (DfT), 2014b. Trips, distance travelled and time taken: England, 1972/73 to 2013, Available at: https://www.gov.uk/government/statistical-data-sets/nts01-average-number-of-trips-made-and-distance-travelled.
Department of the Environment Transport and the Regions (DETR), 2000. Energy Efficiency Best Practice programme.
Energy Consumption Guide (ECON) 19 - Energy use in offices, Available at: http://www.targ.co.uk/other/guide19.pdf.
Dwyer, T., 2015. Lighting control technologies and strategies to cut energy consumption. CIBSE Journal. Available at: http://www.cibsejournal.com/cpd/2010-11/.
EcoDrive, 2015. Het nieuwe rijden, dé rijstijl voor zuinig rijden. Realiseer brandstofbesparing en zorg voor een schoner milieu. Available at: http://www.ecodrive.eu/nl/mvo/het-nieuwe-rijden?gclid=CIL2jrXGr8UCFYfHtAodEA4AFQ [Accessed September 1, 2015].
EIA, 2006. Electricity Consumption and Expenditure Intensities for Non-Mall Buildings, 2003. Available at: http://www.eia.gov/consumption/commercial/data/archive/cbecs/cbecs2003/detailed_tables_2003/2003set10/2003html/c14.html [Accessed August 27, 2015].
Energy Saving Trust, 2011. A Guide to Telematics, Available at: http://www.energysavingtrust.org.uk/businesses/sites/default/files/Telematics.pdf.
Fleet industry advisory group, 2014. Telematics explained, Available at: http://www.fiag.co.uk/wp-content/uploads/2014/11/FIAG-Telematics-Explained-white-paper.pdf.

119Mobile Carbon Impact
FleetNews, 2011. Iron Mountain cuts driving incidents 80% and achieves 14% fuel savings. Available at: http://www.fleetnews.co.uk/fleet-management/iron-mountain-cuts-driving-incidents-80-and-achieves-14-fuel-savings/40287/.
Gazelle Wind Turbines, 2015. Gazelle 20kW Wind Turbine, Available at: http://www.mkw.co.uk/about/Gazelle_leaflet.pdf
Global e-Sustainability Initiative (GeSI), 2008. SMART 2020 report: Global ICT solution case studies, Available at: http://www.smart2020.org/_assets/files/02_smart2020Report.pdf [Accessed August 13, 2015].
Global e-Sustainability Initiative (GeSI) and The Boston Consulting Group (BCG), 2012. SMARTer 2020: The Role of ICT in Driving a Sustainable Future, Available at: gesi.org/portfolio/file/5.
GSMA Intelligence, 2015. Agricultural machine-to-machine (Agri M2M): a platform for expansion, Available at: https://gsmaintelligence.com/research/?file=9186f77efc0a47fe7f127d79d789c64c&download
Hernandez, C. et al., 2009. The burden of chronic disorders on hospital admissions prompts the need for new modalities of care: a cross-sectional analysis in a tertiary hospital. QJM : monthly journal of the Association of Physicians,
102(3), pp.193–202. Available at: http://www.ncbi.nlm.nih.gov/pubmed/19147657 [Accessed August 11, 2015].
Het nieu Rijden, 2015. Het Nieuwe Rijden levert u veel op. Available at: http://www.hetnieuwerijden.nl/wat-kunt-u-doen/rijstijltips/restyle-je-rijstijl-volg-de-tips-van-hnr/
Houses of Parliament, 2014. Smart Metering of Energy and Water, Available at: http://researchbriefings.parliament.uk/ResearchBriefing/Summary/POST-PN-471#fullreport.
International Energy Agency (IEA), 2005. World Energy Outlook 2005. Available at: http://www.worldenergyoutlook.org/media/weowebsite/2008-1994/weo2005.pdf.
International Maritime Organisation (IMO), 2014. Reduction of GHG Emissions From Ships. Third IMO GHG Study 2014
- Final Report, Available at: http://www.iadc.org/wp-content/uploads/2014/02/MEPC-67-6-INF3-2014-Final-Report-complete.pdf.
Joint Expert Group on Transport and Environment, 2010. Urban road charge in European cities: A possible means towards a
new culture for urban mobility?, Available at: http://ec.europa.eu/transport/themes/urban/urban_mobility/urban_mobility_actions/doc/2010_jeg_urban_road_charging.pdf.
Joint Research Centre (JRC) of the European Commission et al., 2014. Precision Agriculture: An opportunity for EU Farmers
- potential support with the CAP 2014-2020, Available at: http://www.europarl.europa.eu/RegData/etudes/note/join/2014/529049/IPOL-AGRI_NT%282014%29529049_EN.pdf
Kelly, G., 2015. Smart thermostats reviewed: Which can save you the most? The Guardian. Available at: http://www.theguardian.com/environment/2015/jan/27/smart-thermostats-reviewed-which-can-save-you-most
Lu, A., 2010. NRDC White Paper: A Primer on the (Strong) Smart Grid and its Potential for Reducing GHG Emissions in China
and the United States, Available at: http://www.nrdc.cn/phpcms/userfiles/download/201107/17/A%20Primer%20on%20the%20(Strong)%20Smart%20Grid%20and%20its%20Potential%20for%20Reducing%20GHG%20Emissions%20in%20China%20and%20the%20United%20States%202010%20Oct.pdf

120Mobile Carbon Impact
Lu, J., Sookoor, T. & Srinivasan, V., 2010. The smart thermostat: using occupancy sensors to save energy in homes. Proceedings of the 8th ACM Conference on Embedded Networked Sensor Systems. Available at: http://dl.acm.org/citation.cfm?id=1870005 [Accessed August 10, 2015].
McKenzie, B. & Rapino, M., 2011. Commuting in the United States: 2009, Available at: https://www.census.gov/prod/2011pubs/acs-15.pdf
Mix Telematics, 2015. Fuel Saving. Available at: http://www.mixtelematics.us/solutions/fuel-saving.
Mutchek, M. & Williams, E., 2014. Moving Towards Sustainable and Resilient Smart Water Grids. Challenges, 5(1), pp.123–137. Available at: http://www.mdpi.com/2078-1547/5/1/123/htm [Accessed August 10, 2015].
National Grid (US), 2014. Methane Emissions Fact Sheet, Available at: http://us.nationalgridconnecting.com/wp-content/uploads/2014/07/FINAL-Methane-Emissions-Fact-Sheet-July-2014.pdf
NHS Confederation, 2015. Key statistics on the NHS. Available at: http://www.nhsconfed.org/resources/key-statistics-on-the-nhs [Accessed August 27, 2015].
O’Flaherty, K., 2013. Driving efficiency with fleet management systems. Wireless magazine. Available at: http://www.wireless-mag.com/Features/27169/Driving_efficiency_with_fleet_management_systems_.aspx#sthash.UF4nBUaG.dpuf
Office for National Statistics, 2013. Method of Travel to Work in England and Wales – 2011, Available at: http://www.ons.gov.uk/ons/rel/census/2011-census-analysis/method-of-travel-to-work-in-england-and-wales/sty-method-of-travel-to-work.html
Pasaoglu, G. et al., 2012. Driving and parking patterns of European car drivers - a mobility survey., Available at: http://publications.jrc.ec.europa.eu/repository/handle/JRC77079
Payments Council, 2010. Annual Summary of Payment Clearing Statistics 2009. , (May 2010).
PwC, 2013. Connected Life: the impact of the Connected Life over the next five years. Available at: http://www.gsma.com/connectedliving/wp-content/uploads/2013/02/GSMA-Connected-Life-PwC_Feb-2013.pdf
RegenSW, 2015. Solar PV. Available at: http://www.regensw.co.uk/communities/technologies/solar-pv/
Ross, D. et al., 2011. Better Metering Toolkit. A guide to improved energy management through better energy metering, Available at: http://www.betterbuildingspartnership.co.uk/sites/default/files/media/attachment/bbp-better-metering-toolkit.pdf
Schenck, R. & Huizenga, D.., 2014. Proceedings of the 9th International Conference on Life Cycle Assessment in the Agri-Food Sector (LCA Food 2014), 8-10 October 2014, San Francisco. Available at: http://www.es.ucsb.edu/faculty/cleveland/CV/2014_diet_change_health_care_LCA_ Food_conf
Semafors, 2013. SEMAFORS - the Ship Efficiency Monitoring, Weather Forecasting and Optimised Routing Service | ESA’s ARTES Applications. Available at: https://artes-apps.esa.int/projects/semafors [Accessed September 1, 2015].

121Mobile Carbon Impact
Snack’ums, 2015. Vending machines FAQs. Available at: http://www.snackums.co.uk/vending-machines/
Solar Windtek, 2015. Wind Turbines 40kW-2MW. Available at: http://www.solarwindtek.com/site/wind40-2.shtml
Steetline, 2013. Parking data and analytics white paper, Available at: http://www.streetline.com/smart-cities/smart-parking-data-smart-parking-analytics-whitepaper/
SWOV (Institute for Road Safety Research), 2010. SWOV Factsheet - Safety effects of navigation systems. Available at: https://www.swov.nl/rapport/Factsheets/UK/FS_Navigation_systems.pdf
Sycada-Green, 2010. Sycada.Green. Available at: http://www.sycada-green.com/the-business-case [Accessed September 1, 2015].
Telensa, 2015. Lighting. Available at: http://www.telensa.com/solutions/lighting/
The Co-operative insurance, 2013. Young Drivers Report - Young drivers: Are they ready for the road?, Available at: http://www.co-operative.coop/corporate/Young_Drivers_are_they_ready_for_the_road.pdf
The NEWS Magazine, 2015. The number of Homes with Smart Thermostats Doubled in 2014. Available at: http://www.achrnews.com/articles/128554-jan-19-2015-the-number-of-homes-with-smart-thermostats-doubled-in-2015
The Renewable Energy Hub, 2015. How much is a Wind Turbine likely to make me and over what period? Available at: https://www.renewableenergyhub.co.uk/how-much-are-wind-turbines-likely-to-make-me-and-over-what-period.html
TNT, 2011. TNT Express - Pallets. Available at: http://www.tnt.com/express/en_cn/site/home/support/paperwork_and_packaging/useful_packaging_tips/pallets.html [Accessed August 27, 2015].
Transport for London (TFL), 2008. Central London Congestion Charging. Impacts Monitoring. Sixth Annual Report, July
2008, Available at: https://tfl.gov.uk/cdn/static/cms/documents/central-london-congestion-charging-impacts-monitoring-sixth-annual-report.pdf
Transport for London (TFL), 2014. Source London Electric Vehicle Charging Network Key Fact Sheet, Available at: https://tfl.gov.uk/cdn/static/cms/documents/ev-fact-sheet-201404-201406.pdf
U.S. Department of Energy (DOE), 2012. Applications of Automated Controls for Voltage and reactive Power Management -
Initial Results, Available at: https://www.smartgrid.gov/files/VVO_Report_-_Final.pdf
United Nations Environment Programme (UNEP) and World Tourism Organization (UNWTO), 2012. Tourism in the Green
Economy - Background Report, Available at: http://www.unep.org/greeneconomy/Portals/88/documents/ger/ger_final_dec_2011/Tourism in the green_economy unwto_unep.pdf
University of Strathclyde, 2015. Hybrid Energy Systems in Future Low Carbon Buildings. CHP - Background Information. Available at: http://www.esru.strath.ac.uk/EandE/Web_sites/09-10/Hybrid_systems/CHP-background.htm
US Department of Transportation Federal Highways Administration (FHWA), 2011. Summary of Travel Trends - 2009
National Household Travel Survey, Available at: http://nhts.ornl.gov/2009/pub/stt.pdf

122Mobile Carbon Impact
Vasili, A., 2015. How much electricity does the average solar panel system generate? Available at: http://www.theecoexperts.co.uk/how-much-electricity-does-average-solar-panel-system-generate
Vendon, 2015. Vending management telemetry solutions. Available at: http://www.vendon.net/
Vodafone, 2012a. ASB Bank Case Study. ASB Bank cuts energy costs with a Vodafone M2M smart metering solution, Available at: http://www.vodafone.com/business/m2m/case-study/asb-bank-cuts-energy-costs-with-a-vodafone-m2m-smart-metering-solution
Vodafone, 2012b. Mic-O-Data Case Study. Vodafone and Mic-O-Data help local councils to reduce costs and encourage
sustainability with Smart Waste Management, Available at: https://m2m.vodafone.com/insight_news/case-study/mic-o-data.jsp
Vodafone Netherlands, 2015. Environmental Profit and Loss - Methodology and Results, Available at: https://www.vodafone.nl/_assets/downloads/algemeen/environmental_profit_and_loss_account_2014_2015.pdf
Wang, W. et al., 2013. Energy savings and economics of advanced control strategies for packaged air conditioners with gas heat. Energy and Buildings, 65, pp.497–507. Available at: http://dx.doi.org/10.1016/j.enbuild.2013.06.033.
Wilson, L., 2013. Shades of Green. Electric Cars’ Carbon Emissions Around the Globe, Available at: http://shrinkthatfootprint.com/wp-content/uploads/2013/02/Shades-of-Green-Full-Report.pdf
Yankee Group Research Inc. and the American Council for an Energy-Efficient Economy (ACEEE), 2012. Measuring the
Energy Reduction Impact of Selected Broadband-Enabled Activities Within Households, Available at: http://gesi.org/article/39
Zipcar, 2014. Car Lite London, how car clubs will help more Londoners drive less. Available at: http://www.zipcar.co.uk/car-lite-london

123Mobile Carbon Impact
Appendix 5: Findings from consumer research
In April 2015 the Carbon Trust commissioned Future Thinking to carry out research into the ownership and use of smartphones in the UK, USA, Spain, Mexico and South Korea. The research explored smartphone use, smart working and smart travel.
Selected data from the research are presented in the tables below, preceded by the question asked within the survey in English. Korean translation was used in South Korea and local Spanish translations were used in Spain and Mexico.
Device ownership
This question is about smartphones, such as Android, Apple, Blackberry or Windows phones which have smart capabilities including:• Accessing the internet• Apps you download• A camera function• GPS location functions• Any other function that your device can do in addition to being a phone.
Which of the following best applies to you?
Total UK USA Spain South Korea Mexico
Total 4000 800 800 800 800 800
Ihaveaccesstoasmartphoneandmakeuseofitssmartcapabilities 3669 674 736 742 765 752
Ihaveaccesstoasmartphonebutdonotmakeuseofitssmartcapabilities 277 115 54 55 18 35
Idonothaveaccesstoasmartphonenowbutintendtogetoneinthenearfuture 54 11 11 3 17 13
Doyouhaveaccesstoatouch-screentabletcomputer?
Total UK USA Spain South Korea Mexico
Total 4000 800 800 800 800 800
Yes 2500 510 452 547 355 635
No 1500 290 348 253 445 165

124Mobile Carbon Impact
Driving and smart devices
Doyoudriveavehicle?
Total UK USA Spain South Korea Mexico
Total 4000 800 800 800 800 800
Yes 3220 541 754 692 568 664
No 780 259 46 108 232 136
Doyouuseasatnavforplanningroutes,followingroutes,andavoidingtrafficcongestiononamobiledevicesuchasasmartphone?
Total UK USA Spain South Korea Mexico
Total 3220 544 755 692 564 665
Allofthetime 882 81 160 167 260 214
Someofthetime 1330 185 291 308 244 302
Rarely 481 101 146 103 39 91
Never 527 175 156 114 25 57
Doyouuseasatnavforplanningroutes,followingroutes,andavoidingtrafficcongestiononafixedsatnavinyourvehicle?
Total UK USA Spain South Korea Mexico
Total 3220 544 755 692 564 665
Allofthetime 610 73 71 84 319 63
Someofthetime 803 168 153 193 154 134
Rarely 400 72 127 70 33 97
Never 1407 228 402 345 62 371

125Mobile Carbon Impact
Onaverage,howmanytripsperweekdoyouuseasatnav?
Total UK USA Spain South Korea Mexico
Total 2898 459 651 614 561 611
lessthanoneaweek 1332 303 386 365 97 181
1-2journeysperweek 793 83 151 165 166 228
3-4 435 43 63 52 154 122
5-6 166 20 28 19 59 41
7-8 64 4 9 7 25 18
9-10 29 1 5 3 15 6
Over10journeysaweek 79 5 8 5 46 15
Wouldyoubewillingtohaveadevicefittedtoyourvehiclewhichrecordsthewayyoudrive,ifdrivinginasaferandmoreenvironmentally-friendlywayreducedyourcarinsurance?
Total UK USA Spain South Korea Mexico
Total 3220 541 754 692 568 664
Yes,Ialreadyuseone 270 37 67 46 61 58
Yes,Iwouldconsiderit 1762 229 274 388 370 501
Maybe 702 141 190 173 117 82
No 398 114 195 58 13 17
Don’tknow 89 20 28 27 7 7

126Mobile Carbon Impact
Self-drivingcarsarebeingdeveloped.Thesehigh-techvehicleswouldknowtheirsurroundingsandthepositionofothercarsandwouldeffectivelydrivethemselves.Iftheywerefullydevelopedandlegal,wouldyouconsiderusingaself-drivingcar?
Total UK USA Spain South Korea Mexico
Total 3220 541 754 692 568 664
Yes,Iwouldconsider 1301 134 225 263 246 433
Maybe 1264 200 282 306 276 200
No 481 162 192 85 25 16
Don’tknow 174 45 55 38 22 14
Public transport
Insomeregions,youcanuseamobiledeviceand/oranappwhenusingpublictransport(e.g.bus,train)tofindoutpreciselywhenthenextservicearrives.Isthissomethingyouhaveeverused?
Total UK USA Spain South Korea Mexico
Total 4000 800 800 800 800 800
Yes 1907 318 206 396 679 308
No 2093 482 594 404 121 492
Doyouusepublictransportmoreoftenasaresultofthisinformationbeingavailableonyourmobiledevice?
Total UK USA Spain South Korea Mexico
Total 1907 318 206 396 679 308
Muchmoreoften 477 47 47 71 241 71
Slightlymoreoften 688 92 63 118 273 143
Makesnodifference 704 174 93 195 161 82
Don’tknow 38 5 3 13 5 12

127Mobile Carbon Impact
Wouldyoubemorelikelytousepublictransport(e.g.bus,train)ifbyusingyourmobiledeviceand/oranappyoucouldfindoutpreciselywhenthenextservicewouldarrive?
Total UK USA Spain South Korea Mexico
Total 2093 482 594 404 121 492
Muchmorelikelytousepublictransportmoreoften 408 33 51 71 20 233
Slightlymorelikelytousepublictransportmoreoften 614 121 103 163 48 179
Unlikelytousepublictransportmoreoften 585 204 185 112 26 58
Woulddefinitelynotusepublictransportmoreoften 260 60 157 24 9 9
Don’tknow 226 64 97 34 18 14
Reducing travel emissions
Areyou,orwouldyoubewillinginfuture,touseyourmobiledevicetomakeorinfluencetravelplans(e.g.mappingroutes,checkingtraffic,checkingpublictransporttimes)?
Total UK USA Spain South Korea Mexico
Total 4000 800 800 800 800 800
Ialreadydothisfrequently 1026 160 172 171 307 215
Ialreadydothissometimes 1396 266 269 311 276 275
Iwouldbewillingtodothisfrequently 556 90 106 111 103 146
Iwouldbewillingtodothissometimes 796 203 181 169 96 147
Iwouldnotbewillingtodothis 226 81 72 39 18 17

128Mobile Carbon Impact
Areyou,orwouldyoubewillinginfuture,touseyourmobiledevicetofindsomeonetoshareacarjourneywith?
Total UK USA Spain South Korea Mexico
Total 4000 800 800 800 800 800
Ialreadydothisfrequently 199 31 34 39 36 60
Ialreadydothissometimes 407 61 73 85 58 130
Iwouldbewillingtodothisfrequently 650 82 89 133 122 224
Iwouldbewillingtodothissometimes 1023 152 151 261 232 227
Iwouldnotbewillingtodothis 1722 474 454 282 352 160
Areyou,orwouldyoubewillinginfuture,toreplaceavisittothebankbyusingamobiledevice?
Total UK USA Spain South Korea Mexico
Total 4000 800 800 800 800 800
Ialreadydothisfrequently 1171 178 184 211 348 250
Ialreadydothissometimes 889 147 158 211 176 196
Iwouldbewillingtodothisfrequently 712 116 117 138 146 195
Iwouldbewillingtodothissometimes 611 140 141 137 83 111
Iwouldnotbewillingtodothis 617 219 200 102 47 49
Areyou,orwouldyoubewillinginfuture,toreplaceavisittotheshopsbyusingamobiledevice?
Total UK USA Spain South Korea Mexico
Total 4000 800 800 800 800 800
Ialreadydothisfrequently 651 103 105 119 209 115
Ialreadydothissometimes 980 160 170 186 259 204
Iwouldbewillingtodothisfrequently 777 120 123 159 160 216
Iwouldbewillingtodothissometimes 921 194 221 197 124 186
Iwouldnotbewillingtodothis 671 223 180 139 48 80

129Mobile Carbon Impact
Areyou,orwouldyoubewillinginfuture,toreplaceavisittofriendsorfamilybymakingavideocallusingamobiledevice?
Total UK USA Spain South Korea Mexico
Total 4000 800 800 800 800 800
Ialreadydothisfrequently 374 35 63 78 97 102
Ialreadydothissometimes 715 112 123 123 196 161
Iwouldbewillingtodothisfrequently 604 101 109 104 169 122
Iwouldbewillingtodothissometimes 1066 208 221 200 232 205
Iwouldnotbewillingtodothis 1241 344 285 296 106 210
Remote working
Doyouuseamobiledeviceaspartofyourwork/studies?
Total UK USA Spain South Korea Mexico
Total 2946 540 566 538 610 692
Yes 1993 245 275 354 505 616
No 952 295 292 184 105 76
Couldyoudoyourjob/studieswithoutyourmobiledevice?
Total UK USA Spain South Korea Mexico
Total 1993 245 275 354 505 616
Yes 1233 181 204 217 270 362
No 760 64 70 137 235 254
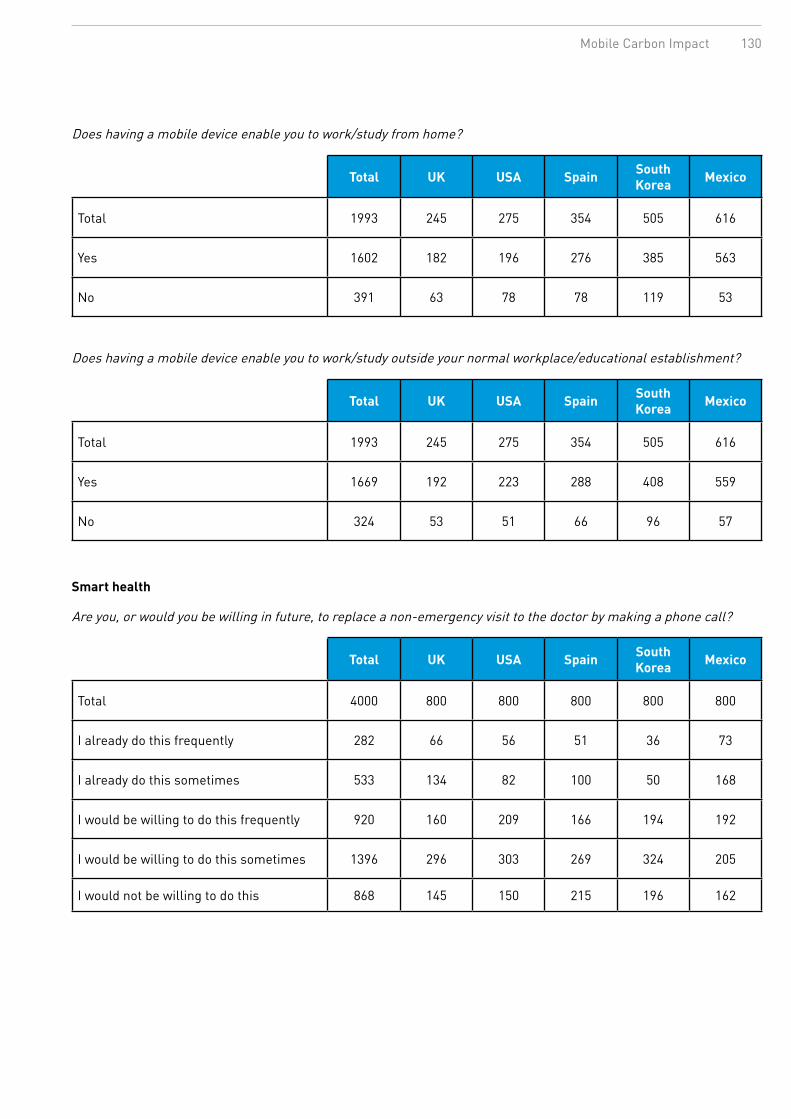
130Mobile Carbon Impact
Doeshavingamobiledeviceenableyoutowork/studyfromhome?
Total UK USA Spain South Korea Mexico
Total 1993 245 275 354 505 616
Yes 1602 182 196 276 385 563
No 391 63 78 78 119 53
Doeshavingamobiledeviceenableyoutowork/studyoutsideyournormalworkplace/educationalestablishment?
Total UK USA Spain South Korea Mexico
Total 1993 245 275 354 505 616
Yes 1669 192 223 288 408 559
No 324 53 51 66 96 57
Smart health
Areyou,orwouldyoubewillinginfuture,toreplaceanon-emergencyvisittothedoctorbymakingaphonecall?
Total UK USA Spain South Korea Mexico
Total 4000 800 800 800 800 800
Ialreadydothisfrequently 282 66 56 51 36 73
Ialreadydothissometimes 533 134 82 100 50 168
Iwouldbewillingtodothisfrequently 920 160 209 166 194 192
Iwouldbewillingtodothissometimes 1396 296 303 269 324 205
Iwouldnotbewillingtodothis 868 145 150 215 196 162

131Mobile Carbon Impact
Areyou,orwouldyoubewillinginfuture,toreplaceanon-emergencyvisittothedoctorbymakingavideocall?
Total UK USA Spain South Korea Mexico
Total 4000 800 800 800 800 800
Ialreadydothisfrequently 129 21 34 20 23 31
Ialreadydothissometimes 281 50 48 46 50 88
Iwouldbewillingtodothisfrequently 1041 151 196 206 218 270
Iwouldbewillingtodothissometimes 1470 283 304 301 311 272
Iwouldnotbewillingtodothis 1079 296 219 228 198 139
Areyou,orwouldyoubewillinginfuture,touseamobiledevicetoseekhealthadvice?
Total UK USA Spain South Korea Mexico
Total 4000 800 800 800 800 800
Ialreadydothisfrequently 253 38 54 30 32 99
Ialreadydothissometimes 680 159 153 109 83 176
Iwouldbewillingtodothisfrequently 1136 172 197 233 289 244
Iwouldbewillingtodothissometimes 1274 282 258 251 276 206
Iwouldnotbewillingtodothis 657 149 138 176 120 74
Areyou,orwouldyoubewillinginfuture,touseamobiledevicetomonitoryourfitnessandhealth?
Total UK USA Spain South Korea Mexico
Total 4000 800 800 800 800 800
Ialreadydothisfrequently 284 42 73 36 41 92
Ialreadydothissometimes 626 120 133 102 116 155
Iwouldbewillingtodothisfrequently 1304 205 213 283 309 294
Iwouldbewillingtodothissometimes 1194 266 251 250 245 182
Iwouldnotbewillingtodothis 592 167 130 129 89 77

132Mobile Carbon Impact
Multifunctional devices
Doyoucurrentlyuseanyofthefollowingfunctionsonamobiledevice(smartphone/mobile)?Chooseallthatapply.
Total UK USA Spain South Korea Mexico
Total 4000 800 800 800 800 800
AlarmClock 3244 610 579 662 679 714
Musicplayer 2952 458 476 566 715 737
Videoplayer 2580 351 363 563 624 678
Satnav 2515 368 416 545 576 610
Camera 3638 697 701 740 746 753
Noneofthese 103 40 43 13 6 2
Areyou,orwouldyoubewillinginfuture,toreplacetheuseofotherdeviceswithasmartphone(e.g.camera,alarmclock,musicplayer,satnav)?
Total UK USA Spain South Korea Mexico
Total 4000 800 800 800 800 800
Ialreadydothisfrequently 1892 259 278 361 513 481
Ialreadydothissometimes 937 207 220 200 164 145
Iwouldbewillingtodothisfrequently 451 84 86 106 85 89
Iwouldbewillingtodothissometimes 477 163 145 87 26 55
Iwouldnotbewillingtodothis 242 87 71 45 11 29

133Mobile Carbon Impact
Areyou,orwouldyoubewillinginfuture,touseamobiledevicetoreplacethepurchaseofphysicalproductswithdigitalproducts(e.g.newspapers,books,music)?
Total UK USA Spain South Korea Mexico
Total 4000 800 800 800 800 800
Ialreadydothisfrequently 795 130 128 109 275 153
Ialreadydothissometimes 1176 193 217 212 259 295
Iwouldbewillingtodothisfrequently 690 108 128 159 133 162
Iwouldbewillingtodothissometimes 813 175 201 204 101 131
Iwouldnotbewillingtodothis 526 194 125 117 32 59
Areyou,orwouldyoubewillinginfuture,touseamobiledevicetocontrolyourelectricalappliancesandheating/coolingathome?
Total UK USA Spain South Korea Mexico
Total 4000 800 800 800 800 800
Ialreadydothisfrequently 209 38 49 28 39 55
Ialreadydothissometimes 365 52 78 52 90 93
Iwouldbewillingtodothisfrequently 1491 251 221 344 313 362
Iwouldbewillingtodothissometimes 1229 237 268 256 261 207
Iwouldnotbewillingtodothis 706 222 185 120 97 83

134Mobile Carbon Impact
Areyou,orwouldyoubewillinginfuture,touseamobiledeviceforpaymentstoreplaceyourcredit/debitcardorcashuse?
Total UK USA Spain South Korea Mexico
Total 4000 800 800 800 800 800
Ialreadydothisfrequently 495 52 71 37 232 103
Ialreadydothissometimes 661 81 122 66 231 161
Iwouldbewillingtodothisfrequently 1036 163 141 297 159 276
Iwouldbewillingtodothissometimes 915 216 188 235 109 167
Iwouldnotbewillingtodothis 893 288 278 165 68 94
Areyou,orwouldyoubewillinginfuture,touseamobiledevicetoreplacetheuseofticketsfortravelorevents?
Total UK USA Spain South Korea Mexico
Total 4000 800 800 800 800 800
Ialreadydothisfrequently 372 41 67 55 143 67
Ialreadydothissometimes 757 124 144 124 245 120
Iwouldbewillingtodothisfrequently 1200 210 170 303 209 309
Iwouldbewillingtodothissometimes 1092 237 262 220 158 215
Iwouldnotbewillingtodothis 580 188 158 99 46 89

135Mobile Carbon Impact
Sharing economy
Areyou,orwouldyoubewillinginfuture,touseamobiledevicetosell,rent,shareitemsthatyouown?
Total UK USA Spain South Korea Mexico
Total 4000 800 800 800 800 800
Ialreadydothisfrequently 409 71 78 66 70 124
Ialreadydothissometimes 707 125 113 131 146 191
Iwouldbewillingtodothisfrequently 843 118 128 211 166 220
Iwouldbewillingtodothissometimes 1157 217 247 244 262 187
Iwouldnotbewillingtodothis 884 269 234 148 155 77
Areyou,orwouldyoubewillinginfuture,touseamobiledevicetobuyorrentitemsfromothers?
Total UK USA Spain South Korea Mexico
Total 4000 800 800 800 800 800
Ialreadydothisfrequently 374 64 63 48 87 112
Ialreadydothissometimes 706 128 106 146 152 174
Iwouldbewillingtodothisfrequently 882 119 136 206 179 242
Iwouldbewillingtodothissometimes 1149 210 245 246 260 189
Iwouldnotbewillingtodothis 888 279 249 154 122 84

136Mobile Carbon Impact
Areyou,orwouldyoubewillinginfuture,touseamobiledevicetofindandbookaccommodationinsomeone’shomeinsteadofusingahotel?
Total UK USA Spain South Korea Mexico
Total 4000 800 800 800 800 800
Ialreadydothisfrequently 339 41 58 56 78 105
Ialreadydothissometimes 662 88 75 168 143 188
Iwouldbewillingtodothisfrequently 919 130 137 197 217 238
Iwouldbewillingtodothissometimes 1024 152 186 253 244 187
Iwouldnotbewillingtodothis 1056 388 343 125 118 82
Areyou,orwouldyoubewillinginfuture,touseamobiledevicetoaccesspublicservices(e.g.voting,obtainingparkingpermits,payingfines,renewingdrivinglicense)?
Total UK USA Spain South Korea Mexico
Total 4000 800 800 800 800 800
Ialreadydothisfrequently 281 50 46 47 68 68
Ialreadydothissometimes 586 117 88 103 149 129
Iwouldbewillingtodothisfrequently 1442 197 243 318 343 341
Iwouldbewillingtodothissometimes 1094 244 255 220 195 180
Iwouldnotbewillingtodothis 598 193 168 112 45 81

137Mobile Carbon Impact
Appendix 6: Rebound effects
Rebound effects relate to additional emissions caused indirectly by (or as a result of) the same mechanism that is causing the savings. Ideally these rebound effects should be quantified and deducted from the savings.
Rebound effects fall into different categories. There are those where additional activities resulting from the mechanism produce additional emissions. Examples of these for home working are additional emissions from heating the home, and emissions due to additional car journeys from errands such as lunch time trips or school runs.
There are those where the use of the ICT solution increases because of its ease-of-use, convenience or low cost, so that its use is greater than the business as usual case without the ICT solution (and therefore the emissions of the ICT solution increase). This is the so-called Jevons paradox. Examples include mobile phone app based solutions, where the convenience encourages greater use.
There is also the indirect rebound effect of re-allocating resources that have been saved. An example of this is where a household saves money through energy saving measures, and then spends that money on additional holidays incurring extra carbon emissions from flying.
In practice, it is difficult to comprehensively identify rebound effects, and even more difficult to quantify them. Thus, except for home working, the rebound effects have not been included. Home working carbon abatement is a result of reducing the travel from commuting. Immediate rebound effects are additional energy consumption at home, and additional trips for personal errands such as trips to the shops at lunch time and picking up the kids from school. There is also the positive rebound effect of reduced office energy consumption, although this relies on a significant proportion of a company’s workforce working from home, and thus allowing for smaller offices or otherwise reduced energy consumption. Home working is unusual in that the carbon benefits have been studied for some time, and the immediate rebound effects are identifiable and quantifiable.
An example of where rebound effects could have an adverse effect is parking space monitoring, where smart sensors provide information on available parking spaces and feed this information to drivers, who then save time and fuel in driving around looking for available parking. However, if it is then easier to find parking spaces this can then encourage more people to drive into cities, when they would otherwise have used public transport. More generally, there may be a number of indirect rebound effects on carbon emissions from effective connected cities. For example, if driving becomes easier and more efficient, this may perversely result in more vehicles on the roads.
Another example is keeping in touch remotely with family and friends using voice and video calls to reduce the number of physical visits. However, there is also the potential that in some cases regular video calls might encourage people to undertake visits, which they otherwise would not have.
Mobile shopping reduces travel to shops, however there are the rebound effects of increased emissions due to delivery, and also the possibility that the convenience of mobile shopping encourages an overall increase in shopping activity. There is also the potential for reduced retail space with consequent reduction in energy consumption.
These cases highlight the need to have better data on actual behaviour to quantify actual reductions in amount of travel. In the analysis for this report assumptions were based on what people said that they did from the consumer survey, which is not always the same as what they actually did.

138Mobile Carbon Impact
Glossary
Carbon dioxideA greenhouse gas with a Global Warming Potential of 1.
Carbon abatementThe measurement of the avoided carbon emissions due to the enablement effect. Usually expressed in kgCO2e.
Carbon emissions (CO2e)Within the context of this report carbon emissions is used as a shorthand way refer to a volume of greenhouse gas emissions, including other greenhouse gases than just carbon dioxide, but which can be expressed as carbon dioxide equivalent.
Enablement effectAny mechanism by which carbon emissions can be avoided thanks to the use of technology.
EuropeThe definition of Europe used in the report includes all countries in Europe, including Russia and the Caucasus republics, Turkey, Greenland and Iceland.
Fixed broadbandFixed broadband provides high speed internet connectivity over physical cables (either copper or fibre or a combination of the two).
GPSGlobal Positioning System using satellites for navigation purposes.
GWPGlobal Warming Potential, a measurement used by the Intergovernmental Panel on Climate Change to compare the relative impacts of different greenhouse gases.
HVACHeating, ventilation and air conditioning.
HVGHeavy goods vehicle.
ICTInformation and communications technology.
ITUInternational Telecommunications Union.
LGVLight goods vehicle.
LPWANLow Power Wide Area network – this includes a range of emerging technologies such as Weightless and Sigfox, that are designed for machine-to-machine (M2M) applications that have low data rates, long battery lives and that operate unattended for long periods of time.

139Mobile Carbon Impact
M2MMachine-to-machine.
MANMetropolitan area network is a computer network that covers part of a city or a complete city. It comprises a range of medium-range technologies including powerline and community Wi-Fi.
MethaneA greenhouse gas with a Global Warming Potential 30 times greater than carbon dioxide.
MobileMobile is used in the report to refer to a variety of mobile communications technologies that allow for the transfer of information without fixed lines. These include:•mobile phone networks;•public Wi-Fi networks;•metropolitan area networks;•Low Power Wide Area networks (LPWAN); and•satellite networks.
Mobile broadbandMobile broadband uses the mobile phone network to provide high speed internet connectivity with 3G and 4G services.
Nitrous oxideA greenhouse gas with a Global Warming Potential 265 times greater than carbon dioxide.
Rebound effectRebound effects relate to additional carbon emissions caused indirectly by (or as a result of) the same mechanism that is causing the carbon savings.
Satellite networksTwo-way connectivity between a ground-based device and a satellite providing high speed internet connection. Typically used only for niche applications and/or in remote parts of the world.
SatnavSatellite navigation systems, which can be integrated within a vehicle, accessed through standalone devices or included as an app on smartphones.
Solar PVSolar photovoltaic panels that generate renewable energy from sunlight.
Smart gridA smart grid is an energy distribution system which includes a variety of operational and energy measures including smart meters, smart appliances, renewable energy resources, and energy efficiency resources.
V2VVehicle-to-vehicle.
Wi-FiLocal area wireless networking technology using radio waves to provide high speed network connections based on the Institute of Electrical and Electronics Engineers’ (IEEE) 802.11 standards.

Whilst reasonable steps have been taken to ensure that the information contained within this publication is correct, the authors, the Carbon Trust, its agents, contractors and sub-contractors give no warranty and make no representation as to its accuracy and accept no liability for any errors or omissions. Any trademarks, service marks or logos used in this publication, and copyright in it, are the property of the Carbon Trust. Nothing in this publication shall be construed as granting any licence or right to use or reproduce any of the trademarks, service marks, logos, copyright or any proprietary information in any way without the Carbon Trust’s prior written permission. The Carbon Trust enforces infringements of its intellectual property rights to the full extent permitted by law.
The Carbon Trust is a company limited by guarantee and registered in England and Wales under company number 4190230 with its registered office at 4th Floor, Dorset House, Stamford Street, London SE1 9NT.
Published in the UK: December 2015
© The Carbon Trust 2015. All rights reserved. CTC856
The Carbon Trust is an independent company with a mission to accelerate the move to a sustainable, low carbon economy.
The Carbon Trust:
• Advises businesses, governments and the public sector on opportunities in a sustainable, low carbon world.
• Measures and certifies the environmental footprint of organisations, products and services.
• Helps develop and deploy low carbon technologies and solutions, from energy efficiency to renewable power.
www.carbontrust.com +44 (0)20 7170 7000