germany’s nuclear power plant closures and the integration of electricity markets ... ·...
TRANSCRIPT

Germany’s Nuclear Power Plant Closures and the Integration of
Electricity Markets in Europe
Lilian M. de Menezes, Cass Business School1, City University London
Melanie A. Houllier, Cass Business School, City University London
1 Corresponding Author: Lilian M. de Menezes Cass Business School, City University London 106 Bunhill Row London EC1Y 8TZ, UK

2
ABSTRACT
This paper examines the potential implications of national policies that lead to a sudden
increase of wind power in the electricity mix for interconnected European electricity markets.
More specifically, it examines market integration before and after the closures of eight
nuclear power plants that occurred within a period of a few months in Germany during 2011.
The short- and- long run interrelationships of daily electricity spot prices, from November
2009 to October 2012, in: APX-ENDEX, BELPEX, EPEX-DE, EPEX-FR, NORDPOOL,
OMEL and SWISSIX; and wind power in the German system are analysed. Two MGARCH
(Multivariate Generalized Autoregressive Conditional Heteroscedasticity) models with
dynamic correlations are used to assess spot market behaviour in the short run, and a
fractional cointegration analysis is conducted to investigate changes in the long-run behaviour
of electricity spot prices. Results show: positive time-varying correlations between spot prices
in markets with substantial shared interconnector capacity; a negative association between
wind power penetration in Germany and electricity spot prices in the German and
neighbouring markets; and, for most markets, a decreasing speed in mean reversion.
Keywords: electricity market integration, energy transition, fractional integration, time-
varying correlations, volatility transmission

3
1. Introduction
Common goals in European energy policy are security of supply, affordability and climate
change. An integrated electricity market is seen as a means to address these objectives.
Nonetheless, national policies that affect wholesale prices in one electricity market can impact
the process of integration. The present study investigates short- and- long run associations of
electricity day-ahead prices and wind power penetration in German market, which is the
largest and most liquid in Europe, with other European markets, by comparing the periods of
one year before and after the closures of eight nuclear plants that followed the 13th Gesetz zur
Änderung des Atomgesetz (Nuclear Phase-Out Act).
A consensus on European energy policy could promote cleaner energy mixes, optimise
complementarities, lead to dynamic pricing and align grid investment strategies (Boeckers et
al., 2013; Hooper and Medvedev, 2009). Yet, in 2011, a unilateral course was taken in
Germany that potentially altered wholesale electricity prices beyond its borders. As hinted by
Germany’s Environment Minister a year after, unintended consequences were possible: ‘It
was not possible to discuss the consequences of such a decision with Germany's neighbours.
Now is the time for that.’ (Peter Altmaier, European Energy Review, 2012). Indeed, Germany
is Europe’s largest economy and is committed to reduce emissions between 80 to 95% below
the level in 1990 by 2050, of which 21% has since been achieved (Committee on Climate
Change, 2013). Its energy transition, Energiewende, has led to considerable growth in
intermittent renewable energy sources (RES-E), and wind power capacity increased from
183MWh in 1992 to 31.308MWh in 2012, so that Germany had a third of the installed EU
wind power capacity in 2012 (EWEA, 2012). Consequently, with the closure of eight nuclear
plants in a short period, the German electricity mix changed significantly; the share of other
4
technologies increased, most noticeably wind power, as will be highlighted in the next
section.
The possibility of unintended consequences from isolated national energy policies that alter
the electricity mix in interconnected electricity markets motivates this study. In the next
section, the contextual background is described in greater detail. Section three reviews the
literature on the implications of growing RES-E for electricity price behaviour, price volatility
transmission and market integration. Section four sets the hypotheses to be tested. Section
four describes the methodology and data. The results are reported in section five. Section six
discusses the main findings, and section seven concludes the paper.
2. Germany’s electricity mix and trade flows following the Nuclear Phase Out
The decommissioning of eight nuclear power plants in Germany as a response to the events in
Fukushima led to a 23% reduction in gross electricity generation capacity from nuclear (Öko
Institut, 2013). Given an increase in the share of intermittent RES-E in the German electric
system, secure capacity, which is the capacity that is available 99% of the time, decreased.
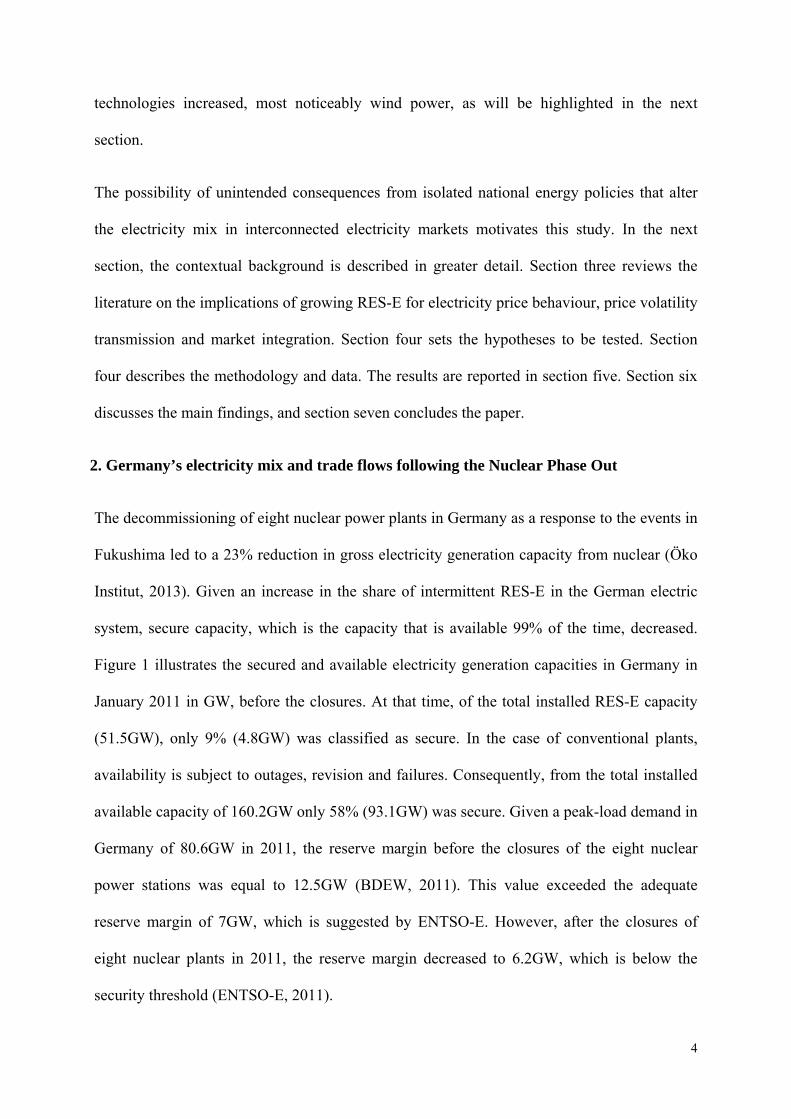
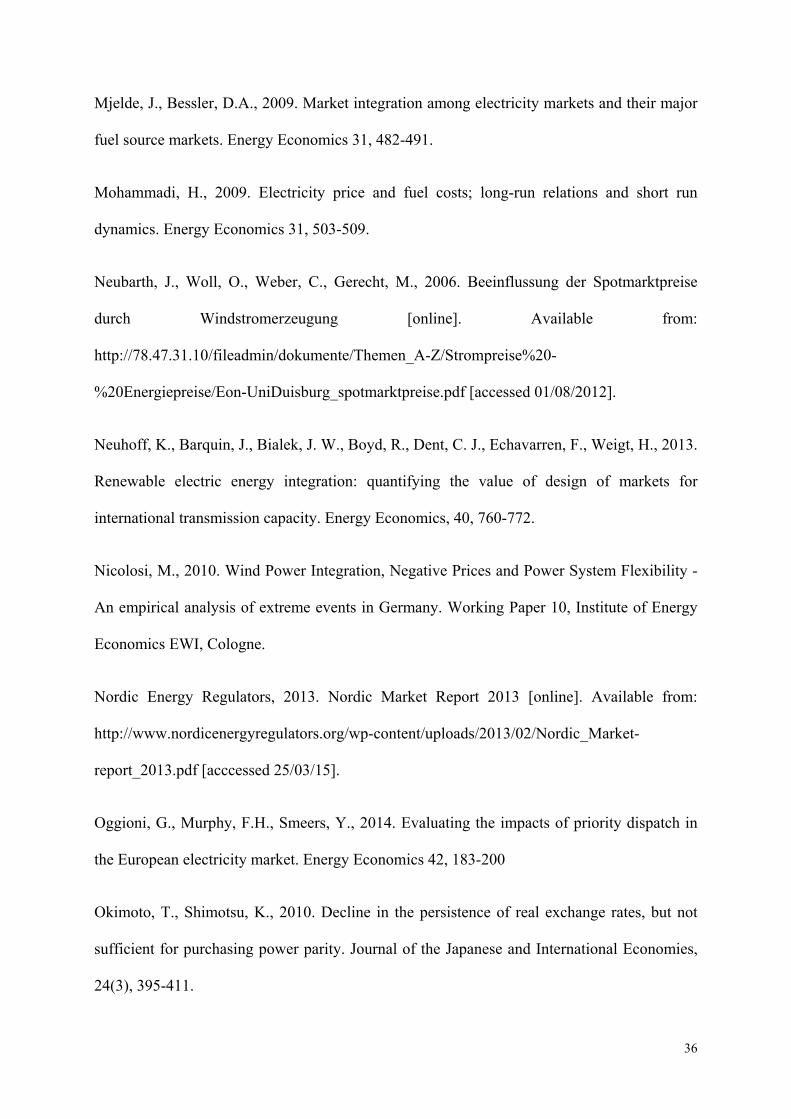
Figure 1 illustrates the secured and available electricity generation capacities in Germany in
January 2011 in GW, before the closures. At that time, of the total installed RES-E capacity
(51.5GW), only 9% (4.8GW) was classified as secure. In the case of conventional plants,
availability is subject to outages, revision and failures. Consequently, from the total installed
available capacity of 160.2GW only 58% (93.1GW) was secure. Given a peak-load demand in
Germany of 80.6GW in 2011, the reserve margin before the closures of the eight nuclear
power stations was equal to 12.5GW (BDEW, 2011). This value exceeded the adequate
reserve margin of 7GW, which is suggested by ENTSO-E. However, after the closures of
eight nuclear plants in 2011, the reserve margin decreased to 6.2GW, which is below the
security threshold (ENTSO-E, 2011).
5
-Figure 1 here-
Until August 2011, Germany had been a net exporter of electricity with stable commercial
flows. Exports were generally to the Benelux countries, which have a high proportion of
variable peak electricity sources, such as coal- and gas-fired plants. Germany imported
electricity from France, mostly produced by nuclear plants, and the Czech Republic, which in
2010 had high proportions of fossil fuel-based (54.8% or 47.1TWh) and nuclear (32.6% or
28TWh) generation (European Commission, 2012). Electricity flows with Denmark, Sweden
and Poland depended on the availability of wind power (BDEW, 2011).
After August 2011, with lower reserve margins, trade patterns changed. In the six weeks that
followed the announcement and the reduction of total net capacity by 6.305MW, Germany
became a net-importer of electricity (BDEW, 2011). However, the decommissioning of the
nuclear power capacities in Germany coincided with the seasonal shift in its electricity trade
with neighbouring markets: electricity was traditionally exported in the winter and imported
during the summer, when there is greater availability of hydro and lower demand for nuclear
in neighbouring markets (Öko Institut, 2013). Nevertheless, when considering a longer period
(one year before and one year after 6th of August 2011), Germany remained a net exporter.
Overall imports rose by 894GWh, while the increase in net exports was 5103GWh (ENTSO-
E, 2014). Trade flows actually increased, and the expectation of greater imports was not
confirmed. The reduction in electricity generation from nuclear was offset in the annual
balance by two thirds, through increased generation from RES-E (+20.2TWh) (Öko Institut,
2013). In addition, when comparing statistics of newly commissioned wind turbines in the
years 2009/2010 to 2011/2012, a 30% increase in capacity is observed (BWE, 2014). In short,
favourable weather conditions and strong investments in wind farms further increased the
share of electricity generated by RES-E in Germany.

6
3. RES-E and Electricity Market Integration in Europe
Several studies have addressed growing RES-E integration (e.g. Gross et al., 2006; Henriot
and Glachant, 2013; Holttinen et al., 2009; Smith et al., 2007), but they mainly highlighted the
need for secure reserve capacity due to the intermittent nature of wind power. Some authors
(e.g., Bode and Groscurth, 2006; Gil et al., 2012; Jacobsen and Zvingilaite, 2010; Neubarth et
al., 2006; Nicolosi, 2010; Ray et al., 2010; Saenz de Miera et al., 2008; Sensfuß et al., 2008),
however, observed that increasing wind power penetration is negatively correlated with
electricity spot prices. In high-wind scenarios, given the merit order of dispatch, more
expensive generators have very low load factors (Claudius et al., 2014; Forrest and MacGill;
2013, Sensfuß et al., 2008; Woo et al., 2011, Würzburg et al., 2013), and therefore electricity
wholesale prices are expected to drop. However, a side-effect of intermittent RES-E on
wholesale markets is an increase in day-ahead and intra-day price volatility, since the merit-
order curve, which in most cases should determine price, can change significantly between
high- and- low wind scenarios. Price risk, to which generators and suppliers are exposed in
liberalised markets, increases due to the limited storability of electricity, which implies
instantaneous balance of supply and demand, and the high variability of wind power
(Paraschiv et al., 2014). Not surprisingly, Traber and Kemfert (2011), when investigating the
German market, found that the incentive to invest decreased for all technologies with the
development of wind generation. Consequently, with high wind power penetration levels,
concerns over security of supply call for incentives in flexible generation. However, as
Spiecker and Weber (2013) argued, the need for more flexible generation capacity can be
reduced by grid extensions and market coupling. Still, studies (e.g. Neuhoff et al. 2013;
Oggioni et al. 2014) that investigated wind power integration policies suggest that priority
dispatch, as in Germany, can hinder market integration. As a whole, the literature suggests
that increasing intermittent RES-E penetration can lead to higher spot price volatility at least

7
in the local market, and this expectation should be considered when investigating integrated
markets.
To date, multi-market empirical studies appear to have neglected the possible effects of RES-
E generated electricity in interconnected regions. Considering the Australian electricity spot
markets, Worthington et al. (2005) showed no price spillover across markets, but significant
volatility transmission in nearly all markets. Higgs (2009) observed that the less direct the
interconnection between markets, the lower the volatility spillover between them. By contrast,
when Zareipour et al. (2007) compared different volatility indices in four interconnected
North American electricity markets (Ontario, New England, New York, and PJM), they
observed that volatility increased in the direction of well-connected, less mature or smaller
markets.
Considering European electricity markets, which are the subject of the present study,
Solibakke (2008) investigated volatility transmission between the daily German electricity
price index Phelix and spot prices from Nord Pool between 2000 and 2006, and found strong
cross-market correlations that lasted for up to three days. Similarly, Le Pen and Sévi (2010)
observed returns and volatility spillover effects in the German, Dutch and British forward
electricity markets. Bunn and Gianfreda (2010), however, analysed volatility interactions
between five European spot and forward markets (British, Dutch, French, German, Spanish),
and concluded that volatility transmission decreased with proximity to the maturity of the
contracts. Overall these studies highlight that price volatility can spread across interconnected
electricity markets. Consequently, long-run electricity price dynamics may also become more
volatile and impact the convergence to the single market, which following EU directives
should be completed by 2015.
A growing body of literature has been focusing on evaluating electricity market convergence
in Europe. Most studies adopt the Law of One Price (Fetter, 1924) as the core theoretical

8
foundation for common long-run dynamics. The set of markets, periods examined and the
status-quo of market integration that is inferred vary significantly between studies. Some
authors concluded that electricity wholesale prices are converging (e.g. Armstrong and Galli,
2005; Bunn and Gianfreda, 2010; Kalantzis and Milonas, 2010; Robinson 2008), but that
convergence may be stronger in periods of peak demand (support Armstrong and Galli’s,
2005) or in directly well-connected markets (Bunn and Gianfreda, 2010). By contrast, recent
assessments (e.g. de Menezes and Houllier, 2014; Pellini, 2012, Pinho and Madaleno, 2011)
suggest less convergence in electricity spot prices, and at least two of these studies concluded
that market integration in Europe remains in its infancy. Nonetheless, of particular relevance
to the present study, Bollino et al.’s (2013) analysis of price convergence in four markets
(Austria, Germany, France and Italy) between 2004 and 2010 showed that German electricity
prices acted as a signal for neighbouring markets.
Since it can be argued that in the liberalised EU markets, common long-run price dynamics
would reflect the cost of generation in the region, several studies have assessed the link
between energy sources and electricity prices (e.g. Asche et al. (2006), Bollino et al. (2013),
Bosco et al. (2010), Bosco (2006), Emery and Liu (2002) Gjolberg (2001), Kalantzis and
Milonas (2010), Mjelde and Besseler (2009), Mohammadi (2009), Roques et al. (2008),
Sensfuβ et al. (2008), Sereletis and Herbert (1999)). In this line of research, Aatola et al.
(2013) were the first to consider RES-E policies in their assessment of electricity market
convergence. Using daily electricity and carbon forward price data from 2003 to 2011, the
authors concluded that electricity market integration in Europe was increasing over time, and
that carbon prices might have had a positive but uneven effect on integration. Subsequently,
Castagneto-Gissey’s (2014) analysis of electricity and carbon prices in the year-ahead energy
markets during ETS Phase II highlighted that electricity prices in the EU can be driven by
coal prices, but also that generators may excessively charge for the cost of carbon. It showed
9
that German and Nord Pool electricity prices increased 35% above the competitive threshold
given a unit increase in costs. Although electricity prices could have been driven by the
generators with greater emissions, generators might have also pushed for higher electricity
prices. The level of competition is therefore an important factor in the determination of
wholesale electricity prices and may also moderate the associations between coal and
electricity prices in European markets. Moreover, Brunner (2014) noted that the relationship
between electricity demand and spot prices in Germany is likely to be moderated by the
supply of RES-E.
To date, the different streams of literature reviewed have little in common. Studies on the
integration of RES-E on price dynamics have generally focused on one specific market.
Studies that assessed short-run interrelationships or price convergence in the long run have
neglected the potential effects of RES-E penetration. The present study links these streams of
literature, by focusing on how wind power penetration in the German market may have
impacted spot price behaviour in Germany and connected markets. In doing so, it assesses the
implications for the development of the Pan-European electricity market. The next section
considers potential implications of the surge in wind power generation in the German
electricity mix, which followed the start of the implementation of the German Nuclear-Phase
Out, and sets the hypotheses to be tested in this study.
4. Implications of increasing shares of RES-E in Germany for EU electricity markets
The drop in base-load capacity and the increasing share of RES-E in the German system,
described above, may have led to greater price fluctuations. Even if reserve margins were
sufficient, offsetting the decommissioned nuclear power generation by intermittent RES-E
might have resulted in more volatile electricity output and spot prices. In periods of low levels
of wind power generation, there would be a shift towards the steeper slope in the German

10
merit-order curve and therefore, small changes in demand or supply could lead to price
spikes. Indeed, as reported in the preceding section, a higher proportion of wind power in the
electricity mix has been linked to lower average prices and increases in price volatility within
one market. Moreover, in interconnected markets, a sudden surge in the share of wind-
generated electricity in a market can decrease electricity prices not only locally but also in
connected markets, because rational players recognise profitable arbitrage opportunities. By
buying electricity in the cheaper market, price shocks can then be transmitted between
neighbouring markets, subject to available transmission capacity. Analogously, a sudden
decrease in the share of wind-generated electricity may increase electricity imports in the
German market, which is not only central but also the most liquid in the region.
Consequently, it is hypothesised:
Hypothesis1a: Following Germany’s nuclear power station closures in 2011, stronger
associations between wind power penetration and spot price movements are observed.
In theory, in integrated and efficient electricity markets without network congestions, prices
and, as result their volatility, should be identical. As described above, interconnection and
geographical proximity have been found to be associated with the convergence of electricity
spot prices in Europe. Given the interconnection between the German and neighbouring
markets, it is therefore hypothesised:
Hypothesis 1b: After Germany’s nuclear power station closures in 2011, price volatility
transmission across EU electricity markets increased.
4.1 Implications for electricity spot price dynamics
The speed of mean reversion is useful for regulators as an indicator of market resilience,
because it quantifies how quickly the generation side can react to unexpected events by
ramping generation capacity up or down. With increasing electricity market integration, prices
11
should converge and the speed with which prices revert to their mean should increase as an
integrated EU electricity system relies on a larger generation portfolio. Yet, shifts in energy
policies that affect the electricity mix impact price differentials (competitiveness) locally and
in interconnected markets. With a merit-order curve that varies with the amount of wind-
generation, electricity spot prices are more volatile, and consequently the speed with which
they may converge to a mean is likely to be affected. Persistence of price spikes (slower mean
reversion) would signal reductions in system flexibility, as unexpected changes in demand or
supply levels are less easily overcome. It is therefore hypothesised:
Hypothesis 2a: After Germany’s nuclear power station closures in 2011, the speed with which
electricity spot prices revert to the mean has decreased.
4.1.1 Co-integration of EU electricity markets
The German electricity market is the largest in Europe. As highlighted above, greater spot
price volatility in the larger market can impact price differentials with interconnected markets,
especially if markets are unable to quickly respond to price signals. Hence:
Hypothesis 2b: After Germany’s nuclear power station closures, less integration between EU
electricity spot markets is observed.
5. Methods
The dataset is divided into two subsamples to test the hypotheses, with 6 August 2011 being
the date by which eight nuclear plants had been closed permanently following the timeline
legislated on 30 June 2011 (BMU, 2011). For assessment of changes in associations
(Hypotheses 1a and 1b) and in mean reversion (Hypothesis 2a), the Chow (1960) breakpoint
test is employed. This test entails a one-sided t-test, whose alternative hypothesis is defined
according to the hypothesised direction of change.

12
5.1 Assessing changes in correlation and volatility transmission
In order to investigate changes in the association between wind penetration levels and spot
prices and volatility transmission between spot markets, as implied by hypotheses 1a and 1b,
two alternatives of Multivariate GARCH models are estimated on two sets of variables: (1)
log-returns of spot prices and actual wind power penetration levels, (2) log-returns of spot
prices and planned (expected) wind power penetration levels. Given the time-varying
assumptions, dynamic conditional correlation models are used, the mean of estimated
correlations in each period (pre and post 6 August 2011) is computed and changes are then
evaluated via a breakpoint test.
5.1.1 Dynamic Conditional Correlation Models
Tse and Tsui’s (2002) proposal of a dynamic conditional correlation model is considered,
which hereafter is referred to as TTDCC. According to this model, the dynamic conditional
covariance matrix at time t is such as follows:
Γ , (1)
where
… (2)
is the conditional variance of the univariate GARCH model for variable I, as follows:
, 1 , 1, … , ; (3)
, , are parameters to be estimated, K is the number of variables in the model and N is
the number of observations in the estimation period. Γ is the KxK symmetric time-varying
positive definite conditional correlation matrix whose diagonal elements are 1 , , and
is defined as follows:

13
Γ 1 Ψ Ψ Γ , (4)
and are non-negative constants, such that 1. Ψ is a constant positive definite
parameter matrix of ones, and Ψ is a function of the lagged standardised residuals , such
that:
Ψ ,∑ , ,
∑ , ∑ ,
(5)
and
/ (6)
In addition, Engle’s (2002) alternative dynamic conditional correlation matrix is estimated,
i.e.:
Γ … 1 … (7)
where is the x unconditional correlation matrix of , and and are non-negative
parameters satisfying 1 (Higgs, 2009). Hereafter, this formulation is referred to as
the EDCC model.
5.2. Assessing price dynamics: Fractional Integration
Long-run associations of electricity spot prices can be obscured because of the presence of
large spikes in the data. Consequently, the time series needs to be smoothed before assessing
their long-run dynamics. The study conducted by Trück et al. (2007) is referred to for the
outlier treatment that is adopted. Outliers are defined as values that exceed or fall below the
rolling window mean average by three standard deviations over a one-month period. The
proportions of outliers varied with the time series, the threshold and length of the moving

14
average were decided so that the number of observations to be replaced would not exceed five
per cent of the sample. Four iterations were conducted, according to which the Nordic and
German spot markets had the lowest proportion of outliers (1.1%) while the French spot
market had the highest (4.5%). The identified outliers were replaced by a mean average of
lags and leads within one month.
In order to assess changes in mean reversion (Hypothesis 2a), the concept of fractional
integration (Robinson, 1994) is utilised, i.e.: A process is said to be integrated of order d,
I(d), if its fractional difference, 1 , is a stationary or mean- reverting I(0) process.
The fractional difference operator is the following:
1 ∑ . (8)
In cases when <d< , the process is stationary and invertible, when d the process is
non-stationary. However, the time series process is mean reverting when d<1.
Key to the assessment of the nature of the process is therefore the estimate of the order of
integration parameter d, for which a semi parametric two-step feasible exact local whittle
(FELW) estimator (Shimotsu, 2006) will be used. This estimator is robust to misspecification
of the short-run dynamics and can handle stationary (d< ½) and non-stationary (d ½)
processes (Okimoto and Shimotsu, 2010). Moreover, it is unlikely to be affected by
conditional heteroscedasticity (Robinson and Henry, 1998; Shao and Wu, 2007), which is a
common characteristic of electricity price series. Following, Lopes and Mendes (2006) in the
analysis that follows the bandwidth m for estimating the FELW is set to 0.75.
First, the time-varying estimates of order of integration are plotted using a rolling window of
200 observations. These estimates are smoothed with Hodrick-Prescott’s (1997) filter with a
smoothing parameter equal to 250. Secondly, one hundred perturbed series are obtained by

15
adding a random noise (N(0,1)) to the original time series. Their order of integration, d, is
then estimated using the FEWL based on 260 observations, corresponding to a period of one
year, both before (d_before) and after (d_after) the closure of the eighth nuclear plant. Mean
estimates in each period (before and after) are then used to test the hypotheses with standard t-
tests.
5.3 Assessing market integration: a Fractional Cointegration Analysis
To test for electricity spot price convergence (Hypothesis 2b), the fractional cointegration
framework (Granger, 1986; Engle and Granger, 1986; Johansen, 1988) is adopted. The aim is
to establish co-movement of fractionally integrated time series, i.e.: Two time series
and , integrated of order d, (I(d)) are said to be fractionally cointegrated of order (d, b) if
the error correction term given by
(9)
is fractionally integrated of order b, where 0 < b ≤ d (Banerjee and Urga, 2005). First, a t-test
is carried out to assess if and are integrated of the same order. When the order of
integration of the two time series, and , are not significantly different, the error
correction term is computed via an ordinary least square regression of on .
Subsequently, the order of integration of the error correction term, , is estimated using the
FELW estimator, and tested: if this value is significantly smaller than the common order of
integration d of the time series and , then cointegration is established.
5.4 Data
The dataset consists of electricity spot prices from eight European electricity spot markets:
APX-NL (Netherlands), APX-UK (GB), BELPEX (Belgium), EPEX-DE (Germany), EPEX-
FR (France), NORDPOOL (Norway, Denmark, Sweden, Finland, plus Estonia (from 2010)

16
and Lithuania (from 2012)), OMEL (Portugal and Spain) and SWISSIX (Switzerland)
covering the period from 2 November 2009 to 9 October 2012. The analysis focuses on week-
daily (Monday to Friday) mean of prices (base load), thus comprising 767 observations for
each market.
Hourly forecasts and actual electricity output generated by wind were obtained from the
Transparency in Energy Markets EEX database (www.transparency.eex.com). These time
series are also converted to a week-daily frequency (Monday-Friday), and then divided by the
daily volume traded on the German spot market, thus providing the share of wind power that
is traded on the day, which will be referred to as actual ‘Wind Power’ and forecasted ‘Planned
Wind Power’ penetration time series. Table 1 summarises the electricity spot prices of the
different markets in €/MWh as well as the two wind power penetration time series. The data
distributions reject normality: the Jarque-Bera statistics exceed their critical values, and all
markets, except OMEL, exhibit positive skewness; high kurtosis (extreme values) is also
observed, especially in EPEX-FR.
Table 1 here
Table 2 summarises the smoothed (outlier-treated) time series of spot prices, ‘planned wind’
and ‘actual wind’ penetration in the period from 6 August 2010 to 6 August 2012, which are
used to test hypotheses 2a and 2b. Average electricity prices, in the different markets, range
from 45.10€/MWh (Nord Pool) to 57.47€/MWh (SWISSIX) as reported in column 3. The last
column contains the estimate for the order of integration d, based on which the speed of mean
reversion of each time series can be assessed: the lower this value, the quicker spot prices
revert to their mean. Accordingly, APX-UK (d= 0.489) had the fastest speed of mean
reversion in the period. By contrast, the highest values of d are observed for EPEX-FR and
Nord Pool (0.906 and 0.862, respectively). The EPEX-FR, in particular, is very close to one,

17
suggesting that the market would have reacted very slowly to unexpected supply or demand
shocks.
Table 2 here
6. Results
6.1 Time-varying correlations with German wind power penetration and changes in price
dynamics
Following model selection criteria, the best and most parsimonious fits to the univariate time
series were achieved by ARMA(1,1)-GARCH(1,1) models with t-distributed errors. This
specification confirms the changing volatility (heteroscedasticity) and the spiky nature of the
time series (some high kurtosis, as shown in Table 1). Accordingly, wind penetration levels,
spot prices, and their volatilities are influenced by the previous values and shocks. Plots of the
estimated correlations in the period confirmed that all associations are time-varying.
Tables 3 and 4 show the average correlations in each period using the TTDCC model, values
before 6 August 2011 are shown in the top triangle of each table, while those after this date
are shown in the bottom triangle. Overall, there are more significant associations after 6
August 2011. The 31 significant (1% level) correlations in Table 3 range from 0.17 (for APX-
NL and OMEL, as well as OMEL and SWISSIX) to 0.97 (BELPEX and EPEX-FR). In Table
4, where the data includes ‘Planned Wind Power’ rather than actual wind power, 30
correlations are significant at 1% level and are within the same range - from 0.17 (for APX-
NL and OMEL) to 0.97 (BELPEX and EPEX-FR). Given the break point tests (one tailed t-
tests), seven (Table 3) and eight (Table 4) of the estimated correlations have increased, when
comparing the averages before 6 August 2011 (top triangle) with the averages after 6 August
2011 (bottom triangle), and they are highlighted in bold.2
2 Plots and one-tailed t-test results can be obtained from the authors upon request.

18
Average correlation coefficients after 6 August 2011 for ‘Wind Power’ and ‘Planned Wind
Power’ are shown in the last row and column (9) in both tables. The correlations between
wind power penetration levels and spot price returns are generally negative: the number of
significant associations with ‘Wind Power’ (Table 3) increased from two (column 9) to seven
(last row) when one compares the period before to after 6 August 2011. The two models are
consistent with respect to those associations that increased significantly (5% significance
level): only the strength of associations between German wind power levels and spot prices in
BELPEX and EPEX-FR increased in the period. As expected, the correlation is negative, thus
the greater the level of German wind power, the lower the spot prices in these markets. The
time-varying volatility of German wind power also implies that when correlations are
significant, as shown in the last rows and columns of Tables 3 and 4, there is volatility
transmission between German wind power and spot prices, and this is the case in the German
and all other markets, except OMEL.
Table 3 here
Table 4 here
The correlations between electricity spot price returns and volatilities are on average positive,
as shown in Tables 3 and 4. In general, associations are stronger the closer and more
connected the markets are. Before 6 August 2011, the average correlations ranged from 0.42
(BELPEX and SWISSIX) to 0.84 (BELPEX and EPEX-FR) in the model that included ‘Wind
Power’ (Table 3), and from 0.18 (APX-UK and SWISSIX) to 0.99 (BELPEX and EPEX-FR)
in the model with ‘Planned Wind Power’ (Table 4). When compared to other markets, spot
prices in NORDPOOL and OMEL have fewer and weaker correlations. In the top triangle of
Table 3, it can be seen that before 6 August 2011, spot prices in OMEL were independent of
spot prices in the other markets. After 6 August 2011, as shown in the lower triangle of Table
19
3, although significant, the correlations are low (0.17 to 0.26). These results are likely to
reflect OMEL’s limited physical connection with the other markets. For example, with
neighbouring France, interconnection represented a mere 3% of Spain’s electricity generation
(Bilbao et al., 2011).
NORDPOOL, however, is better connected, but is also more resilient to shocks because it has
a more evenly distributed electricity mix and a higher share of flexible generation (Deidersen
and Trück, 2002). With pump-storage electricity acting as a buffer, prices would be expected
to vary less than in neighbouring markets. However, this has not been observed in the period,
as illustrated by the standard deviations reported in Tables 1 and 2. The Nordic Market Report
2013 (Nordic Energy Regulators, 2013) described that increases in water levels in the period
led to increases in hydro generated electricity and decreases in thermal generation and prices.
Consequently, there were greater variations in prices that also impacted their correlation with
prices in other markets.
Following the same format of the previous tables, average correlations obtained with the
EDCC models are displayed in Tables 5 and 6, and generally confirm the results of the
previous models. For example, in EPEX-DE, the correlation between spot prices and ‘Wind
Power’ increased from an average of -0.42 to -0.58 (Table 5), thus supporting Hypothesis 1a
and indicating that a greater share of the volatility of wind power would have been transmitted
to spot prices after 6 August 2011. The average association between spot prices in EPEX-FR
and German wind power has more than doubled: from an average of -0.18, before 6 August,
to -0.43 (based on actual) and -0.42 (based on planned) after 6 August. Likewise, with
BELPEX, average association increased from -0.18 to -0.41 and -0.39.
Table 5 here
Table 6 here

20
The stronger association with ‘Planned Wind Power’ in comparison to the actual level of
wind power that is observed in both models is not surprising. Forecasts for the day-ahead are
made publicly available by the transmission systems operators, and therefore wind power
expectations can be incorporated into prices. Overall, there is limited support for increases in
the associations with German wind power after the closures of the eight nuclear plants, as
stated in Hypothesis 1a, since only two associations between wind power penetration and
electricity spot prices became significantly stronger after 6 August 2011. Yet, most
associations between German wind power and spot prices are significant at 1% level,
consequently the data show volatility transmission from German wind power to spot prices,
not just locally, but also in all markets except for OMEL.
Given greater volatility in electricity spot markets, an increase in the volume traded in
forward markets would be expected. Indeed, month-ahead German base-load trade data
obtained from Tullett Prebon Information for the period from August 2010 to August 2012
show increases in traded volumes and number of trades after the plant closures. Comparing
one year before with one year after 6 August 2011, the number of trades in German base load
grew by more than 35%, from 3484 to 5375; and traded volumes increased by 28%, from
45.6TWh to 63.2TWh. When the nuclear plant closures were announced, one-month-ahead
prices of base load moved from their mean average of 50.3 €MWh to 62 €/MWh. However, in
a few month prices converged towards 40 €/MWh. Furthermore, despite an increased demand
for base-load contracts, a decrease in the average price per MWh paid from an average of 52.3
€/MWh to 48.53 €/MWh is observed when comparing one year before with one year after 6
August 2011. These data support the inference that the capacity reduction in the German
electrical system was offset by rising shares of wind power.
Since most average correlations between spot prices are significant, there is evidence of
volatility transmission of spot prices across EU electricity markets. As for specific
21
associations with German spot prices, few associations have actually increased in the period
analysed. Although increases in average correlation vary with the model that was estimated,
they relate to spot markets that share borders with Germany, namely: EPEX-FR, BELPEX,
SWISSIX, and APX-NL. Hence, there is some support for Hypothesis 1b, which states that
spot price volatility transmission would have increased after the closure of the German
nuclear plants. Yet, results seem to suggest that if there were impacts, these were limited to
some neighbouring markets.
6.1 Changes in mean reversion in the spot market
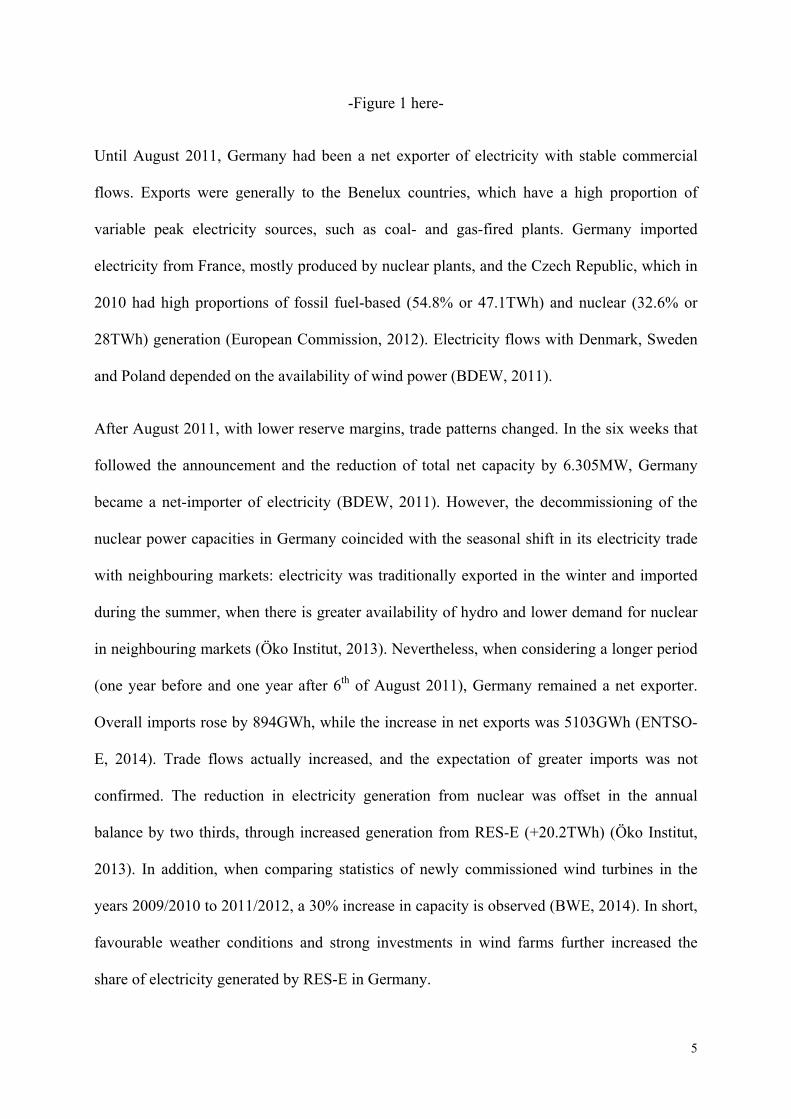
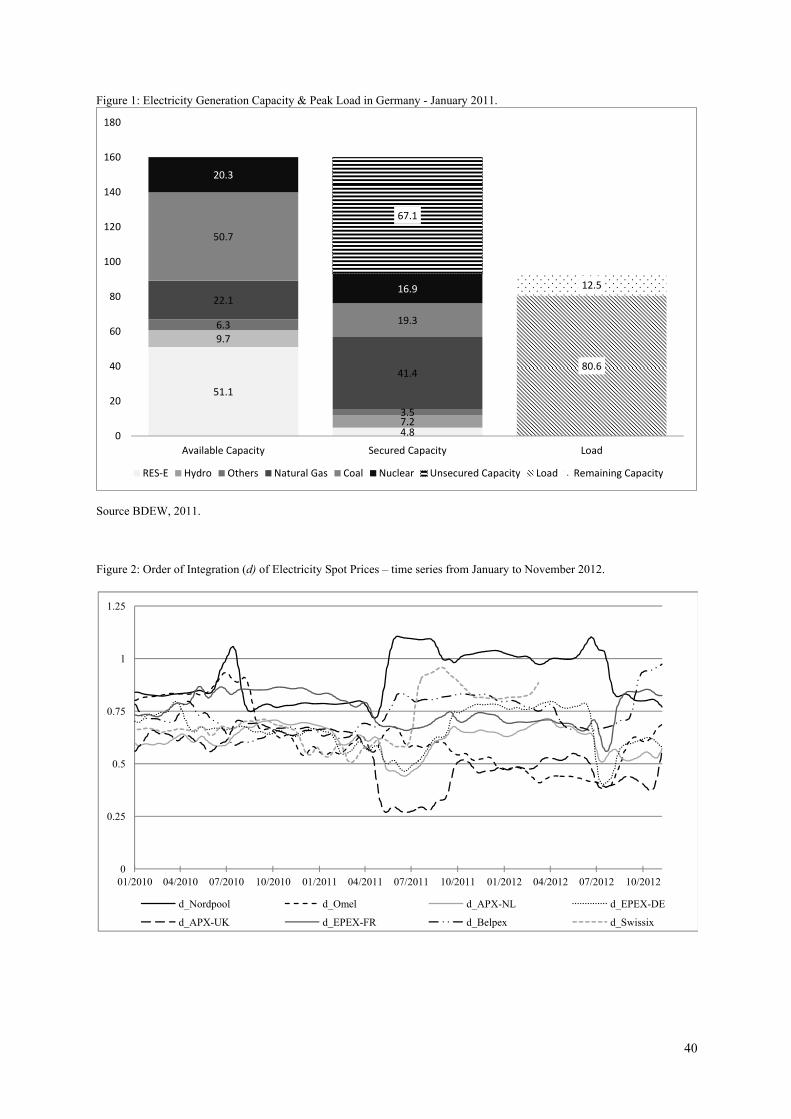
Figure 2 depicts the time-varying estimates of the order of integration (d) of electricity spot
prices between January 2010 and October 2012. Considering NORDPOOL spot prices,
increasing values of the parameter d can be observed briefly after March 2011, and thus there
is a decrease in the speed of mean reversion. By contrast, an abrupt drop in the order of
integration of British spot prices can be noticed soon after April 2011, thus indicating a faster
speed of mean reversion. In summary, there are signs of divergence in electricity price
dynamics in the second quarter of 2011, which will be further investigated.
Figure 2 here
The sample means of the estimated ds of the perturbed spot price series, their confidence
intervals and the results of the t-tests are summarised in Table 7, and broadly confirm the
observations that were made based on Figure 2. Confidence intervals for the means of ds that
are shown in the third column tend to overlap in the period before 6 of August, thus
suggesting that differences in the speed of mean reversion were not significant in this period.
After 6 August, however, some confidence intervals do not overlap: APX-UK has a lower
interval when comparing to all markets bar OMEL; NORDPOOL and SWISSIX have higher
intervals when compared to EPEX-DE, APX-UK, and OMEL. There are signs of divergence
22
and decreases in mean reversion for most spot prices. According to one-sided t-tests, for
which the statistics are shown in the last column of Table 7, the parameter d has increased for
all spot prices, except in OMEL and APX-UK. For the former, there is no significant change
in the parameter d and for APX-UK there is a decrease that may, however, be explained by
the greater competitiveness in the period of flexible gas-generated electricity, due to low fuel
costs (European Commission, 2011), rather than the association with other European markets.
In all, Hypothesis 2a is supported, since the speed with which electricity spot prices revert to
their mean decreased in all markets apart from those that are less connected to the German
market.
Table 7 here
6.2 Changes in convergence of electricity spot prices
Given the above findings, the process of convergence to a common price is likely to have
changed. Table 8 summarises t-tests that assess the Null hypothesis of a common order of
integration for pairs of markets before (above diagonal) and after (below diagonal) 6 August
2011. These results broadly confirm the general observations based on the 95% confidence
intervals in Table 7. Before 6 August 2011, twenty pairs did not reject the null of a common
order of integration. By contrast, after 6 August 2011, the null hypothesis is rejected for most
pairs (as shown below the diagonal in Table 8). None of the spot prices had a common order
of integration with spot prices in APX-UK. This result further highlights the different in price
dynamics between the British and the other EU spot markets in this study, which is likely to
be due to the limited interconnection between them.
Table 9 considers all pairs of time series that have previously been found to have a common
order of integration. Cointegration tests are summarised; significant differences at 5% level
are indicated by asterisks, and show that before 6 August (top triangle), five market pairs were
23
integrated. After this date (bottom triangle), nine pairs were integrated. Nonetheless, the
cointegrated pairs differ: after 6 August 2011, no market was integrated with EPEX-DE,
while before that date APX-NL and SWISSIX were. Overall, the hypothesis of less
integration within EU electricity spot markets is rejected. There are indications of a decoupled
German electricity market after the nuclear plant closures. In addition, the results in Table 9
also show increasing integration between BELPEX, APX-NL, NORDPOOL and EPEX-FR.
Table 8 here
Table 9 here
7. Discussion
The empirical findings show that wind power can no longer be neglected in studies of the
integration of European electricity markets. Wind power penetration levels in Germany were
found to be negatively associated with spot prices in Germany but also in other markets. In
the long run, increasing levels of wind power can lead to lower wholesale prices. The
drawback is that there is also evidence of volatility transmission. Given that positive short-run
associations across EU electricity spot markets were also found and are stronger the closer
and better connected the markets are, with the combination of increasing wind power
generation and market integration, electricity spot prices are likely to become more volatile.
Participants in an integrated day-ahead market will need to trade off the additional price risk
with the expectation of lower prices in high-wind scenarios. On the one hand, larger suppliers
could make more use of future contracts, but in doing so they would miss opportunities of
lower prices, their final price would then be more expensive to the consumers. High-wind
scenarios could therefore benefit smaller suppliers, who could then more quickly pass on
lower prices to the consumer. On the other hand, in high-wind scenarios, the more expensive
flexible generators become less attractive investments (Paraschiv et al., 2014; Traber and

24
Kemfert, 2011), they would have to rely on capacity payments and make more use of take or
pay contracts. In all, there are greater incentives for hedging and more flexible contracts,
options (e.g. swings, recalls and nominations), and greater use of contracts for differences
between generators and suppliers.
Cross-border electricity trading is dependent on price differentials. A main finding of this
study, which is in line with recent studies (e.g. Castagneto-Gissey et al., 2014), is that the
dynamics of electricity spot prices in European markets are time-varying. Consequently, price
differentials in the short run are time-varying, thus making the task of forecasting
interconnector flows more difficult for transmission operators. This is a challenge, as
historical data on price differentials become less reliable, but is also an opportunity for greater
share of information in the European electricity supply chain. Reliable estimates of trade
flows are likely to be important for future capacity assessments in Europe, since the
decommissioning of old plants in the UK and the phasing-out of nuclear plants in Belgium,
Switzerland and Germany have led to concerns about the nations’ abilities to secure supply in
the near future.
The results also show that spot prices in OMEL and APX-UK were less affected by
developments in central European markets. This finding reinforces the role of interconnection
in electricity markets, as highlighted in the review of the literature and observed in the
particular case of OMEL. It is noteworthy that Britain has interconnectors with France and the
Netherlands, where price differentials (as shown in Tables 1 and 2) would have favoured
imports to Britain, these interconnections seem to have been used in congestion management
during the period analysed and therefore would not have a significant share in the day-ahead
market. Britain is also interconnected with Ireland, with price differentials mostly favouring
exports. Yet, as McInerney and Bunn (2013) described in their analysis of the Moyle
interconnector, transmission capacity rights have been undervalued and some flows were

25
found to be opposite to the efficient direction. The authors’ explanations for inefficiencies
include intermittent wind power and the strategic behaviour of dominant firms. As a whole,
undersubscription of transmission rights and other uncertainties related to interconnection
have meant that the transmission operator and the recent UK capacity market auctions
considered interconnectors at float for transmission planning. However, the situation is
changing, because interconnectors are becoming more responsive since February 2014 as a
consequence of market coupling. Moreover, with the planned increases in interconnection and
future targets for market coupling, interconnectors are likely to play a greater role in the day-
ahead market. Consequently, significant shifts are expected in the relatively low and stable
correlations that were estimated in this study.
In addition, the higher average short-run correlations (greater than 0.70), which were observed
between spot prices in BELPEX and SWISSIX with their larger neighbouring markets, appear
to support previous observations that in well-connected electricity markets price volatility
transmissions are in the direction of the smaller markets (e.g. Zareipour et al., 2007). This
may be a cause for concern, and further investigation is desired covering a wider period, and
in the case of BELPEX, a longer range study of market volatility pre and post market
coupling would enable a clearer assessment.
Faced with a more volatile electricity supply, smart technology has been advocated (e.g.
Strbac, 2008) and targets have been set at European and national levels (e.g. DECC, 2013). In
this context, virtual power plants that aggregate decentralised sources of generation or pool
together large consumers that can temporarily reduce their electricity consumption have been
presented as efficient solutions or means to reduce dependency in interconnection to secure
supply. They can decrease price volatility by flattening demand peaks. In doing so,
investment signals are also reduced, but the trade-off is that in low-wind scenarios, they can
contribute to capacity. So far, their volumes are relatively small, but as 2020 approaches,
26
these potentially local changes in demand and supply will be of relevance to the analysis of
the short-run covariance of spot prices in connected markets.
The long-run dynamics of the eight spot markets, which were analysed, imply that during the
year after the closure of Germany’s nuclear plants, supply or demand shocks were less easily
overcome. The speed with which prices reverted to their mean decreased for all markets,
except for OMEL and APX-UK, which are not directly connected to the German market. This
observed change in mean reversion suggested that market integration might have been
affected by the change in Germany’s electricity mix. Indeed, the German market was no
longer integrated with the two markets that it had been in the year before. This finding could
mean that the largest and most liquid market would no longer be acting as a signal to
neighbouring markets, as previously described in the literature (e.g. Bollino et al., 2013).
Nevertheless, several other market pairs were integrated, and thus the long-run market
convergence may be more resilient to changes in a central market than might have been
expected. Furthermore, considering the markets that became more integrated in the period
analysed, there is some evidence that market coupling has played its expected role in the path
towards a single market for electricity.
In an integrated price-coupled market, power flows between two regions would be based on
bids and offers in both power exchanges to establish the market clearing prices and the
owners of interconnectors would be remunerated according to the total flow in the period.
Yet, as McInerney and Bunn (2013) warned, given the challenge of integrating market
systems and infrastructure, explicit auctions for interconnector capacity will remain for some
time in Europe. Consequently, as Gebhardt and Hoeffler (2013) observed when analysing
different interconnectors with Germany, there can be significant variations in relationship
between interconnector prices and spot prices. Power flows in interconnectors may not
support expectations that are based on price differentials, thus the authors concluded that
27
informed players were not engaging in cross-border trading. Gebhardt and Hoeffler (2013)
therefore conjectured that where markets are concentrated, big players may collude and
forego the use of an interconnector. By not engaging in cross-border trading, they maintain
their local dominant status. It is therefore possible that lack of competition could partially
explain some of the low correlations that were observed in the present study. Regulators in
connected markets should closely coordinate the monitoring of anti-competitive behaviour,
since, as highlighted by Castagneto-Gissey (2014), the level of competition also impacts
electricity prices in European markets. Nonetheless, the expectation remains that with market
coupling price correlations increase, as observed in the results. Given that wind power
penetration levels were found to be important in assessments of market integration, a
limitation of the present study is that wind power levels in the other markets and different
types of RES/E were not considered due to lack of access to reliable data. The analysis
focused on daily average spot prices from Monday to Friday, which simplified the
econometric modelling by eliminating seasonal effects. A drawback of this simplification is
that inferences cannot be made concerning intra-day variations, especially peak periods. The
statistical tests enable the identification of changes in patterns, some of which were in line
with the hypotheses, correlations and differences were observed but causality is not implied.
The findings are robust insofar as it is possible to conclude that the short-run variance and
covariance as well as the long-run dynamics of European spot prices are changing, and these
associations may react to special events.
8. Conclusion and Policy Implications
Our findings suggest that the amount of interconnection and RES-E in European electricity
markets can no longer be neglected by policy makers when they are legislating and planning
for the long term. As highlighted, if prices are positively correlated, the combined price
volatility is higher than the sum of individual volatilities, thus market players can be exposed
28
to greater price risk from interconnection. Although volatility is desired because it stimulates
trading and encourage the participation of financial institutions and other players in electricity
markets, thus making markets more liquid and competitive, too much volatility can hinder
investments in infrastructure and capacity. Moreover, a traditional regulatory response to high
volatility in a market is the establishment of price caps. In connected markets, price caps
should be a agreed upon by consensus, whose estimate should include markets that are not
directly connected; otherwise, in a period of scarcity power flows would be in the direction of
the higher price cap. In short, given the interactions and constraints in the electric system, co-
ordinated policies and information sharing between connected electricity markets are vital.
Currently, different national policies for integrating RES-E are in place and there is variation
in how nations are dealing with their capacity assessments. In fact, the European market
coupling project does not address capacity, and its independence from capacity assessments
can be problematic in the long run. Electricity, at the end of the day, is a common good: faced
with local social and institutional pressures national governments react and quick reactions in
interconnected energy markets can have unwanted consequences. Overall, the ability of an
integrated energy market to secure supply and minimize the cost to consumers call for greater
coordination and innovation in policy and regulation at the European level. National policies
are responsible for securing supply and energy mixes are decided by each state, where
institutional pressures may not allow policy makers enough time for consultations. However,
in the absence of a coordinated European-wide capacity assessment, the resilience of the
electricity markets to shocks that could result from market integration is constrained. In fact,
the findings of this study also highlight the potential for volatility transmission across energy
markets, especially in the direction of the gas market, which should be further investigated
and monitored.
29
In conclusion, the present study highlights challenges associated with isolated energy policies
in the context of achieving the goals of a single European electricity market and RES-E
targets. A fully co-ordinated European approach to energy policy appears indispensable, but
clearly is not easily achievable. Nonetheless, a single Europe-wide capacity assessment of
national policies, in the interim, would enable each electricity market to estimate the
consequences of their policies in other markets and anticipate reactions from different
perspectives. Moreover, the greater sharing of information between the different market
participants, regulators and policy-makers that such an assessment would require could also
facilitate monitoring of the behaviour of dominant market participants and help in removing
barriers to full market coupling. Hence, a single Europe-wide capacity assessment is needed
and would be a significant step forward in the path to an integrated energy market in Europe.
30
References
Aatola, P., Ollikainen, M., Toppinen, A., 2013. Impact of the carbon price on the integrating
European electricity market. Energy Policy, 61, 1236-1251.
Armstrong, M., Galli, A., 2005. Are Day-ahead Prices for Electricity Converging in
Continental Europe? An exploratory data approach. CERNA Working Paper, 2005.
Asche, F., Osmundsen, P., Sandsmark, M., 2006. The UK Market for Natural gas, Oil and
Electricity: Are the Prices Decoupled? The Energy Journal, 27(2) 2, 27-39
Banerjee, A., Urga, G., 2005. Modelling structural breaks, long memory and stock market
volatility: an overview. Journal of Econometrics, 129(1-2), 1-34.
Bask, M, Widerberg, A., 2009. Market structure and the stability and volatility of electricity
prices. Energy Economics. 31, 278-288.
BDEW, 2011. Auswirkung des Moratoriums auf die Stromwirtschaft. [online]. Available
from
http://www.bdew.de/internet.nsf/res/D958D012D18331EDC12578A200378832/$file/11-05-
31-Energie-Info-
Auswirkungen%20des%20Moratoriums%20auf%20die%20Stromwirtschaft.pdf [accessed
04/11/2012].
Bilbao, J., Bravo, E., Garcia, O., Varlea, C., Rodriguez, M., Gonzalez P., 2011. Electric
energy system, Spanish interconnections and their regulation. International Journal on
Technical and Physical Problems of Engineering, 3 (1), 106-109.
31
BMU, 2011. Dreizehntes Gesetz zur Änderung des Atomgesetzes [online]. Available from:
http://www.bmu.de/service/publikationen/downloads/details/artikel/dreizehntes-gesetz-zur-
aenderung-des-atomgesetzes/ [accessed 28/09/2013].
Boeckers, V., Haucap, J., Heimeshoff, U., 2013. Benefits of an Integrated European
Electricity Market. (No. 109). DICE Discussion Paper.
Bode, S., Groscurth, H., 2006. Zur Wirkung des EEG auf den Strompreis. Discussion Paper
HWWA 338.
Bollino, C. A., Ciferri, D., Polinori, P., 2013. Integration and convergence in European
electricity markets. Available at SSRN 2227541.
Boissellau, F., 2004. The Role of Power Exchanges for the Creation of a Single European
Electricity Market: market design and market regulation. Delft University Press.
Bosco, B., Parisio, L., Pelagatti, M., Baldi, F., 2010. Long-run relations in European
electricity prices. Journal of Applied Economics, 25(5), 805-832.
Bunn, D., Gianfreda, A., 2010. Integration and shock transmission across European electricity
forward markets. Energy Economics 32(2), 278-291.
Brunner, C., 2014. Changes in electricity spot price formation in Germany caused by a high
share of renewable energies. Energy Systems,5 (1), 45-64.
BWE, 2014. Installed Wind power capacity in Germany. [online]. Available from:
http://www.wind-energie.de/en/infocenter/statistiken/deutschland/installed-wind-power-
capacity-germany [accessed 18/04/2014].

32
Castagneto-Gissey, G., Chavez, M, De Vico Fallani, F., 2014. Dynamic Granger-causality
networks of electricity spot prices: A novel approach to market integration. Energy
Economics, 44, 422-432.
Castagneto-Gissey, G. 2014. How competitive are EU electricity markets? An assessment of
ETS Phase II. Energy Policy, 73, 278-297.
Chow, G.C., 1960. Test of equality between sets of coefficients in two linear regressions.
Econometrica, 28(3), 591-605
Claudius, J., Hermann, H., Matthes F. C., Graichen, V., 2014. The merit order effect of wind
and photovoltaic electricity generation in Germany 2008–2016: Estimation and distributional
implications. Energy Economics, 44, 302-313
Committee on Climate Change, 2013. Fourth Carbon Budget Review – part 2. [online].
Available from: http://www.theccc.org.uk/publication/fourth-carbon-budget-review/
[accessed 18/08/2014].
DECC, 2013. Electricity Market Reform: Capacity Market- Detailed Design Proposals, UK
Department of Energy and Climate Change, June, 2013. [online]. Available from:
https://www.gov.uk/government/uploads/system/uploads/attachment_data/file/209280/15398
_TSO_Cm_8637_DECC_Electricity_Market_Reform_web_optimised.pdf [acessed
26/03/2015]
Deidersen, J., Trück, S., 2002. Energy Price Dynamics. quantitative studies and stochastic
processes. Technical Report TR-ISWM-12.
Engle, R. 2002. Dynamic conditional correlation – a simple class of multivariate GARCH
models. Journal of Business & Economic Statistics, 20(3), 339-350.

33
Engle R.F., Granger C.W.J. (1986) Cointegration and error correction: representation,
estimation and testing. Econometrica 55, 251-276.
European Commission, 2011. Quarterly Report on European Electricity Markets [online]
Available from:
http://ec.europa.eu/energy/observatory/electricity/doc/qreem_2011_quarter2.pdf.[accessed
01/08/2014].
European Commission, 2012. Country Factsheet – EU 27 Member States [online]. Available
from: http://ec.europa.eu/energy/observatory/countries/countries_en.htm [accessed
01/08/2014].
European Energy Review, 2012. What Germany Can Learn from the Nordic Energiewende
[online]. Available from:
http://www.europeanenergyreview.eu/site/pagina.php?id=3910&zoek=altmaier [accessed
05/11/2012].
European Wind Energy Association, 2012. Wind in Power – 2012 European Statistics
[online]. Available from:
http://www.ewea.org/fileadmin/files/library/publications/statistics/Wind_in_power_annual_st
atistics_2012.pdf [accessed 01/08/2014].
Fetter, A.F., 1924. The economic law of market areas. The Quarterly Journal of Economics,
38(3), 520-529
Forrest, S., MacGill, I, 2013. Assessing the impact of wind generation on wholesale prices
and generator dispatch in the Australian National Electricity Market. Energy Policy, 59 (1),
120-132.
34
Gil, H.A., Gomez-Quiles, C., Riquelme, J., 2012. Large-scale wind power integration and
wholesale electricity trading benefits: estimation via an ex post approach. Energy Policy, 41,
849-859.
Gebhardt, G. and Hoeffler, F., 2013. How Competitive is Cross-border Trade of Electricity?
Theory and Evidence from European Electricity Markets. The Energy Journal, 34 (1), 125-
154.
Granger, C.W., 1986. Developments in the study of cointegrated economic variables. Oxford
Bulletin of Economics and Statistics, 48(3), 221-254
Gross, R., Heptonstall, P., Anderson, D., Green, T., Leach, M., Skea, J., 2006. The Costs and
Impacts of Intermittency: An assessment of the evidence on the costs and impacts of
intermittent generation on the British electricity network. A report of the Technology and
Policy Assessment Function of the UK Energy Research Centre.
Henriot, A., Glachant, J.-M., 2013. Melting-pots and salad bowls: the current debate on
electricity market design. RSCAS working paper
Higgs, H., 2009. Modelling price and volatility interrelationships in the Australian wholesale
spot electricity markets. Energy Economics, 31, 748-756.
Hodrick, R., Prescott, E.C., 1997. Postwar U.S. business cycles: an empirical investigation.
Journal of Money, Credit, and Banking, 29 (1), 1–16.
Holttinen, H., Meibom, P., Orths, A., van Hulle, F., Lange, B., O’Malley, M., Pierik, J.,
Ummels, B., Olav J., 2009. Design and Operation of Power Systems with Large Amounts of
Wind Power, IEA collaboration. From the Nordic Wind Power Conference, May 2009,
Espoo, Finland.
35
Hooper, E., Medvedev, A. 2009. Electrifying integration: electricity production and the South
East Europe regional energy market. Utilities Policy, 17 (1), 24-33.
Jacobsen K., Zvingilaite, E., 2010. Reducing the market impact of large shares of intermittent
energy in Denmark. Energy Policy, 38(7), 3403-3413.
Johansen, S., 1988. Statistical analysis of cointegration vectors. Journal of Economic
Dynamics and Control, 12(2–3), 231-254.
Jonsson, T., Pinson, P., Madsen, H., 2010. On the market impact of wind energy forecasts.
Energy Economics, 32(2), 313-320.
Kalantzis, F., Milonas, N. T, 2010. Market Integration and Price Dispersion in the European
Electricity Market. Energy Market (EEM), 2010 7th International Conference on the
European. IEEE.
Ketterer, J., 2014. The Impact of Wind Power Generation on the Electricity Price in Germany.
Energy Economics 44 (2), 270-280.
Le Pen, Y., Sévi, B., 2010. Volatility transmission and volatility impulse response functions
in European electricity forward markets. Energy Economics, 32(4), 758-770.
Lopes, S.R C., Mendes, B.V.M., 2006. Bandwidth selection in classical and robust estimation
of long memory. International Journal of Statistics and Systems, 1(1), 167-190.
Lundgren, J., Hellstroem, J., Rudholm, N., 2008. Multinational Electricity Market Integration
and Electricity Price Dynamics. IEEM 2008. 5th International Conference on European
Electricity Markets, 1-6.
McInerney , C., Bunn D., 2013. Valuation anomalies for interconnector transmission rights.
Energy Policy, 55 (4), 565-578.
36
Mjelde, J., Bessler, D.A., 2009. Market integration among electricity markets and their major
fuel source markets. Energy Economics 31, 482-491.
Mohammadi, H., 2009. Electricity price and fuel costs; long-run relations and short run
dynamics. Energy Economics 31, 503-509.
Neubarth, J., Woll, O., Weber, C., Gerecht, M., 2006. Beeinflussung der Spotmarktpreise
durch Windstromerzeugung [online]. Available from:
http://78.47.31.10/fileadmin/dokumente/Themen_A-Z/Strompreise%20-
%20Energiepreise/Eon-UniDuisburg_spotmarktpreise.pdf [accessed 01/08/2012].
Neuhoff, K., Barquin, J., Bialek, J. W., Boyd, R., Dent, C. J., Echavarren, F., Weigt, H., 2013.
Renewable electric energy integration: quantifying the value of design of markets for
international transmission capacity. Energy Economics, 40, 760-772.
Nicolosi, M., 2010. Wind Power Integration, Negative Prices and Power System Flexibility -
An empirical analysis of extreme events in Germany. Working Paper 10, Institute of Energy
Economics EWI, Cologne.
Nordic Energy Regulators, 2013. Nordic Market Report 2013 [online]. Available from:
http://www.nordicenergyregulators.org/wp-content/uploads/2013/02/Nordic_Market-
report_2013.pdf [acccessed 25/03/15].
Oggioni, G., Murphy, F.H., Smeers, Y., 2014. Evaluating the impacts of priority dispatch in
the European electricity market. Energy Economics 42, 183-200
Okimoto, T., Shimotsu, K., 2010. Decline in the persistence of real exchange rates, but not
sufficient for purchasing power parity. Journal of the Japanese and International Economies,
24(3), 395-411.

37
Öko Institut, 2013. EEG-Umlage und die Kosten der Stromversorgung für 2014 Eine Analyse
von Trends, Ursachen und Wechselwirkungen. Available from:
http://www.oeko.de/oekodoc/1793/2013-475-de.pdf [accessed 01/08/2014].
Paraschiv, F., Erni, D. Pietsch, R., 2014. The impact of renewable energies on EEX day-ahead
electricity prices. Energy Policy, 73 (2), 196-210.
Pellini, E., 2012. Convergence across EU electricity markets still a way to go. [online]
Available from: http://www.iot.ntnu.no/ef2012/files/papers/44.pdf [last accessed 01/08/2014].
Pinho, C., Madaleno, M., 2011. Multiscale Analysis of European Electricity Markets. [online]
Available from:
http://www.efmaefm.org/0EFMAMEETINGS/EFMA%20ANNUAL%20MEETINGS/2011-
Braga/papers/0295.pdf [accessed 27/08/2014].
Ray, S., Munksgaard, J., Morthorst, P. E., Sinner, A.-F., 2010. Wind energy and electricity
prices: Exploring the merit order effect. Report, European Wind Energy Association,
Brussels. [online]. Available from:
http://www.ewea.org/fileadmin/ewea_documents/documents/publications/reports/MeritOrder.
pdf [accessed 01/08/2014].
Robinson, P.M., 1994. Semiparametric analysis of long-memory time series. The Annals of
Statistics, 22(1), 515-539.
Robinson, P.M., .Henry, M. 1998. Long and Short Memory Conditional Heteroscedasticity in
Estimating the Memory Parameter of Levels. Discussion paper STIDERC Econometrics
EM/98/357, London School of Economics and Political Science.
Robinson, T., 2000. Electricity pool series a case study in non-linear time series modelling.
Applied Economics, 32(5), 527-532.
38
Robinson, T., 2008. The evolution of electricity prices in the EU since the Single European
Act. Economic Issue, 13(2), 59-70.
Saenz de Miera, G., Rio Gonzalez, P., Vizcaino, I., 2008. Analysing the impact of renewable
energy electricity support schemes on power prices: the case of wind electricity in Spain.
Energy Policy, 36(9), 3345-3359.
Sensfuß, F., Ragwitz, M., Genoese, M., 2008. The merit-order effect: a detailed analysis of
the price effect of renewable electricity generation on spot market prices in Germany. Energy
Policy, 36(8), 3086-3094.
Shao, X., Wu, W.B., 2007. Local whittle estimation of fractional integration for nonlinear
processes. Econometric Theory, 23(5), 899-929.
Strbac, G., 2008. Demand Side Response: Benefits and Challenges, Energy Policy, 36 (12),
4419–4426.
Shimotsu, K., 2006. Simple but Effective Test of Long Memory versus Structural Breaks.
Queens´s Economics Department Working Paper No 1101.
Smith, J., Milligan, M., De Meo, E., Parsons, B., 2007. Utility wind integration and operating
impact state of the art. IEEE Transactions on Power Systems, 22, 900-908.
Solibakke, P., B., 2008. Efficiency and transmission in European energy markets a semi non-
parametric approach. The Journal of Energy Markets, 1(2), 35-59.
Spiecker, S., Vogel, P., Weber, C., 2013. Evaluating interconnector investments in the north
European electricity system considering fluctuating wind power penetration. Energy
Economics, 37, 114-127.
39
Traber, T., Kemfert, C., 2011. Gone with the wind?—Electricity market prices and incentives
to invest in thermal power plants under increasing wind energy supply. Energy Economics,
33(2), 249-256.
Trück, S., Weron, R. Wolff, R., 2007. Outlier Treatment and Robust Approaches for
Modelling Electricity Spot Prices. MPRA paper no 4711.
Tse, Y.K., Tsui, A.K.C., 2002. A multivariate generalised autoregressive conditional
heteroscedasticity model with time-varying correlations. Journal of Business and Economic
Statistics, 20(3), 351-362.
Woo, C.K., Horowitz, I., Moore, J., Pacheco, A., 2011. The impact of wind generation on the
electricity spot-market price level and variance: the Texas experience. Energy Policy, 39(7),
3939-3944.
Woo, C.K., Ho, T., Zarnikau, A., Olson, A., Jones, R., Chait, M., Horowitz, I., Wang, J.,
2014. Electricity-market price and nuclear power plant shutdown: Evidence from California.
Energy Policy, 73. 234-244.
Worthington, A.C., Kay-Spratley, A., Higgs, H., 2005. Transmission of prices and price
volatility in Australian electricity spot markets: a multivariate GARCH analysis. Energy
Economics, 27(2), 337-350.
Würzburg,K., Labandeira, X., Linares,P., 2013. Renewable generation and electricity prices:
Taking stock and new evidence for Germany and Austria, Energy Economics, 40(1),159-171
Zareipour, H., Bhattacharya, K., ,Cañizares, C. A. 2007. Electricity market price volatility:
The case of Ontario. Energy Policy, 35(9), 4739-4748.
40
Figure 1: Electricity Generation Capacity & Peak Load in Germany - January 2011.
Source BDEW, 2011.
Figure 2: Order of Integration (d) of Electricity Spot Prices – time series from January to November 2012.
51.1
4.8
9.7
7.2
6.3
3.5
22.1
41.4
50.7
19.3
20.3
16.9
67.1
80.6
12.5
0
20
40
60
80
100
120
140
160
180
Available Capacity Secured Capacity Load
RES‐E Hydro Others Natural Gas Coal Nuclear Unsecured Capacity Load Remaining Capacity
0
0.25
0.5
0.75
1
1.25
01/2010 04/2010 07/2010 10/2010 01/2011 04/2011 07/2011 10/2011 01/2012 04/2012 07/2012 10/2012
d_Nordpool d_Omel d_APX-NL d_EPEX-DE
d_APX-UK d_EPEX-FR d_Belpex d_Swissix

41
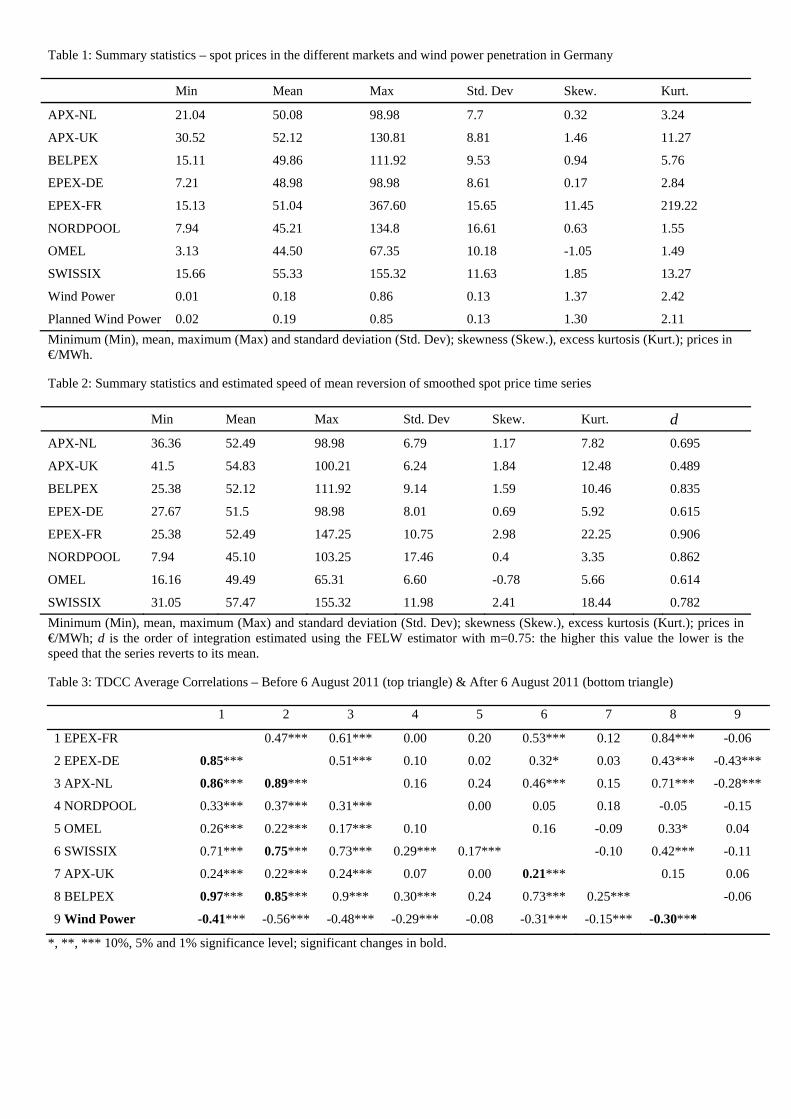
Table 1: Summary statistics – spot prices in the different markets and wind power penetration in Germany
Min Mean Max Std. Dev Skew. Kurt.
APX-NL 21.04 50.08 98.98 7.7 0.32 3.24
APX-UK 30.52 52.12 130.81 8.81 1.46 11.27
BELPEX 15.11 49.86 111.92 9.53 0.94 5.76
EPEX-DE 7.21 48.98 98.98 8.61 0.17 2.84
EPEX-FR 15.13 51.04 367.60 15.65 11.45 219.22
NORDPOOL 7.94 45.21 134.8 16.61 0.63 1.55
OMEL 3.13 44.50 67.35 10.18 -1.05 1.49
SWISSIX 15.66 55.33 155.32 11.63 1.85 13.27
Wind Power 0.01 0.18 0.86 0.13 1.37 2.42
Planned Wind Power 0.02 0.19 0.85 0.13 1.30 2.11
Minimum (Min), mean, maximum (Max) and standard deviation (Std. Dev); skewness (Skew.), excess kurtosis (Kurt.); prices in €/MWh.
Table 2: Summary statistics and estimated speed of mean reversion of smoothed spot price time series
Min Mean Max Std. Dev Skew. Kurt. d
APX-NL 36.36 52.49 98.98 6.79 1.17 7.82 0.695
APX-UK 41.5 54.83 100.21 6.24 1.84 12.48 0.489
BELPEX 25.38 52.12 111.92 9.14 1.59 10.46 0.835
EPEX-DE 27.67 51.5 98.98 8.01 0.69 5.92 0.615
EPEX-FR 25.38 52.49 147.25 10.75 2.98 22.25 0.906
NORDPOOL 7.94 45.10 103.25 17.46 0.4 3.35 0.862
OMEL 16.16 49.49 65.31 6.60 -0.78 5.66 0.614
SWISSIX 31.05 57.47 155.32 11.98 2.41 18.44 0.782
Minimum (Min), mean, maximum (Max) and standard deviation (Std. Dev); skewness (Skew.), excess kurtosis (Kurt.); prices in €/MWh; d is the order of integration estimated using the FELW estimator with m=0.75: the higher this value the lower is the speed that the series reverts to its mean.
Table 3: TDCC Average Correlations – Before 6 August 2011 (top triangle) & After 6 August 2011 (bottom triangle)
1 2 3 4 5 6 7 8 9
1 EPEX-FR 0.47*** 0.61*** 0.00 0.20 0.53*** 0.12 0.84*** -0.06
2 EPEX-DE 0.85*** 0.51*** 0.10 0.02 0.32* 0.03 0.43*** -0.43***
3 APX-NL 0.86*** 0.89*** 0.16 0.24 0.46*** 0.15 0.71*** -0.28***
4 NORDPOOL 0.33*** 0.37*** 0.31*** 0.00 0.05 0.18 -0.05 -0.15
5 OMEL 0.26*** 0.22*** 0.17*** 0.10 0.16 -0.09 0.33* 0.04
6 SWISSIX 0.71*** 0.75*** 0.73*** 0.29*** 0.17*** -0.10 0.42*** -0.11
7 APX-UK 0.24*** 0.22*** 0.24*** 0.07 0.00 0.21*** 0.15 0.06
8 BELPEX 0.97*** 0.85*** 0.9*** 0.30*** 0.24 0.73*** 0.25*** -0.06
9 Wind Power -0.41*** -0.56*** -0.48*** -0.29*** -0.08 -0.31*** -0.15*** -0.30***
*, **, *** 10%, 5% and 1% significance level; significant changes in bold.
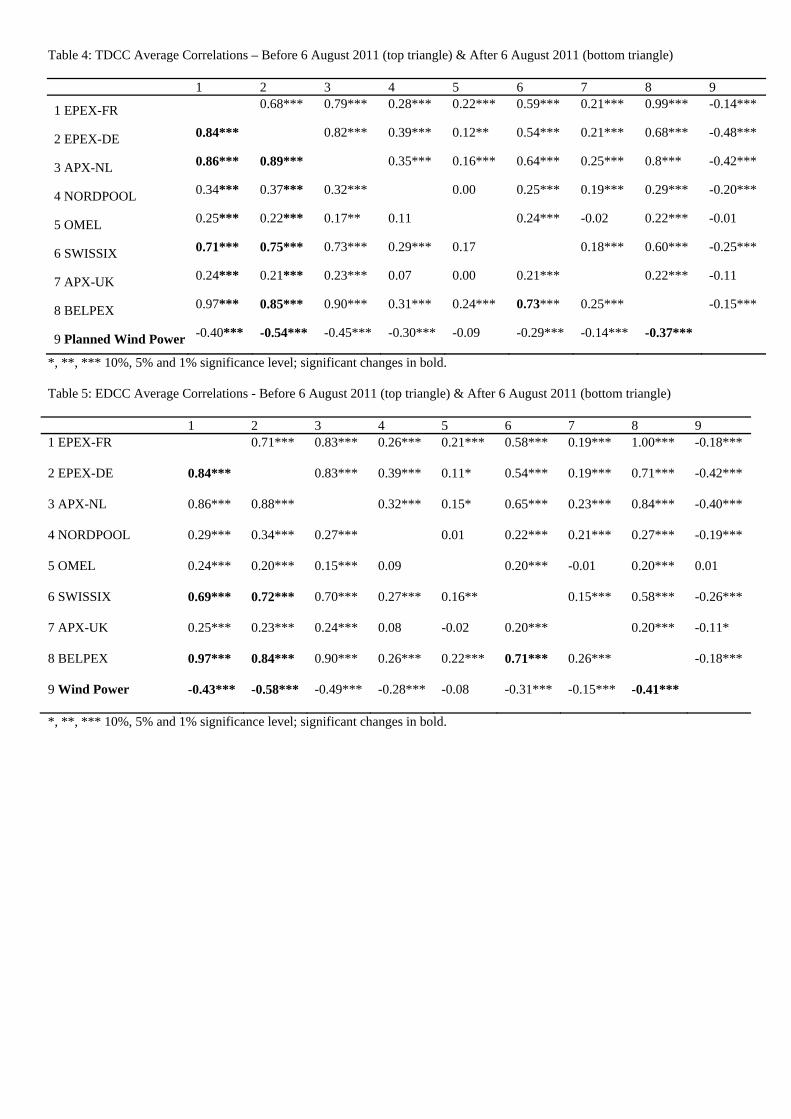
Table 4: TDCC Average Correlations – Before 6 August 2011 (top triangle) & After 6 August 2011 (bottom triangle)
1 2 3 4 5 6 7 8 9
1 EPEX-FR
0.68*** 0.79*** 0.28*** 0.22*** 0.59*** 0.21*** 0.99*** -0.14***
2 EPEX-DE 0.84***
0.82*** 0.39*** 0.12** 0.54*** 0.21*** 0.68*** -0.48***
3 APX-NL 0.86*** 0.89***
0.35*** 0.16*** 0.64*** 0.25*** 0.8*** -0.42***
4 NORDPOOL 0.34*** 0.37*** 0.32*** 0.00 0.25*** 0.19*** 0.29*** -0.20***
5 OMEL 0.25*** 0.22*** 0.17** 0.11 0.24*** -0.02 0.22*** -0.01
6 SWISSIX 0.71*** 0.75*** 0.73*** 0.29*** 0.17 0.18*** 0.60*** -0.25***
7 APX-UK 0.24*** 0.21*** 0.23*** 0.07 0.00 0.21***
0.22*** -0.11
8 BELPEX 0.97*** 0.85*** 0.90*** 0.31*** 0.24*** 0.73*** 0.25***
-0.15***
9 Planned Wind Power -0.40*** -0.54*** -0.45*** -0.30*** -0.09 -0.29*** -0.14*** -0.37***
*, **, *** 10%, 5% and 1% significance level; significant changes in bold.
Table 5: EDCC Average Correlations - Before 6 August 2011 (top triangle) & After 6 August 2011 (bottom triangle)
1 2 3 4 5 6 7 8 9 1 EPEX-FR
0.71*** 0.83*** 0.26*** 0.21*** 0.58*** 0.19*** 1.00*** -0.18***
2 EPEX-DE 0.84***
0.83*** 0.39*** 0.11* 0.54*** 0.19*** 0.71*** -0.42***
3 APX-NL 0.86*** 0.88***
0.32*** 0.15* 0.65*** 0.23*** 0.84*** -0.40***
4 NORDPOOL 0.29*** 0.34*** 0.27***
0.01 0.22*** 0.21*** 0.27*** -0.19***
5 OMEL 0.24*** 0.20*** 0.15*** 0.09
0.20*** -0.01 0.20*** 0.01
6 SWISSIX 0.69*** 0.72*** 0.70*** 0.27*** 0.16**
0.15*** 0.58*** -0.26***
7 APX-UK 0.25*** 0.23*** 0.24*** 0.08 -0.02 0.20***
0.20*** -0.11*
8 BELPEX 0.97*** 0.84*** 0.90*** 0.26*** 0.22*** 0.71*** 0.26***
-0.18***
9 Wind Power -0.43*** -0.58*** -0.49*** -0.28*** -0.08 -0.31*** -0.15*** -0.41***
*, **, *** 10%, 5% and 1% significance level; significant changes in bold.
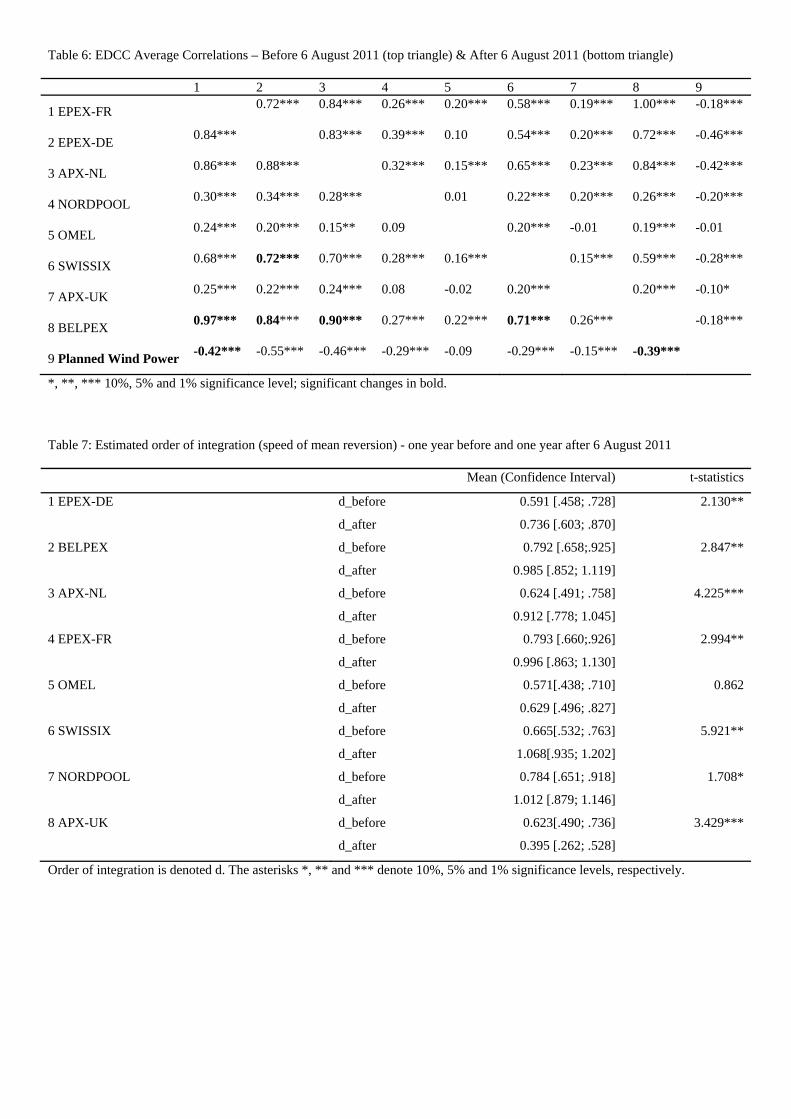
Table 6: EDCC Average Correlations – Before 6 August 2011 (top triangle) & After 6 August 2011 (bottom triangle)
1 2 3 4 5 6 7 8 9
1 EPEX-FR
0.72*** 0.84*** 0.26*** 0.20*** 0.58*** 0.19*** 1.00*** -0.18***
2 EPEX-DE 0.84***
0.83*** 0.39*** 0.10 0.54*** 0.20*** 0.72*** -0.46***
3 APX-NL 0.86*** 0.88***
0.32*** 0.15*** 0.65*** 0.23*** 0.84*** -0.42***
4 NORDPOOL 0.30*** 0.34*** 0.28***
0.01 0.22*** 0.20*** 0.26*** -0.20***
5 OMEL 0.24*** 0.20*** 0.15** 0.09
0.20*** -0.01 0.19*** -0.01
6 SWISSIX 0.68*** 0.72*** 0.70*** 0.28*** 0.16***
0.15*** 0.59*** -0.28***
7 APX-UK 0.25*** 0.22*** 0.24*** 0.08 -0.02 0.20***
0.20*** -0.10*
8 BELPEX 0.97*** 0.84*** 0.90*** 0.27*** 0.22*** 0.71*** 0.26***
-0.18***
9 Planned Wind Power -0.42*** -0.55*** -0.46*** -0.29*** -0.09 -0.29*** -0.15*** -0.39***
*, **, *** 10%, 5% and 1% significance level; significant changes in bold.
Table 7: Estimated order of integration (speed of mean reversion) - one year before and one year after 6 August 2011
Mean (Confidence Interval) t-statistics
1 EPEX-DE d_before 0.591 [.458; .728] 2.130**
d_after 0.736 [.603; .870]
2 BELPEX d_before 0.792 [.658;.925] 2.847**
d_after 0.985 [.852; 1.119]
3 APX-NL d_before 0.624 [.491; .758] 4.225***
d_after 0.912 [.778; 1.045]
4 EPEX-FR d_before 0.793 [.660;.926] 2.994**
d_after 0.996 [.863; 1.130]
5 OMEL d_before 0.571[.438; .710] 0.862
d_after 0.629 [.496; .827]
6 SWISSIX d_before 0.665[.532; .763] 5.921**
d_after 1.068[.935; 1.202]
7 NORDPOOL d_before 0.784 [.651; .918] 1.708*
d_after 1.012 [.879; 1.146]
8 APX-UK d_before 0.623[.490; .736] 3.429***
d_after 0.395 [.262; .528]
Order of integration is denoted d. The asterisks *, ** and *** denote 10%, 5% and 1% significance levels, respectively.
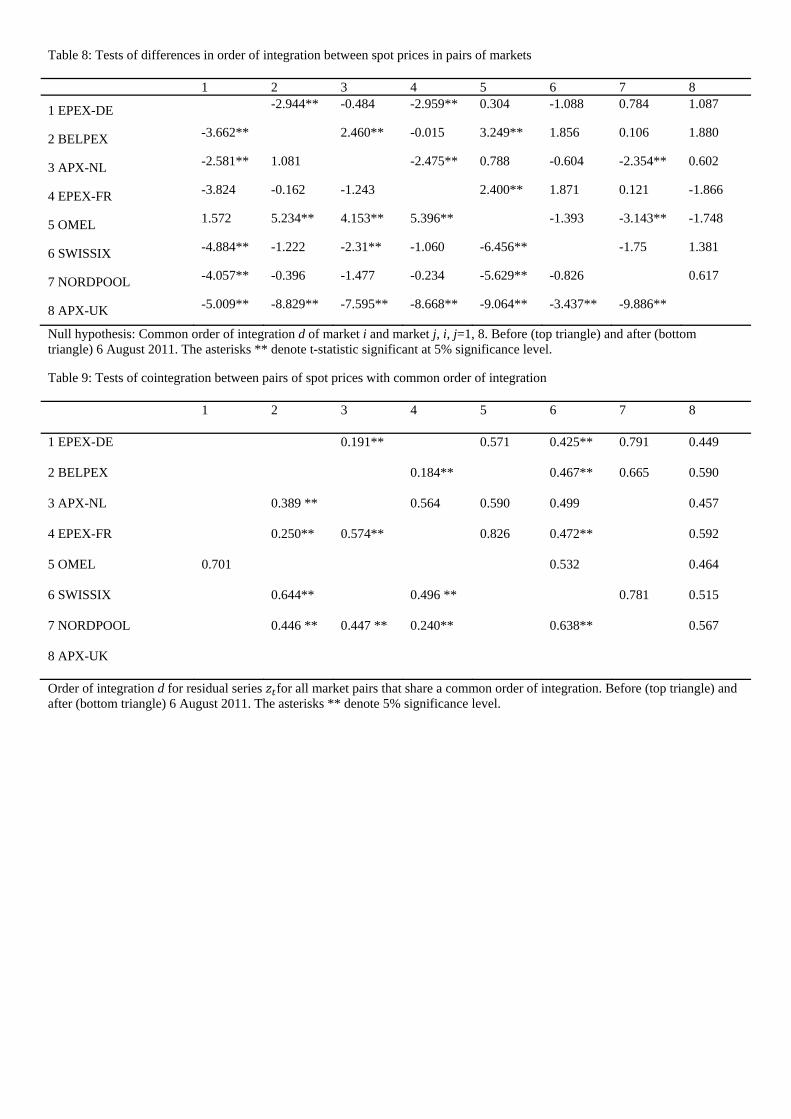
Table 8: Tests of differences in order of integration between spot prices in pairs of markets
1 2 3 4 5 6 7 8
1 EPEX-DE
-2.944** -0.484 -2.959** 0.304 -1.088 0.784 1.087
2 BELPEX -3.662**
2.460** -0.015 3.249** 1.856 0.106 1.880
3 APX-NL -2.581** 1.081 -2.475** 0.788 -0.604 -2.354** 0.602
4 EPEX-FR -3.824 -0.162 -1.243 2.400** 1.871 0.121 -1.866
5 OMEL 1.572 5.234** 4.153** 5.396** -1.393 -3.143** -1.748
6 SWISSIX -4.884** -1.222 -2.31** -1.060 -6.456** -1.75 1.381
7 NORDPOOL -4.057** -0.396 -1.477 -0.234 -5.629** -0.826
0.617
8 APX-UK -5.009** -8.829** -7.595** -8.668** -9.064** -3.437** -9.886**
Null hypothesis: Common order of integration d of market i and market j, i, j=1, 8. Before (top triangle) and after (bottom triangle) 6 August 2011. The asterisks ** denote t-statistic significant at 5% significance level.
Table 9: Tests of cointegration between pairs of spot prices with common order of integration
1 2 3 4 5 6 7 8
1 EPEX-DE
0.191**
0.571 0.425** 0.791 0.449
2 BELPEX
0.184**
0.467** 0.665 0.590
3 APX-NL
0.389 ** 0.564 0.590 0.499
0.457
4 EPEX-FR
0.250** 0.574** 0.826 0.472** 0.592
5 OMEL 0.701
0.532
0.464
6 SWISSIX
0.644**
0.496 ** 0.781 0.515
7 NORDPOOL
0.446 ** 0.447 ** 0.240**
0.638** 0.567
8 APX-UK
Order of integration d for residual series for all market pairs that share a common order of integration. Before (top triangle) and after (bottom triangle) 6 August 2011. The asterisks ** denote 5% significance level.