german real estate market in a good state - … · german real estate market in a good state real...
TRANSCRIPT

GERMAN REAL ESTATE MARKET IN A GOOD STATE
REAL ESTATE MARKET GERMANY 2013 | 2014
A RESEARCH PUBLICATION BY DG HYP OCTOBER 2013


1
Real Estate Market Germany 2013 | 2014
Table of Contents
Preface ___________________________________________________________________ 2
Summary _________________________________________________________________ 3
Economic Conditions in Germany ____________________________________________ 5
German Real Estate Market buoyant compared to the rest of Europe __________ 6
Retail Properties ___________________________________________________________ 10
Office Properties __________________________________________________________ 23
Residential Properties ______________________________________________________ 35
Overview of Forecasts _____________________________________________________ 39
Imprint ___________________________________________________________________ 40
Disclaimer _________________________________________________________________ 40
DG HYP Offices ____________________________________________________________ 41

2
Real Estate Market Germany 2013 | 2014
Preface
As a commercial real estate bank, we support our business divisions and risk manage-ment teams with their credit and lending decisions through regular analysis of the markets we actively cover. We publish the results of our analyses in commercial real estate market reports, targeting investors as well as our partners within the Coopera-tive Financial Services Network: these are German cooperative banks, with whom we jointly originate financings in the various regions.
The present report continues our series of studies concerning the German real estate market, published in the autumn of each year. This research study looks at market developments for retail, office and residential real estate during 2013, and provides an outlook for 2014.
Our analysis has shown that the German commercial real estate market in the prime locations of Hamburg, Berlin, Cologne, Dusseldorf, Frankfurt, Stuttgart and Munich is in a good state. Whilst the euro debt crisis and the recession in the euro zone have left their marks on the German economy as well, economic momentum has been driven especially by the domestic economy, helped by a benign labour market and rising personal incomes. On the real estate market, these favourable developments translate into rising rents for the three market segments we have analysed: retail, office and residential. Economic recovery is expected to continue during the second half of the year: hence, the chances are good that the positive trend on real estate markets is set to prevail.
In a European context, top locations in Germany have thus shown above-average per-formance. Thanks to unabated interest from domestic as well as international investors in German commercial real estate, Germany has seen a marked increase in its market share amongst the five major European real estate markets (Germany plus the United Kingdom, France, Italy and Spain). In fact, the share of Germany in aggregate invest-ments in these five countries (excluding residential portfolios) rose from around 20 per cent in 2009 to as much as 30 per cent last year.
The German real estate market report is of course also available in German. All pre-viously published DG HYP market reports can be downloaded from our website (on www.dghyp.de/en/unternehmen/market-research; contact us if you prefer a printed version.
Deutsche Genossenschafts-Hypothekenbank AG
October 2013

3
Real Estate Market Germany 2013 | 2014
SUMMARY
» The German commercial real estate market remains buoyant in the seven top locations reviewed - Berlin, Dusseldorf, Frankfurt, Hamburg, Cologne, Munich and Stuttgart. The euro debt crisis and the recession in the eurozone have also had a negative impact on the German economy. However, the robust labour market with almost 42 million people in employment is ensuring good demand for office space. Rising wages are supporting the retail sector and helping private households to pay increasing rents.
» The positive conditions are reflected in rising rents in the three market segments considered - retail, office and residential. The top German locations are thus outperforming by European standards, as evident from our comparison of important European real estate markets.
» The German economy has now emerged from the lean period at the end of 2012 / beginning of 2013, returning to positive growth again in the spring. The domestic economy in particular is recovering and is driving the economy for-ward. Despite the strained conditions affecting other countries, the economic recovery is likely to continue in the second half. Sentiment indicators for com-panies, such as the ifo business climate, have therefore shown positive read-ings in recent months. There is therefore a good chance that the positive sentiment will also continue in the real estate market.
RETAIL PROPERTIES
Change in rent in % y-o-y
Prime rents in EUR per sqm
2012 2013e 2014e 2012 2013e 2014e
Berlin 6.7 5.0 3.2 240 252 260
Cologne 4.4 2.1 2.1 235 240 245
Dusseldorf 1.4 4.5 4.3 220 230 240
Frankfurt 3.9 1.9 1.9 265 270 275
Hamburg 4.3 4.1 2.0 245 255 260
Munich 3.4 3.3 3.2 305 315 325
Stuttgart 0.0 3.6 3.0 225 233 240
Average for top locations 4.6 3.9 2.8 248 258 265
Source: BulwienGesa, Feri, DZ BANK Research forecast
» While retail sales are growing only slightly despite the positive economic condi-tions, central shopping areas in prime locations are enjoying a high level of popularity. This is being boosted by the purchasing power of tourists and busi-ness travellers. Retail space in the 1A sites of top locations therefore remains attractive to, and is generating strong demand from national and international chain stores as well as mono-label and flagship stores. However, the volume of space in these locations is severely limited.
» Prime rents in prime locations are therefore continuing to rise. Average rents of almost EUR 260 per sqm are being paid this year. The upward pace is however likely to weaken slightly as a result of the economic slowdown and the high level of rents.
4
Real Estate Market Germany 2013 | 2014
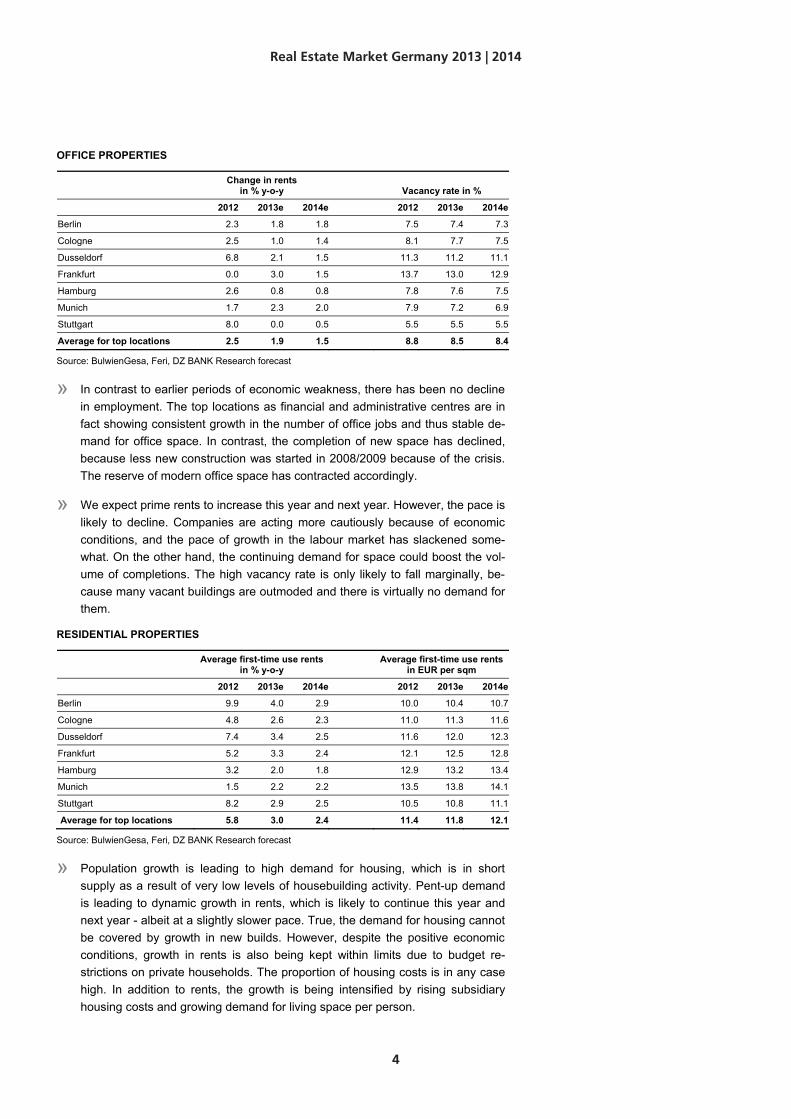
OFFICE PROPERTIES
Change in rents in % y-o-y Vacancy rate in %
2012 2013e 2014e 2012 2013e 2014e
Berlin 2.3 1.8 1.8 7.5 7.4 7.3
Cologne 2.5 1.0 1.4 8.1 7.7 7.5
Dusseldorf 6.8 2.1 1.5 11.3 11.2 11.1
Frankfurt 0.0 3.0 1.5 13.7 13.0 12.9
Hamburg 2.6 0.8 0.8 7.8 7.6 7.5
Munich 1.7 2.3 2.0 7.9 7.2 6.9
Stuttgart 8.0 0.0 0.5 5.5 5.5 5.5
Average for top locations 2.5 1.9 1.5 8.8 8.5 8.4
Source: BulwienGesa, Feri, DZ BANK Research forecast
» In contrast to earlier periods of economic weakness, there has been no decline in employment. The top locations as financial and administrative centres are in fact showing consistent growth in the number of office jobs and thus stable de-mand for office space. In contrast, the completion of new space has declined, because less new construction was started in 2008/2009 because of the crisis. The reserve of modern office space has contracted accordingly.
» We expect prime rents to increase this year and next year. However, the pace is likely to decline. Companies are acting more cautiously because of economic conditions, and the pace of growth in the labour market has slackened some-what. On the other hand, the continuing demand for space could boost the vol-ume of completions. The high vacancy rate is only likely to fall marginally, be-cause many vacant buildings are outmoded and there is virtually no demand for them.
RESIDENTIAL PROPERTIES
Average first-time use rents in % y-o-y
Average first-time use rents in EUR per sqm
2012 2013e 2014e 2012 2013e 2014e
Berlin 9.9 4.0 2.9 10.0 10.4 10.7
Cologne 4.8 2.6 2.3 11.0 11.3 11.6
Dusseldorf 7.4 3.4 2.5 11.6 12.0 12.3
Frankfurt 5.2 3.3 2.4 12.1 12.5 12.8
Hamburg 3.2 2.0 1.8 12.9 13.2 13.4
Munich 1.5 2.2 2.2 13.5 13.8 14.1
Stuttgart 8.2 2.9 2.5 10.5 10.8 11.1
Average for top locations 5.8 3.0 2.4 11.4 11.8 12.1
Source: BulwienGesa, Feri, DZ BANK Research forecast
» Population growth is leading to high demand for housing, which is in short supply as a result of very low levels of housebuilding activity. Pent-up demand is leading to dynamic growth in rents, which is likely to continue this year and next year - albeit at a slightly slower pace. True, the demand for housing cannot be covered by growth in new builds. However, despite the positive economic conditions, growth in rents is also being kept within limits due to budget re-strictions on private households. The proportion of housing costs is in any case high. In addition to rents, the growth is being intensified by rising subsidiary housing costs and growing demand for living space per person.

5
Real Estate Market Germany 2013 | 2014
ECONOMIC CONDITIONS IN GERMANY
ECONOMIC FORECAST GERMANY
in % y-o-y 2011 2012 2013e 2014e
GDP 3.3 0.7 0.6 2.0
Private consumption 2.4 0.7 0.9 1.4
Public consumption 1.1 1.0 0.8 1.0
Investment 6.9 -2.1 -1.4 4.5
Exports 8.0 3.3 1.4 7.8
Imports 7.4 1.4 2.1 8.4
Inflation rate (HVPI) 2.5 2.1 1.7 2.1
Unemployment rate (BA) 7.1 6.8 6.9 6.8
Budget balance in % of GDP -0.8 0.2 0.1 0.3
Source: DZ BANK Research
The German economy has now emerged from the lean period at the end of 2012 / beginning of 2013, returning to positive growth again in the spring. GDP increased by 0.7 per cent in the second quarter after stagnating at the beginning of 2013. The German economy in particular is recovering and is driving the economy forward. However, the external economic environment remains strained due to the ongoing negative effects of the eurozone crisis and the difficulties in some other regions of the world. The signs are that the recovery will continue in the second half. Sentiment indicators for economies, such as the ifo business climate, have shown a positive trend in recent months, and companies are more confident again about their business prospects. Private households are also showing optimism in surveys. The positive employment situation and income growth are providing stable conditions for private consumer spending. We expect macroeconomic growth of 0.6 per cent this year and, on average, stronger annual growth of two per cent in 2014. The unemployment rate - which has increased slightly this year - is likely to return to its 2012 level next year.
GDP GROWTH Y-O-Y IN PER CENT UNEMPLOYMENT RATE IN PER CENT
Source: DZ BANK Source: DZ BANK
-6
-4
-2
0
2
4
6
2002 2004 2006 2008 2010 2012 2014e
Germany
Eurozone5
6
7
8
9
10
11
12
13
2002 2004 2006 2008 2010 2012 2014e
Germany
Eurozone
German economy emerges from lean period
Indicators point to continuing recovery
6
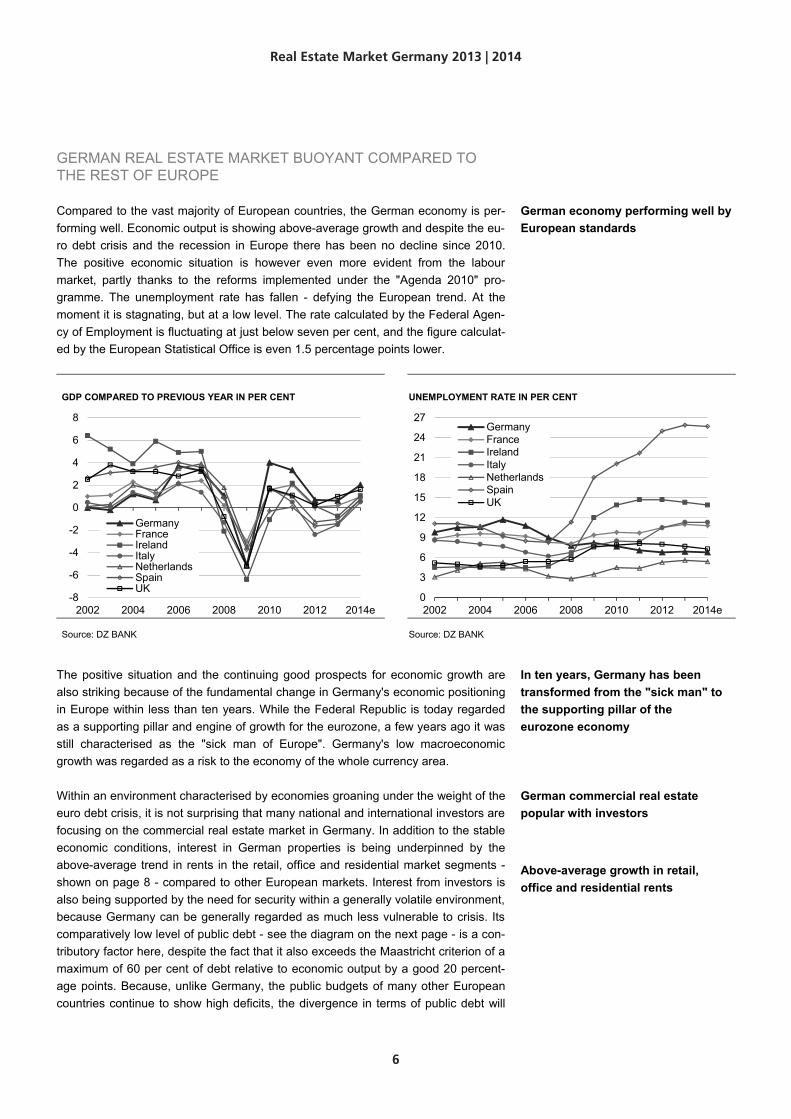
GERMAN REAL ESTATE MARKET BUOYANT COMPARED TO THE REST OF EUROPE
Compared to the vast majority of European countries, the German economy is per-forming well. Economic output is showing above-average growth and despite the eu-ro debt crisis and the recession in Europe there has been no decline since 2010. The positive economic situation is however even more evident from the labour market, partly thanks to the reforms implemented under the "Agenda 2010" pro-gramme. The unemployment rate has fallen - defying the European trend. At the moment it is stagnating, but at a low level. The rate calculated by the Federal Agen-cy of Employment is fluctuating at just below seven per cent, and the figure calculat-ed by the European Statistical Office is even 1.5 percentage points lower.
GDP COMPARED TO PREVIOUS YEAR IN PER CENT UNEMPLOYMENT RATE IN PER CENT
Source: DZ BANK Source: DZ BANK
The positive situation and the continuing good prospects for economic growth are also striking because of the fundamental change in Germany's economic positioning in Europe within less than ten years. While the Federal Republic is today regarded as a supporting pillar and engine of growth for the eurozone, a few years ago it was still characterised as the "sick man of Europe". Germany's low macroeconomic growth was regarded as a risk to the economy of the whole currency area.
Within an environment characterised by economies groaning under the weight of the euro debt crisis, it is not surprising that many national and international investors are focusing on the commercial real estate market in Germany. In addition to the stable economic conditions, interest in German properties is being underpinned by the above-average trend in rents in the retail, office and residential market segments - shown on page 8 - compared to other European markets. Interest from investors is also being supported by the need for security within a generally volatile environment, because Germany can be generally regarded as much less vulnerable to crisis. Its comparatively low level of public debt - see the diagram on the next page - is a con-tributory factor here, despite the fact that it also exceeds the Maastricht criterion of a maximum of 60 per cent of debt relative to economic output by a good 20 percent-age points. Because, unlike Germany, the public budgets of many other European countries continue to show high deficits, the divergence in terms of public debt will
-8
-6
-4
-2
0
2
4
6
8
2002 2004 2006 2008 2010 2012 2014e
GermanyFranceIrelandItalyNetherlandsSpainUK
0
3
6
9
12
15
18
21
24
27
2002 2004 2006 2008 2010 2012 2014e
GermanyFranceIrelandItalyNetherlandsSpainUK
German economy performing well by European standards
In ten years, Germany has been transformed from the "sick man" to the supporting pillar of the eurozone economy
German commercial real estate popular with investors
Above-average growth in retail, office and residential rents
Real Estate Market Germany 2013 | 2014

7
also continue to grow. There is therefore a good chance that Germany will remain one of the small group of countries awarded top ratings by the rating agencies Standard & Poor‘s, Moody’s and Fitch.
PUBLIC DEBT RELATIVE TO GDP IN PER CENT NEW DEBT RELATIVE TO GDP IN PER CENT
Source: DZ BANK Source: DZ BANK
Interest from investors in the German commercial real estate market is evident from the disproportionate growth in investment volume, which is shown in the diagrams on the next page. Housing portfolios are not included. The German proportion of in-vestment volume in the five countries - apart from Germany, these are France, the UK, Italy and Spain - has increased since 2009 from around 20 per cent to 30 per cent last year. This corresponds to a volume of around EUR 25bn. On the other hand, the figure has fallen in the periphery countries Italy and Spain. These two countries jointly do not even account for a proportion of five per cent. Although the volume relating to the UK - the largest commercial real estate market in Europe - has grown strongly, in relative terms the large British proportion has however de-clined slightly. France, the third largest European market for commercial real estate, performed well up to 2011. However, since last year, the weak economic situation and the backlog of reforms of the Socialist government led by President Hollande have had an impact. Consequently, investment volume in France declined in 2012, with the proportion relative to the market down again to just below 20 per cent.
Investment volume in the German commercial real estate sector is likely to exceed the previous year's level again this year, although no major surges are expected. Continuing strong demand from investors for lower-risk "core properties" accounts for only a small proportion of the market, and the number of transactions is therefore small. Although demand is picking up in the higher-risk "value added" and "opportun-istic" market segments as risk aversion eases, the limited amount of financing avail-able here is an obstacle to high volumes. In terms of types of property, in 2012, office space, which accounted for some 45 per cent of German investment volume, replaced retail space - which had been the frontrunner up to 2011.
60
70
80
90
100
110
120
130
140
DE FR IE IT NL ES UK
2011201220132014
Maastricht threshold: 60%
-15
-12
-9
-6
-3
0
3DE FR IE IT NL ES UK
2011201220132014 Maastricht threshold: -3%
Germany's market share has increased visibly
In 2012, investment in German commercial real estate reached EUR 25bn, and should increase slightly in 2013
Real Estate Market Germany 2013 | 2014

8
INVESTMENT IN COMMERCIAL PROPERTIES BY VOLUME AND … … AS A PROPORTION IN THE COUNTRIES REVIEWED
Source: BNPP Real Estate Source: BNPP Real Estate, own calculations
The shift in country weighting by investors within Europe due to varying economic trends has also been reflected in the rental yields on commercial properties. However, the range of about 100 basis points between the countries is fairly stable. In line with the varying tends in prices and rents, the sequence of the countries has however undergone a shift. Of the five countries already mentioned, Germany has shown the lowest level of average rental yield since 2009 due to the more moderate risk assessment for both retail and office property. Interestingly, the risk premium for Spanish commercial properties of a good 100 basis points is significantly lower than the yield divergence between German and Spanish sovereign bonds, which is currently about 250 basis points.
RETAIL: RENTAL YIELD FOR TOP LOCATIONS IN PER CENT OFFICE: RENTAL YIELD FOR TOP LOCATIONS IN PER CENT
Source: Feri Source: Feri
0
5
10
15
20
25
30
35
40
45
2009 2010 2011 2012
inve
stm
ent v
olum
e in
EU
R b
n
Germany
France
Italy
Spain
UK
0
10
20
30
40
50
60
2009 2010 2011 2012
shar
e in
%
Germany
France
Italy
Spain
UK
4,0
4,5
5,0
5,5
6,0
6,5
7,0
7,5
02 03 04 05 06 07 08 09 10 11 12 13e
GermanyFranceItalySpainUKaverage
4,0
4,5
5,0
5,5
6,0
6,5
7,0
7,5
02 03 04 05 06 07 08 09 10 11 12 13e
GermanyFranceItalySpainUKaverage
Retail and office: rental yield lowest for German properties
Real Estate Market Germany 2013 | 2014

9
Comparison of European retail, office and residential rents
RETAIL: PRIME RENTS AS INDEX (2002 = 100) AND … … COMPARED TO PREVIOUS YEAR IN PER CENT
Source: Feri, own calculations Source: Feri, own calculations
OFFICE: PRIME RENTS AS INDEX (2002 = 100) AND … … COMPARED TO PREVIOUS YEAR IN PER CENT
Source: Feri, own calculations Source: Feri, own calculations
RESIDENTIAL: PRIME RENTS AS INDEX (2002 = 100) AND … … COMPARED TO PREVIOUS YEAR IN PER CENT
Source: Feri, own calculations Source: Feri, own calculations
80
90
100
110
120
130
140
150
160
170
2002 2004 2006 2008 2010 2012
prim
e re
nt 2
002
= 10
0
DE Top-7
Amsterdam
Brussels
Dublin
London
Madrid
Paris
Rome
Vienna
-15
-10
-5
0
5
10
15
2008 2009 2010 2011 2012pr
ime
rent
YO
Y in
%
DE Top-7
Amsterdam
Brussels
Dublin
London
Madrid
Paris
Rome
Vienna
60
70
80
90
100
110
120
130
2002 2004 2006 2008 2010 2012
prim
e re
nt 2
002
= 10
0
DE Top-7
Amsterdam
Brussels
Dublin
London
Madrid
Paris
Rome
Vienna
-25
-20
-15
-10
-5
0
5
10
15
2008 2009 2010 2011 2012
prim
e re
nt Y
OY
in %
DE Top-7
Amsterdam
Brussels
Dublin
London
Madrid
Paris
Rome
Vienna
70
80
90
100
110
120
130
140
2002 2004 2006 2008 2010 2012
prim
e re
nt 2
002
= 10
0
DE Top-7
Amsterdam
Brussels
Dublin
London
Madrid
Paris
Rome
Vienna
-15
-10
-5
0
5
10
2008 2009 2010 2011 2012
prim
e re
nt Y
OY
in %
DE Top-7
Amsterdam
Brussels
Dublin
London
Madrid
Paris
Rome
Vienna
Real Estate Market Germany 2013 | 2014

10
RETAIL PROPERTIES
Conditions for the German retail sector are in fact good. Although macroeconomic growth is currently relatively low, this is having little impact on private households. In fact the opposite is the case: the economic slowdown is having virtually no impact on the robust labour market, and - in contrast to large parts of the eurozone - consum-ers are benefiting from distinctly low unemployment and growing wages. Against this background, there is a positive trend in the consumer climate despite the rampant euro debt crisis.
LABOUR MARKET CREATES GOOD CONDITIONS FOR RETAIL CONSUMER CONFIDENCE AT A RELATIVELY HIGH LEVEL
Source: Feri Source: GfK
However, these generally favourable conditions for consumption are having virtually no impact on the German retail sector. Almost all of the growth in retail sales currently evident is being offset by price increases. Growth is reported only in e-commerce, and high-street retail sales are therefore falling in real terms.
GROWTH IN THE RETAIL SECTOR ONLY IN E-COMMERCE … … AND RETAIL SPACE
Source: HDE excl. vehicles, fuel, pharmacies Source: HDE, own calculations, sales adjusted for e-commerce
0,0
1,0
2,0
3,0
4,0
5,0
6,0
7,0
6,0
7,0
8,0
9,0
10,0
11,0
12,0
13,0
14,0
1998 2001 2004 2007 2010 2013
hourly wages YOY in % (rhs)unemployment rate in % (lhs)
-4
0
4
8
12
16
20
2001 2003 2005 2007 2009 2011 2013
GfK consumer climate Germany
0
10
20
30
40
50
0
100
200
300
400
500
00 01 02 03 04 05 06 07 08 09 10 11 12 13e
e-co
mm
erce
sal
es in
EU
R b
n
reta
il sa
les
in E
UR
bn
retail sales (lhs)e-commerce sales (rhs)
3.000
3.200
3.400
3.600
3.800
4.000
105
110
115
120
125
130
00 01 02 03 04 05 06 07 08 09 10 11 12
reta
il sa
les
per s
qm in
EU
R
in m
illio
n sq
m
retail space (lhs)retail sales per sqm (rhs)
Despite economic slowdown, conditions for German retail sector are good …
… but little benefit for retail sales
Real Estate Market Germany 2013 | 2014

11
The downward trend in shop sales is in contrast with the almost continuous growth in retail space. Average sales in EUR per sqm of retail space - sales productivity - has consequently fallen nominally by about 13 per cent since 2000. Adjusted for in-flation, the decline in sales per sqm of retail space is almost 30 per cent. This trend shows that conditions for retail property are fairly weak based on the German retail sector as a whole due to the contracting scope for rent payments.
However, this trend does not relate to the whole retail sector. There is a completely different picture in the 1A sites of top locations. Since the end of the 1990s, prime rents in city centre shopping malls and attractive shopping centres in the seven cities have increased sharply. Nor is there any sign of this trend ending. Demand for at-tractive retail space - particularly from national and international store chains - exceeds the limited supply of available space here. Existing tenants will often only give up their retail space in return for corresponding "key money" payments. New space is often fully pre-let well before the new retail properties have been completed - even in large city centre shopping centres, such as the new "Skyline Plaza" centre which opened in Frankfurt at the end of August.
In contrast, the trend in rents in 1A locations in other large German cities is weaker. Here, rents are currently only slightly higher than those paid at the beginning of the 1990s. In contrast, rents in top locations have increased by around 50 per cent in the same period. However, secondary locations in city centres are not benefiting from the growth in prime rents. Here the rent level is stable in both top locations and also in regional centres. Store chains are showing virtually no inclination to move to sec-ondary locations - in response to high rents for 1A retail space or a lack of supply.
PRIME RENTS INCREASING MAINLY IN TOP LOCATIONS VIRTUALLY NO BENEFIT FOR SECONDARY LOCATIONS
Source: BulwienGesa, own calculations, DZ BANK Research forecast Source: BulwienGesa, own calculations, DZ BANK Research forecast
The positive trend in 1A city centre locations is based on various factors which have enhanced the potential of this retail space in recent years. These include a change in the way in which many customers shop, for example, on the one hand ordering goods via e-commerce, but on the other hand still wanting to go on a shopping trip since this enables them to "experience" products directly and obviously offers a posi-tive leisure experience. City centres are meeting this demand by providing attractive pedestrian zones and chic city-centre shopping centres with a broad range of chain
80
100
120
140
160
180
200
220
240
260
280
92 94 96 98 00 02 04 06 08 10 12 14e
prim
e re
nt in
EU
R p
er s
qm
Top-7 Regional-12
5
10
15
20
25
30
35
92 94 96 98 00 02 04 06 08 10 12 14e
rent
sec
onda
ry lo
catio
nin
EU
R p
er s
qm
Top-7 Regional-12
Expansion of retail space on the back of falling retail sales leads to a decline in sales productivity
1A sites in prime locations remain positive
Retail rents in top locations increasing faster than in regional centres
1A sites in prime locations benefit from shopping behaviour
Real Estate Market Germany 2013 | 2014

12
stores, mono-label and flagship stores. Leisure activities are enhanced, for example, by restaurants, fitness and wellness facilities and cinemas. Chain stores and manu-facturers are responding to the "hybrid" shopping behaviour with a multi-channel strategy consisting of a parallel focus on online sales and actually visiting 1A loca-tions ("clicks and bricks"). This applies particularly to the top locations which are pre-ferred by chain stores and branded goods suppliers because of their potential. This ensures a broader than average range of products, which in turn attracts customers.
Customer potential in the top locations has also increased steadily in recent years due to the growing number of residents (see page 36). An increase in the number of visits by affluent foreign tourists and business travellers is also generating further demand. Not without reason has the abovementioned Skyline Plaza been built in direct proximity to the Frankfurt Trade Fair.
The abovementioned developments seem to be having a similar impact in the seven top locations - as suggested at least by the trend in rents. The range of the increase in prime rents is therefore relatively small. The much weaker growth in Stuttgart is likely to be connected with the disproportionately negative impact of the economic crisis of 2008 and 2009 on the city where there is a heavy emphasis on industry. With the exception of Munich, the rent level also fluctuates only slightly around the average prime rent of currently approx. EUR 250 per sqm. The capital of Bavaria provides evidence of the excellent prospects for the retail sector with prime rents now in excess of EUR 300 per sqm.
MUNICH STILL THE CLEAR LEADER IN RETAIL TERMS RELATIVELY SMALL DIFFERENCES IN RENT TRENDS SINCE 2007
Source: BulwienGesa, own calculations, DZ BANK Research forecast Source: BulwienGesa, own calculations
Total retail space in the seven top locations varies between 1m sqm in Stuttgart and about 6m sqm in Berlin. Although total retail space is heavily dependent on the population of the city, there are nevertheless major differences on a per capita basis. The range extends from just under 1.4 sqm in Cologne to just over two sqm in Dusseldorf and Frankfurt. As we have already described above, per capita retail space has also increased significantly in the top locations in recent years. The differences in per capita retail space have increased considerably since 2002. However, this does not apply to Cologne - where relative retail space has remained virtually unchanged.
120140160180200220240260280300320340
92 94 96 98 00 02 04 06 08 10 12 14e
EU
R p
er s
qm
B
D
F
HH
K
M
S
Top-77,1
14,615,8
17,1 17,2 17,319,5
23,3
S K D B Top-7 M HH F
prime rent growth 2007-2012 in %
Purchasing power increases due to population growth and visitors
Trend in retail rents very similar in individual top locations
Per capita retail space in top locations has increased visibly in the last ten years
K = Cologne
Real Estate Market Germany 2013 | 2014

13
RETAIL: TOTAL RETAIL SPACE … … AND PER CAPITA IN SQM
Source: Feri, Comfort K = Cologne Source: Feri, own calculations K = Cologne
The range of the proportions of retail space close to city centres is even wider than for relative retail space and varies from about ten to 40 per cent. A high proportion indicates that city centre retail has a relatively high level of attractiveness in the respective location. However, this also reflects the extent to which large shopping centres have been constructed perhiperal to the city centre area.
Apart from Cologne, where retail space has not even grown by ten per cent, retail space has increased by 30 to just over 40 per cent in the last ten years depending on the top location. As a result of this strong growth in retail space, Cologne is the only city where retail sales have grown more strongly than retail space. While the divergence in Hamburg and Munich is still relatively small, sales growth in Dussel-dorf is lagging well behind the level of growth in retail space. However, the figures relate to the retail sector as a whole, and only limited conclusions can therefore be drawn concerning the situation in city areas. This also applies to the sales productivi-ty figures shown below on the right, which are comparatively low in Dusseldorf and Stuttgart. Nevertheless, it indicates a connection with prime rents which are lowest in Dusseldorf and Stuttgart. This does not however apply to Berlin. Here sales produc-tivity is still much lower, while prime rents are higher than in Dusseldorf and Stuttgart. Given the particularly small proportion of retail activity close to the city cen-tre in Berlin, it is nevertheless likely that the situation in the central area, and particu-larly in 1A locations, is in no way fully reflected in the average sales productivity figures for the location as a whole.
0
5
10
15
20
25
30
35
40
0
1
2
3
4
5
6
7
8
B HH M F K D S Top-7sh
are
in %
reta
il sp
ace
in s
qm m
retail space in sqm m (lhs) share of city center (rhs)
1,0
1,2
1,4
1,6
1,8
2,0
2,2
K M S HH B D F Top-7
reta
il sp
ace
per c
apita
in s
qm
2012 2002
Proportion of retail space close to city centres now between 10 and 40 per cent
Retail space has grown by up to 40 per cent in ten years
Real Estate Market Germany 2013 | 2014

14
GROWTH IN RETAIL RETAIL SPACE IN TOP LOCATIONS DECLINE IN SALES PRODUCTIVITY HAS EASED
Source: Feri, own calculations K = Cologne Source: Feri, own calculations *) in prices from 2000 K = Cologne
As expected, the figures for purchasing power and centrality for the top locations show above-average levels. Only in Berlin is purchasing power below the average level for Germany. This reflects the still low economic power of the German capital. In contrast, purchasing power in Munich is well above average, underlining the city's above-average attractions as a retail location. In terms of centrality, Dusseldorf, Co-logne and Stuttgart show particularly high levels.
MUNICH HAS BY FAR THE HIGHEST PURCHASING POWER , … STUTTGART TOP OF THE LEAGUE IN TERMS OF CENTRALITY
Source: Comfort, own calculations K = Cologne Source: Comfort, own calculations K = Cologne
05
101520253035404550
K S M HH B F D Top-7
grow
th fr
om 2
002
to 2
012
in %
growth of retail space growth of retail sales
2.000
2.500
3.000
3.500
4.000
4.500
5.000
5.500
6.000
6.500
92 94 96 98 00 02 04 06 08 10 12
EU
R p
er s
qm *)
B DF HHK MS Top-7
90
95
100
105
110
115
120
125
130
B HH K S F D M Top-7
purc
hasi
ng p
ower
inde
x
German average
90
95
100
105
110
115
120
125
130
B F HH M D K S Top-7
cent
ralit
y in
dex German average
Retail figures for top locations mainly positive
Real Estate Market Germany 2013 | 2014
15
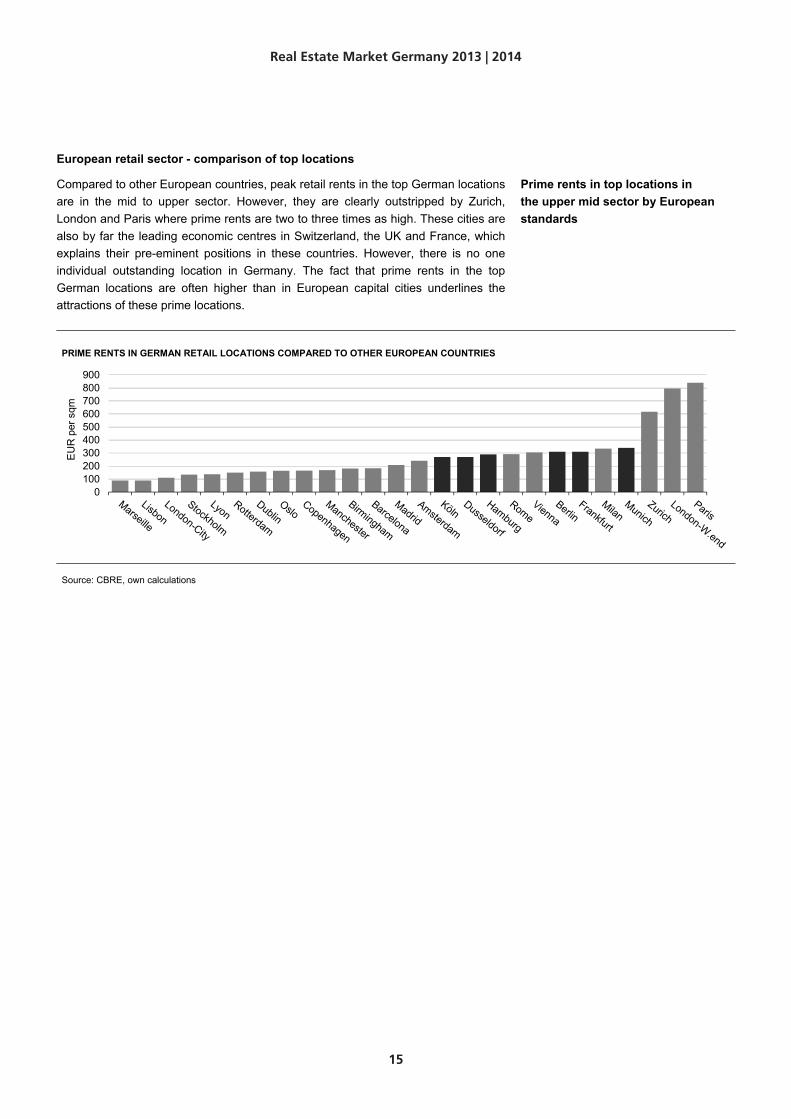
European retail sector - comparison of top locations
Compared to other European countries, peak retail rents in the top German locations are in the mid to upper sector. However, they are clearly outstripped by Zurich, London and Paris where prime rents are two to three times as high. These cities are also by far the leading economic centres in Switzerland, the UK and France, which explains their pre-eminent positions in these countries. However, there is no one individual outstanding location in Germany. The fact that prime rents in the top German locations are often higher than in European capital cities underlines the attractions of these prime locations.
PRIME RENTS IN GERMAN RETAIL LOCATIONS COMPARED TO OTHER EUROPEAN COUNTRIES
Source: CBRE, own calculations
0100200300400500600700800900
EU
R p
er s
qm
Prime rents in top locations in the upper mid sector by European standards
Real Estate Market Germany 2013 | 2014

16
Berlin: retail properties
PRIME RENTS IN EUR PER SQM PER CAPITA RETAIL SPACE IN SQM
Source: BulwienGesa, DZ BANK Research forecast Source: Feri
With retail space of 6m sqm, Berlin is the leader in Germany; however, based on a population of 3.5m people, retail sales are low. Per sqm, the city achieves only 70 per cent of the average figure for top locations, probably attributable mainly to low incomes and high unemployment. However, this weakness of the location does not have a negative impact on top retail locations, which are performing very well. De-mand far exceeds the supply of retail space, thus ensuring steady growth in prime rents, which are likely to top the level of EUR 250 per sqm this year. Retail activity in Berlin benefits more strongly than other top locations from its function as a test market for Germany. In addition to the size of the market, the location also benefits from a positive economic trend which has been ongoing for some time, and from the high and growing number of tourists, whose purchases account for a good quarter of retail sales in Berlin. The micro locations around Hackescher Markt and Alexanderplatz are also showing dynamic growth. The upgrading of Ku'damm, for example with Haus Cumberland, is also positive. Demand for retail space in top locations is likely to continue, and prime rents will therefore increase further. RETAIL PROPERTIES IN BERLIN
2011 2012 2013e 2014e
Demand
Per capita disp. income in EUR/month 1,191 1,200 1,211 1,227
Per capita disp. income in % y-o-y 0.6 0.7 0.9 1.3
Unemployment rate (BA) in % 13.3 12.3 12.6 12.3
Retail sales in % y-o-y 1.2 1.9 2.1 2.6
Supply
Retail space in m sqm 5.9 6.0 6.1 6.3
Retail space in % y-o-y 0.4 1.6 2.8 2.4
Retail rents
Prime / secondary locations in EUR/sqm 225 / 14.0 240 / 14.0 252 / 14.0 260 / 14.0
Prime / secondary locations in % y-o-y 4.7 / 0.0 6.7 / 0.0 5.0 / 0.0 3.2 / 0.0
Source: Feri, BulwienGesa, BA, DZ BANK Research forecast 12 regional centres: Augsburg, Bre-men, Darmstadt, Dresden, Essen, Hannover, Karlsruhe, Leipzig, Mainz, Mannheim, Münster, Nuremberg
50
100
150
200
250
300
350
2004 2006 2008 2010 2012 2014e
Berlin Top-7 Regional-121,2
1,4
1,6
1,8
2,0
2,2
2,4
2004 2006 2008 2010 2012 2014e
Berlin Top-7 Regional-12
Largest German retail location with relatively low purchasing power
Tourists an important demand group in Berlin
Real Estate Market Germany 2013 | 2014

17
Cologne: retail properties
PRIME RENTS IN EUR PER SQM PER CAPITA RETAIL SPACE IN SQM
Source: BulwienGesa, DZ BANK Research forecast Source: Feri
The fourth largest German city is one of the most popular shopping destinations. Co-logne has two of the top 5 most frequented shopping streets in Germany with Schildergasse and Hohe Straße. In contrast to Dusseldorf, some 40 kilometres away, where the emphasis is on luxury brands, the city centre of Cologne is geared much more to "mainstream" consumption. There are shops with expensive products, but these are not grouped in one area. Interest is therefore focused mainly on the retail space of national and international chains and mono-label stores. It is striking that the growth of around seven per cent in retail space in the last ten years has been much slower than the average rate of increase of 30 per cent reported for top locations. Amongst the top locations, Cologne therefore has the lowest per capita retail space of less than 1.4 sqm. The proportion of retail space in the city centre is also below-average at 19 per cent. Since, apart from the revitalisation of the Neumarkt-Galerie, no major projects are planned, there is no sign of any visible expansion of the retail space on offer close to the city centre. Consequently, demand from potential tenants can still not be met. This year and next year we expect prime rents to increase by just under two per cent respectively.
RETAIL PROPERTIES IN COLOGNE
2011 2012 2013e 2014e
Demand
Per capita disp. income in EUR/month 1,529 1,552 1,566 1,584
Per capita disp. income in % y-o-y 1.3 1.5 0.9 1.1
Unemployment rate (BA) in % 9.6 9.5 9.8 9.5
Retail sales in % y-o-y 1.7 2.8 2.2 2.5
Supply
Retail space in m sqm 1.4 1.4 1.4 1.4
Retail space in % y-o-y 0.0 0.1 0.3 0.4
Retail rents
Prime / secondary locations in EUR/sqm 225 / 12.0 235 / 12.0 240 / 12.0 245 / 12.0
Prime / secondary locations in % y-o-y 2.3 / 0.0 4.4 / 0.0 2.1 / 0.0 2.1 / 0.0
Source: Feri, BulwienGesa, BA, DZ BANK Research forecast
50
100
150
200
250
300
350
2004 2006 2008 2010 2012 2014e
Cologne Top-7 Regional-121,2
1,4
1,6
1,8
2,0
2,2
2,4
2004 2006 2008 2010 2012 2014e
Cologne Top-7 Regional-12
Top location with the lowest volume of per capita retail space
Supply shortage leads to increase in prime rents
Real Estate Market Germany 2013 | 2014

18
Dusseldorf: retail properties
PRIME RENTS IN EUR PER SQM PER CAPITA RETAIL SPACE IN SQM
Source: BulwienGesa, DZ BANK Research forecast Source: Feri
Dusseldorf, with its high purchasing power, is heavily in demand as a retail location. The "Kö" with its many luxury shops is one of the particularly attractive locations. High demand for retail space has long exceeded supply. Consequently, although prime rents are rising steadily, the level is slightly below average for the seven top locations. In 2012, growth of just over one per cent in rents was also low - on aver-age, rents in top locations have increased at three times this rate. However, this is likely to be attributable less to slackening demand than to the extensive construction activity in the centre of Dusseldorf. This includes the U-Bahn connection for the shopping district of Schadowstraße and the demolition of the "Tausendfüßler" viaduct completed in April 2013. In the medium term this will further increase the attractions of Dusseldorf as a retail location. Overall, we expect visible growth in prime rents both this year and next year. Following a fire at the "Kö-Bogen" property in Dusseldorf at the end of September, completion of the project's first construction phase – originally planned for October 2013 – is likely to be postponed. Given that the retail floor space of 19,000 square metres has already been fully let (with Breuninger, an upmarket German retailer, accounting for three-quarters of it), any such postponement will not make any difference to the supply situation of available space. RETAIL PROPERTIES IN DUSSELDORF
2011 2012 2013e 2014e
Demand
Per capita disp. income in EUR/month 1,710 1,740 1,767 1,792
Per capita disp. income in % y-o-y 1.6 1.7 1.5 1.4
Unemployment rate (BA) in % 9.0 8.9 9.2 8.9
Retail sales in % y-o-y 2.2 3.1 3.4 3.1
Supply
Retail space in m sqm 1.2 1.2 1.2 1.3
Retail space in % y-o-y 7.4 1.8 2.5 1.3
Retail rents
Prime / secondary locations in EUR/sqm 217 / 13.5 220 / 13.5 230 / 13.5 240 / 13.5
Prime / secondary locations in % y-o-y 4.3 / 0.0 1.4 / 0.0 4.5 / 0.0 4.3 / 0.0
Source: Feri, BulwienGesa, BA, DZ BANK Research forecast
Attractive shopping location with consistently high demand for retail space
1,2
1,4
1,6
1,8
2,0
2,2
2,4
2004 2006 2008 2010 2012 2014e
Dusseldorf Top-7 Regional-12
50
100
150
200
250
300
350
2004 2006 2008 2010 2012 2014e
Dusseldorf Top-7 Regional-12
Real Estate Market Germany 2013 | 2014

19
Frankfurt: retail properties
PRIME RENTS IN EUR PER SQM PER CAPITA RETAIL SPACE IN SQM
Source: BulwienGesa, DZ BANK Research forecast Source: Feri
The retail sector in Frankfurt is also characterised by a high demand overhang. This is evident from the fact that the "Skyline Plaza" was almost totally pre-let many months before it opened. The new shopping centre near the Trade Fair, which has 170 shops and around 38,000 sqm of retail space, opened its doors at the end of August. This further, significant expansion of retail space is likely to result in a slight weakening of the recent sharp increase in the growth in prime rents. The construc-tion work on the Zeil shopping street and on Goethestraße are also likely to have a dampening effect. The planned opening in October 2013 of "One GoethePlaza" is intended to slightly extend the Frankfurt luxury retail area, although the growth in re-tail space will be modest at 4,500 sqm. However, per capita retail space in Frankfurt is already well above-average at 2.2 sqm. The average for top locations is around 1.7 sqm. This also has to be seen relative to the high level of purchasing power - of the residents of Frankfurt themselves, many business travellers and tourists as well as customers from the surrounding area with its good transport links, for example in the Main-Taunus and Hochtaunus regions. Overall, we expect prime rents to grow by about two per cent respectively in 2013 and 2014, partly because if demand is sustained, virtually no new retail space will be created.
RETAILL PROPERTIES IN FRANKFURT
2011 2012 2013e 2014e
Demand
Per capita disp. income in EUR/month 1,397 1,417 1,439 1,464
Per capita disp. income in % y-o-y 1.4 1.4 1.6 1.7
Unemployment rate (BA) in % 7.5 7.4 7.6 7.4
Retail sales in % y-o-y 2.3 3.1 1.6 2.2
Supply
Retail space in m sqm 1.4 1.4 1.5 1.5
Retail space in % y-o-y 0.4 1.2 3.0 1.5
Retail rents
Prime / secondary locations in EUR/sqm 255 / 18.0 265 / 18.0 270 / 18.0 275 / 18.1
Prime / secondary locations in % y-o-y 4.1 / 0.0 3.9 / 0.0 1.9 / 0.0 1.9 / 0.3
Source: Feri, BulwienGesa, BA, DZ BANK Research forecast
50
100
150
200
250
300
350
2004 2006 2008 2010 2012 2014e
Frankfurt Top-7 Regional-121,2
1,4
1,6
1,8
2,0
2,2
2,4
2004 2006 2008 2010 2012 2014e
Frankfurt Top-7 Regional-12
The "Skyline Plaza" was fully pre-let before it opened
Prime rents likely to increase by around 2 per cent respectively in 2013 and 2014
Real Estate Market Germany 2013 | 2014

20
Hamburg: retail properties
PRIME RENTS IN EUR PER SQM PER CAPITA RETAIL SPACE IN SQM
Source: BulwienGesa, DZ BANK Research forecast Source: Feri
The second largest German city with a population of 1.8m is the pre-eminent shop-ping destination in North Germany. In terms of its catchment area, the customer potential is almost doubling. Demographic growth, an affluent population, and not least the large number of tourists and business travellers, support the purchasing power of the Hamburg retail sector. The broad supply structure is favourable, extending from classic consumer locations such as Spitalerstraße to the distinctly luxury locations such as Neuer Wall. The small proportion of retail space in the city centre - less than 20 per cent - is not optimal. Also, in recent years, virtually no new retail space has been created in top locations. The "Europa Passage" was also opened in 2006. Against this background, there is a broad view that a city centre concept should lead to significant growth in retail space to ensure that retail activity keeps pace with other major European cities. The need to expand retail space is ultimately evident from the high demand from chain stores for retail space for mono/multi-label and also flagship stores. Buoyant demand and a supply shortage will ensure that prime rents increase both this year and next year. Levels are roughly average for top locations. The positive general figures therefore tend to support above-average growth in future.
RETAIL PROPERTIES IN HAMBURG
2011 2012 2013e 2014e
Demand
Per capita disp. income in EUR/month 1,837 1,863 1,897 1,930
Per capita disp. income in % y-o-y 1.2 1.4 1.8 1.7
Unemployment rate (BA) in % 7.8 7.5 7.7 7.5
Retail sales in % y-o-y 1.4 2.0 2.3 2.9
Supply
Retail space in m sqm 2.9 2.9 3.0 3.0
Retail space in % y-o-y 2.1 1.4 1.9 1.7
Retail rents
Prime / secondary locations in EUR/sqm 235 / 40.0 245 / 40.0 255 / 40.0 260 / 40.0
Prime / secondary locations in % y-o-y 4.4 / 0.0 4.3 / 0.0 4.1 / 0.0 2.0 / 0.0
Source: Feri, BulwienGesa, BA, DZ BANK Research forecast
50
100
150
200
250
300
2004 2006 2008 2010 2012 2014e
Hamburg Top-7 Regional-121,2
1,4
1,6
1,8
2,0
2,2
2,4
2004 2006 2008 2010 2012 2014e
Hamburg Top-7 Regional-12
Hamburg the pre-eminent shopping destination in North Germany
Prime rents likely to increase again this year and next year
Real Estate Market Germany 2013 | 2014

21
Munich: retail properties
PRIME RENTS IN EUR PER SQM PER CAPITA RETAIL SPACE IN SQM
Source: BulwienGesa, DZ BANK Research forecast Source: Feri
Munich occupies a leading role amongst the retail locations. A prime rent of EUR 300 per sqm was exceeded here for the first time last year. The preconditions for fur-ther positive market growth are also good. The favourable conditions are benefiting from low unemployment, high incomes and strong purchasing power in the sur-rounding area. The purchasing power figure of 130 is the highest amongst the top locations. Strong population growth is also a positive factor. Further demand is being generated by the large number of tourists and business travellers. Munich is particu-larly attractive in the retail and luxury segments in Germany because of its size and significance as a retail destination. It also stands apart positively from other locations which offer the almost ubiquitous selection of chains and brand shops by virtue of its range of attractive local stores. The number of shopping centres is also relatively small even after the opening of the Pasing Arcaden in 2011. Recent new retail space, for example in Hofstatt or Palais am Dom, was pre-let long before it opened. At the moment no major projects are being planned, and market conditions are therefore unlikely to ease. We therefore expect the upward trend in prime rents to continue in 2013 and 2014, as in recent years, increasing by around three per cent annually. RETAIL PROPERTIES IN MUNICH
2011 2012 2013e 2014e
Demand
Per capita disp. income in EUR/month 1,779 1,803 1,825 1,850
Per capita disp. income in % y-o-y 1.3 1.3 1.2 1.4
Unemployment rate (BA) in % 5.1 5.0 5.2 5.0
Retail sales in % y-o-y 2.5 2.6 1.5 2.4
Supply
Retail space in m sqm 1.9 2.0 2.0 2.1
Retail space in % y-o-y 1.4 3.4 2.2 2.2
Retail rents
Prime / secondary locations in EUR/sqm 295 / 35.0 305 / 35.0 315 / 35.0 325 / 35.0
Prime / secondary locations in % y-o-y 3.5 / 0.0 3.4 / 0.0 3.3 / 0.0 3.2 / 0.0
Source: Feri, BulwienGesa, BA, DZ BANK Research forecast
50
100
150
200
250
300
350
2004 2006 2008 2010 2012 2014e
Munich Top-7 Regional-121,2
1,4
1,6
1,8
2,0
2,2
2,4
2004 2006 2008 2010 2012 2014e
Munich Top-7 Regional-12
Prime rent breaks through 2012 level of EUR 300 per sqm
Prime rents in Munich likely to continue to rise despite high level
Real Estate Market Germany 2013 | 2014
22
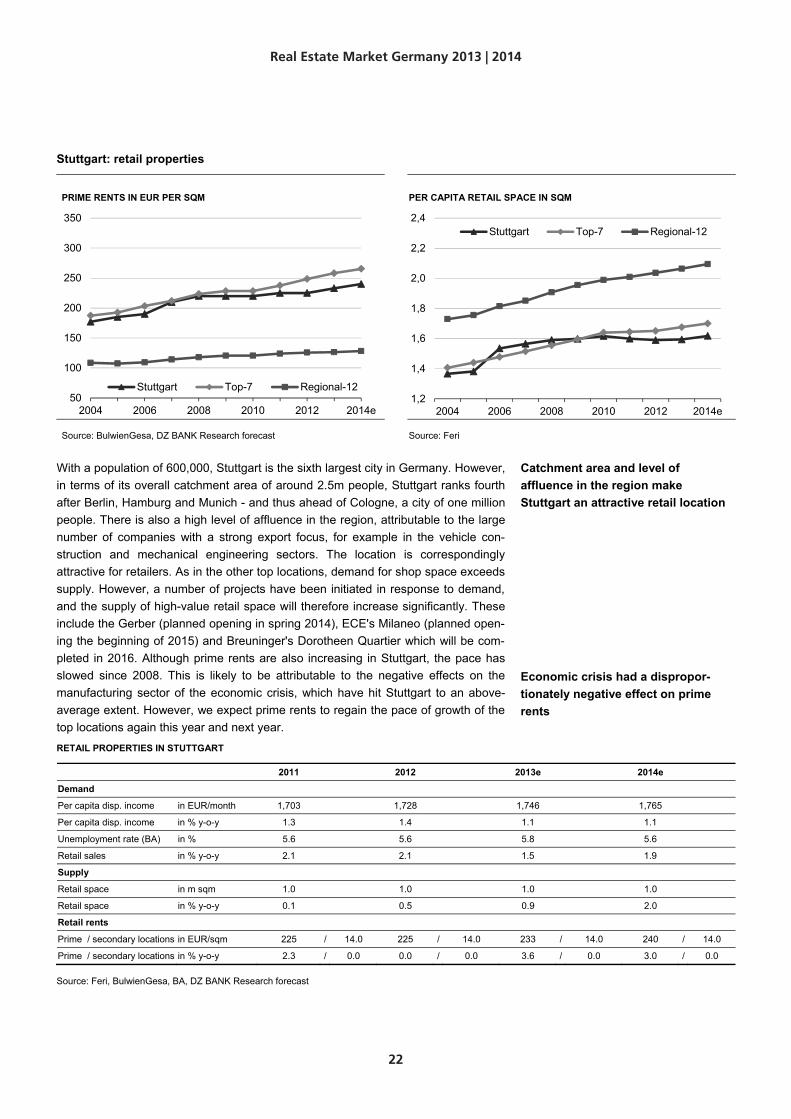
Stuttgart: retail properties
PRIME RENTS IN EUR PER SQM PER CAPITA RETAIL SPACE IN SQM
Source: BulwienGesa, DZ BANK Research forecast Source: Feri
With a population of 600,000, Stuttgart is the sixth largest city in Germany. However, in terms of its overall catchment area of around 2.5m people, Stuttgart ranks fourth after Berlin, Hamburg and Munich - and thus ahead of Cologne, a city of one million people. There is also a high level of affluence in the region, attributable to the large number of companies with a strong export focus, for example in the vehicle con-struction and mechanical engineering sectors. The location is correspondingly attractive for retailers. As in the other top locations, demand for shop space exceeds supply. However, a number of projects have been initiated in response to demand, and the supply of high-value retail space will therefore increase significantly. These include the Gerber (planned opening in spring 2014), ECE's Milaneo (planned open-ing the beginning of 2015) and Breuninger's Dorotheen Quartier which will be com-pleted in 2016. Although prime rents are also increasing in Stuttgart, the pace has slowed since 2008. This is likely to be attributable to the negative effects on the manufacturing sector of the economic crisis, which have hit Stuttgart to an above-average extent. However, we expect prime rents to regain the pace of growth of the top locations again this year and next year.
RETAIL PROPERTIES IN STUTTGART
2011 2012 2013e 2014e
Demand
Per capita disp. income in EUR/month 1,703 1,728 1,746 1,765
Per capita disp. income in % y-o-y 1.3 1.4 1.1 1.1
Unemployment rate (BA) in % 5.6 5.6 5.8 5.6
Retail sales in % y-o-y 2.1 2.1 1.5 1.9
Supply
Retail space in m sqm 1.0 1.0 1.0 1.0
Retail space in % y-o-y 0.1 0.5 0.9 2.0
Retail rents
Prime / secondary locations in EUR/sqm 225 / 14.0 225 / 14.0 233 / 14.0 240 / 14.0
Prime / secondary locations in % y-o-y 2.3 / 0.0 0.0 / 0.0 3.6 / 0.0 3.0 / 0.0
Source: Feri, BulwienGesa, BA, DZ BANK Research forecast
50
100
150
200
250
300
350
2004 2006 2008 2010 2012 2014e
Stuttgart Top-7 Regional-121,2
1,4
1,6
1,8
2,0
2,2
2,4
2004 2006 2008 2010 2012 2014e
Stuttgart Top-7 Regional-12
Catchment area and level of affluence in the region make Stuttgart an attractive retail location
Economic crisis had a dispropor-tionately negative effect on prime rents
Real Estate Market Germany 2013 | 2014

23
OFFICE PROPERTIES
Demand for office properties has benefited for some years from the robust state of the labour market. The number of people in work has thus increased to almost 42m, and the number of office workers topped ten million last year. The total number of people employed has therefore increased by around 2.5m within a decade, and the number of office workers has grown by more than 500,000. The marked economic slowdown last year has hampered this trend considerably; however, in contrast to the weak macroeconomic trend in the first half of the last decade, the number of jobs has not fallen and unemployment has not increased.
ECONOMY PICKING UP AGAIN SINCE SECOND QUARTER MORE THAN 10M PEOPLE EMPLOYED IN OFFICES
Source: Feri Source: Feri
The deep recession in the eurozone is over. The negative effects on the German economy are also therefore easing. Economic output thus increased again year-on-year in the second quarter after declining in the first three months of this year. Based on our forecast, the recovery will gain further momentum in future quarters. The risk of the euro debt crisis having a more severe impact on the labour market should therefore have been averted.
While the labour market has proved very robust during the financial market and euro debt crises, the number of planned new office building projects has declined, and growth in office space has flattened. The trend evident for some time in the office markets is thus continuing: since 2006, average growth of less than one per cent per annum in office space in the top locations has been lagging behind the strong growth of double this level in office employment. The situation in the office markets has therefore reversed: previously - from 1993 to 2005 - a high volume of new office space was built, although office employment was largely stagnating. True, large numbers of people were hired as a result of the dot-com boom, however about half of the jobs were then lost again when the share bubble burst and in the aftermath of "9/11". However, new office projects were driven even more strongly by the euphoria surrounding German reunification in the 1990s than by by "Internet hype".
-8,0
-6,0
-4,0
-2,0
0,0
2,0
4,0
6,0
1996 2000 2004 2008 2012
GDP YOY in %8,7
9,0
9,3
9,6
9,9
10,2
95
100
105
110
115
120
1996 2000 2004 2008 2012
empl
oyee
s in
mill
ion
empl
oym
ent 1
996
= 10
0
office workers in million (rhs)total employment index, (lhs)office workers index (lhs)
Robust labour market supports demand for office space
Risk of a stronger negative impact on the German labour market due to euro debt crisis seems to have been averted
Office space has grown more slowly than no. of office jobs since 2006
Real Estate Market Germany 2013 | 2014

24
THANKS TO THE POSITIVE TREND IN THE LABOUR MARKET … … OFFICE EMPLOYMENT IS GROWING FASTER THAN OFFICE SPACE
Source: Feri, own calculations, DZ BANK Research forecast Source: Feri, own calculations, DZ BANK Research forecast
In summary, trends in both the more distant and recent past are resulting in currently buoyant demand on the back of a generally fairly high supply of space. However, demand is focused mainly on modern, attractive and conveniently situated office space, as clearly reflected in the growth in prime rents. Modern office space is now in fairly short supply in most locations. In contrast, the existing supply of office space in the various locations consists mainly of older, outdated properties or is less con-veniently located. This explains the decline in the vacancy rate, although it is still at a relatively high level. One positive factor here is that the proportion of unoccupied of-fice space fell again last year to less than nine per cent for the first time since 2003.
EXPANSION OF SPACE LEADS TO HIGH VACANCY RATE GOOD EMPLOYMENT LEVEL ENSURES GROWTH IN PRIME RENTS
Source: Feri, own calculations, DZ BANK Research forecast Source: BulwienGesa, own calculations, DZ BANK Research forecast
The varying ratios of supply and demand in the different segments of the office mar-ket also reflect the trend in rents. Average rents for non-central locations in 2011 and 2012 together thus increased by three per cent, while prime rents in the office sector grew at twice this rate. As a result of the growth in rents in recent years, prime rents are now once again at least in line with the average levels over the last 20 years. Rents for secondary locations are still about five per cent below the average for this
1,60
1,75
1,90
2,05
2,20
2,35
55
60
65
70
75
80
92 94 96 98 00 02 04 06 08 10 12 14eof
fice
wor
kers
in m
illio
n
offic
e sp
ace
in s
qm m
office space (lhs)office workers (rhs) -3,0
-2,0
-1,0
0,0
1,0
2,0
3,0
4,0
5,0
92 94 96 98 00 02 04 06 08 10 12 14e
YO
Y in
%
office spaceoffice workers
0
2
4
6
8
10
12
30
32
34
36
38
40
42
92 94 96 98 00 02 04 06 08 10 12
vaca
ncy
rate
in %
spac
e pe
r offi
ce w
orke
r in
sqm
space per office worker (lhs)vacancy rate (rhs)
0
2
4
6
8
10
12
30
32
34
36
38
40
42
92 94 96 98 00 02 04 06 08 10 12
vaca
ncy
rate
in %
spac
e pe
r offi
ce w
orke
r in
sqm
space per office worker (lhs)vacancy rate (rhs)
Vacancy rate down, but still high
Prime rents increased sharply in 2011 and 2012
Real Estate Market Germany 2013 | 2014
25
period. The varying pace of growth in the segments is also likely to persist, and the divergence between prime rents and those in secondary locations will probably continue to increase.
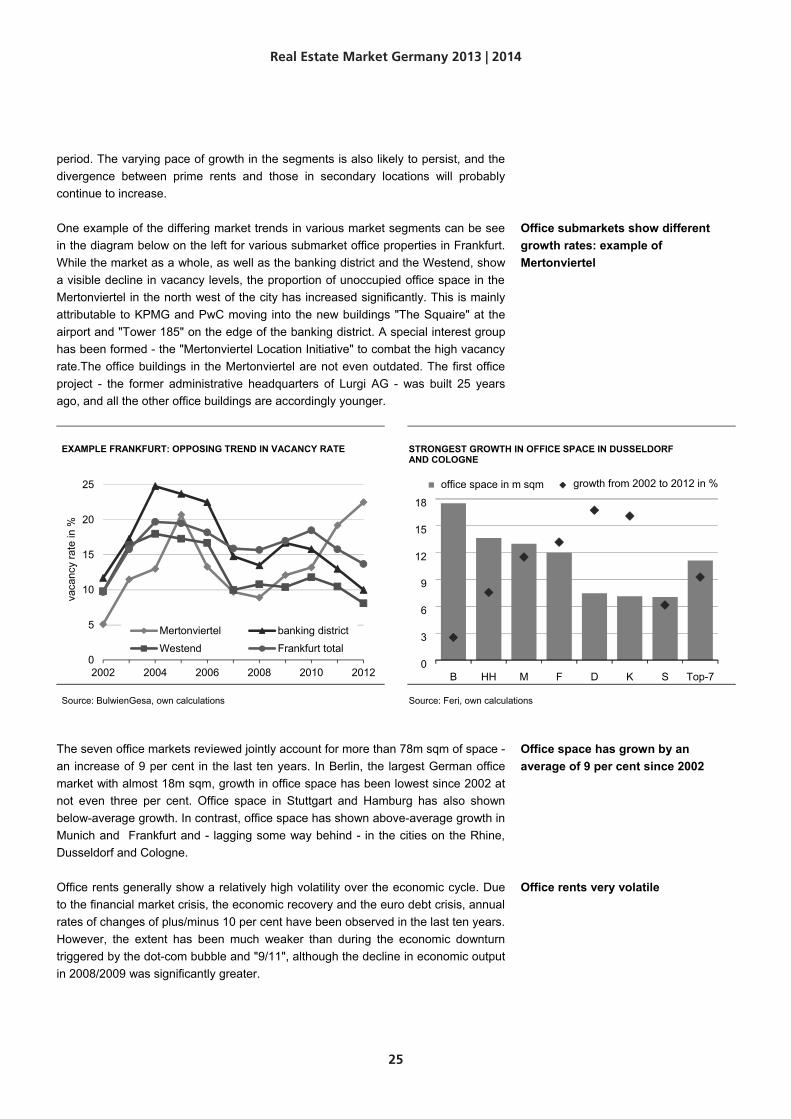
One example of the differing market trends in various market segments can be see in the diagram below on the left for various submarket office properties in Frankfurt. While the market as a whole, as well as the banking district and the Westend, show a visible decline in vacancy levels, the proportion of unoccupied office space in the Mertonviertel in the north west of the city has increased significantly. This is mainly attributable to KPMG and PwC moving into the new buildings "The Squaire" at the airport and "Tower 185" on the edge of the banking district. A special interest group has been formed - the "Mertonviertel Location Initiative" to combat the high vacancy rate.The office buildings in the Mertonviertel are not even outdated. The first office project - the former administrative headquarters of Lurgi AG - was built 25 years ago, and all the other office buildings are accordingly younger.
EXAMPLE FRANKFURT: OPPOSING TREND IN VACANCY RATE STRONGEST GROWTH IN OFFICE SPACE IN DUSSELDORF AND COLOGNE
Source: BulwienGesa, own calculations Source: Feri, own calculations
The seven office markets reviewed jointly account for more than 78m sqm of space - an increase of 9 per cent in the last ten years. In Berlin, the largest German office market with almost 18m sqm, growth in office space has been lowest since 2002 at not even three per cent. Office space in Stuttgart and Hamburg has also shown below-average growth. In contrast, office space has shown above-average growth in Munich and Frankfurt and - lagging some way behind - in the cities on the Rhine, Dusseldorf and Cologne.
Office rents generally show a relatively high volatility over the economic cycle. Due to the financial market crisis, the economic recovery and the euro debt crisis, annual rates of changes of plus/minus 10 per cent have been observed in the last ten years. However, the extent has been much weaker than during the economic downturn triggered by the dot-com bubble and "9/11", although the decline in economic output in 2008/2009 was significantly greater.
0
5
10
15
20
25
2002 2004 2006 2008 2010 2012
vaca
ncy
rate
in %
Mertonviertel banking district
Westend Frankfurt total
Office submarkets show different growth rates: example of Mertonviertel
Office space has grown by an average of 9 per cent since 2002
Office rents very volatile
0
3
6
9
12
15
18
B HH M F D K S Top-7
office space in m sqm growth from 2002 to 2012 in %
Real Estate Market Germany 2013 | 2014

26
PRIME RENTS FOR OFFICE SPACE IN EUR PER SQM … … AND IN PER CENT Y-O-Y
Source: BulwienGesa, own calculations, DZ BANK Research forecast K = Cologne
Source: BulwienGesa, own calculations, DZ BANK Research forecast K = Cologne
Stuttgart has the lowest vacancy rate of just under 6 per cent. It is followed by Berlin, Hamburg, Munich and Cologne, whose vacancy rates are about 8 per cent. The figures for Dusseldorf and Frankfurt are well above the average of 8 per cent at respectively 11 per cent and almost 14 per cent. Compared to the low level at the beginning of the 1990s, the vacancy rate in all locations has increased substantially, on average by around 6 percentage points.
VACANCY RATE DECLINING, BUT STILL VERY HIGH IT HAS INCREASED BY 4 TO 8 PERCENTAGE POINTS IN 10 YEARS
Source: Feri, own calculations K = Cologne Source: Feri, own calculations K = Cologne
10
15
20
25
30
35
40
45
50
92 94 96 98 00 02 04 06 08 10 12 14e
EU
R p
er s
qm
BDFHHKMSTop-7
-10-8-6-4-202468
10
04 05 06 07 08 09 10 11 12 13e 14e
YO
Y in
%
B D F HHK M S Top-7
0
2
4
6
8
10
12
14
16
S B HH M K D F Top-7
vaca
ncy
rate
in %
1992 1997 2001 2005 2010 2012
0
1
2
3
4
5
6
7
8
9
S B HH M K D F Top-7
chan
ge fr
om 2
002
to 2
012
in
perc
enta
ge p
oint
s
Stuttgart has the lowest, and Frankfurt the highest vacancy rate
Real Estate Market Germany 2013 | 2014
27
European office market - comparison of top locations
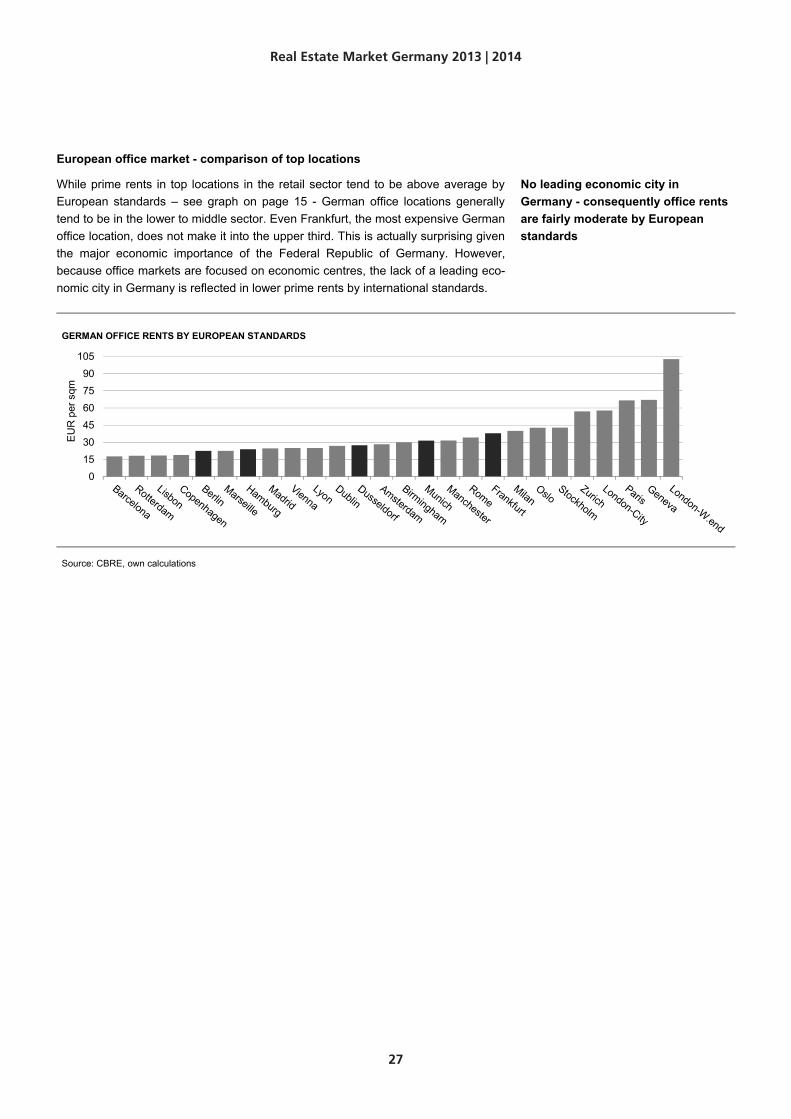
While prime rents in top locations in the retail sector tend to be above average by European standards – see graph on page 15 - German office locations generally tend to be in the lower to middle sector. Even Frankfurt, the most expensive German office location, does not make it into the upper third. This is actually surprising given the major economic importance of the Federal Republic of Germany. However, because office markets are focused on economic centres, the lack of a leading eco-nomic city in Germany is reflected in lower prime rents by international standards.
GERMAN OFFICE RENTS BY EUROPEAN STANDARDS
Source: CBRE, own calculations
0153045607590
105
EU
R p
er s
qm
No leading economic city in Germany - consequently office rents are fairly moderate by European standards
Real Estate Market Germany 2013 | 2014

28
Berlin: office properties
PRIME RENTS IN % Y-O-Y VACANCY RATES IN %
Source: BulwienGesa, DZ BANK Research forecast Source: Feri, DZ BANK Research forecast
The office market is benefiting from the positive economic trend in Berlin. The fun-damental situation is also contributing: for example, the fashion mail order company Zalando has grown successfully. However, established companies are also showing interest in setting up or extending offices in Berlin. Demand is mainly for smaller of-fice space. Large-scale rentals are mainly for public sector administration. The larg-est rental of 25,000 sqm in the first half of 2013 was by Deutsche Rentenversicherung. Overall, space take-up of around 225,000 sqm during this peri-od was down by almost 20 per cent on the same period in the previous year. The main reason for this is the meagre supply of large, modern office space. The second half could however be more successful in terms of revenue as a result of requests for larger scale office space. In 2013 and 2014, the volume of completions increased sharply. Construction projects amounting to a total of 385,000 sqm will probably then be completed, some 70 per cent more than in the two previous years. However, the greater proportion is already let, and virtually no space will therefore come onto the free market. The vacancy rate is likely to fall slightly this year and next year. Prime rents should increase slightly.
OFFICE PROPERTIES IN BERLIN
2011 2012 2013e 2014e
Demand
GDP in % y-o-y 1.1 2.0 1.5 2.3
Per capita GDP in EUR tsd. 23.7 23.9 24.1 24.5
Per capita GDP in % y-o-y 0.2 0.8 0.8 1.9
Office employees in % y-o-y 2.6 2.7 1.4 1.5
Supply
Office space in m sqm 17.5 17.5 17.6 17.7
Office space in % y-o-y 0.5 0.2 0.3 0.5
Vacancy rate in % 8.0 7.5 7.4 7.3
Office rents
Prime / secondary locations in EUR/sqm 21.5 / 6.5 22.0 / 6.7 22.4 / 6.7 22.8 / 6.8
Prime / secondary locations in % y-o-y 4.9 / 0.0 2.3 / 3.1 1.8 / 0.6 1.8 / 0.9
Source: Feri, BulwienGesa, DZ BANK Research forecast
-12
-8
-4
0
4
8
2004 2006 2008 2010 2012 2014e
Berlin Top-7 Regional-125
6
7
8
9
10
11
2004 2006 2008 2010 2012 2014e
Berlin Top-7 Regional-12
Positive economic trend in Berlin
However, prime rents likely to increase only slightly
Real Estate Market Germany 2013 | 2014

29
Cologne: office properties
PRIME RENTS IN % Y-O-Y VACANCY RATES IN %
Source: BulwienGesa, DZ BANK Research forecast Source: Feri, DZ BANK Research forecast
Relative to its population of 1m, the office market in the fourth largest German city is fairly small at just over 7m sqm. However, in terms of space take-up, Cologne lies in only sixth position. The market trend is nevertheless positive, with space take-up of 133,000 sqm in the first half of 2013 up by about 5 per cent on the same period last year. This includes two completions of more than 10,000 sqm for tenants Cologne Trade Fair and the Student Services Center. Given the growth in the number of of-fice workers, demand for space is positive. The vacancy rate has fallen steadily from its 2006 level of not quite 10 per cent and is likely to be below 8 per cent this year. This trend is also connected with the low volume of new office space. In 2012, around 30,000 sqm of completed new build office space was only a quarter of the ten-year average level. This year and next year the total volume will probably reach 100,000 sqm, some 40 per cent of the long-term average. The vacancy rate is also likely to fall slightly next year based on the below-average expansion of office space. Prime rents could increase further slightly this year and next year. OFFICE PROPERTIES IN COLOGNE
2011 2012 2013e 2014e
Demand
GDP in % y-o-y 1.8 1.9 0.7 2.2
Per capita GDP in EUR tsd. 39.8 40.2 40.2 40.9
Per capita GDP in % y-o-y 0.9 0.8 0.0 1.7
Office employees in % y-o-y 2.7 1.3 1.1 1.7
Supply
Office space in m sqm 7.1 7.1 7.2 7.3
Office space in % y-o-y 0.7 0.7 1.3 0.9
Vacancy rate in % 8.6 8.1 7.7 7.5
Office rents
Prime / secondary locations in EUR/sqm 20.0 / 8.0 20.5 / 8.0 20.7 / 8.1 21.0 / 8.1
Prime / secondary locations in % y-o-y 0.0 / 0.0 2.5 / 0.0 1.0 / 0.6 1.4 / 0.6
Source: Feri, BulwienGesa, DZ BANK Research forecast
-12
-8
-4
0
4
8
2004 2006 2008 2010 2012 2014e
Cologne Top-7 Regional-125
6
7
8
9
10
11
2004 2006 2008 2010 2012 2014e
Cologne Top-7 Regional-12
City of a million people has relatively small office market
Prime rents likely to rise slightly in 2013 and 2014, vacancy rate could fall slightly
Real Estate Market Germany 2013 | 2014
30
Dusseldorf: office properties
PRIME RENTS IN % Y-O-Y VACANCY RATES IN %
Source: BulwienGesa, DZ BANK Research forecast Source: Feri, DZ BANK Research forecast
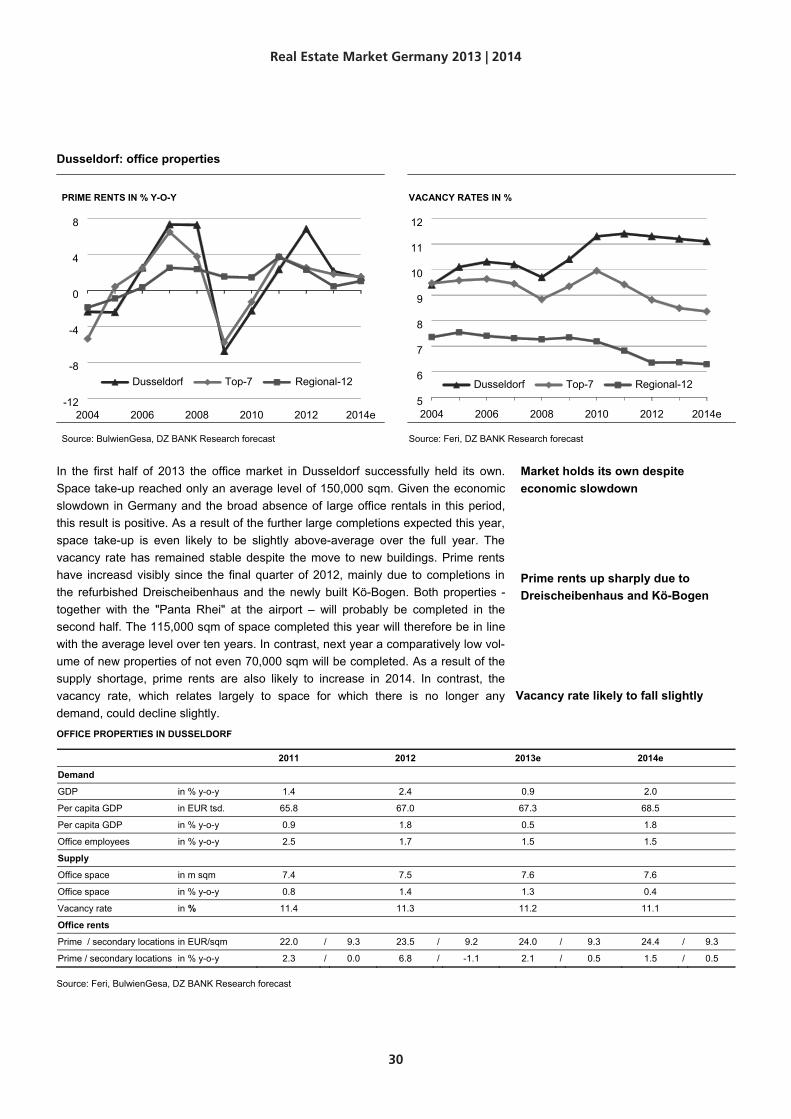
In the first half of 2013 the office market in Dusseldorf successfully held its own. Space take-up reached only an average level of 150,000 sqm. Given the economic slowdown in Germany and the broad absence of large office rentals in this period, this result is positive. As a result of the further large completions expected this year, space take-up is even likely to be slightly above-average over the full year. The vacancy rate has remained stable despite the move to new buildings. Prime rents have increasd visibly since the final quarter of 2012, mainly due to completions in the refurbished Dreischeibenhaus and the newly built Kö-Bogen. Both properties - together with the "Panta Rhei" at the airport – will probably be completed in the second half. The 115,000 sqm of space completed this year will therefore be in line with the average level over ten years. In contrast, next year a comparatively low vol-ume of new properties of not even 70,000 sqm will be completed. As a result of the supply shortage, prime rents are also likely to increase in 2014. In contrast, the vacancy rate, which relates largely to space for which there is no longer any demand, could decline slightly. OFFICE PROPERTIES IN DUSSELDORF
2011 2012 2013e 2014e
Demand
GDP in % y-o-y 1.4 2.4 0.9 2.0
Per capita GDP in EUR tsd. 65.8 67.0 67.3 68.5
Per capita GDP in % y-o-y 0.9 1.8 0.5 1.8
Office employees in % y-o-y 2.5 1.7 1.5 1.5
Supply
Office space in m sqm 7.4 7.5 7.6 7.6
Office space in % y-o-y 0.8 1.4 1.3 0.4
Vacancy rate in % 11.4 11.3 11.2 11.1
Office rents
Prime / secondary locations in EUR/sqm 22.0 / 9.3 23.5 / 9.2 24.0 / 9.3 24.4 / 9.3
Prime / secondary locations in % y-o-y 2.3 / 0.0 6.8 / -1.1 2.1 / 0.5 1.5 / 0.5
Source: Feri, BulwienGesa, DZ BANK Research forecast
Market holds its own despite economic slowdown
Prime rents up sharply due to Dreischeibenhaus and Kö-Bogen
Vacancy rate likely to fall slightly
5
6
7
8
9
10
11
12
2004 2006 2008 2010 2012 2014e
Dusseldorf Top-7 Regional-12
-12
-8
-4
0
4
8
2004 2006 2008 2010 2012 2014e
Dusseldorf Top-7 Regional-12
Real Estate Market Germany 2013 | 2014
31
Frankfurt: office properties
PRIME RENTS IN % Y-O-Y VACANCY RATES IN %
Source: BulwienGesa, DZ BANK Research forecast Source: Feri, DZ BANK Research forecast
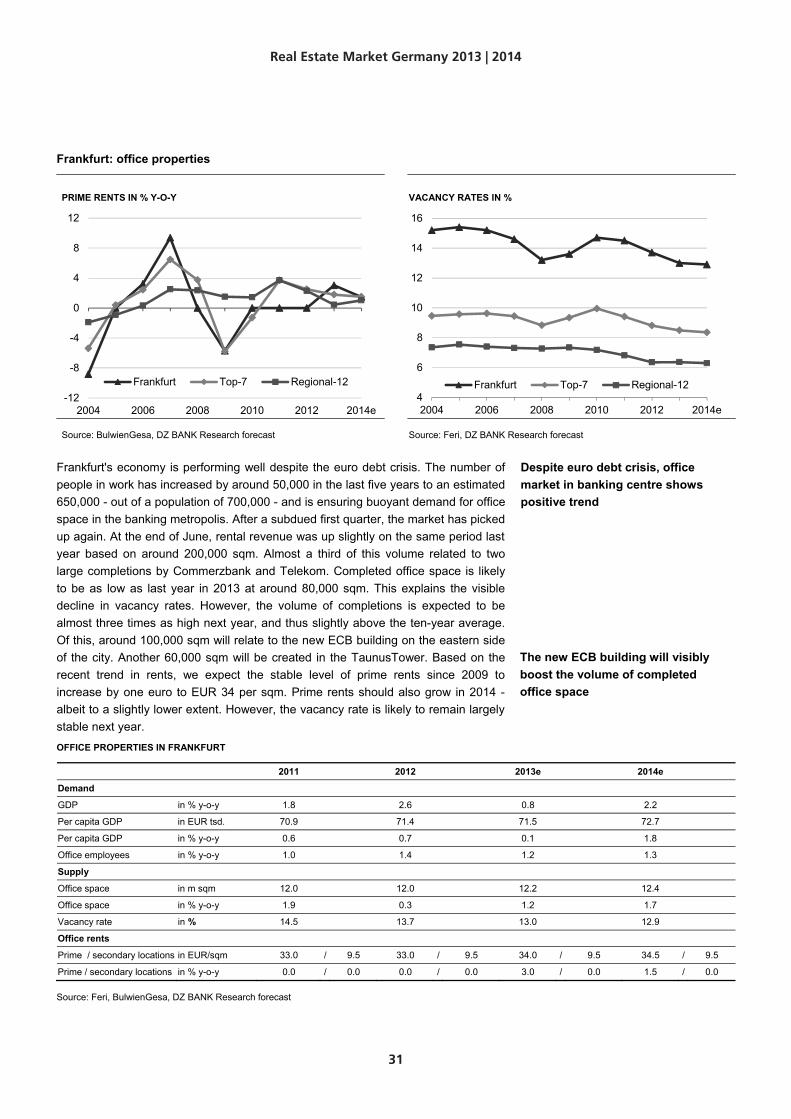
Frankfurt's economy is performing well despite the euro debt crisis. The number of people in work has increased by around 50,000 in the last five years to an estimated 650,000 - out of a population of 700,000 - and is ensuring buoyant demand for office space in the banking metropolis. After a subdued first quarter, the market has picked up again. At the end of June, rental revenue was up slightly on the same period last year based on around 200,000 sqm. Almost a third of this volume related to two large completions by Commerzbank and Telekom. Completed office space is likely to be as low as last year in 2013 at around 80,000 sqm. This explains the visible decline in vacancy rates. However, the volume of completions is expected to be almost three times as high next year, and thus slightly above the ten-year average. Of this, around 100,000 sqm will relate to the new ECB building on the eastern side of the city. Another 60,000 sqm will be created in the TaunusTower. Based on the recent trend in rents, we expect the stable level of prime rents since 2009 to increase by one euro to EUR 34 per sqm. Prime rents should also grow in 2014 - albeit to a slightly lower extent. However, the vacancy rate is likely to remain largely stable next year.
OFFICE PROPERTIES IN FRANKFURT
2011 2012 2013e 2014e
Demand
GDP in % y-o-y 1.8 2.6 0.8 2.2
Per capita GDP in EUR tsd. 70.9 71.4 71.5 72.7
Per capita GDP in % y-o-y 0.6 0.7 0.1 1.8
Office employees in % y-o-y 1.0 1.4 1.2 1.3
Supply
Office space in m sqm 12.0 12.0 12.2 12.4
Office space in % y-o-y 1.9 0.3 1.2 1.7
Vacancy rate in % 14.5 13.7 13.0 12.9
Office rents
Prime / secondary locations in EUR/sqm 33.0 / 9.5 33.0 / 9.5 34.0 / 9.5 34.5 / 9.5
Prime / secondary locations in % y-o-y 0.0 / 0.0 0.0 / 0.0 3.0 / 0.0 1.5 / 0.0
Source: Feri, BulwienGesa, DZ BANK Research forecast
-12
-8
-4
0
4
8
12
2004 2006 2008 2010 2012 2014e
Frankfurt Top-7 Regional-124
6
8
10
12
14
16
2004 2006 2008 2010 2012 2014e
Frankfurt Top-7 Regional-12
Despite euro debt crisis, office market in banking centre shows positive trend
The new ECB building will visibly boost the volume of completed office space
Real Estate Market Germany 2013 | 2014

32
Hamburg: office properties
PRIME RENTS IN % Y-O-Y VACANCY RATES IN %
Source: BulwienGesa, DZ BANK Research forecast Source: Feri, DZ BANK Research forecast
Transhipment volume in the second largest European sea port declined slightly by 1 per cent last year. However, like the economic slowdown in Germany, this did not have a negative impact on the office market. As a result of the steady increase in the number of office jobs, demand for office space remains positive. Space take-up of almost 220,000 sqm in the first half of this year was thus up slightly on the same period last year. The largest single completion here was 14,000 sqm for Philips. However, most of the demand in Hamburg is focused on medium-sized office space of very good quality and in good locations. In line with the broad-based economy of Hamburg, there is a balanced sector mix for office space. The volume of comple-tions reached about 85 per cent of the ten-year average of around 200,000 sqm in 2012. This year the volume is likely to fall to around 70 per cent of the long-term average. However, the figure will probably increase again to 185,000 sqm in 2014. After a sharp decline in the vacancy rate in the last two years to just under eight per cent, we expect the vacancy level to at best fall slightly this year and next year. Accordingly, prime rents are likely to increase marginally.
OFFICE PROPERTIES IN HAMBURG
2011 2012 2013e 2014e
Demand
GDP in % y-o-y 2.4 1.5 0.9 2.2
Per capita GDP in EUR tsd. 44.8 45.2 45.3 46.1
Per capita GDP in % y-o-y 1.7 0.7 0.4 1.8
Office employees in % y-o-y 1.9 1.8 2.1 1.6
Supply
Office space in m sqm 13.5 13.6 13.8 13.9
Office space in % y-o-y 1.0 1.2 0.9 1.2
Vacancy rate in % 8.5 7.8 7.6 7.5
Office rents
Prime / secondary locations in EUR/sqm 23.5 / 8.2 24.1 / 9.0 24.3 / 9.0 24.5 / 9.0
Prime / secondary locations in % y-o-y 4.4 / 2.5 2.6 / 9.8 0.8 / 0.0 0.8 / 0.0
Source: Feri, BulwienGesa, DZ BANK Research forecast
-8
-4
0
4
8
2004 2006 2008 2010 2012 2014e
HamburgTop-7Regional-12
5
6
7
8
9
10
11
2004 2006 2008 2010 2012 2014e
Hamburg Top-7 Regional-12
Broad-based economy of Hamburg ensures stable trend in office market
Real Estate Market Germany 2013 | 2014
33
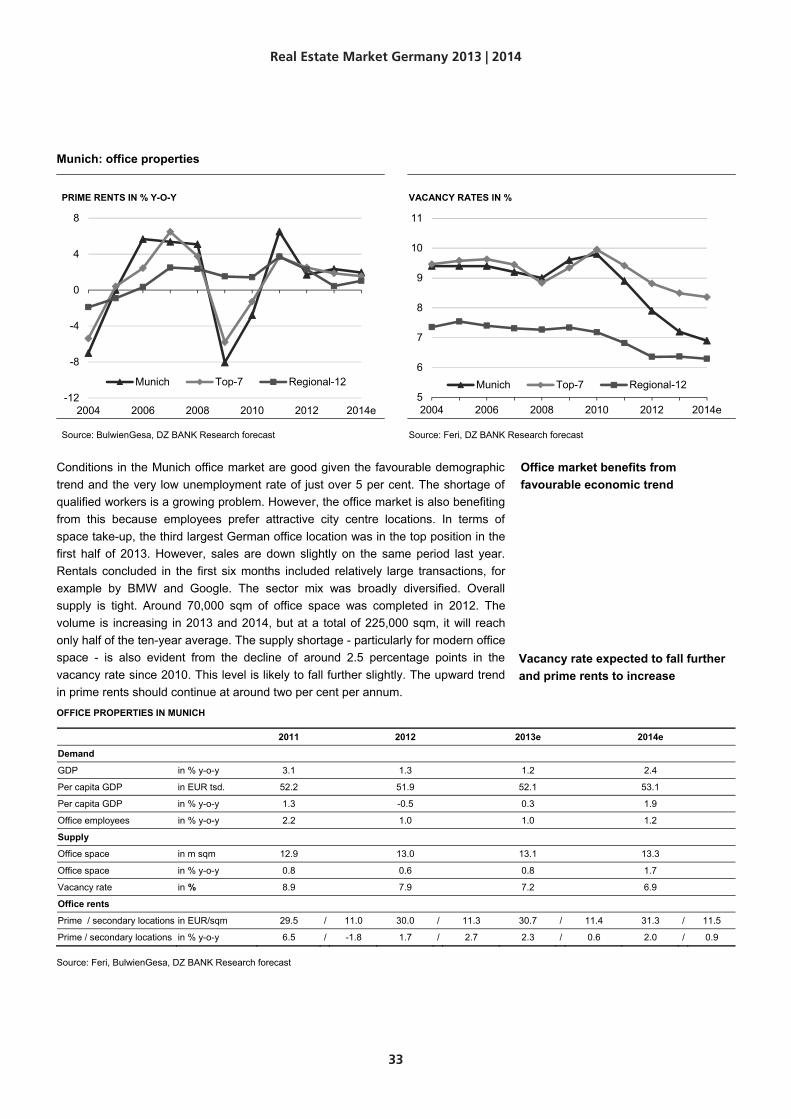
Munich: office properties
PRIME RENTS IN % Y-O-Y VACANCY RATES IN %
Source: BulwienGesa, DZ BANK Research forecast Source: Feri, DZ BANK Research forecast
Conditions in the Munich office market are good given the favourable demographic trend and the very low unemployment rate of just over 5 per cent. The shortage of qualified workers is a growing problem. However, the office market is also benefiting from this because employees prefer attractive city centre locations. In terms of space take-up, the third largest German office location was in the top position in the first half of 2013. However, sales are down slightly on the same period last year. Rentals concluded in the first six months included relatively large transactions, for example by BMW and Google. The sector mix was broadly diversified. Overall supply is tight. Around 70,000 sqm of office space was completed in 2012. The volume is increasing in 2013 and 2014, but at a total of 225,000 sqm, it will reach only half of the ten-year average. The supply shortage - particularly for modern office space - is also evident from the decline of around 2.5 percentage points in the vacancy rate since 2010. This level is likely to fall further slightly. The upward trend in prime rents should continue at around two per cent per annum. OFFICE PROPERTIES IN MUNICH
2011 2012 2013e 2014e
Demand
GDP in % y-o-y 3.1 1.3 1.2 2.4
Per capita GDP in EUR tsd. 52.2 51.9 52.1 53.1
Per capita GDP in % y-o-y 1.3 -0.5 0.3 1.9
Office employees in % y-o-y 2.2 1.0 1.0 1.2
Supply
Office space in m sqm 12.9 13.0 13.1 13.3
Office space in % y-o-y 0.8 0.6 0.8 1.7
Vacancy rate in % 8.9 7.9 7.2 6.9
Office rents
Prime / secondary locations in EUR/sqm 29.5 / 11.0 30.0 / 11.3 30.7 / 11.4 31.3 / 11.5
Prime / secondary locations in % y-o-y 6.5 / -1.8 1.7 / 2.7 2.3 / 0.6 2.0 / 0.9
Source: Feri, BulwienGesa, DZ BANK Research forecast
-12
-8
-4
0
4
8
2004 2006 2008 2010 2012 2014e
Munich Top-7 Regional-125
6
7
8
9
10
11
2004 2006 2008 2010 2012 2014e
Munich Top-7 Regional-12
Office market benefits from favourable economic trend
Vacancy rate expected to fall further and prime rents to increase
Real Estate Market Germany 2013 | 2014
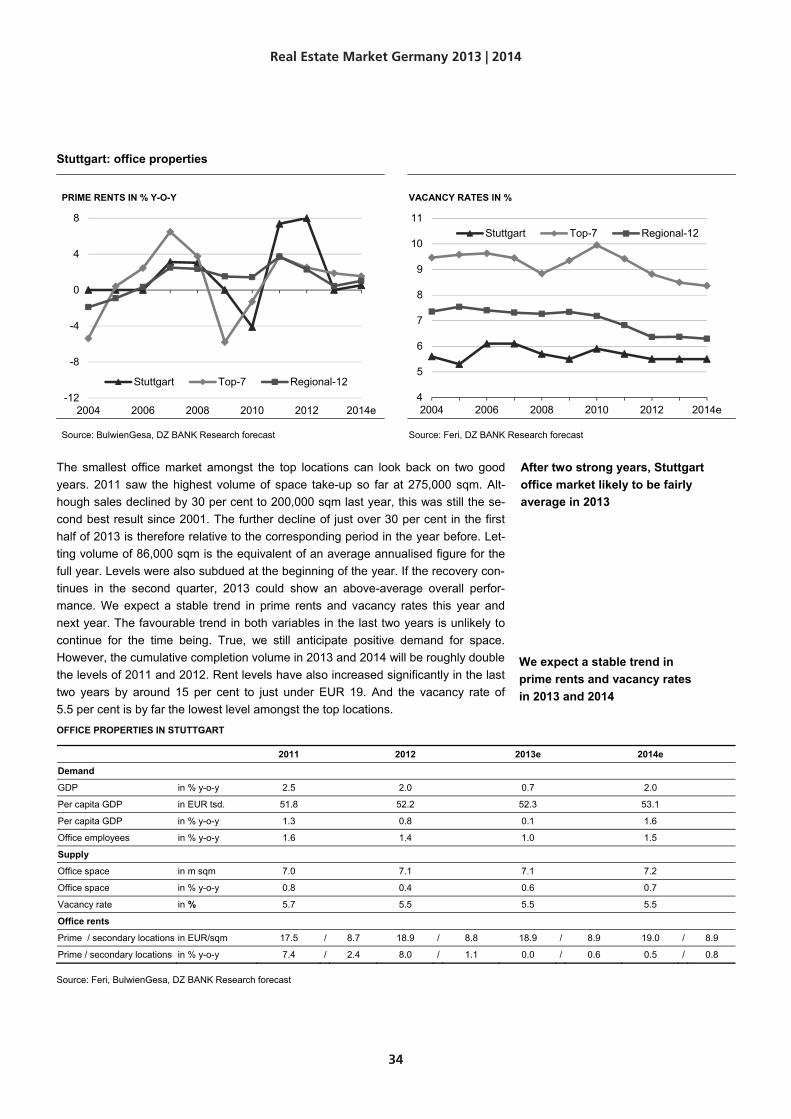
Stuttgart: office properties
PRIME RENTS IN % Y-O-Y VACANCY RATES IN %
Source: BulwienGesa, DZ BANK Research forecast Source: Feri, DZ BANK Research forecast
The smallest office market amongst the top locations can look back on two good years. 2011 saw the highest volume of space take-up so far at 275,000 sqm. Alt-hough sales declined by 30 per cent to 200,000 sqm last year, this was still the se-cond best result since 2001. The further decline of just over 30 per cent in the first half of 2013 is therefore relative to the corresponding period in the year before. Let-ting volume of 86,000 sqm is the equivalent of an average annualised figure for the full year. Levels were also subdued at the beginning of the year. If the recovery con-tinues in the second quarter, 2013 could show an above-average overall perfor-mance. We expect a stable trend in prime rents and vacancy rates this year and next year. The favourable trend in both variables in the last two years is unlikely to continue for the time being. True, we still anticipate positive demand for space. However, the cumulative completion volume in 2013 and 2014 will be roughly double the levels of 2011 and 2012. Rent levels have also increased significantly in the last two years by around 15 per cent to just under EUR 19. And the vacancy rate of 5.5 per cent is by far the lowest level amongst the top locations.
OFFICE PROPERTIES IN STUTTGART
2011 2012 2013e 2014e
Demand
GDP in % y-o-y 2.5 2.0 0.7 2.0
Per capita GDP in EUR tsd. 51.8 52.2 52.3 53.1
Per capita GDP in % y-o-y 1.3 0.8 0.1 1.6
Office employees in % y-o-y 1.6 1.4 1.0 1.5
Supply
Office space in m sqm 7.0 7.1 7.1 7.2
Office space in % y-o-y 0.8 0.4 0.6 0.7
Vacancy rate in % 5.7 5.5 5.5 5.5
Office rents
Prime / secondary locations in EUR/sqm 17.5 / 8.7 18.9 / 8.8 18.9 / 8.9 19.0 / 8.9
Prime / secondary locations in % y-o-y 7.4 / 2.4 8.0 / 1.1 0.0 / 0.6 0.5 / 0.8
Source: Feri, BulwienGesa, DZ BANK Research forecast
-12
-8
-4
0
4
8
2004 2006 2008 2010 2012 2014e
Stuttgart Top-7 Regional-124
5
6
7
8
9
10
11
2004 2006 2008 2010 2012 2014e
Stuttgart Top-7 Regional-12
After two strong years, Stuttgart office market likely to be fairly average in 2013
We expect a stable trend in prime rents and vacancy rates in 2013 and 2014
34
Real Estate Market Germany 2013 | 2014

35
RESIDENTIAL PROPERTIES
The situation in the housing markets in all the top locations is characterised by strong growth in rents and a marked supply shortage. The reasons for this lie in the more distant, and also the recent past. The real estate boom which followed the reu-nification euphoria led to strong growth in construction activity - despite the fact that population growth more or less stagnated until after the new millennium. The market reacted to the improvement in the housing supply with falling rents. Weak economic growth in East Germany also struck a sobering note. Construction subsequently fell to a historically low level. While new construction remained at a low level, the influx into major cities boosted demand for housing. For example, the population of Frank-furt has increased by eight per cent in the last ten years from 650,000 to just over 700,000. The population of Munich has grown at almost twice this rate (+14 per cent) in the same period to around 1.4m.
SUPPLY AND DEMAND FOR HOUSING DIVERGES RENT INCREASE LEADS TO MODEST GROWTH IN NEW CONSTRUC-TION
Source: Feri, own calculations, DZ BANK Research forecast Source: BulwienGesa, Feri, own calculations, DZ BANK Research forecast
The tension in the housing markets is intensifying because the number of private households - the main demand unit in the housing market - is growing even faster due to the increasing number of single-person and two-person households. The consequence is that rents have been rising for years, accelerating almost continu-ously up to last year, and affecting all seven top locations. As in the past, the highest level of rents has been in the Bavarian capital. The average first-time use rent is currently around EUR 14 per sqm, rising to a maximum of almost EUR 6 higher. In contrast, since the end of the 1990s, Berlin has been at the other end of the scale - based on average first-time use rents. As a result of the strong growth, rents in Ber-lin have however climbed back above the 10 euro level again since 2012 for the first time in more than ten years. Rents in Stuttgart have also exceeded this level, and first-time use rents in all the locations are consequently in double digits now.
The growth in rents has also made housebuilding an attractive prospect again in major cities. Although new build activity has increased as a result by, on average, a good 50 per cent in the top locations compared to 2011, the absolute number of completions nevertheless remains moderate at three housing units to 1,000 people.
4.400
4.600
4.800
5.000
5.200
5.400
5.600
5.800
92 94 96 98 00 02 04 06 08 10 12 14e
in th
ousa
nd u
nits
households
dwelling stock0
1
2
3
4
5
6
7
4
6
8
10
12
14
16
18
92 94 96 98 00 02 04 06 08 10 12 14e
units
per
100
0 in
habi
tant
s
EU
R p
er s
qm
rent first time use average (lhs)rent first time use maximum (lhs)completions (rhs)
Residential markets in top locations characterised by supply shortage and increasing rents
No. of private households growing rapidly
Demand shortfall difficult to close - planned political intervention may even intensify the problem
Real Estate Market Germany 2013 | 2014

A supply shortage will therefore continue to be a major factor for housing markets in the seven top locations in the years ahead. The existing gap in demand will only be closed if a relatively high level of new building can be maintained in future years. Politically motivated intervention in the market, such as a rent brake, may be coun-terproductive here. Rents which are kept artificially below the actual market level, make housebuilding less attractive and will also presumably reduce the volume of properties constructed. The influx could also be boosted further because the diver-gence in rents compared to alternative - for example peripheral, and less attractive - residential locations will be reduced. In terms of residential lettings, rent levels would then be replaced as a market control variable by an allocation problem - i.e. of managing the housing shortage.
RESIDENTIAL: AVERAGE FIRST-TIME USE RENTS (EUR PER SQM) AND ALSO ...
… MAXIMUM RENTS ARE GROWING DISPROPORTIONATELY IN HAMBURG AND DUSSELDORF
Source: BulwienGesa, own calculations, DZ BANK Research forecast K = Cologne
Source: BulwienGesa, own calculations, DZ BANK Research forecast K = Cologne
Despite what is, at first glance, a fairly uniform upward trend in the seven top loca-tions, the extent of the growth in rents varies considerably - as can be seen in the diagram below. In Stuttgart, first-time use rents have shown the weakest growth of ten per cent in the last five years. In contrast, in Hamburg they have risen by more than 40 per cent. On average, in the seven locations, rents increased by about 25 per cent between 2007 and 2012. This is broadly in line with the rent growth observed in Frankfurt and Berlin. Apart from Stuttgart, rents in Cologne and Munich showed below-average growth of 13 per cent and 19 per cent respectively. Dussel-dorf ranked second after Hamburg in terms of above-average growth, with an increase of 33 per cent.
6
7
8
9
10
11
12
13
14
15
92 94 96 98 00 02 04 06 08 10 12 14e
EU
R p
er s
qm
BDFHHKMSTop-7
91011121314151617181920
92 94 96 98 00 02 04 06 08 10 12 14e
EU
R p
er s
qmBDFHHKMSTop-7
First-time use rents have risen by between 10 and 40 per cent in 5 years
36
Real Estate Market Germany 2013 | 2014

RENTS INCREASED BY BETWEEN 10 AND 40% FROM 2007 TO 2012 POPULATION GROWTH AND NEW CONSTRUCTION PROVIDE AN EX-PLANATION
Source: BulwienGesa, own calculations K = Cologne Source: Feri, own calculations, sequence of locations as in graph on left K = Cologne
The demographic trend and the volume of housebuilding are at least part of the rea-son for the diverging growth in rents. In Stuttgart and Cologne, population growth has been moderate, and new build activity has been slightly above-average. The above-average impact of the economic downturn of 2008 and 2009 is also likely to have been a negative factor for Stuttgart. In contrast, population growth has been strongest in Munich and Frankfurt. However, a comparatively large number of homes have also been completed here. The already fairly high level of rents is also a dampening factor. The stronger growth in rents in Berlin and Dusseldorf is also likely to be a result of the decidedly low level of new building. This indicates a partic-ular supply shortage of attractive homes. Hamburg - which shows by far the highest rent growth - is characterised neither by strong residential construction nor by above-average population growth. The very strong growth in rents could be based on the "higher positioning" of the market as a whole, with the realisation of HafenCity and the "structural upgrading" of whole areas of the city - in other words gentrifica-tion - also likely to have played a part.
HAMBURG MOVES UP THE RANKS - MARKET REPOSITIONING? RENT GROWTH LIKELY TO WEAKEN SLIGHTLY
Source: BulwienGesa, own calculations Source: BulwienGesa, own calculations, DZ BANK Research forecast
0
10
20
30
40
50
60
S K M F B D HH Top-7
rent
gro
wth
from
2007
to 2
012
in %
first time use averagefirst time use maximumaverage rent growth
0
1
2
3
4
5
6
7
8
9
S K M F B D HH Top-7
completions per 1000 inhabitants from 2007 to 2012population growth from 2007 to 2012 in %
-3
-2
-1
0
1
2
3
92 94 96 98 00 02 04 06 08 10 12
rent
diff
eren
ce H
ambu
rg/T
op-7
EU
R p
er s
qm
first time use averagefirst time use maximum
-8
-4
0
4
8
12
92 94 96 98 00 02 04 06 08 10 12 14e
YO
Y in
%
rent first time use averagerent first time use maximum
With the exception of Hamburg - rent growth can be explained by population growth and the volume of new building
Real Estate Market Germany 2013 | 2014
37

After largely stagnating from 2003 to 2007, residential rents for newly built properties are now rising by almost 5 per cent annually as a consequence of the increasing supply shortage since 2008. Growth in rents is thus well above inflation, resulting in a real increase of a good 3 per cent annually. However, the latest data indicates that the pace of the growth in rents is slowing. Apart from the already high level of rents achieved, additional housing costs, which have also been rising for years, are also likely to be a contributory factor here, with private households at the limits of what they can afford to pay for housing. The slacker pace of macroeconomic growth in Germany could also be having a negative impact. We therefore expect rents for new build properties to increase by less than 3 per cent this year and next year. The figures for the individual locations can be seen in the table below.
"HOUSING" FORECASTS UP TO 2014
Source: Feri, BulwienGesa, BA, DZ BANK Research forecast
Year Berlin CologneDussel-
dorfFrank-
furtHam-burg Munich
Stutt-gart Top-7
Demandpopulation in thoausand 2012 3.517 1.021 593 698 1.805 1.388 616 9.639change in % 2007-2012 3,3 3,0 2,6 6,6 2,5 6,6 3,5 3,8households in thousand 2012 2.045 560 331 416 1.004 840 328 5.524change in % 2007-2012 5,4 5,2 4,8 10,8 4,5 10,9 5,5 6,4Unemployment rate 2012 12,3 9,5 8,9 7,4 7,5 5,0 5,6 9,1Change in percentage points 2009-2012 -1,7 -1,1 -0,7 -0,9 -1,2 -1,0 -0,9 -1,3Disposable income 2012 1.200 1.552 1.740 1.417 1.863 1.803 1.727,6 1.531change in % 2007-2012 3,6 1,6 2,0 2,8 7,0 1,4 1,4 3,5Supply 0 0 0 0 0 0 0 0 0Dwelling stock in thousand 2012 1.904 531 328 366 899 759 301 5.089change in % 2007-2012 0,9 2,2 1,0 3,1 1,8 2,8 2,0 1,7New dwellings completed (yearly) 2007-2012 1,2 2,8 1,5 3,7 2,0 3,7 2,5 2,2per 1000 inhabitants 2013/14e 2,5 3,0 2,5 5,1 3,4 4,6 2,7 3,2Rent residential (first occupancy) 0 0 0 0 0 0 0 0 0average location 2012 10,0 11,0 11,6 12,1 12,9 13,5 10,5 11,4in Euro/sqm 2013e 10,4 11,3 12,0 12,5 13,2 13,8 10,8 11,8
2014e 10,7 11,6 12,3 12,8 13,4 14,1 11,1 12,1average location 2012 9,9 4,8 7,4 5,2 3,2 1,5 8,2 5,8yoy change in % 2013e 4,0 2,6 3,4 3,3 2,0 2,2 2,9 3,0
2014e 2,9 2,3 2,5 2,4 1,8 2,2 2,5 2,4top location 2012 15,3 14,5 15,2 17,8 18,5 19,0 14,0 16,4in Euro/sqm 2013e 15,9 14,9 15,7 18,4 18,9 19,5 14,5 17,0
2014e 16,4 15,3 16,1 18,9 19,3 20,0 14,9 17,4top location 2012 9,3 3,6 4,8 4,7 2,8 2,7 6,9 5,5yoy change in % 2013e 4,1 2,8 3,3 3,4 2,2 2,6 3,6 3,2
2014e 3,0 2,5 2,5 2,4 2,1 2,3 2,8 2,6
Rent growth likely to flatten somewhat
Overview of housing forecasts up to 2014
38
Real Estate Market Germany 2013 | 2014

OVERVIEW OF FORECASTS
Structural data (per 2012) Population in 1,000 Population
2000-2011 in %GDP
in EUR mPer capita GDP
in EURPer capita disposable
income EUR/month Unemployment ratein %
Berlin 3,517 3.8 84,0 23,875 1,200 12.3
Cologne 1,021 5.4 41,0 40,162 1,552 9.5
Dusseldorf 593 3.9 39,8 66,989 1,740 8.9
Frankfurt 698 8.6 49,8 71,423 1,417 7.4
Hamburg 1,805 4.6 81,5 45,156 1,863 7.5
Munich 1,388 12.7 72,1 51,926 1,803 5.0
Stuttgart 616 4.9 32,2 52,239 1,728 5.6
Average of top locations 1,377 5.7 400.3 41,534 1,531 9.1
Retail properties Retail space per 2012
Prime rents in EUR per sqm
Change in rents in % y-o-y
Retail sales in % y-o-y
in
1000 sqm
2002-2012 in %
per capita in sqm
2012 2013e 2014e 2012 2013e 2014e 2012 2013e 2014e
Berlin 5,962 31.6 1.7 240 252 260 6.7 5.0 3.2 1.9 2.1 2.6
Cologne 1,398 7.3 1.4 235 240 245 4.4 2.1 2.1 2.8 2.2 2.5
Dusseldorf 1,217 43.1 2.1 220 230 240 1.4 4.5 4.3 3.1 3.4 3.1
Frankfurt 1,438 38.5 2.1 265 270 275 3.9 1.9 1.9 3.1 1.6 2.2
Hamburg 2,936 31.4 1.6 245 255 260 4.3 4.1 2.0 2.0 2.3 2.9
Munich 1,978 30.2 1.4 305 315 325 3.4 3.3 3.2 2.6 1.5 2.4
Stuttgart 979 29.4 1.6 225 233 240 0.0 3.6 3.0 2.1 1.5 1.9
Average of top locations 2,273 30.1 1.7 248 258 265 4.6 3.9 2.8 2.3 2.1 2.6
Office properties Office space per 2012 Prime rents
in EUR per sqm Change in rents in % y-o-y Vacancy rate
in %
in
1000 sqm
Per capita
sqm
Per office worker in
sqm 2012 2013e 2014e 2012 2013e 2014e 2012 2013e 2014e
Berlin 17,524 5.0 35.5 22.0 22.4 22.8 2.3 1.8 1.8 7.5 7.4 7.3
Cologne 7,128 7.0 33.3 20.5 20.7 21.0 2.5 1.0 1.4 8.1 7.7 7.5
Dusseldorf 7,468 12.7 39.2 23.5 24.0 24.4 6.8 2.1 1.5 11.3 11.2 11.1
Frankfurt 12,020 17.3 44.6 33.0 34.0 34.5 0.0 3.0 1.5 13.7 13.0 12.9
Hamburg 13,641 7.6 34.9 24.1 24.3 24.5 2.6 0.8 0.8 7.8 7.6 7.5
Munich 12,987 9.4 36.0 30.0 30.7 31.3 1.7 2.3 2.0 7.9 7.2 6.9
Stuttgart 7,059 11.5 40.1 18.9 18.9 19.0 8.0 0.0 0.5 5.5 5.5 5.5
Average of top locations 11,118 1.4 37.1 25.1 25.6 26.0 2.5 1.9 1.5 8.8 8.5 8.4
Residential properties Trend from 2002 to 2012 in % Average first-time use
rents in EUR per sqm Average first-time use rents in % y-o-y Maximum first-time use
rents in EUR per sqm
Inhabi-tants
House-holds
Housing stock 2012 2013e 2014e 2012 2013e 2014e 2012 2013e 2014e
Berlin 3.8 10.0 1.6 10.0 10.4 10.7 9.9 4.0 2.9 15.3 15.9 16.4
Cologne 5.4 8.7 4.7 11.0 11.3 11.6 4.8 2.6 2.3 14.5 14.9 15.3
Dusseldorf 3.9 5.8 2.6 11.6 12.0 12.3 7.4 3.4 2.5 15.2 15.7 16.1
Frankfurt 8.6 14.8 6.6 12.1 12.5 12.8 5.2 3.3 2.4 17.8 18.4 18.9
Hamburg 4.6 8.9 3.7 12.9 13.2 13.4 3.2 2.0 1.8 18.5 18.9 19.3
Munich 12.7 20.7 7.5 13.5 13.8 14.1 1.5 2.2 2.2 19.0 19.5 20.0
Stuttgart 4.9 6.2 3.4 10.5 10.8 11.1 8.2 2.9 2.5 14.0 14.5 14.9
Average of top locations 5.7 11.0 3.7 11.4 11.8 12.1 5.8 3.0 2.4 16.4 17.0 17.4
Source: Feri, BulwienGesa, DZ BANK Research forecast
Real Estate Market Germany 2013 | 2014
39
40
Real Estate Market Germany 2013 | 2014
DisclaimerThis document has been published by DG HYP – Deutsche Genossenschafts-Hypothekenbank AG, Hamburg.
This document has been prepared by DZ BANK AG Deutsche Zentral-Genossenschaftsbank („DZ BANK“) and is intended for distribution within the Federal Republic of Germany. This document is not intended for persons having their domicile and/or registered offi ce and/or branches outside Germany, particularly
in the United States of America, Canada, the United Kingdom or Japan. This brochure may only be distributed outside Germany in compliance with the laws and regulationsapplicable in the relevant country. Anyone gaining possession of this information or material must inform themselves of theapplicable laws and regulations and observe said laws and regulations.
Nothing contained herein constitutes a public offer to buy securities or fi nancial instruments.
This document constitutes an independent assessment of the relevant issuer and/or securities by DZ BANK. All assessments, expressions of opinion and statements contained herein are those of the writer and are not necessarily shared by the issuer or third parties. DZ BANK has obtained the information on which this document is based from sources that are considered reliable, but has not, however, verifi ed all of these documents. Accordingly, no representation or warranty as to the accuracy or completeness of the information or expressions of opinion contained herein is made by DZ BANK. DZ BANK shall not be liable for losses caused by the distribution and/or use of this document or any losses in connection with the distribution and/or use of this document.
Investors are urged not to base their investment decision regarding securities or other fi nancial instruments on this document, but rather on personal discussions with an adviser and the relevant sales prospectus or information memorandum.
Depending on the specifi c investment objectives, investment horizon, and fi nancial situation, any such recommendations may not suitable, in whole or in part, for individual investors. As trading recommendations are largely based on short-term market conditions, they may also confl ict with other recommendations made by DZ BANK.
The recommendations and expressions of opinion contained herein are as at the date of this document. They may becomeobsolete as a result of future developments, without this document being amended accordingly.
Competent supervisory authority
Bundesanstalt für Finanzdienstleistungsaufsicht (German Federal Financial Supervisory Authority), Lurgiallee 12, 60439 Frankfurt am Main, Germany
ImprintPublished by: DG HYP – Deutsche Genossenschafts-Hypothekenbank AG, Rosenstrasse 2, 20095 Hamburg
Management Board: Dr. Georg Reutter (Chairman of the Management Board), Manfred Salber
Authors:
Responsible: Stefan Bielmeier, Head of Research and Volkswirtschaft
Dr. Michael Holstein, Head of Volkswirtschaft
Author: Thorsten Lange, Analyst Real Estate Markets
All DZ BANK AG Deutsche Zentral-Genossenschaftsbank, Frankfurt am Main 2013
Reprinting and reproduction requires the approval of DG HYP

41
Real Estate Market Germany 2013 | 2014
DG HYP Regional Office Hanover Berliner Allee 5 30175 Hanover, Germany Phone +49 511 86643808 Fax +49 40 3334-782-3775
DG HYP Regional Office Kassel Rudolf-Schwander-Strasse 1 34117 Kassel, Germany Phone +49 561 602935-23 Fax +49 561 602935-24
DG HYP Regional Office LeipzigSchillerstraße 304109 Leipzig, Germany Phone +49 341 962822-92 Fax +49 341 962822-93
Institutional Clients
HamburgRosenstrasse 2 20095 Hamburg, Germany Phone +49 40 33 34-21 59Fax +49 40 33 34-12 60
DG HYP Offices
Deutsche Genossenschafts-Hypothekenbank AG 20095 Hamburg, Germany Rosenstrasse 2 PO Box 10 14 4620009 Hamburg Phone +49 40 33 34-0Fax +49 40 33 34-11 11Internet: www.dghyp.de
DG HYP Real Estate Centre Berlin Pariser Platz 3 10117 Berlin, Germany Phone +49 30 31993-5101 Fax +49 30 31993-5036
DG HYP Real Estate Centre Dusseldorf Steinstrasse 1340212 Dusseldorf, Germany Phone +49 211 220499-10 Fax +49 211 220499-40
DG HYP Real Estate Centre Frankfurt CITY-HAUS 1, Platz der Republik 6 60325 Frankfurt/Main, Germany Phone +49 69 750676-21 Fax +49 69 750676-99
DG HYP Real Estate Centre Hamburg Rosenstrasse 2 20095 Hamburg, Germany Phone +49 40 3334-3778 Fax +49 40 3334-1102
DG HYP Real Estate Centre Munich Türkenstrasse 16 80333 Munich, Germany Phone +49 89 512676-10 Fax +49 89 512676-30
DG HYP Real Estate Centre Stuttgart Heilbronner Strasse 41 70191 Stuttgart, Germany Phone +49 711 120938-0 Fax +49 711 120938-30
Real Estate Centres
Regional Offices

DG HYPDeutsche Genossenschafts-Hypothekenbank AGRosenstrasse 2 | 20095 Hamburg | Germany
Phone: +49 40 33 34-0 | Fax: +49 40 33 34-11 11www.dghyp.de As
at =
Oct
ober
201
3