geothermal energy in uganda, country update · 3.1.5 temperature gradient drilling the drilling of...
TRANSCRIPT
Proceedings World Geothermal Congress 2010 Bali, Indonesia, 25-29 April 2010
1
Geothermal Energy in Uganda, Country Update
Godfrey Bahati, James Francis Natukunda and Joshua Tuhumwire
Department of Geological Survey and Mines
Plot 21-29 Johnstone Road, P.O Box 9, Entebbe, UGANDA
[email protected], [email protected], [email protected]
Keywords: Uganda, geothermal, surface surveys, feasibility.
ABSTRACT
Exploration for geothermal energy in Uganda has been in progress since 1993. The studies have focused on three major geothermal areas namely Katwe, Buranga and Kibiro. The three areas are in advanced stages of surface exploration and will soon be subjected to exploratory drilling that will pave the way for a feasibility study. The overall objective of the study is to develop geothermal energy to complement hydro and other sources of power to meet the energy demand of rural areas in sound environment.
The current study has focused on geology, geochemistry, hydrology and geophysics with the aim of elucidating subsurface temperatures and the spatial extent of the geothermal systems. The results indicate that the geothermal activity in the three areas is related to the volcanic and tectonic activities of the Rift Valley, which has a higher heat flow than the surrounding Precambrian crust. Subsurface temperatures of approximately 140-200˚C for Katwe, 120-150˚C for Buranga, and 200-220˚C for Kibiro have been predicted by geothermometry and mixing models. Anomalous areas have been delineated in Katwe and Kibiro prospects using geophysical methods. Drilling of shallow boreholes to a depth of 200-300m for temperature gradient measurement has been completed and the temperatures measured (30-36˚C/km) are slightly above the global average of 30˚C/km, which suggests deep reservoirs in Katwe and Kibiro or geothermal reservoirs offset from the drilled areas. Additional geophysical measurements to locate the deep reservoirs and drill sites in the two areas are recommended. The results will then be used to update the geothermal models that will be a basis for the drilling of deep geothermal wells. The Buranga area still needs detailed geophysical surveys to delineate anomalous areas that could be targets for drilling.
The results of the preliminary geothermal investigations on other areas predict subsurface temperatures of 100 - 160˚C suitable for small scale electricity production and direct uses. These areas have been ranked based on predicted subsurface temperatures and other geothermal features for further exploration and development.
1. INTRODUCTION
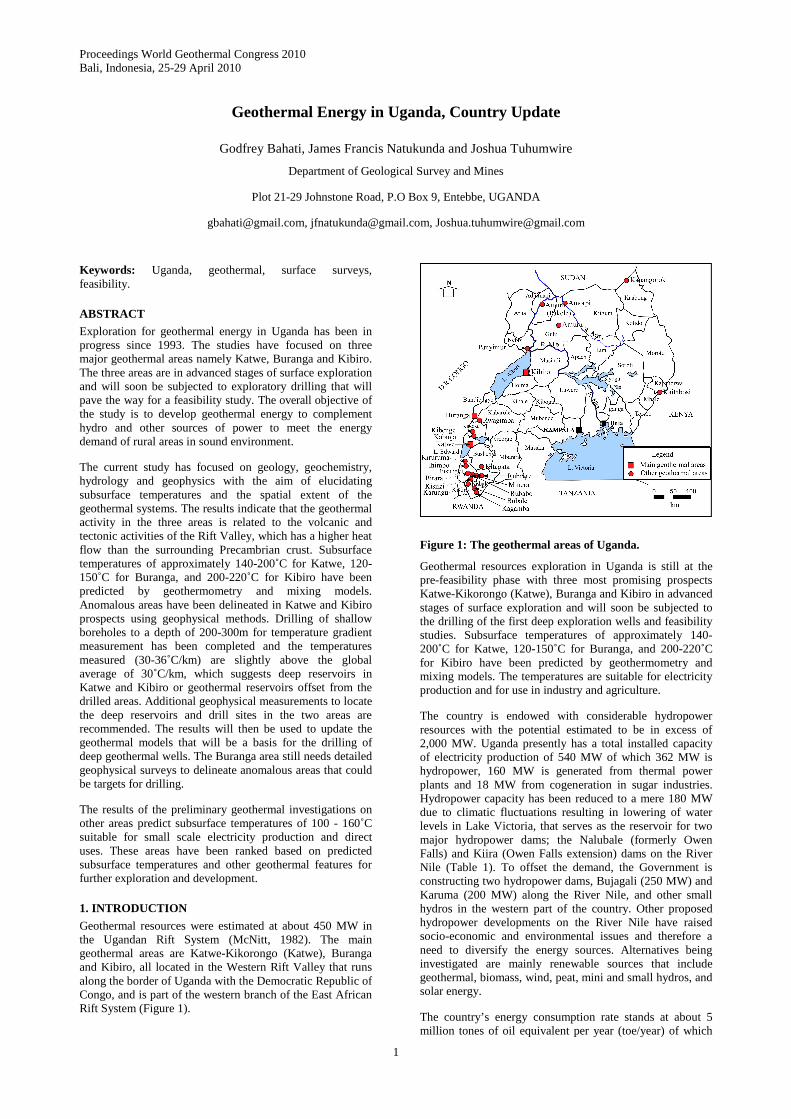
Geothermal resources were estimated at about 450 MW in the Ugandan Rift System (McNitt, 1982). The main geothermal areas are Katwe-Kikorongo (Katwe), Buranga and Kibiro, all located in the Western Rift Valley that runs along the border of Uganda with the Democratic Republic of Congo, and is part of the western branch of the East African Rift System (Figure 1).
Figure 1: The geothermal areas of Uganda.
Geothermal resources exploration in Uganda is still at the pre-feasibility phase with three most promising prospects Katwe-Kikorongo (Katwe), Buranga and Kibiro in advanced stages of surface exploration and will soon be subjected to the drilling of the first deep exploration wells and feasibility studies. Subsurface temperatures of approximately 140-200˚C for Katwe, 120-150˚C for Buranga, and 200-220˚C for Kibiro have been predicted by geothermometry and mixing models. The temperatures are suitable for electricity production and for use in industry and agriculture.
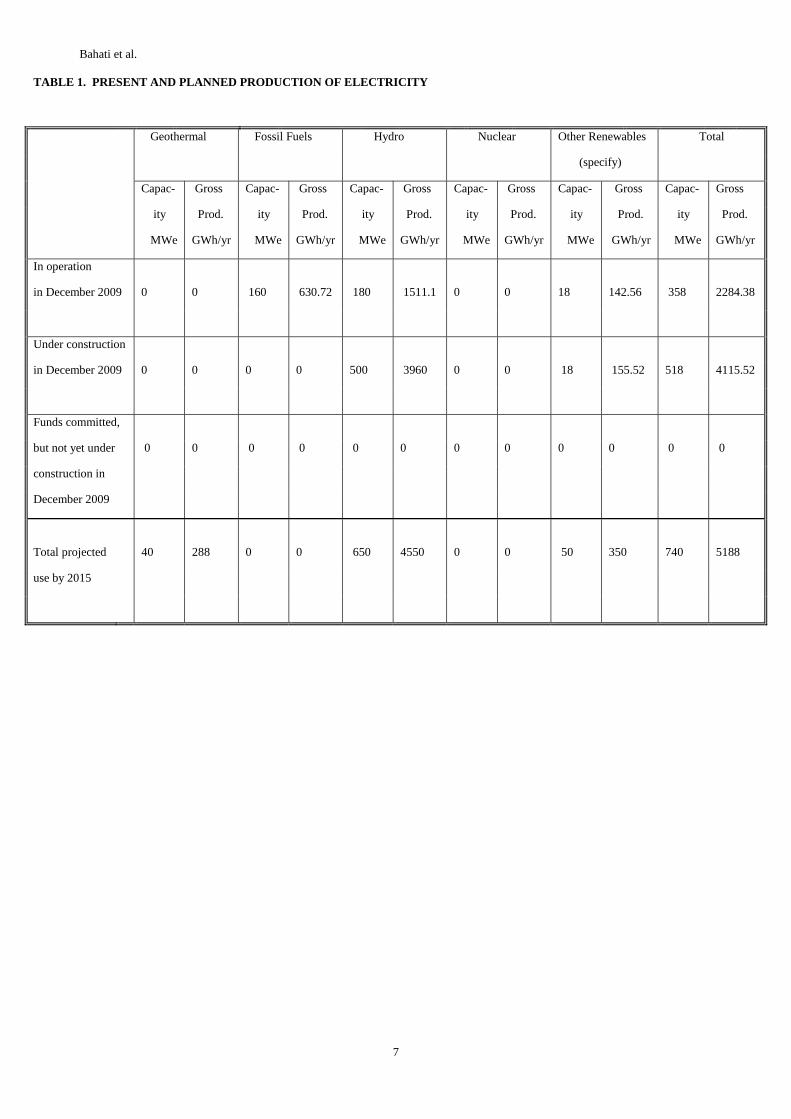
The country is endowed with considerable hydropower resources with the potential estimated to be in excess of 2,000 MW. Uganda presently has a total installed capacity of electricity production of 540 MW of which 362 MW is hydropower, 160 MW is generated from thermal power plants and 18 MW from cogeneration in sugar industries. Hydropower capacity has been reduced to a mere 180 MW due to climatic fluctuations resulting in lowering of water levels in Lake Victoria, that serves as the reservoir for two major hydropower dams; the Nalubale (formerly Owen Falls) and Kiira (Owen Falls extension) dams on the River Nile (Table 1). To offset the demand, the Government is constructing two hydropower dams, Bujagali (250 MW) and Karuma (200 MW) along the River Nile, and other small hydros in the western part of the country. Other proposed hydropower developments on the River Nile have raised socio-economic and environmental issues and therefore a need to diversify the energy sources. Alternatives being investigated are mainly renewable sources that include geothermal, biomass, wind, peat, mini and small hydros, and solar energy.
The country’s energy consumption rate stands at about 5 million tones of oil equivalent per year (toe/year) of which

Bahati et al.
2
approximately 90% is biomass (wood, charcoal and agricultural residues). The grid electricity access rate is very low: 10% for the whole country and about 2% for the rural areas. Electricity production is approximately 2,280 GWh per year with a demand for power growing by 8% per anuum.
The Ministry of Energy and Mineral Development (MEMD) implements the national energy policy with two departments i.e. Energy Resources (ERD) and Geological Survey and Mines (DGSM). The DGSM is responsible for exploration and development of the geothermal resources while the ERD is responsible for the energy policies formulation and implementation, and administration of energy laws.
The Uganda Energy Policy was enacted in 2002 and is implemented by the Uganda Electricity Act 1999. This Act provides for an independent Electricity Regulatory Authority (ERA), private sector participation in power generation and distribution with transmission remaining a government parastatal in the medium term. The major goal of the energy policy 2002, is to meet the energy needs of Uganda’s population for social and economic development in an environmentally sustainable manner. To achieve the above goal, there is need to tap all possible sources of energy in the country, including the new and renewable sources, to which geothermal belongs. Accordingly, one of the Energy Policy, 2002 objectives is to establish the availability, potential and demand of the various energy sources.
To further focus on the above objective, a New and Renewable Energy Policy, 2007 has been put in place. The Policy aims to provide a framework to increase in significant proportions the contribution of renewable energy in the energy mix. The policy has: 1) Introduced the feed in tariffs, 2) Standardized Power Purchase Agreements, 3) Obligation of fossils fuel companies to mix products with biofuels up to 20% and 4) Tax incentives on renewable energy technologies.
This paper presents the current status of the geothermal exploration project, and planned exploration and development activities on the geothermal systems of Uganda.
2. STUDY AREAS
The main geothermal areas are Katwe, Buranga and Kibiro (Figure 1). The three areas were chosen for study because of their volcanic and tectonic features that indicate heat sources and high permeability.
Other areas are located within or on the outskirts of the Rift Valley in southwest, west, and north and in isolated places in east and northeast Uganda (Figure 1).
3. CURRENT STATUS
3.1 Katwe geothermal prospect
3.1.1 Geology
The results of geological surveys in the Katwe prospect indicate that explosion craters, ejected pyroclastics, tuffs with abundant granite and gneissic rocks from the basement dominate the area (Figure 2). The volcanic rocks, mainly composed of pyroclastics and ultramafic xenoliths, are deposited on the extensive Pleistocene lacustrine and fluvial Kaiso beds and in some places directly on Precambrian rocks. Minor occurrences of lava are found in the Lake Kitagata and Kyemengo craters. The age of the volcanic activity has been estimated as Pleistocene to Holocene (Musisi, 1991). The deposit is greyish, generally coarse to
fine-grained, calcareous and mixed with sand and silt of Pleistocene sediments. Travertine deposits have been found in Lake Katwe, Lake Nyamunuka, Lake Kasenyi, and Lake Kikorongo (Groves, 1930) and in the vicinity of Lake Kikorongo at Kikorongo junction (Kato, 2003). The lava flows, craters and extinct hydrothermal deposits give an indication of a heat source for the geothermal activity. The prospect stretches from Lake Katwe to Lake Kikorongo and occupies an area of approximately 150 km2. Outside the crater area, the geology is characterised by surficial deposits to the east and the west, and to the north lie the Rwenzori Mountains whose geology is dominated by gneisses, granites, granulites, amphibolites, schists and in some places quartzites.
Figure 2: Geology of Katwe volcanic field and surroundings.
3.1.2 Geothermal manifestations
The geothermal surface manifestations in the Katwe prospect are hot springs located in the Lake Kitagata crater, and warm springs and travertine deposits that have built up tufas in the Lake Katwe crater, which is located 12 km southwest of Lake Kitagata (Figure 2). The maximum surface temperature in the hot springs in Lake Kitagata crater is 70°C, while in Lake Katwe Crater it is 32ºC.
3.1 3 Geochemistry
The geothermal fluids are characterized by high carbonate and sulphate, and salinity of 19,000 - 28,000 mg/kg total dissolved solids. High carbonate and sulphate in the geothermal water tend to invalidate solute geothermometer results in Katwe. Subsurface temperatures are estimated at 140-200˚C using plausible solute geothermometers (Armannsson, 1994). The thermal fluids from Lake Kitagata and Lake Katwe craters are characterised by the presence of high levels of hydrogen sulphide of about 30-40 ppm which, suggests the source of the geothermal water to be volcanic and hydrothermal (Bahati, 2003).
3.1.4 Isotope hydrology
A number of water samples from hot springs, cold springs, rivers and lakes as well as rock samples were collected and analyzed for isotopic compositions. The objective was to provide hydrological information essential to the exploration
Bahati et al.
3
for geothermal resources using isotopes. Isotopes analyzed for included those of hydrogen (δ2HH2O, 3HH2O), oxygen (δ18OH2O, 18OSO4), sulphur (δ34SSO4), and strontium (87/86SrH2O, 87/86SrRock).
The results indicate that the Katwe geothermal system is most likely recharged from high ground in the Rwenzori Mountains. The tritium concentration in the thermal waters from the Katwe area is minimal suggesting that the hot spring water is not mixed with cold groundwater. The isotopic composition of sulphur (δ34S), and oxygen (δ18O) in sulphate suggests a magmatic and hydrothermal source for the geothermal water. Strontium isotopes in water and rock (87/86SrH2O, 87/86SrRock) indicate an interaction between the rocks sampled and the geothermal fluids. The rocks interacting with the fluids, i.e the reservoir rock types, in Katwe are basalt. The major source of salinity is rock dissolution, but some magmatic input is suggested (Bahati, et. al., 2005).
A temperature of 140 - 150°C was obtained for the sulphate-water (S18O4-H2
18O) isotope geothermometer (Bahati, et. al., 2005) which compares reasonably well with that from solute geothermometers.
3.1.4 Geophysics
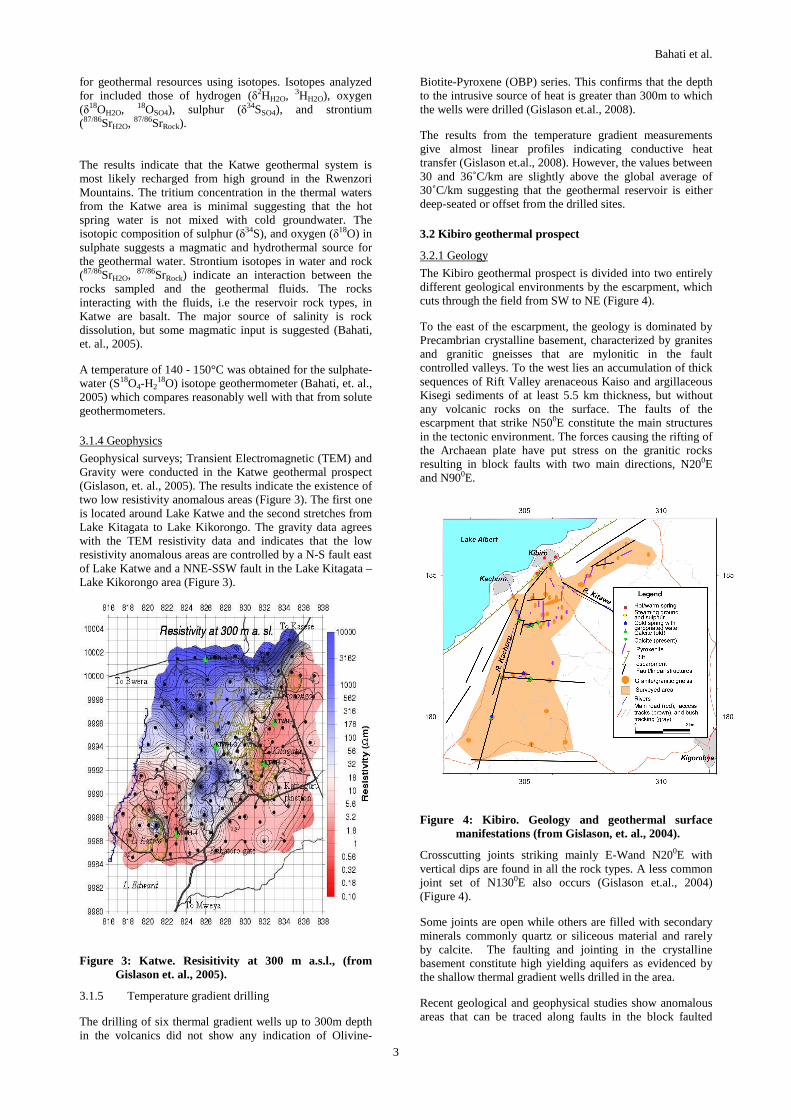
Geophysical surveys; Transient Electromagnetic (TEM) and Gravity were conducted in the Katwe geothermal prospect (Gislason, et. al., 2005). The results indicate the existence of two low resistivity anomalous areas (Figure 3). The first one is located around Lake Katwe and the second stretches from Lake Kitagata to Lake Kikorongo. The gravity data agrees with the TEM resistivity data and indicates that the low resistivity anomalous areas are controlled by a N-S fault east of Lake Katwe and a NNE-SSW fault in the Lake Kitagata – Lake Kikorongo area (Figure 3).
Figure 3: Katwe. Resisitivity at 300 m a.s.l., (from Gislason et. al., 2005).
3.1.5 Temperature gradient drilling
The drilling of six thermal gradient wells up to 300m depth in the volcanics did not show any indication of Olivine-
Biotite-Pyroxene (OBP) series. This confirms that the depth to the intrusive source of heat is greater than 300m to which the wells were drilled (Gislason et.al., 2008).
The results from the temperature gradient measurements give almost linear profiles indicating conductive heat transfer (Gislason et.al., 2008). However, the values between 30 and 36˚C/km are slightly above the global average of 30˚C/km suggesting that the geothermal reservoir is either deep-seated or offset from the drilled sites.
3.2 Kibiro geothermal prospect
3.2.1 Geology
The Kibiro geothermal prospect is divided into two entirely different geological environments by the escarpment, which cuts through the field from SW to NE (Figure 4).
To the east of the escarpment, the geology is dominated by Precambrian crystalline basement, characterized by granites and granitic gneisses that are mylonitic in the fault controlled valleys. To the west lies an accumulation of thick sequences of Rift Valley arenaceous Kaiso and argillaceous Kisegi sediments of at least 5.5 km thickness, but without any volcanic rocks on the surface. The faults of the escarpment that strike N500E constitute the main structures in the tectonic environment. The forces causing the rifting of the Archaean plate have put stress on the granitic rocks resulting in block faults with two main directions, N200E and N900E.
Figure 4: Kibiro. Geology and geothermal surface manifestations (from Gislason, et. al., 2004).
Crosscutting joints striking mainly E-Wand N200E with vertical dips are found in all the rock types. A less common joint set of N1300E also occurs (Gislason et.al., 2004) (Figure 4).
Some joints are open while others are filled with secondary minerals commonly quartz or siliceous material and rarely by calcite. The faulting and jointing in the crystalline basement constitute high yielding aquifers as evidenced by the shallow thermal gradient wells drilled in the area.
Recent geological and geophysical studies show anomalous areas that can be traced along faults in the block faulted

Bahati et al.
4
granites to the east and away from the Rift escarpment (Gislason, et. al., 2004).
3.2.2 Geothermal manifestations
The geothermal surface manifestations in the Kibiro geothermal prospect are mainly concentrated at Kibiro and Kachuru, west of the escarpment, on the shores of Lake Albert. They comprise hot and warm springs at Kibiro, and fumarolic activity at Kachuru (Figure 4). The fumarolic activity is heavily pronounced in the Kachuru area and along the escarpment for approximately 1.5 km from the intersection of the Kachuru fault and the main escarpment to the Kibiro hot springs. Calcite deposits are observed in cracks and fissures in many locations along the escarpment, Kachuru fault, Kitawe fault and in the crystalline rocks located south-southeast of Kibiro, indicating extinct thermal fluid discharges.
The hot springs at Kibiro are apparently related to a secondary fault, oblique to the main Rift fault, and most likely controlled by their intersection (Figure 4). The total flow measured from the hot springs is approximately 7 l/s and the maximum surface temperature is 86.4˚C (Gislason et. al., 1994).
3.2.3 Geochemistry
The fluids are characterised by a neutral pH, and salinity of 4,000 - 5,000 mg/kg total dissolved solids. A subsurface temperature of 200 - 220°C is inferred by geothermometry and mixing models (Armannsson, 1994).
3.2.4 Isotope hydrology
Stable isotope results show that two groups of waters located east and south of Kibiro represent the groundwater that could be the source of recharge for the Kibiro hot springs (Figure 5). A massive flow of groundwater from a higher elevation than all the cold-water sampling points is also suggested. This high ground is represented by the Mukhihani-Waisembe Ridge in Kitoba subcounty, located 20 km southeast of Kibiro.
285000 290000 295000 300000 305000 310000 315000 320000 325000 330000 335000 340000
Eastings (m)
160000
165000
170000
175000
180000
185000
190000
195000
200000
Nor
thin
g (m
)
25
26
27
2829
30
32 33
34
1
2
3
21
22
416
19
20
7
8
9
10
11
12
13
31
14
15
17
Kibiro
Biiso
Kigorobya
Buseruka
Kitoba
Mukhih
ani-W
aisem
be R
idge
-12
-11
-9
-8
-6
-5
-3
-2
0
2
3
5
6
D
Figure 5: Kibiro. Deuterium variation in surface and groundwaters, dots represent sampling points.
The tritium concentration of the Kibiro hot spring water is 1.25 TU similar to that of the groundwaters (0 - 3.5 TU), and indicates that the hot spring water has cold groundwater contribution as suggested by geochemical modelling and is therefore a mixture of a hot water component and cooler
water (Ármannsson, 1994). However, it should be noted that the tritium background in precipitation for the area is rather low, up to a few tritium units only, and indications of mixing may not always be clear.
The isotope composition of sulphur and oxygen in sulphates expressed in δ34S (SO4) and δ18O (SO4) suggest a magmatic contribution. Strontium isotopes in water and rock (87/86SrH2O, 87/86SrRock) indicate an interaction between the granitic gneisses and the geothermal fluids. The reservoir rock types in Kibiro are, therefore, granitic gneisses (Bahati, et. al., 2005).
3.2.5 Geophysics
The results of the geophysical surveys indicate the existence of anomalous areas in the Kibiro prospect (Gislason et. al., 2004). A low resistivity anomaly trench was traced into the crystalline basement, following the fault lines of the block-faulted granites, first to the SSW away from Kibiro and then following W-E fault lines toward Kigorobya Town (Figure 6).
Figure 6: Kibiro. Resisitivity at 300 m a.s.l., faults and fractures, geothermal surface manifestations (stars) (from Gislason et. al., 2005).
The gravity data does not show any distinct density variations, except for the large density contrast between the sediments in the Rift Valley and the granites east of the escarpment. There is, however, an indication of a higher gravity field in an area roughly coinciding with the W-E low-resistivity anomalous area (Figure 6). This might indicate a deep higher density intrusive acting as a heat

Bahati et al.
5
source for the geothermal activity producing the low-resistivity anomaly.
The cause of these low-resistivity anomalies can, at the moment, not be stated with certainty, but the most likely explanation is conductive alteration minerals in fractures in the otherwise resistive base-rock. Saline water in fractures could also be a possible candidate, but the relatively low salinity of the water discharges from hot springs at Kibiro and other cold springs in the area makes this rather unlikely.
3.2.6 Temperature gradient drilling
Six thermal gradient wells were drilled up to 300 m in the geophysical anomalous areas in the crystalline basement. The lithological analysis and the temperature gradient results indicate absence of a geothermal gradient east of the escarpment (16˚C/km) but slightly elevated towards the escarpment (31˚C/km).
3.3 Buranga geothermal prospect
3.3.1 Geology
Buranga is located at the foot of the Rwenzori massif near the base of Bwamba escarpment and localized by the major Rift Valley faults (Figure 7). Buranga has no evidence of volcanism but is highly tectonically active.
The hot springs emerge through sediments of Kaiso beds and peneplain gravels. The Kaiso beds and peneplain gravels consists of variable sands and gravels with irregularly distributed boulders containing sub-angular fragments.
Figure 7: Buranga geothermal area.
The Kaiso sediments are underlain by fine to medium-grained, poorly consolidated sands and clays; some coated with calcareous material. Precambrian rocks of the main rift fault, which strikes N45oE and dips N60-65oE, underlie the sediments. The rocks form the northern half of Rwenzori massif and consists of mainly migmitites, gneisses and amphibolites. They strike N10-30oE and have complex joint systems. The hot springs seem to lie on a fracture / fault line striking N40oE parallel to main rift fault.
3.3.2 Geothermal manifestations
Buranga has the most impressive surface geothermal manifestations with a wide areal coverage in the whole of
the western branch of the East African Rift System. They include hot springs that are close to boiling and calcareous tufa. The surface temperature is close to 98˚C and the flow is approximately 10-15 litres/second, an indication of high permeability.
3.3.3 Geochemistry
The fluids are neutral with a pH of 7-8 and salinity of 14,000 – 17,000 mg/kg total dissolved solids. In the earlier study by Ármannsson (1994) a good agreement was obtained for all plausible solute geothermometers tested for several hot springs and pools in Buranga and it was concluded that the subsurface temperature was 120 - 150°C.
3.3.4 Isotope hydrology
The results from stable isotopes suggest that the geothermal water is from high ground in the Rwenzori Mountains like in Katwe (Figure 8).
-30
-25
-20
-15
-10
-5
0
5
10
-5 -4.5 -4 -3.5 -3 -2.5 -2 -1.5 -1 -0.5 0
δ18O
δ2 H
Hot Springs
Rivers
Groundwater
Kibenge-HS
LMWL
Figure 8: Buranga. Stable isotopic composition of hot and cold water samples.
There is no tritium in the thermal water from Buranga which implies that it is not mixed with cold groundwater. The strontium ratios in rocks indicate that the geothermal water, most likely, interacts with granitic gneisses. The source of sulphate is minerals or rock (terrestrial evaporates) with a possible magmatic contribution (Bahati et. al., 2005). Studies by the Federal Institute for Geosciences and Natural Resources (BGR) of Germany and the Government of Uganda using helium isotopic ratio (3He/4He) in gaseous discharges from hot springs also suggest a magmatic source of solutes for Buranga (BGR-MEMD, 2007).
3.4 Other geothermal areas
The rest of the geothermal areas of Uganda are at a preliminary level of investigation. The current results predict subsurface temperatures of 100 - 160˚C suitable for electricity production and direct uses. Five areas have been selected for detailed surface exploration and they include Rubaare in Ntungamo district, Panyimur in Nebbi district, Kitagata in Bushenyi district, Ihimbo in Rukungiri district, and Kanangorok in Kabong district.
4. CONCLUSIONS
Subsurface temperatures of 140-200°C, 120-150°C and 200-220°C are inferred by geothermometry for Katwe, Buranga and Kibiro respectively. The temperatures, if confirmed are high enough for electricity production and for direct use in industry and agriculture.
Anomalous areas have been mapped by geology and geophysical studies in Katwe and Kibiro prospects.

Bahati et al.
6
Temperature gradient measurements suggest a deep geothermal reservoir in Katwe and Kibiro that is either deep seated or offset from current drilled positions.
Isotope hydrology results indicate the source of the geothermal fluids to be from high ground in the Rwenzori Mountains for Katwe and Buranga, and from the Mikihani-Waisembe ridge for Kibiro. Reservoir rock types are most likely basalt in Katwe, and granitic gneisses in Buranga and Kibiro.
Three areas, Katwe, Buranga and Kibiro, have reached advanced stages of surface exploration and so have their geothermal models.
In other areas, the current study has identified other geothermal potential areas for further exploration and development.
5. RECOMMENDATIONS
Katwe: Before the feasibility study is undertaken, the following need to be done: 1) Carry out additional geophysical surveys using the magnetotellurics (MT) method to probe in the deeper layers of the crust and identify the heat source, 2) Structural geological and hydrological mapping focused on locating drill sites, 3) Updating of the geothermal models and location of drill sites.
Kibiro: Before the feasibility study, the following need to be done: 1) Carry out additional geophysical surveys using the magnetotellurics (MT) method to delineate the geothermal anomalous area from the current large anomalous area, 2) Structural geological and hydrological mapping focused on locating drill sites, and 3) Updating of the geothermal model and location of drill sites.
Buranga has not reached advanced stages in surface exploration like Katwe and Kibiro. The following activities need to be done before the area is recommended for the feasibility study: 1) Carry out detailed geophysical surveys using MT, Transient Electomagnetics (TEM), and Micro-seismics to delineate geothermal anomalous areas and 2) Updating of the geothermal model and location of drill sites.
Feasibility study: Drilling of 2-3 wells to discover a reservoir in the most promising prospect(s); Katwe, Buranga and Kibiro. The objective of the feasibility study is to drill at selected sites; prepare technical and financial/investment plans for the installation of appropriately sized power plants and feasibility of direct use in industry and agriculture.
The rest of the geothermal areas should be investigated in detail for the possibility of installing binary geothermal power plants. The most promising areas from the current results include Rubaare in Ntungamo district, Panyimur in Nebbi district, Kitagata in Bushenyi district, Ihimbo in Rukungiri district, and Kanangorok in Kabong district.
ACKNOWLEDGEMENTS
The authors wish to thank all the organisations/governments that have supported the Uganda geothermal exploration and development programme since 1993. They include the United Nations Development Programme (UNDP), Organization of Petroleum Exporting Countries (OPEC), International Atomic Energy Agency (IAEA), African Development Bank (AfDB), World Bank (WB), Federal Institute for Geosciences and Natural Resources (BGR) of Germany, and Governments of Iceland and Uganda.
REFERENCES
Ármannsson, H., 1994. Geochemical Studies on three geothermal areas in West and Southwest, Uganda. Final Report. Geothermal Exploration UGA/92/003, UNDESD, GSMD, Uganda, 85pp.
Bahati, G., 2003. Geothermal Energy in Uganda, Country update. International Geothermal Conference, Reykjavik, Iceland. S04 paper 124, p. 48-53.
Bahati, G., Z. Pang, H. Armannsson, E.M. Isabirye, V. Kato, 2005. Hydrology and reservoir characteristics of three geothermal systems in Western Uganda, Geothermics, 34, p.568-591.
BGR-MEMD, 2007. Detailed surface analysis of the Buranga geothermal prospect, West-Uganda. Draft terminal report, 95 pp.
Gislason, G., G. Ngobi, E.M. Isabirye, and S. Tumwebaze, 1994. An Inventory of three Geothermal Areas on West and Southwest Uganda. Prepared by the United Nations for a Project of the UNDP.
Gíslason, G., K. Árnason, H. Eysteinsson, 2004. The Kibiro Geothermal Prospect. A Report on a Geophysical and Geological Survey. Prepared for the Icelandic International Development Agency and the Ministry of Energy and Mineral Development, Uganda. Unpublished report, June 2004. 109 pp.
Gíslason, G., K. Árnason, H. Eysteinsson, 2005. The Katwe and Kibiro Geothermal Prospects. A Draft Report on a Geophysical and Geological Survey. Prepared for the Icelandic International Development Agency and the Ministry of Energy and Mineral Development, Uganda.
Gíslason, G., K. Árnason, H. Eysteinsson and Ingvar T. Magnusson, 2008. The Katwe Geothermal Prospect. A Draft Report on a Geophysical and Geological Survey. Prepared for the Icelandic International Development Agency and the Ministry of Energy and Mineral Development, Uganda.
Groves, A.W., 1930. Report on the nature, origin and available supply of the salt of Lake Katwe, Kasenyi, with notes on Lake Kikorongo and an appendix of the petrography of volcanic bombs of the district.
Kato, V., 2003. Geology of Katwe – Kikorongo Prospect. Unpublished DGSM Report KVK-22.
McNitt. J.R., 1982. The geothermal potential of East Africa. In proceedings of the Regional Seminar on Geothermal Energy in Eastern and Southern Africa, Nairobi, Kenya. P. 3 - 8.
Musisi, J., 1991. The neogene geology of the Lake George – Edward basin, Uganda. PhD thesis.
Wayland, E.J., 1935. Notes on thermal and mineral springs in Uganda. UGSM Bull. 2, p. 44-54.
Bahati et al.
7
TABLE 1. PRESENT AND PLANNED PRODUCTION OF ELECTRICITY
Geothermal Fossil Fuels Hydro Nuclear Other Renewables Total
(specify)
Capac- Gross Capac- Gross Capac- Gross Capac- Gross Capac- Gross Capac- Gross
ity Prod. ity Prod. ity Prod. ity Prod. ity Prod. ity Prod.
MWe GWh/yr MWe GWh/yr MWe GWh/yr MWe GWh/yr MWe GWh/yr MWe GWh/yr
In operation
in December 2009 0 0 160 630.72 180 1511.1 0 0 18 142.56 358 2284.38
Under construction
in December 2009 0 0 0 0 500 3960 0 0 18 155.52 518 4115.52
Funds committed,
but not yet under 0 0 0 0 0 0 0 0 0 0 0 0
construction in
December 2009
Total projected 40 288 0 0 650 4550 0 0 50 350 740 5188
use by 2015

Bahati et al.
8
TABLE 7. ALLOCATION OF PROFESSIONAL PERSONNEL TO GEOTHERMAL
ACTIVITIES (Restricted to personnel with University degrees)
(1) Government (4) Paid Foreign Consultants
(2) Public Utilities (5) Contributed Through Foreign Aid Programs
(3) Universities (6) Private Industry
Year Professional Person-Years of Effort
(1) (2) (3) (4) (5) (6)
2005 9 - - - 5 -
2006 9 - - - 0 -
2007 9 - - - 0 -
2008 10 - - - 0 -
2009 11 - - - 1 -
Total 48 - - - 1 -
TABLE 8. TOTAL INVESTMENTS IN GEOTHERMAL IN (2004) US$
Research & Field Development Utilization Funding Type
Period Development Including Production
Incl. Surface Explor. Drilling &
& Exploration Drilling Surface Equipment Direct Electrical Private Public
Million US$ Million US$ Million US$ Million US$ % %
1995-1999 0.078 - - - - 100
2000-2004 1.130 - - - - 100
2005-2009 0.760 - - - - 100