geothermal data of the united states · department of the interior franklin k. lane, secretary...
TRANSCRIPT
DEPARTMENT OF THE INTERIORFRANKLIN K. LANE, Secretary
UNITED STATES GEOLOGICAL SURVEYGEORGE OTIS SMITH, Director
Bulletin 701
GEOTHERMAL DATA OF THE UNITED STATES
INCLUDING MANY ORIGINAL DETERMINATIONS
OF UNDERGROUND TEMPERATURE
m-
BY
N. H. DARTON
WASHINGTONGOVERNMENT PRINTING OFFICE
1920

CONTENTS.
Page.Introduction.............................................................. 7Alabama................................................................. 9
Temperatures......................................................... 9Summary............................................................ 11Geologic relations..................................................... 12
Arizona.................................................................. 13Source of information.....................'.,............................ 13Phoenix............................................................... 13Congress mine........................................................ 14Plateau region........................................................ 15San Simon Valley...................................................... 15
Arkansas.................................................................. 17Temperatures.......................................................... 17Summary............................................................ 18Geologic relations.................................................... 18
California................................................................ 18Southern California.................................................... 18San Luis Obispo....................................................... 22San Joaquin Valley................................................... 22Indio Basin.......................................................... 25Oil region............'................................................ 27Grass Valley.......................................................... 27
Colorado................................................................. 28\rkansas Valley....................................................... 28San Luis Valley...................................................... 29Leadville............................................................ 30Trinidad............................................................. 30Denver Basin.......................................................... 30Miscellaneous localities............................................... 31Summary............................................................ 31Geologic relations..................................................... 31
Florida .................................................................... 32St. Augustine .......................................................... 32Miscellaneous data.................................................... 33Summary............................................................ 34Geologic relations..................................................... 34
Georgia.................................................................. 34Temperatures.......................................................... 34Summary............................................................ 35Geologic relations..................................................... 35
Idaho.................................................................... 36Boise.................................................:............... 36Snake River valley................................................... 36Nez Perce County.................................................... 37
3
4 CONTENTS.
Page.Illinois................................................................... 37
Temperatures........................................................... 37Summary............................................................ 39Geologic relations..................................................... 39
Indiana................................................................... 40Temperatures.......................................................... 40Summary............................................................ 40
Iowa...................................................................... 40Temperatures.......................................................... 40Summary...............................................-.-..-.-......... 42Geologic relations..................................................... 43
Kansas.. ................................................................... 44Temperatures ........'................\.............................. 44Summary............................................................ 45Geologic relations..................................................... 45
Kentucky................................................................ 46Temperatures.......................................................... 46Summary............................................................ 46Geologic relations...........................................:......... 46
Louisiana.............................................................;.. 47Belle Island.......................................................... 47Miscellaneous data.................................................... 47Summary............................................................ 47Geologic relations. .................................................... 47
Maryland................................................................. 47Michigan.................................................................. 50
Sources of information.................................................. 50Northern peninsula.................................................... 50Central and southern Michigan........................................... 52
Minnesota................................................................ 54Mississippi................................................................ 54
Temperatures.......................................................... 54Summary............................................................ 55Geologic relations...............................................:..... 55
Missouri.................................................................. 55Temperatures.. ........................................ :............... 55Summary............................................................ 57Geologic relations.................................................:... 58
Montana .................................................................. 58Anaconda mine........................................................ 58Miles City............................................................. 59Little Bitterroot Valley................................................ 59
Nebraska. ................................................................ 60Temperatures.......................................................... 60Summary............................................................ 62Geologic relations..................................................... 62
Nevada................................................................... 63Comstock lode........................................................ 63Tonopah.............................................................. 63
New Jersey............................................................... 64Temperatures.......................................................... 64Summary............................................................ 65Geologic relations..................... i ............................... 65

CONTENTS. 5
Page.New Mexico............................................................... 65North Carolina.............................................................. 66North Dakota.............................................................. G6Ohio..................................................................... C6
Findlay...............................;.............................. 66Miscellaneous wells.................................................... 67
Oklahoma................................................................ 68Temperatures.......................................................... 68Summary............................................................ 69Geologic relations..................................................... 69
Pennsylvania............................................................. 69Anthracite region...................................................... 69West Elizabeth........................................................ 71McDonald............................................................. 71Pittsburgh............................................................ 72Homewood............................................................ 72
South Carolina............................................................. 73Temperatures.......................................................... 73Summary.............................................................. 73Geologic relations..................................................... 73
South Dakota. .............................................................. 74Temperatures...'....................................................... 74Summary.............................................................. 80Geologic relations..................................................... 81
Tennessee................................................................ 82Texas.................................................................... 82
Temperatures.......................................................... 82Summary.............................................................. 85Geologic relations..................................................... 85
Utah..................................................................... 86Virginia................................................................... 87
Richmond coal field................................................... 87Fort Monroe...'....................................................... 88Reedville.............................................................. 88
Washington............................................................... 88Yakima artesian basin.................................................. 88Walla Walla........................................................... 89Whitman County........................................................ 89
West Virginia.............................................................. 89Wheeling.............................................................. 90Chelyan.............................................................. 91Mannington........................................................... 91Spencer ............................................................. 92Volcano Junction.................................................... 93Grantsville .......................................................... 93Shinnston........................................................... 94Lake well............................................................ 94Goff well.............................................................. 94
Wisconsin................................................................. 94Temperatures.......................................................... 95Summary.............................................................. 95Geologic relations...................................................... 96
Wyoming.................................................................. 97
ILLUSTRATIONS.
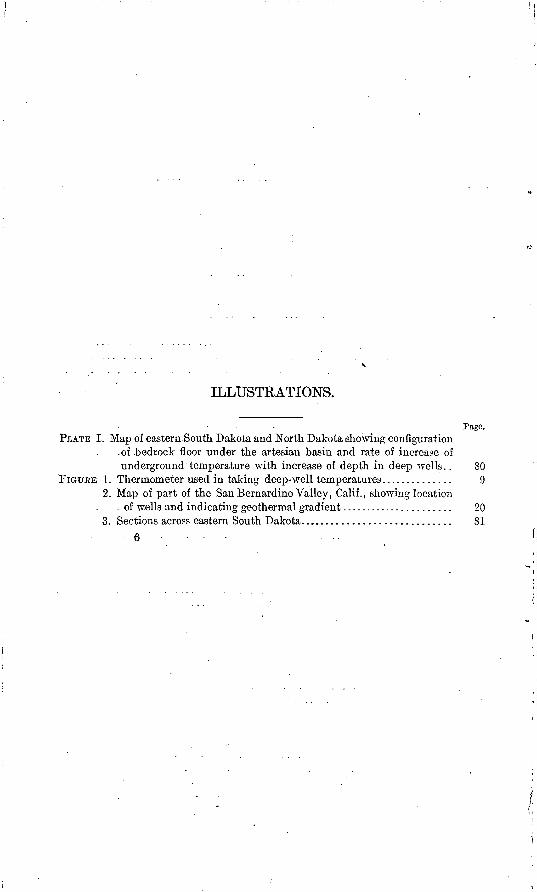
Page.PLATE I, Map of eastern.South Dakota and North Dakota showing configuration
.of .bedrock floor under the artesian basin and rate of increase of underground temperature with increase of depth in deep wells.. 80
FIGURE 1. Thermometer used in taking deep-well temperatures.............. 92. Map of part of the San Bernardino Valley, Calif., showing location
. of wells and indicating geothermal gradient...................... 203. Sections across eastern South Dakota............................. 81
6 ......
INCLUDING MANY ORIGINAL DETERMINATIONS OF UNDERGROUND TEMPERATURE.
By N. H. DAETON.
INTRODUCTION.
The purpose of this report is to present all available published data bearing on the rate of increase of underground temperature with increasing depth in the United States, together with several hundred original observations by myself and my associates. A canvass of the governmental, State, and serial publications has yielded many records of temperature of flowing wells and also a few observations made with thermometers in borings and deep mines. Additional data on temperature of flows have been given by correspondents. Some of the data, especially those relating to flows from wells, may not be reliable, and as a rule these could not be discriminated. Many records are omitted because no facts are available as to the source of flow.
During extended investigations of the geology of underground waters in many parts of the United States I and my assistants have had opportunity to observe the temperature of flows and to sink thermometers in deep borings. One very important contribution has come from an associate, J. E. Todd, who recorded the temperature of flows from a large number of wells in central-eastern South Dakota.
Mr. C. E. Van Orstrand, of the U. S. Geological Survey, has taken observations in various exceptionally deep wells in Pennsylvania, West Virginia, Oklahoma, and Texas, with very accurate apparatus, but only a few of the data are published.
The principal feature brought out by the data here presented is the fact that the rate of increase in underground temperature with increase in depth varies widely from place to place, though probably subject to certain regional relations. There is also a local and possibly a general variation in rate at different depths, but few of the observa tions have afforded data on this matter. The fact that there are regional variations has been recognized for half a century and was brought out in considerable detail in Prestwich's compilation of data
7

8 GEOTHEKMAL DATA OF THE UNITED STATES.
up to 1886 1 and his later publication in 1S95. 2 This observer and others later have grouped earth temperatures and attempted to show their relation to rocks and minerals of various kinds,3 petroleum,4 flowing water, etc. There are undoubtedly in the earth many factors that may influence the rate of temperature increase, such as variation in conductivity of rocks, underground tension, mineralization, vol canic influences, and movement of underground waters. Variation in radioactivity has been suggested as a factor, and the influence of bodies of cold water, such as Lake Superior, and the former presence of glacial ice are thought to be causes of local diminution of earth temperature. Positive evidence is lacking as to all these matters, however, and we must await the results of extended special investiga tions before the weight of the several factors can be evaluated.
In nearly all my calculations of the rate of increase in temperature with increase in depth mean annual air temperatures were used as a standard. These were obtained from publications of the Weather Bureau, United States Department of Agriculture, and nearly all of them represented averages up to and including 1916. 5 In places for which no observations are on record temperatures were deduced from means of near-by stations, with due consideration of .difference in latitude and altitude. It is realized that these means of air tem perature may differ from the ground temperature a few yards below the surface to the amount of 2° or more, but they were the only data available for comparison. 6 In a few places the temperatures at shallow depths were recorded, and the rate of increase could also be calculated from them.
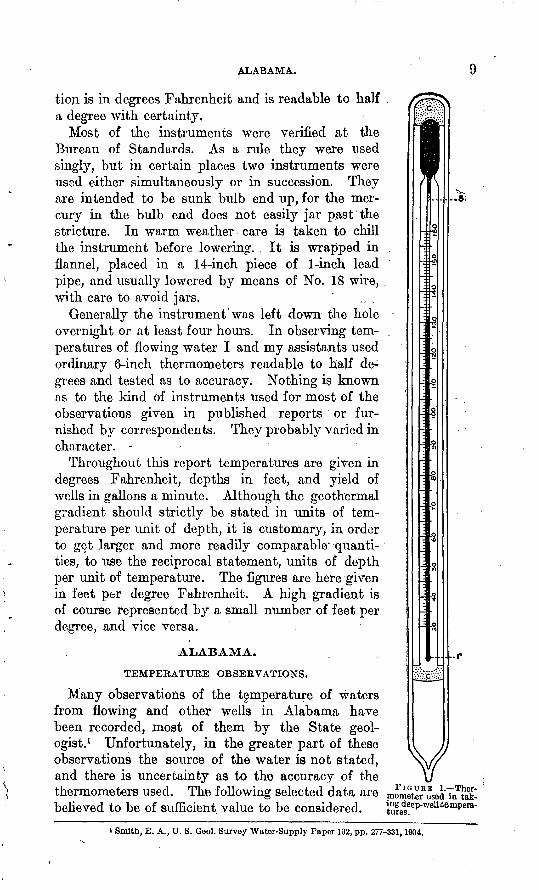
The thermometers used by me and my assistants and supplied to certain correspondents were maximum self-registering instruments made to order by Henry Green, of Brooklyn, N. Y. The style is similar to that used by William Hallock, but certain modifications were found desirable. The modified form has been termed the Dar- ton thermometer, but the difference hardly merits the title. The main features are shown in figure 1. A 10-inch outer tube of heavy glass, sealed, carries an 8-inch thermometer held by plugs of cork, C; S, stricture; r, rounded end of mercury column. The calibra-
1 Prestwich, J., On underground temperatures: Roy. Soc. London Proc., vol. 41, pp. 1-116,1886.2 Prestwich, J., On underground temperatures, in Collected papers on some controverted question in
geology, pp. 166-279, published separately, London, 1895.3 Konigsberger, J., Normale und anormale Werte der geothermischen Tiefenstufe: Centralbl. Miner:
alogic, 1907, pp. 673-679.* Konigsberger, J., and Muhlberg, Max, Uber Messungen der geothermischen Tiefenstufe deren Technik
und Venvertung zur geologischen Prognose [etc.]: Neues Jahrb., Beilage Band 31, pp. 107-157,1911.6 Climatological data for the United States by sections, vol. 3, No. 13, Washington, 1917.«Slichter found while investigating the underflow of Arkansas River in western Kansas in 1901 that
the temperature of water in shallow wells ranged from 56° to 58° F., or 2° to 4 ° higher than the mean annual air temperature of the region. (See U. S. Geol. Survey Water-Supply Paper 153, p. 12,1906.)
ALABAMA.
tion is in degrees Fahrenheit and is readable to half a degree with certainty.
Most of the instruments were verified at the Bureau of Standards. As a rule they were used singly, but in certain places two instruments were used either simultaneously or in succession. They are intended to be sunk bulb end up, for the mer cury in the bulb end does not easily jar past "the stricture. In warm weather care is taken to chill the instrument before lowering. . It is wrapped in flannel, placed in a 14-inch piece of 1-inch lead pipe, and usually lowered by means of No. 18 wire, with care to avoid jars. ...
Generally the instrument was left down the hole overnight or at least four hours. In observing tem peratures of flowing water I and my assistants used ordinary 6-inch thermometers readable to half de grees and tested as to accuracy.. Nothing is known as to the kind of instruments used for most of the observations given in published reports or fur nished by correspondents. They probably varied in character. -
Throughout this report temperatures are given in degrees Fahrenheit, depths in feet, and yield of wells in gallons a minute. Although the geothermal gradient should strictly be stated in units of tem perature per unit of depth, it is customary, in order to get larger and more readily comparable' quanti ties, to use the reciprocal statement, units of depth per unit of temperature. The figures are here given in feet per degree Fahrenheit. A high gradient is of course represented by a small number of feet per degree, and vice versa.
ALABAMA.
TEMPERATURE OBSERVATIONS.
Many observations of the temperature of waters from flowing and other wells in Alabama have been recorded, most of them by the State geol ogist. 1 Unfortunately, in the greater part of these observations the source of the water is not stated, and there is uncertainty as to the accuracy of the thermometers used. The following selected data are believed to be of sufficient value to be considered.
; 8
1 S
-i 8
i Smith, E. A,, U. S. Geol. Survey Water-Supply Paper 102, pp. 277-331,1904.
GEOTHERMAL, DATA OF THE UNITED STATES.
- Temperatures in iveUs in Alabama.
"Well.
Bat-boar County: Eufaula, 1 mile south of..................;.................
Dallas County: Cahaba:
Great well <*. ...................
Bell's Hotel d..................Huntersfield. ................. . ...:Selma:
Ferrill well <*'...................
Greene County: Boligee. ..........................I.
Do.............................Do.............................
Boligee, Canfleld's a ................
Do.............................Burton Hill, Dr. Perrins. ..........Erie................................Eutaw, 4J miles south of. ......... .Eutaw, 6 miles south of ............
Do.............................Eutaw, 10 miles south of
Cres wel 1 No. 1 ..................Cresweli No. 2..................Creswell No. 3. ....:............
Morrison, 3 miles southwest of ..... Steeles Bluff. ................ .Locality not given*. . .............
Do.............................Do...........................
Hale County: Cypress Switch. .................:..Evans, 11 miles west of. ............Evansville station. .................Evansvilie, several near. ...........E vansville, i mi le west of .......Greensboro. ......................Greenwood, 3 miles east of ....Greenwood, 3 miles southwest of. . . Greenwood, 3 to 5 miles southwest of
Do............................Do.............................
Greenwood, 1 mile east of ..........
Do.............................Mays station, 1§ miles south of. .....
Do...........................Sawyerville, 3 miles west of ........
Do.............................Stewart ............................
Marengo County:
Mobile County:
Do.............................
Total depth (feet).
350848
728555:400550
487470409
151 190
500415250142522550320544330200340495450
456440550495330 400415525544
320210200
160-200160200200140160 :185079
210710719285236360440360
' 363280
1,200
700800
Depth of flow (feet).
!>S43
300 (first).
290
300
300
270 360
300160180160140140:160140 140 175
17<! 94/1
170
300440
300200.
1,11%
Flow <gallons per
minute).
6
1,200
Many.70
1109VI
5
40
10
4i
21021
4i00
1J2430
3H818186540 1710IS
18
22
8506
1742
35
4001.000
Tempera ture
(°F.).
6876
<771
75733
69
687267J68
70686866707167706871707171
72J71791791
68 69687079
6767686867686767 68 68686775
7569
727070CQ
6766
«73
7678
Mean annual air tem perature <°F.).
a64.6C64.6
«64.8e 64. 8«64. 8«64.8
<64.8«64.8e64.8/66.1
063.7063.7063.7063.7063.7063.7A 63. 8A 63. 8ft 63. 8»63.5* 63. 5»63.5i 63. 5
i63.5»63.5263.5263.5jf63.6 >63.6J63.6^63.6763.6
263.5m63.8n»63. 8ro 63. 8OT63.8"64
61.861.8 61.8 61.8
61.8o65o65P61.8964964964864r63.8
61.8
*65.2
«66.1«66.1
Depth per degree
of in crease in tempera
ture (feet).
10374
575545
131
15265
136
SO9658628375908780274666CO
SO59615766 74668263
8650433842353227 23 28
7771724029507372945'
! >
7167
a Average for 33 years.b Cased to 843 feet.c Average for 30 years.
<J Am. Assoc. Adv. Sci. Proc., vol. 10, p. 95,1856.e Selma average for 27 years./ Flornatom average for 25 years.
-B Livingston average minus O.I 9.* Livingston average for 33 years. « Livingston average minus 0.3°. 3 Livingston average minus 0.2°. k Tuomey, Michael, Geology of South Carolina,
p. 247,1848.
* Mean of Greensboro and Tuscaloosa."»Greensboro average minus 0.2°.n Average for 38 years.o Uniontown average for 31 years.p Average at Lock No. 4 for 20 years.9 Greensboro average.7 Greensboro average minus 0.2°.s Probably cooled by mingling of upper flows.t Uniontown average plus 0.2s.« Average for 45 years.
ALABAMA. . : "'
Temperatures in wells in Alabama Continued.
\7ell.
Pickens County:
Do...............................Russell County:
Do.............................
Sumter County:
Gainesville, 2-J milessoutheast of . . .Gainesvillc, 4 miles southeast of. ...
Gainesville, 4 miles southwest of. . .
Do.............................
Do.............................Tuscaloosa County:
Hullstation, 1 mile southwest of. ..
Total depth (feet).
G02GOO725380350
175219185165
750930700630700600550660500700 5604004607f>9300300396
210200 160234
Depth of flow
. (feet).'
sfift_onfl700630
600450-500
700 560
460702
v
210200 160
Flow (gallons per
minute).
^Ort
6£
3
601
30
1oa
15234
1911 ^1?1
l|
3830 GO2i
Tempera ture
(°F.).
7979716766
677O
68r.S
7079727 1?
7472
7171717171'f.Q7071696869
6766 6766
Mean annual air tem perature (° F.).
o63.3o63.3o63.3663.3663.3
c64.6c64.6c64.6c64.6
d63.7d63.7d63.7«63. 5<63.5«63.5c63.5<63. 5/63.4c63.5 063.8063.8063.8063.5063.8063.8063.8
&63.S663.3 663.3A63.1
Depth per degree
of in crease in tempera
ture (feet).
p.o6994
tCVti vi
737(i5448
190>;984666770J7380609378on7497
5871
76
5774 4381
0a, Llvingston average minus 0.5°. 6 Tuscaloosa average plus 0.2°. c Union Springs average.
<J Llvingston average minus 0.1°.
c Livingston average minus 0.3°. / Livingston average minus 0.4°. g Llvingston average, ft Tuscaloosa average for 36 years.
Temperatures of flows from wells that derive part or all of their water from unknown depths are reported as follows: Boguechitto, Dallas County, 460 'feet deep, 68°; Boligee, Green County, 468 feet, 66£°, and 420 feet, 66°; Montgomery, 550 feet, 68°, with some water from 480 feet.
SUMMARY.
Probably several of the wells represented in the , table have admixtures of water from different depths. The well at Union Springs, in Bulloch County, is pumped with an output of 150 gallons a minute, and as it is cased to a depth of 843 feet its water probably indicates the underground temperature with fair accuracy; the rate of increase indicated is 1° in 74 feet. The two deeper wells at Cahaba if cased to their bottoms indicate temperature increases of 1° in 57 and 55 feet, but tlie record of the shallower well at Bell's Hotel, with a rate of 1° in 45 feet, in some measure invalidates the data from the others. The 409 and 487 foot wel]s at Selma may have mixed flows. The exceptional temperature of 72° reported for
GEOTHERMAL DATA OF THE UNITED STATES;
tKe 470-foot well may be a mistake. The Eutaw wells show rates of increase of 1° in 27 to 66 feet. The Steeles Bluff well is cased to a depth of 360 feet. Its recorded rate of increase of 1° in 74 feet is probably reliable if the thermometer reading is correct. This rate is subject to a small plus or minus correction due to uncertainty as to the mean annual temperature. - The Hale County wells of which the depths to flowing water are recorded show considerable range in rate of increase, mostly 1° in 34 to 54 feet.; The wells at Mobile indicate rates of 1° in 67 and 71 feet. The temperature of the water from the Pittsboro and Millwood wells, 72°, is remarkably high for wells only 219 and 236"feet deep and indicates rates of 1° in 30 and 79 feet, respectively. These figures might be modified slightly, however, if the exact mean annual temperature were known. The same is true of the '200-foot well 4$ miles south of Eutaw, in Greene County. Hale County also shows some high rates of increase. The low rate of the 200-foot well at Linden, in Marengo County, is a notable exception in the region southwest of Tuscaloosa. The Epes 750-foot well, the Huntersfield well, and the Selma wells (except the 470-foot well) are others having lower rates than the many wells that show increases of 1° in 50 to 90 feet.
GEOLOGIC RELATIONS. '
All the wells given in the list are in the southern or Coastal Plain part of the State and penetrate sands, marls, and clays of Cretaceous and Tertiary age. These strata form a succession of sheets which dip southward at a low. angle and mostly thicken in that direction. They lie on a basement of older granite, schist, and other rocks, which is nearly reached by the deeper wells in the northern part of the Coastal Plain district, among them the deeper wells in Tusca loosa County, the wells 500 to 550 feet deep in Greene County, the deeper wells in Pickens County, the 930-foot well 3 miles southeast of Epes, in Sumter County, and the 1,200-foot well at Linden, Marengo County. These wells appear to show a wide range in rate of increase of temperature, the rate in the well at Linden, the deepest well reported, being very low 1° in 143 feet, if the temperature of the flow is given correctly. The group of wells in Bullock, Russell, and Barbour counties, most of which draw from younger forma tions, show no special variations. The temperature recorded for the wells in Selma, which draw from the upper part of the Tusca loosa formation, is about 68°, indicating a low rate of increase. The wells at Mobile draw from higher beds and show a rate of 1° in about 70 feet.
GEOTHERMAL DATA OF THE UNITED STATES. 13
ARIZONA.
SOURCE OF INFORMATION.
Underground temperatures in Arizona have been determined by W. T. Lee, C. A. Fisher, and A. T. Schwennesen, of the United States Geological vSurvey. In 1904 Mr. Lee made for me a number of observations in wells and shafts at the Congress mine, near Phoenix, and in the Plateau region, and from 1913 to 1915 Mr. Schwennesen 1 obtained temperatures'in the San Simon Valley.
PHOENIX.
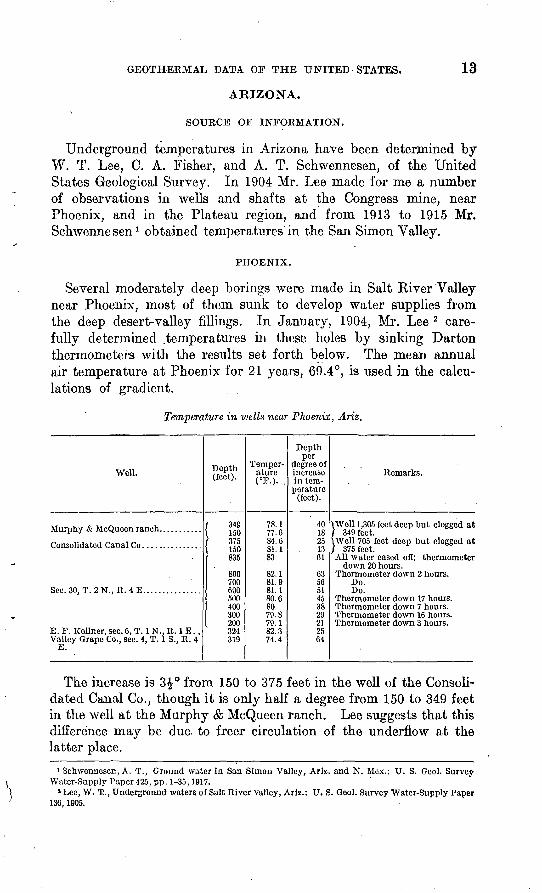
Several moderately deep borings were made in Salt River Valley near Phoenix, most of them sunk to develop water supplies from the deep desert-valley fillings. In January, 1904, Mr. Lee 2 care fully determined temperatures in these holes by sinking Darton thermometers with the results set forth below. The mean annual air temperature at Phoenix for 21 years, 69.4°, is used in the calcu lations of gradient.
Temperature in wells near Phoenix, Ariz,
Well.
Murphy & McQuccn ranch. ..........
Consolidated Canal Co. ..............
Sec. 30, T. 2 N., R. 4 E.. .............
E. F. Kcllner, sec. 6, T. 1 N., R. 1 E . .Valley Grape Co.. sec. 4. T. 1 S., R. 4
E.
Depth(feet).
/ 349\ 150/ 375\ 150
835
800700600500400300200324319
Temper atureOP.)-..
78.177.684.6Q1 1oi. 1
83
82.181.981.180.68079.879.182.374.4
Depthper
degree of increasein tem
perature(feet).
401C lo2513Cl
635651453829212564
Remarks.
!Well 1,305 feet deep but clogged at349 feet.
Well 705 feet deep but clogged at375 feet.
All water cased off; thermometerdown 20 hours.
Thermometer down 2 hours.Do.Do.
Thermometer down 17 hours.Thermometer down 7 hours.Thermometer down 16 hours.Thermometer down 3 hours.
The increase is 3^° from 150 to 375 feet in the well of the Consoli dated Canal Co., though it is only half a degree from 150 to 349 feet in the well at the Murphy & McQueen ranch. Lee suggests that this difference may be due. to freer circulation of the underflow at the latter place.
i Schwennesen, A. T., Ground water in San Simon Valley, Ariz. and N. Mcx.: U. S. Geol. Survey Water-Supply Paper 425, pp. 1-35,1917.
a Lec, W. T., Underground waters of Salt River valley, Ariz.: TJ. S. Geol. Survey Water-Supply Paper 136,1905.
GEOTHERMAL DATA OF THE UNITED STATES.
CONGRESS MINE.
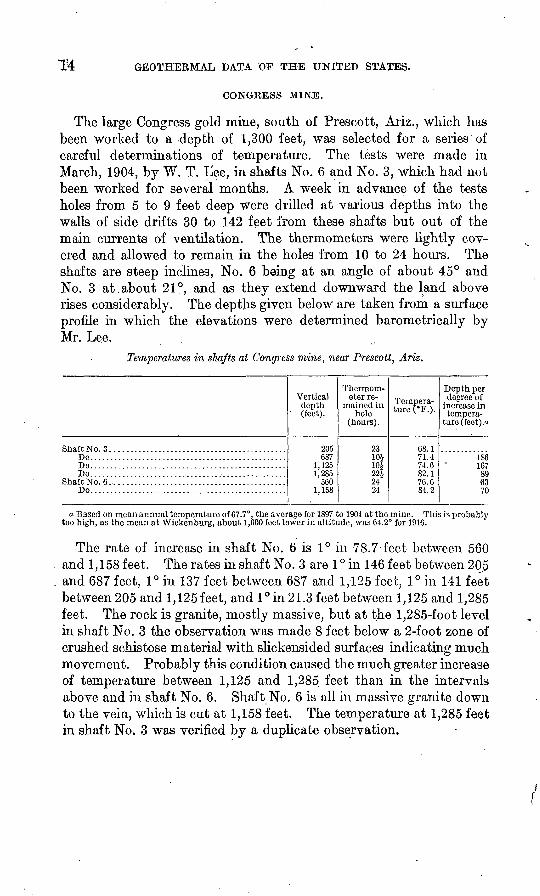
The large Congress gold mine, south of Prescott, Ariz., which has been worked to a depth of 1,300 feet, was selected for a series of careful determinations of temperature. The tests were made in March, 1904, by W. T. Liee, in shafts No. 6 and No. 3, which had not been worked for several months. A week in advance of the tests holes from 5 to 9 feet deep were drilled at various depths into the walls of side drifts 30 to 142 feet from these shafts but out of the main currents of ventilation. The thermometers were lightly cov ered and allowed to remain in the holes from 10 to 24 hours. The shafts are steep inclines, No. 6 being at an angle of about 45° and No. 3 at about 21°, and as they extend downward the land above rises considerably. The depths given below are taken from a surface profile in which the elevations were determined barometrically by Mr. Lee.
Temperatures in shafts at Congress mine, near Prescott, Ariz.
Shaft No. 3 .....................:......................Do.................................................Do.................................................Do.................................................
Shaft No. 6 ............................................Do.................................................
Vertical depth (feet).
205637
1.1251,285
5601,158
Thermom eter re
mained in hole
(hours).
2310£10422i-2424
Tempera ture (*F.).
68. 171.474.682.176. 684.2
Depth per degree of
increase in tempera
ture (feet). o
1S6167896370
a Based on mean annual temperature of 67.7°, the average for 1897 to 1904 at the mine. This is probably too high, as the mean at Wickenburg, about 1,000 feet lower in altitude, was 64.2° for 1916.
The rate of increase in shaft No. 6 is 1° in 78.7-feet between 560 and 1,158 feet. The rates in shaft No. 3 are 1 ° in 146 feet between 20j5 and 687 feet, 1° in 137 feet between 687 and 1,125 feet, 1° in 141 feet between 205 and l,125feet, and 1° in 21.3 feet between 1,125 and 1,285 feet. The rock is granite, mostly massive, but at the 1,285-foot level in shaft No. 3 the observation was made 8 feet below a 2-foot zone of crushed schistose material with slickensided surfaces indicating much movement. Probably this condition caused the much greater increase of temperature between 1,125 and 1,285 feet than in the intervals above and in shaft No. 6. Shaft No. 6 is all in massive granite down to the vein, which is cut at 1,158 feet. The temperature at 1,285 feet in shaft No. 3 was verified by a duplicate observation.
ARIZONA. . v -UlO
PLATEAU BEGION.
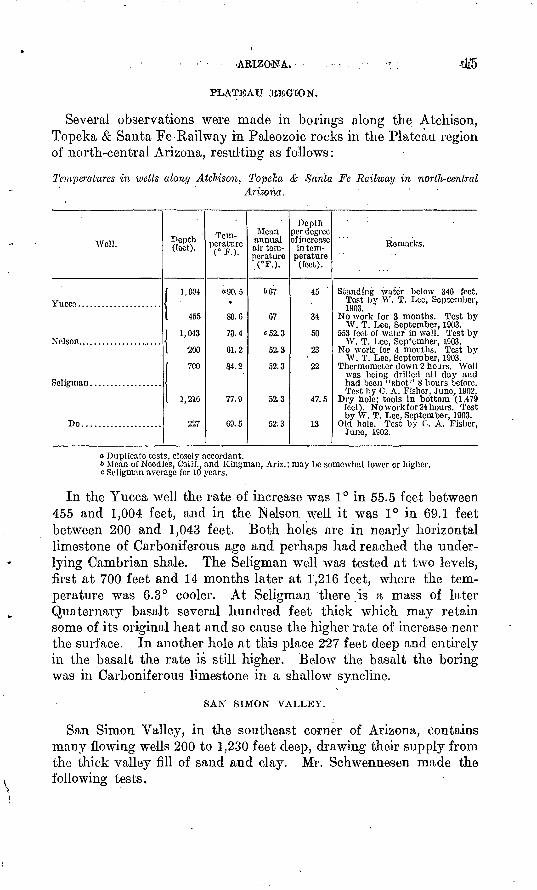
Several observations were made in borings along the Atchison, Topeka & Santa Fe Railway in Paleozoic rocks in the Plateau region of north-central Arizona, resulting as follows:
Temperatures in wells along Atchison, Topeka & Santa Fe Railway in north-centralArizona.
Well.
Yucca .....................
Nelson.....................
Seligraan ..................
Do....................
Depth (feet).
1 1,004
455
I 1,043J[ 200
700
1,216
227
Tem perature
( £.).
090. 5.
80.6
73.4
61.2
84.2
77.9
69.5
Mean annual air temperature.(°F.).
667
67
C52.3
52.3
52.3
52.3
52:3
Depthper degree of increase
in temperature
(feet).
45'"
34
50
23
22
47.5
13
Remarks.
Standing water below 346 feet.Test bv W. T. Lee, September.1903.
No work for 3 months. Test byW. T. Lee, September, 1903.
553 feet of water in well. Test byW. T. Lee, September, 1S03.
No work for 4 mouths. Test byW. T. Lee, September, 1903.
Thermometer down 2 hours. Wellwas being drilled all day andhad been "shot" 8 hours before.Test by C. A. Fisher, June, 1902.
Dry hole; tools in bottom (1,479feet). No work for 24 hours. Testby W. T. Lee, September, 1903.
Old hole. Test by C. A. Fisher,June, 1902.
a Duplicate tests, closely accordant.J> Mean of Needles, Calif., and Kingman, Ariz.; may be somewhat lower or higher.c Scligman average for 10 years.
In the Yucca well the rate of increase was 1° in 55.5 feet between 455 and 1,004 feet, and in the Nelson well it was 1° in 69.1 feet between 200 and 1,043 feet. Both holes are in nearly horizontal limestone of Carboniferous age and perhaps had reached the under lying Cambrian shale. The Seligman well was tested at two levels, first at 700 feet and 14 months later at 1,216 feet, where the tem perature was 6.3° cooler. At Seligman there ;is a mass of later Quaternary basalt several hundred feet thick which may retain some of its original heat and so cause the higher rate of increase near the surface. In another hole at this place 227 feet deep and entirely in the basalt the rate is still higher. Below the basalt the boring was in Carboniferous limestone in a shallow syncline.
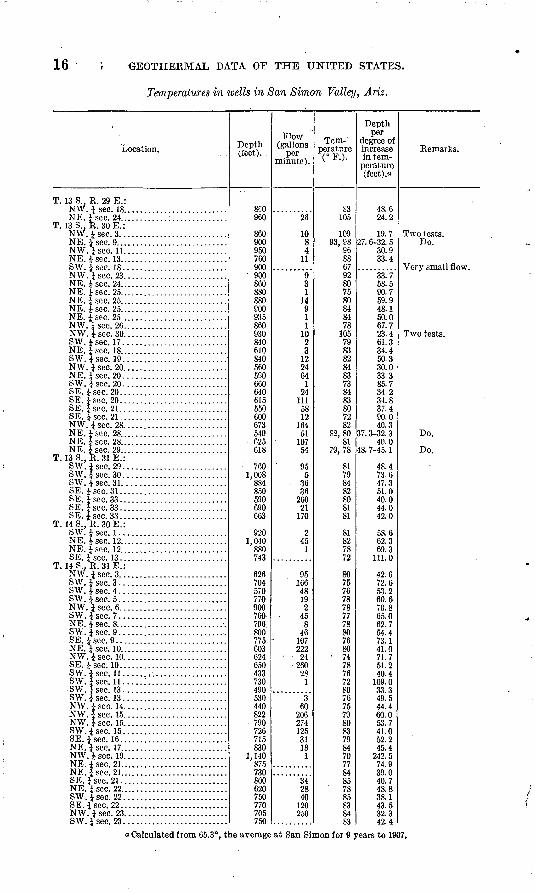
SAN SIMON VALLEY.
San Simon Valley, in the southeast corner of Arizona, contains many flowing wells 200 to 1,230 feet deep, drawing their supply from the thick valley fill of sand and clay. Mr. Schwenn^sen made the following tests.
16 <5EOTHERMAL DATA OF THE UNITED STATES.
Temperatures in wells in San Simon Valley, Ariz.
Location.
T. 13 S.. R. 29 E.: N W. J sec. 18. .........................NE.isec.24.. ..........:..............
T. 13 S.. R. 30 E.: N W. J sec. 3. ..........................NE. J sec. 9. ...........................NW. J sec. 11. .........................NE.Jsec. 13.......... .................SW. J sec. 18 ..........................NW. J sec. 23. .........................NE.isec.24.. .........................NE. J sec. 25........................... NE. J sec. 25. ..........................NE. J sec. 25. ..........................NE.Jsec. 25.. .........................N VV. J sec. 26. .........................NW. J sec. 30. .........................SW. J sec. 17 ..........................NE. J sec. 18. ..........................SW. | sec. 19 ...........................NW. J sec. 20. .........................NE. J sec. 20 ..........................SW. J sec. 20 ..........................SE. J sec. 20 ...........................SE. J sec. 20. ..........................SE.Jsec. 21...........................SE. J sec. 21 ...... ....................NW. J sec. 28. .... ....................NE.Jsec.28.. .........................NE.Jsec.28.. .........................NE.Jsec.29.. .........................
T. I3S..R. 31 E.: SW.Jsec. 29. .........................SW. Jsec.30..... ....................SW. J sec. 31. .........................SE.isec.31...........................SE.Jsec. 33.............. .............SE. J sec. 33 ........................... SE.Jsec. 33............... ............
T. 14 S., R.30E.: SW. Jsee. 1...... . . .... . ....NE. J sec. 12. ..... ....................NE. J sec. 12. ..........................SE.Jsec. 13...........................
T. 14 S.. R. 31 E.: N W. J sec. 3. ..........................SW. Jsec.3. ..........................SW. Jsec.4. ..........................SW.Jsec. 5...........................NW. J sec. 6 ...SW.Jsec. 7. ..........................NE. J sec. 8. ...........................SW. J sec. 9 ...........................SE. J sec. 9 ............................NE. J sec. 10. ..........................N W. J sec. 10. .........................SE. J sec. 10 ...........................SW. J sec. 11 ..........................SW. J sec. 11 .....;....................
SW. i sec. 13...........................SW.Jsec. 13. .........................NW. J sec. 14. .........................N W. J sec. 15. .........................NW i sec I 1)SW.Jsec. 15. .........................SE. J sec. 16 ...........................NE. J sec. 17. ..........................NW. J sec. 19. .........................NE. J sec. 21. ..........................NE. J sec. 21. ..........................SE. J sec. 21 ...........................NE. J.sec. 22.. .........................SW.Jsec. 22. .........................SE. * sec. 22...........................NW. J sec. 23. .........................SW.Jsec. 23. .........................
Depth (feet). .
SCO960
860900950760900900860880 880900935860930840610840560590660640615550600673549625618
7601,008
884850590690 663
9201,040
880 743
626704570770900760-796800775603624650433730490530440822790726715830
1,140875730800620750770705750
Flow (gallons
per minute).
26
1084
11
931
14911
1023
122464
124
1115812
16451
10754
955
3636
20021
170
245
1
9516648192
458
4610722224
26028
1
360
2062741253118
1
342840
120250
Tem perature V F.).
£3105
10993.98
968867928075 80848478
1057983828483738483807282
82.8081
79,78
817984828081 81
818278 72
80757678787778807680
74787672807675798083798470778485
' 78858384S3
Depth per
degree of increase in tem
perature (feet).o
48.624.2
19.727. 6-32. 5
30.933.4
33.758.590.7 59.948.150.067.723.461.334.450.330.033.385.734. 234.837.490.040.3
37. 3-32. 340.0
48. 7-45. 1
48.473.647.351.040.044.0 42.0
58.662.369.3
111.0
42.672.653.260.670.865.062.754.473.141.071.751.240.4
109.033.349.544.460.0W 7
41.052.245.4
242.574.939.040.748.838.143.532.342.4
Remarks.
Two tests.Do.
Two tests.
Do.
Do.
a Calculated from 65.3% the average at San Simon for 9 years to 1907.
ARKANSAS. 17
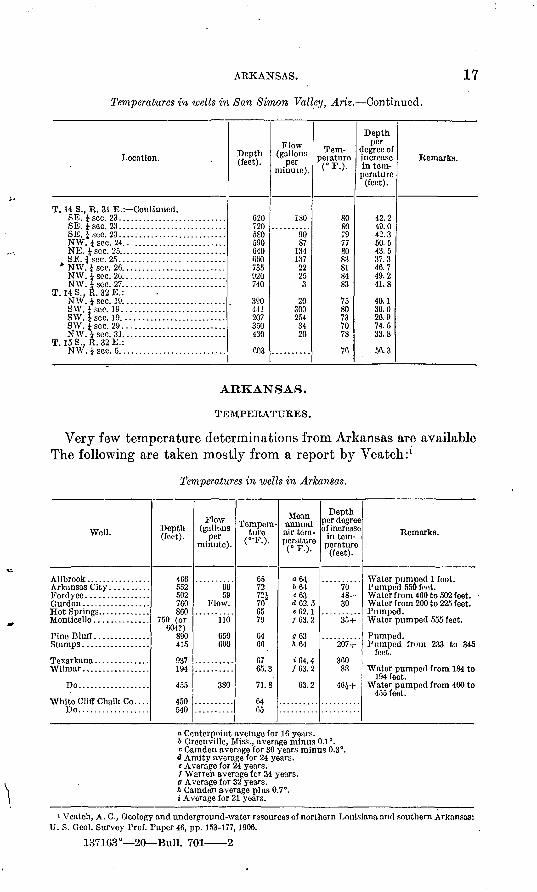
Temperatures in wells in San Simon Valley, Ariz. Continued.
Location.
T. 14 S., R. 31 E.: Continued. SE. iscc. 23...........................SE. J sec. 23 ...........................SE. J sec. 23 ...........................N W. J sec. 24. .........................NE.Jsec. 25.... .......................
, SE. Jsec. 25........ ...................* N W. i sec. 26. .........................
NW. { sec. 20. .........................NW. J sec. 27. .........................
T. 14 S.. R. 32 E.: N W. } sec. 19. .........................SW.Jscc. 19..........................SW.isec. 19.... ......................SW. J sec. 29 ..........................NW. J sec. 31. .........................
T. 15 S.. R. 32 E.: N W. £ sec. 5. ..........................
Depth (feet).
C20720580590040COO735920740
390441207330430
603
Flow (gallons
per minute).
ISO
9087
1341372225
3
203002.54
3420
Tem perature ( F.).
808079778083818483
7580737078
7fi
Depth per
degree of increase ini tem perature
(feet).
42.249.042.350.543.537.346.749.241.8
40.130.026.974.533.8
56. 3
Remarks.
ARKANSAS.
TEMPERATURES.
Very few temperature determinations from Arkansas are available The following are taken mostly from a report by Veatcn: 1
Temperatures in wells in Arkansas.
Well.
Do..................
White Cliff Chalk Co.... Do..................
Depth (feet).
466 552 502 760 860
750 (or 604?)
890 415
937 194
455
450 540
Flow (gallons
per minute).
66 59
Flow.
110
650 600
380
Tempera ture (" P.).
65 72 72J 70 05 79
04 66
67 65. 3
71.8
64 65
Mean annual air tem perature ( F.).
064. 664 c63 d62.5 «62. 1 /C3.2
063 A64
<C4.4 /C3.2
63.2
Depth per degree of increase
in tem perature
(feet).
70 48+ 30
35+
207+
36088
46i+
Remarks.
Water pumped 1 foot. Pumped 550 feet. Water from 460 to 502 feet. Water from 200 to 225 feet. Pumped. Water pumped 555 feet.
Pumped. Pumped from 233 to 345
feet.
Water pumped from 184 to 194 feet.
Water pumped from 400 to 455 feet.
a Centcvpoint average for 16 years.b Greenville, Miss., average minus 0.1°.c Camden average for 30 years minus 0.3°
<J Amity average for 24 years.« Average for 24 years./ Warren average for 34 years.g Average for 32'years.ft Camden average plus 0.7°.»' Average for 21 years.
1 Veatch, A. C., Geology and underground-water resources of northern Louisiana and southern Arkansas: U. S. Geol. Survey Prof. Paper 46, pp. 153-177,1906.
137163° 20 Bull. 701 2
18 GEOTHERMAL DATA OF THE UNITED STATES.
SUMMARY.
The data for AUbrook, Hot Springs, Pine Bluff, Stamps, and Texarkana apparently are not valid, probably because the true source of the flow is not given. The temperatures in other wells appear to be consistent. These wells are in the southern quarter of the State and reach water-bearing strata in the great Tertiary sedimentary series of the Mississippi embayment.
GEOLOGIC RELATIONS.
The Gurdon well draws from the Nacatoch sand in the Upper Cretaceous; the Arkansas City well, the shallow well at Wilmar, and the Fordyce well, all with high rates of increase in temperature, draw from Eocene beds at the horizon of the Yegua ("Cockfield") formation, about 1,500 feet higher; the Monticello well and the 455-foot well at Wihnar, both with high rates of increase, draw from coarser deposits of Eocene age not far below the Yegua horizon.
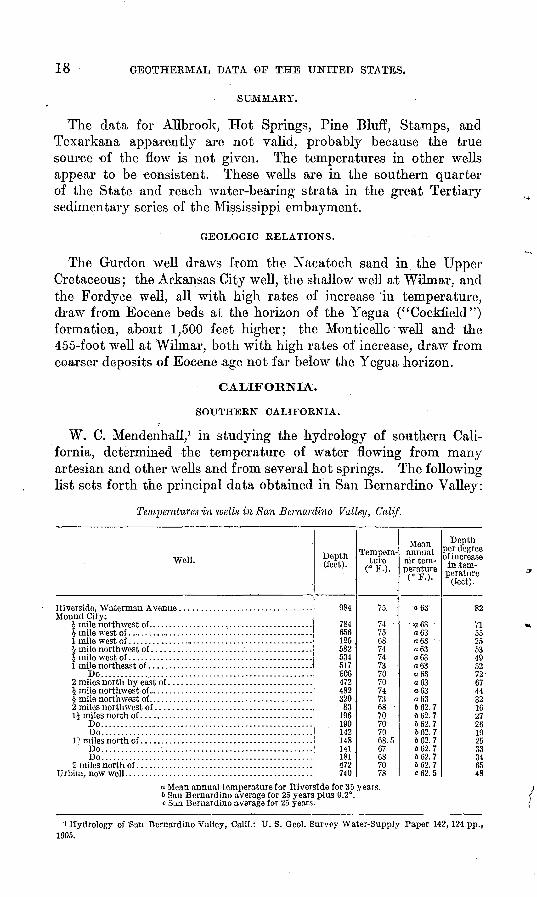
CALIFORNIA.
SOUTHERN CALIFORNIA.
W, C. MendenhaU., 1 in studying the hydrology of southern Cali fornia, determined the temperature of water flowing from many artesian and other wells and from several hot springs. The following list sets forth the principal data obtained in San Bernardino Valley:
Temperatures in wells in San Bernardino Valley, Calif.
Well.
Mound City.: ;
Do............... ......................................
Do.....................................................Do.....................................................
Do.....................................................Do.....................................................
Urbita. new well ................................................
Depth (feet).
984
784656125582534517506472482320
83196190142148141181472740
Tempera ture
(° F.).
74 756874 7470
70 707470
6870707068.567687078
Mean annual air tem perature
(° F.).
-c.63-
068 'a 63«63 ' a 63a 63a 63o63a 63a 63a 63662.7*62.7662.7662.7662.7662.7662.7662.7C62.5
Depth per degree of increase in tem perature
(feet).
82
71552553<1QCO
72674499
1627261925<M346548
a. Mean annual temperature for Riverside for 35 years. 6 San Bernardino average for 25 years plus :0.2°. c San Bernardino average for 25 years.
Hydrology of San Bernardino Valley, Calif.: U. S. Geol. Survey Water-Supply Paper 142, 124 pp., 1905.
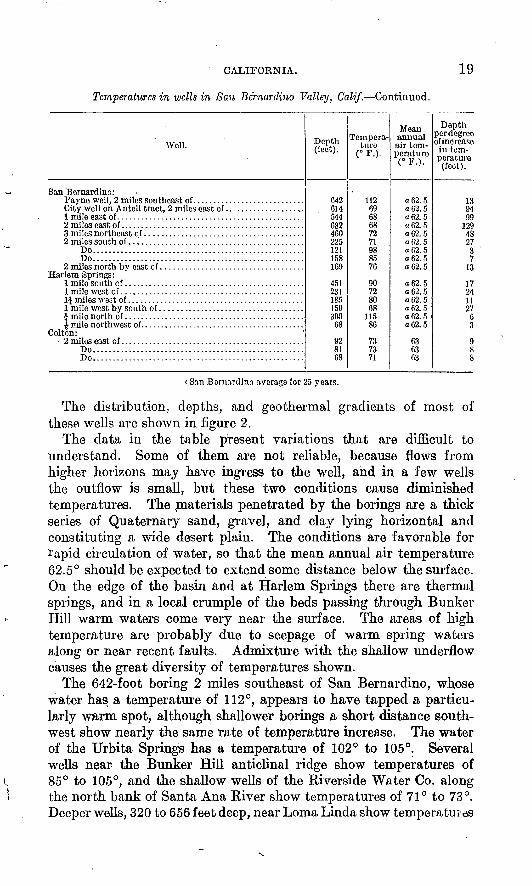
CALIFORNIA. 19
Temperatures in wells in San Bernardino Valley, Calif. Continued.
Well.
San Bornardino:
Do.....................................................Do.....................................................
Harlem Springs:
Colton:
Do.....................................................Do.....................................................
Depth (feet).
642614544682460225121158169
451231185150300
68
928168
Tempera ture
(° P.).
1126968687271988576
9072an68
11586
737371
Mean annual air tem perature (° P.).
o62.5o62.5a62.5o62. 5
o62.5o62.5o62.5a62.5
a 62. 5o62.5o62.5o 62. 5o62.5a62.5
63f>363
Depth per degree of increase in tem perature (feet).
139499
1294827
0
711
17241127
60
g«8
( San Bormrdino average for 25 years.
The. distribution, depths, and geothermal gradients of most of these wells are shown in figure 2.
The data in the table present variations that are difficult to understand. Some of them are not reliable, because flows from higher horizons may have ingress to the well, and in a few wells the outflow is small, but these two conditions cause diminished temperatures. The materials penetrated by the borings are a thick series of Quaternary sand, gravel, and clay lying horizontal and constituting a wide desert plain. The conditions are favorable for rapid circulation of water, so that the mean annual air temperature 62.5° should be expected to extend some distance below the surface. On the edge of the basin and at Harlem Springs there are thermal springs, and in a local crumple of the beds passing through Bunker Hill warm waters come very near the surface. The areas of high temperature are probably due to seepage of warm spring waters along or near recent faults. Admixture with the shallow underflow causes the great diversity of temperatures shown.
The 642-foot boring 2 miles southeast of San Bernardino, whose water has a temperature of 112°, appears to have tapped a particu larly warm spot, although shallower borings a short distance south west show nearly the same rate of temperature increase. The water of the Urbita Springs has a temperature of 102° to 105°. Several wells near the Bunker Hill anticlinal ridge show temperatures of 85° to 105°, and the shallow wells of the Riverside Water Co. along the north bank of Santa Ana River show temperatures of 7.1° to 73°. Deeper wells, 320 to 656 feet deep, near Loma Linda show temperatures
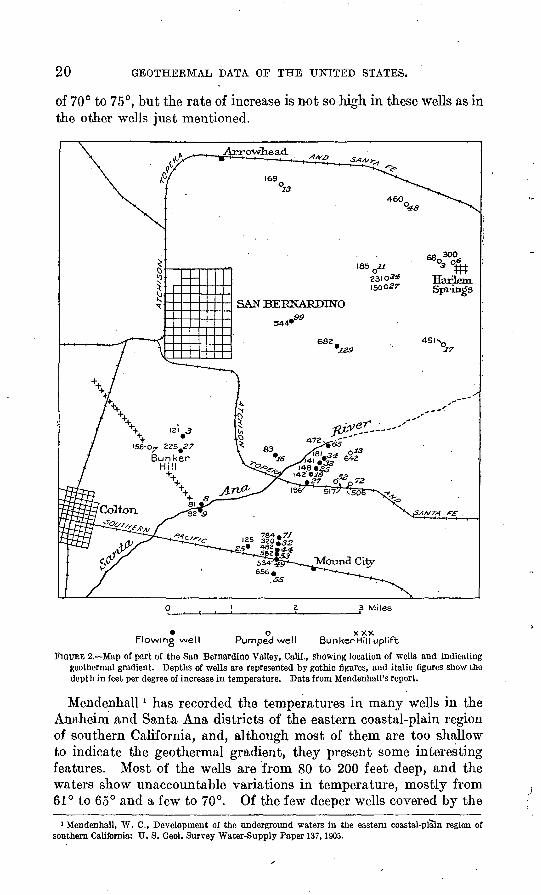
20 GEOTHEEMAL DATA OF THE UNITED STATES.
of 70° to 75°, but the rate of increase is not.so high in these wells as in the other wells just mentioned.
O X XXFlowing well Pumped well BunkerHill uplift
FIGURE 2. Map of part of the San Bernardino Valley, Calif., showing location of wells and indicating geothermal gradient. Depths of wells are represented by gothic figures, and italic figures show the depth in feet per degree of increase in temperature. Data from Mendenhall's report.
Mendenhall* has recorded the temperatures in many wells in the Anaheim and Santa Ana districts of the eastern coastal-plain region of southern California, and, although most of them are too shallow to indicate the geothermal gradient, they present some interesting features. Most of the wells are from 80 to 200 feet deep, and the waters show unaccountable variations in temperature, mostly from 61° to 65° and a few to 70°. Of the few deeper wells covered by the
1 Mendenhall, W. C., Development of the underground waters in the eastern coastal-plain region of southern California: U. S. Geol. Survey Water-Supply Paper 137,1905.

CALIFORNIA. 21
records one flowing well 397 feet deep in the San Joaquin district showed a temperature of 79°, which indicates a rate of increase of about 1° in 23 feet. Another well near by, 165 feet deep, with a temperature of 81°, indicates a still higher rate. The temperature of water from a 386-foot well was 67°, a 390-foot well 70°, a 264-foot well 71°, a 360-foot well 71°, a 336-foot well 71°, a 400-foot well 68°, two 450-foot wells 66°, and a 118-foot well 71°. Some of the wells showing the higher temperatures are in groups or districts, but others appear to be irregularly distributed.
Temperatures in the Cucamonga and Pasadena region have been recorded by Mendenhall, as follows:
Temperatures in wells in Cucamonga and Pasadena quadrangles, Calif.
Location.
Cucamonga quadrangle: °
Do..........................................Do..........................................Do................... ............. ........Do..........................................Do..........................................Do..........................................Do..........................................Do..........................................Do..........................................Do..........................................
Do..........................................Do..........................................Do..........................................Do..........................................
Sec. 33, T. 1 N., R. 8 W .........................Do..........................................
Pasadena quadrangle:
Do..........................................Do..........................................
Sec. 9, T. 2S.,R. 13 W... ... .... .......
Do..........................................Do..........................................Do..........................................
San Pasqual. ....................................Do. .........................................Do..........................................Do..........................................
Sec. 20, T.I S., R.ll W.........................
Depth (feet).
541479456433428666638624640540649375126'
300374347400385367
in?283
276-280210
205-226189175202160492140130156302130
Flow (gallons
per minute).
280563345
850850850850
1,675
900225500340280
165335280560
2245
6701,750
Tem perature
<°F.).
7172727273
. 6462626262706467696665626470
686668656062686165656771716864
Mean annual air tem perature ( F.).
6 62. 562.562.562.562.562.562.562.562.562. 562. 562.562.562.562.562.562.562.562.5
c60.360.360.360.360.360.360.360.3
d62.562.562.562.562.562.562.5
Depth per
degree of . increase in tem perature
(feet).
6450494641
1442503046
107140
49
40503645
11023
641973318155587
a Mendenhall, W. C., Ground waters and irrigation enterprises in the foothill belt, southern California: U. S. Geol. Survey Water-Supply Paper 219. pp. 140-174,1908.
& Azusa average for 15 years. c Average for 40 years. d Pasadena average for 27 years
In this region other wells from 113 to 300 feet deep show tem peratures of 62°; wells 68 and 172 feet deep, 63°; 280 feet, 64°; 250 feet/65°; 60 and 160 feet, 66°; 147, 160, and 300 feet, 67°; 139, 160, 180, 250, and 255 feet, 68°; and 140 and 220 feet, 69°. These figures indicate great irregularity in the rate of increase at slight depths.
22 GEOTHERMAL DATA OF TH-E UNITED STATES.
SAN LUIS OBISPO.
A flow of sulphur water from a 928-foot well at San Luis Obispo has a temperature of 103°. As the mean annual air temperature at this place is 57.2°, this indicates a rate of increase of 1° in 20 feet.
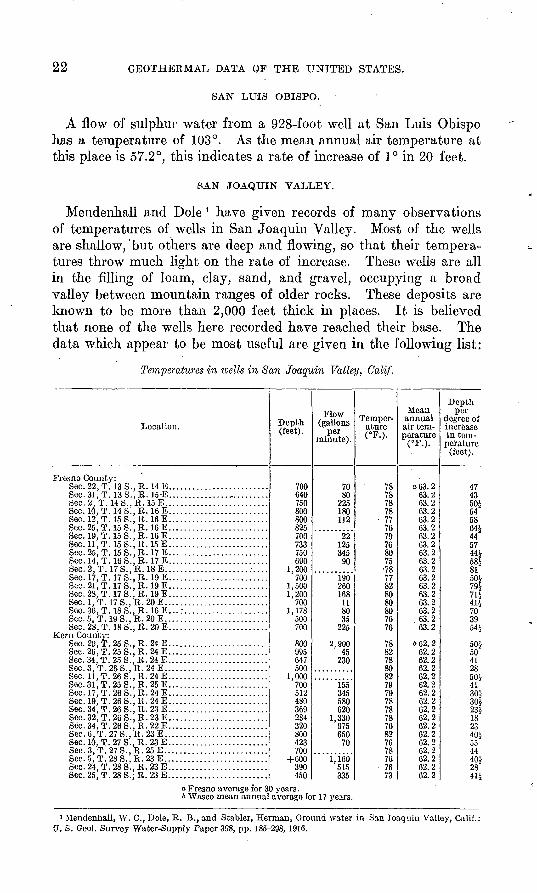
SAN JOAQUIN VALLEY.
Mendenhall and Dole * have given records of many observations of temperatures of wells in San Joaquin Valley. Most of the wells are shallow,"but others are deep and flowing, so that their tempera tures throw much light on the rate of increase. These wells are all in the filling of loam, clay, sand, and gravel, occupying a broad valley between mountain ranges of older rocks. These deposits are known to be more than 2,000 feet thick in places. It is believed that none of the wells here recorded have reached their base. The data which appear to be most useful are given in the following list:
Temperatures in wells in San Joaquin Valley, Calif.
Location.
Fresno County: Sec. 22, T. 13 S..R. 14 E. ........................Sec. 31, T. 13 S., R. 15-E... . .....................Sec. 2, T. 14 S.,R. 15 E. .........................Sec. 10, T . 14 S. , R. 16 E .........................Sec. 12, T. 15 S. ,R. 16 E. ........................Sec. 25, T. 15 S.,R. 16 E. ........................Sec. 19, T. 15 S.,R. 16 E. ........................Sec. 11, T. 15 S.,R. 15 E. ........................Sec. 25, T. 15 S.,R. 17 E. ........................Sec. 14, T. 16 S.,R. 17 E. ........................Sec. 2, T. 17 S.,R. 18 E. ..........................Sec. 17, T. 17 S., R. 19 E. ........................Sec. 21, T. 17 S., R. 19 E... ......................Sec. 28, T. 17 S.. R. 19 E. ........................Sec. 1. T. 17 S.,R. 20 E. .........................Sec. 36, T. 18 S., R. 16 E. ..:.....................Sec. 5, T. 19 S., R. 20 E. .........................Sec. 28, T. 18 S., R. 20 E... ......................
Kern County: Sec. 20,T. 25S..R. 24 E.........................Sec. 26, T. 25 S..R. 24 E. ........................Sec. 34, T. 25 S. . R. 24 E. ........................Sec. 3, T. 26 S.,R. 24 E. .........................Sec. 11, T. 26 S., R. 24 E.. .......................Sec. 31, T. 25 S. , R. 25 E. ........................Sec. 17, T. 26 S. ,R. 24 E.. .......................Sec. 19, T.26S.,R.24E.........................Sec. 34, T. 26 S.,R. 23 E. ........................Sec.32,T.26S.,R.23E.........................Sec. 34, T. 26 S., R. 22 E... ......................Sec. 6, T. 27 S. , R. 23 E. .........................Sec. 10, T. 27 S., R. 23 E.. .......................Sec. 3, T. 27 S. , R. 25 E. .........................Sec. 5, T. 28 S.,R. 23 E. .........................Sec. 24, T. 288., R. 23 E. ........................Sec. 25.T.28S.:R.23E.........................
Depth (feet).
700640750800SIV>825700733750690
1,200700
1,5001,200
7001,178
CArt
700
800995647500
1,000700512480369284320800423700
+600390450
Flow (gallons
per minute).
7080
225180112
22125345
QO
260168
1180or
225
2,9004<;
230
155345580620
1,330975650
70
1,160515335
Temper ature (°F.).
78787878
777679768075
7877828080807676
78 82
7880827979787878708276787676.73
Mean annual air tem perature
(°F.).
a63.263.263.263.263.263.263.263.263.263.263.263.263.263.263.263.2KI o63.2
&62.262.262.262.262.262.262.262.262.262.262.262.262.262.262.262.262.2
Depth per
degree of increase in tem perature
(feet).
47dsCAX
r.4CO
64i445744iroi
81502l79 1.711411703054J
50i50
2850i4130iOft 1
182340.V
4440i2841i
a Fresno average for 30 years.b Wasco mean annual average for 17 years.
1 Mendenhall, W. C., Dole, R. B., and Stabler, Herman, Ground water in San Joaquin Valley, Calif.: U. S. Geol. Survey Water-Supply Paper 398, pp. 185-298, 1916.
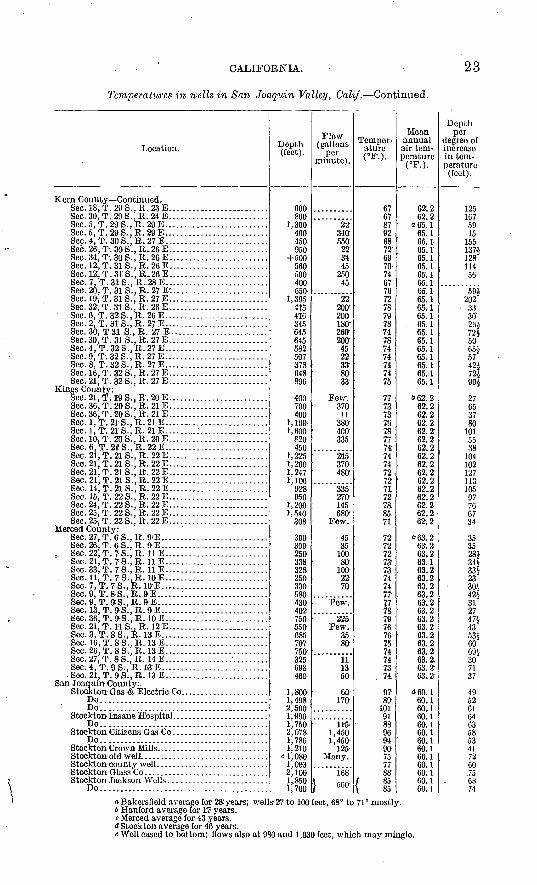
CALIFORNIA.
Temperatures in wells in San Joaquin-Valleyy Calif. Continued.
Location.
Kern County Continued. Sec. 18, T. 29 S..R. 23 E. ..........................Sec. 30, T. 29 S., R. 24 E. ........................Sec. 5, T. 29 S., K. 29 E... ........................Sec. 5, T. 29 S. , R. 29 E. ..........................Sec. 4, T. 30 S., R. 27 E.. .........................Sec. 26. T. 30 S.. R. 26 E... ............. ... ......Sec. 34, T. 30 S., R. 26 E... ......................Sec. 12, T. 31 S., R. 26 E... .......................Sec. 12;, T . 31 S .. R.. 26 E ..........................Sec. 7, T. 31 S.,R.. 28 E. .........................Sec. 20, T. 31 S., R. 27 E:.. .......................Sec. 19, T. 31 S., R. 27 E... ......................Sec. 32, T. 31 S., R. 26 E... .......................Sec. 6, T.32S.. R. 26 E. .........................Sec. 2, T. 31 S.,R. 27 E. .........................Sec.30>T31 S., R. 27 E...... ...................Sec. 30, T. 31 S., R. 27 E .........................Sec. 4, T. 32 S. , K. 27 E.. ........................Sec. 9, T. 32 S.,R. 27 E. ..........................Sec. 8, T. 32 S., R. 27 E. .........................Sec. 16, T. 32 S., R. 27 E.. .......................Sec. 21, T. 32 S., R. 27 E... ......................
Kings County: Sec. 21, T. 19 S., R. 20 E... ......................Sec. 36, T. 20 S., R. 21 E. ........................Sec. 36, T. 20 S., R. 21 E... ......................Sec. 1, T. 21 S., R. 21 E... . . ... ........ .... ......Sec. 1 , T, 21' S ., R . 21 E ......_...................:Sec. 10i T.. 20 S.. R. 20 E. .........................Sec. 6, T. 21' S., R. 22 E... ........................Sec. 21, T. 21 S.,R. 22 E. .........................Sec. 21, T. 21 S., R. 22 E... ............ ..... ......Sec. 21, T. 21 S., R. 22 E... .......................Sec. 21, T. 21 S., R. 22 E. .........................Sec. 14, T . 21 S . , R . 22 E .........................Sec. 15, T. 22 S., R. 22 E... ............ ...... .....Sec. 24, T. 22 S. , R; 22 E. ........................Sec. 25, T. 22 S., R. 22 E... ......................
Sec. 25>, T. 22 S.,R. 22 E. ........................Merced County:
Sec. 27; T. 6 S.,R. 9'E. ..........................Sec. 26', T. 6 -S..R. 9 E.. .........................
. Sec. 22; T.TS..R. HE. .........................Sec. 21, T. 7 S ., R. 11 E ..........................Sec. 33, T. 7 S., R. 11 E. .........................
. Sec. 11, T. 7 S. ,11. 10 E. .........................Sec. 7, T. 7 S., R. 10'E... ........................Sec. 9, T. 8 S..R.9E. ...........................Sec. 9, T. 9 S.,R. 9 E. ...........................Sec. 13> T. 9 S . , R. 9 E ...........................Sec. 36, T. 9 S. , R. 10 E. .........................Sec. 21, T. 11 S., R. 12 E... ......:..... ....... ......Sec. 3, T. 8S.,R. 13 E...........................Sec. 16, T. 8 S., 11. 13 E... .......................Sec. 26., T. 8 S., R. 13 E.... ......................Sec. 27, T. 8 S., R. 14 E................. .........Sec. 4, T. 9 S.,R. 13 E. ..........................
. Sec. 21 T. 9 S., R. 13 E. .........................San Joaquin County:.
Stockton- Gas & Electric Co. .....................Do..........................................Do..........................................
Stockton Insane Hospital. . ......................Do..........................................
Do...........................................Stockton Crown Mils. ...........................Stockton old well ...............................Stockton county well ............................Stockton Glass Co ...............................
Do..........................................
Depth (feet).
600800
1,3004nnd HA
950+500
5605004nn650
1,39541";416345C45fi^C
582CfVT
378648896
4007nn400
1, 1001,600
COA
4cn
1, 2251,2001,2471, 106
928950
I1 9o/i
one
300300250338328OCA
3305804304027505506857077503256984flft
1 8001, 4982,5001,990l',7502,0781', 7861,210
« 1,0801,0032,1001..8501.700
Flow (gallons
per minute).
22340'i">eifl
99
3445
250'AC
200'200IRfl-
260200
4599
338033
370'11
3804frtYooc
245370-480'
oqc270'1 AC.
680
Af(
3510080'1002270
Pew.
225
3580
11115060'
170
1151 &<M-
1,450125
168\ 560
Temper ature (°F.).
: 6767'87Q968'79fit)
70746776727870
787478.747474747t
777171
70787774:74747979
71727Q
85:
71
7979
7270.
! 70
7474.7711 7879767675
74747074,
9789
1019188'OR
9490757788
f 851 85
Mean annual air tem perature '(°F.).
62.262.2
o65.165,165.165.1K1 1
65.165.165.165.165.165.165.1
. 65. 165 165.165.165.165.165,165.1
562:262.2fi9^ 9fi9 9
62.2fi9 9fi9 9
62.262.2fi9 tfi9 9
62.262,2r.o o
fiO 9fi*> 9
«'63,263,263.263.163.263. 263.263.263.263,263,263.263.263.263.263.2.63.2'63.2
<J60 160.. 160; 160.160.1r>n 160.. 160.160.160.160 160.160.1
Depth per
degree of increase in tem perature (feet).
T95
1675915
1551Q7J.
128114ifi
59JOrtO
. y*on-
v>i5065i-5742i79J
90i
97
6517Qn
101^OQ
1AO
127
105977667^4
ocQC
9QX
344OO 1
23OA1
112747i4353i60AOI.
in7117
495261646358i;i4172607C
0874
o Bakorsfiold average for 28:years; wells'27 to 100-feet, 68° to 71° mostly.b Hanford average for 17 years.c Merced average for 43 years.d Stockton average for 46 years.e Well cased to bottom; flows also at 980 and 1,030 feet, which may minglo.
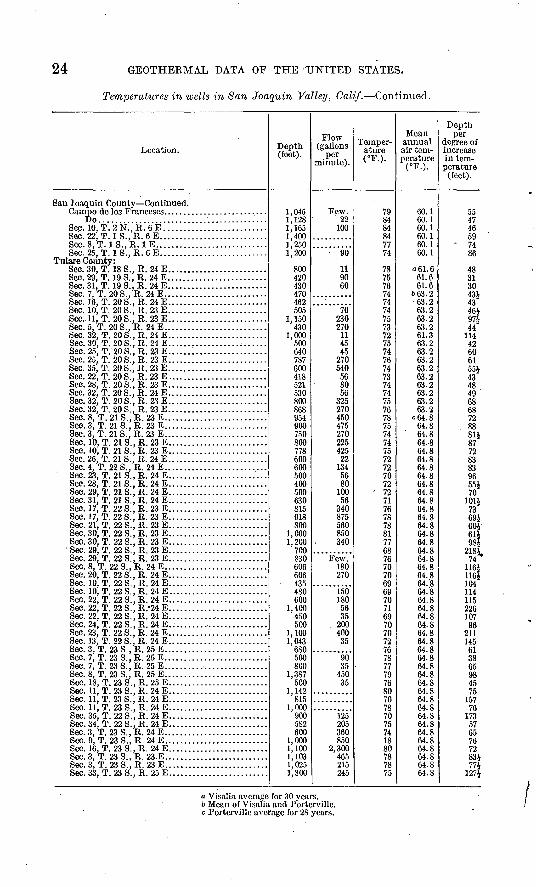
24 GEOTHERMAL DATA OF THE UNITED STATES.
Temperatures in wells in San Joaquin Valley, Calif. Continued.
Location.
San Joaquin County Continued.
Do..........................................Sec. 10, T. 2 N., R. 6 E ..........................Sec. 22, T.I S.,R. 6 E. ..........................Sec. 8, T.I S., R.I E. ........... ................Sec. 25, T.I S.,R. 6 E. ..........................
Tulare County: Sec. 30, T. 18 S., R. 24 E.. .......................Sec. 29, T. 19 S., R. 24 E. ........................Sec. 31, T. 19 S.,R. 24 E. ........................Sec. 7,T. 20S.,R. 24 E..........................Sec. 16, T. 20 S.,R. 24 E. ........................Sec. 10, T. 20 S., R. 23 E. ........................Sec.ll, T. 20 S.,R. 23 E.... .....................Sec. 5, T. 20S.,R. 24 E..........................Sec. 32, T;20S.,R. 24 E.........................Sec. 30, T. 20 S ., R . 24 E .........................Sec. 25, T. 20 S., R. 23 E. . .... 1 ..................Sec. 25, T. 20 S. , R. 23 E .........................Sec. 35, T. 20 S.,R. 23 E. ........................Sec. 22, T. 20 S., R. 23 E .........................Sec. 28, T. 20 S., R. 23 E.. .......................Sec. 32, T. 20 S., R. 24 E.. .......................Sec. 32, T. 20S.,R. 23 E.........................Sec. 32, T. 20 S.,R. 23 E. ........................Sec. 8, T. 21 S.,R. 23 E. .........................Sec. 3, T. 21 S. , R. 23 E ..........................Sec. 3, T. 21 S., R. 23 E.. ........................Sec. 10, T. 21 S.,R. 23 E.... .....................Sec. 10, T. 21 S., R. 23 E.. .......................Sec. 26, T. 21 S., R. 24 E. ........................Sec. 4, T. 22 S. , R. 24 E. .........................
- Sec. 23, T. 21S..R. 24 E... ...................'...Sec. 28, T. 21 S., R. 24 E.. .......................Sec. 29, T. 21 S.,R. 24 E. ........................Sec. 31, T. 21 S.,R. 24 E. ........................Sec. 17, T. 22 S.,R. 23 E. ........................Sec. 17, T. 22 S.,R. 23 E. ........................Sec. 21, T. 22 S., R. 23 E. ........................Sec. 30, T. 22 S., R. 23 E. ........................Sec. 30, T. 22 S.,R. 23 E. ........................Sec. 29, T. 22 S. , R . 23 E .........................Sec. 29, T. 22 S.,R. 23 E. ........................Sec. 8, T. 22 S.,R. 24 E................... ........Sec. 20, T. 22 S., R. 24 E.. .......................Sec. 10, T. 22 S.,R. 24 E. ........................Sec. 10, T. 22 S.,R. 24 E. ........................Sec. 22, T. 22 S. , R. 24 E. ........................Sec. 22, T. 22 S. , R/24 E. ........................Sec. 22, T. 22 S.,R. 24 E. ........................Sec. 24, T. 22 S., R. 24 E.. .......................Sec. 23, T. 22 S.,R. 24 E. ........................Sec. 13, T. 22 S., R. 24 E. ........................Sec. 3, T. 23 S., R. 25 E. .........................Sec. 7, T. 23 S.,R. 25 E. .........................Sec. 7, T. 23 S. , R. 25 E. ..........................Sec. 8, T. 23 S..R. 25 E. .........................Sec. 18, T. 23 S.,R. 25 E. ........................Sec. 11, T. 23 S.,R. 24 E. ........................Sec. 11, T. 23 S., R. 24 E. ........................Sec. 11, T. 23 S.,R. 24 E. ........................Sec. 35, T. 22 S., R. 24 E. ........................Sec. 34, T. 22 S., R. 24 E.. .......................Sec. 3, T. 23 S. , R. 24 E. .........................Sec. 9. T. 23 S., R. 24 E.. ........................Sec. 16, T. 23 S., R. 24 E. ........................Sec. 3, T. 23 S., R. 23 E. .........................Sec. 3, T. 23 S.,R. 23 E. .........................Sec. 33, T. 23 S., R. 25 E. ........................
Depth (feet).
1,0451,1281,1651,4001,2501,200
800420430470462505
1,150430
1.000500640787600418521530800868954900750800778600600500400500630815918800
1,0001,200
700830606606
435480600
1,400450500
1,1001,043
680500800
1,387500
1,142815
1,000900582600
1,0001,1001,1031,0251,300
Flow (gallons
per minute).
Few." 22
100
90
119060
70230270
114545
270540
568056
32527045047527022542522
1345680
10056
340875560850340
180270
15018056OK
. 200400
35
9035
45035
125205360850
2,300465215245
Temper ature (°F.)-
798484847774
787576747474757379
757476747374747576787*1
74747579797072
' 7971767878817768767070fiQfiQ
707169707079
76787779768070787075741880787875
Mean annual air tem perature
(°F.).
60.160.160.160.160.160.1
o61.661.661.6
663.2 63.263.263.263.261.363.263.263.263.263.263.263.263.263.2
<=64.864.864.864.864.864.864.864.864.864.864.864.864.864 864 864.864 864 864.864.864.864 864.864.864 864 864.864 864.864 864 864.864.864.8fid S
64.864.864.864.864.864.864.864.864.8
Depth per
degree of increase in tem perature
(feet).
55474659
- 7486
48313041141
46197*44
11449
6061rci
4°.
4849686879CO
8118779CO
81
9655J70
10117069JCni-
61JQfil
91 Ql
741161116J10411411522610796
911
14561OQ
65QQ
4^
75157
76
57657672831771
1271
a Visalia average for 30 years. 6 Mean of Visalia and P'orterville. c Porterville average for 28 years.
CALIFORNIA. 25
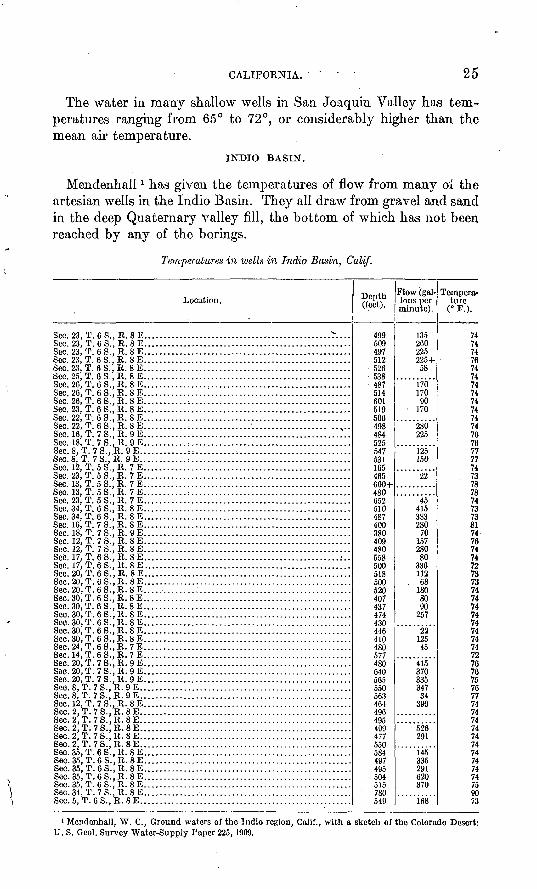
The water in many shallow wells in San Joaquin Valley has tem peratures ranging from 65° to 72°, or considerably higher than the mean air temperature.
INDIO BASIN.
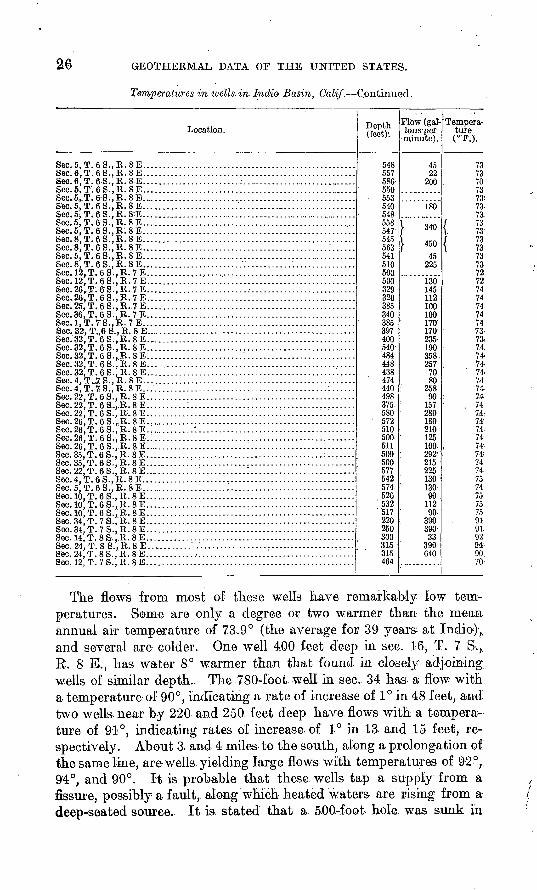
Mendenhall x has given the temperatures of flow from many oi the artesian wells in the Indio Basin. They all draw from gravel and sand in the deep Quaternary valley fill, the bottom of which has not been reached by any of the borings.
Temperatures in ivells in Indio Basin, Calif.
Location.
Sec. 23, T. 6 S.,R. 8 E. .............................................. r....Sec. "£}, T. 6 S..R. 8 IS,. ...................................................Sec. 23, T. 6 S. , R. 8 E ....................................................Sec. 23, T. 6 S. , R. 8 E. ...................................................Sec. 23, T. 6 S., R. 8 E. ...................................................Sec. 25, T. 6 S. , R. 8 E. ...................................................Sec, 26, T. 6 S..R. 8 E. ...................................................Sec, 26, T. 6 S.. R. 8 E. ............... i ...................................Sec. 26, T. 6 S., R. 8 E. ...................................................See.Z3,T.6S.,'R.S'E.............. ......................................Sec. 22, T. 6S..R. 8 E....................................................Sec. 22, T. 6 S.,R. 8 E. ............................................. . ..Sec. 16, T. 7 S.,B. 9 E............ ........................................Sec. 18, T. 7 S..R. 9 E........... .........................................Sec. 8, T. 78., B. 9 E. ...........::..........:............................Sec. 8, T. 7 S.,R. 9 E. ...... ..............................................Sec. 12, T. 58., B. 7E....................................................Sec. 23, T.5S.,B. 7E....................................................Sec. 13, T. 5S..B. 7E....................................................Sec. 13, T. 5S..R. 7E....................................................Sec. 23, T. 58., B. 7 E.. ..................................................Sec. 34, T. 6 S., R. 8 E ....................................................Sec. 34, T. 6S.,R. 8 E....................................................Sec. 16, T. 7S..R. 8 E....................................................Sec. 18, T. 78., B. 9 E.. ..................................................Sec. 12, T. 7 S., R. 8 E. ...................................................Sec. 12, T. 7 S. , R. 8 E. ...................................................Sec. 17, T. 68.. B. 8 E.. ............................................... 2..Sec. 17, T. 68.. B. 8 E.. ..................................................Sec. 20, T. 6 S. , R. 8 E. ...................................................Sec. 20, T. 6S.,R. 8 E. ...................................................Sec. 20, T. 6 S., R. 8 E.. ..................................................Sec. 30, T. 6 S. , R. 8 E. ...................................................Sec. 30, T. 6 S..B. 8 E. ...................................................Sec. 30, T. 6 S., R. 8 E. ...................................................Sec. 30, T. 6 S.,R. 8 E. ...................................................Sec. 30, T. 6 S. , R. 8 E. ...................................................Sec. 30, T. 68., R. 8 E. ...................................................Sec. 24, T. 6 S.,R. 7 E. ...................................................Sec. 14, T. 6 S.,R. 7 E. ...................................................Sec. 20, T. 78., R. 9 E. ...................................................Sec. 20, T. 78., R. 9 E. ...................................................Sec. 20, T. 78.. R. 9 E. ...................................................Sec. 8,T. 7 S.,B. 9 E. ....................................................Sec. 8. T. 78., R. 9 E. ....................................................Sec. 12, T. 7 S., R. 8 E.. ..................................................Sec. 2, T. 7 S.,R. 8 E. ....................................................Sec. 2, T. 78.. R. 8 E. ....................................................Sec. 2, T. 78., R. 8 E.. ...................................................Sec. 2, T. 78., R. 8 E... ..................................................Sec.2,T. 78., R.8E.....................................................Sec. 35, T. 6 S..R. 8 E. ...................................................Sec. 35, T. 68., R. 8 E. ...................................................Sec. 35, T. 68., R. 8 E. ...................................................Sec. 35, T. 6 S.,R. 8 E. ...................................................Sec. 35, T. 6 S.,R. 8 E. ...................................................Sec. 34, T. 7 S., R. 8 E.. ...................................................Sec. 5. T. 6 S. . R. 8 E. ....................................................
Depth (feet).
499509497 .512526538487514601519506498484525547531165465600+480652
487/inn380409480<;<;o500518500520407437474430446410480>;774806401AS
550563464496495499477550584497495504
' 780549
Flow (gal lons per minute).
135260225225+58
17017090
170
280091
125150
22
45415383280
7015728080
336112
. 681808090
257
2212545
415370335347
34390
526291
145335291620370
168
Tempera ture
(°F.).
74747476747474747474747476767777747378787473
8174767474707373747474747474747472767675767774747474747474747474759073
1 Mcndcnhall, W. C., Ground waters of the Indio region, Calif., with a sketch of the Colorado Desert: U. S. Geol. Survey Water-Supply Paper 225,1909.
GEOTHEKMAL DATA OF THE UNITED STATES.
Temperatures in ivells<in Indio Basin,. Calif. Continued.
Location.
Sec. 5, T. 6 S. , R. 8 E. ....................................................Sec. 6, T. 6 S. , R. 8 E. ....................................................Sec. 6, T. 6 S., R. 8 E.. ......................;.. ..... ...... ... ........ ... ..... . ... .Sec. 5, T. 6 S.,R. 8 E. ....................................................Sec. 5,.T. 6'S., R. 8 E. ... ............ .... ......................................Sec. 5, T. 6 S.,R. 8 E. ..................................,....... ;........Sec. 5j T. 6 S.. R. 8-E... .......................................... ........ ....... . ...Sec. 5, T. 6 S..R. 8 E.. ...................................................Sec. 5, T. 6 S. , R. 8 E. ....................................................Sec. 8, T. 6 S., R. 8 E. ....................................................Sec. 8, T. 6 S.,R. 8 E. ....................................................Sec. 5, T. 6 S., R. 8 E. ......................................................Sec. 8, T. 6 S., R. 8 E. ....................................................Sec. 12, T. 6 S., R. 7 E .....................................................Sec. 12.T. 6 S., R. 7 E........... ;..'.....'.................................Sec. 26,T. 6 S. , R. 7 E. ...................................................Sec..26,T. 6 S., R. 7 E. .....................................................See. 25^ T. 6 S., R..7 E.. ..................................................Sec. 36, T. 6 S. , R. 7 E. ...................................................Sec. 1, T. 7'S..B. 7 E. ....................................................Sec. 32, T.,6S.,R. 8 E. .....................................................Sec. 32,T. 6 S. , R. 8 E. ....................................................Sec. 32, T. 6 S., B. 8 E. ............... ............................... ......Sec. 32. T. 6 S., R. 8 E.. ..................................................Sec. 32. T. 6 8., R. 8 E.. ..................................................Sec. 32, T. 6 S. , R. 8 E. ...........:............:..........................Sec. 4, TJ7 S., B. 8 E. ....................................................Sec. 4, T. 7. S., R. 8 E. .............................................:......Sec. 22. T. 6 S., R. 8 E. ...................................................Sec. 22, T. 6 S...,.R. 8 E. ......... I .........................................sec. 22,1. 6 s. , R-. 8 E. ........................:.......;...........;......Sec. 26, T. 6 S. , R! 8 E. ....................................................Sec. 26,T. 6 S., R. 8 E. i ............ I..................................!....
Sec. 26. T. 6 S.,.R. 8 E. ....................................................Sec. 35,T. 6 S-, R. 8 E. ...........................................;.......Sec. 35, T. 6 S. , R. 8 E. ........... I...................................:....Sec. 22, T. 6 S.,B. 8 E. ............. I...........:........................:.Sec. 4, T. 6 S.,R. 8 E. ....................................................Sec. 5 T. 6 S.,R. 8 E.. ..............:......'. ...............................Sec. 10, T. 6 S., R. 8 E.. ..................................................Sec. 10, T. 6 S. , R. 8 E. ...........:.'............ '..........................Sec.10 T. 6 S.,R. 8 E. ...................................................Sec. 34, T. 7 S., R. 8 E. ...................................................S<v> Id T 7 M T? S IT,Sec. 14, T. 8 S...R. 8 E. ...................................................Sec. 24, T. 8 S.,R. 8 E... .................................................
Sec. 12, T. 7 S., R. 8 E. ...................................................
Depth (fCCt)',
548557586-550553540548-558547'545563541510500.500329320385340385397400540'484448438
' 474440498375580
' 572510500511509500577542574526"532
' 517220250300315315464
Flow (gal lons -per
minute).
4522
200
180
\. 340
| 45045
225
130145112100100170170235-190358.257
7080
25890
157280180210125100.292'21522513013090
11290
390390-33
390640
'Tempera- ture (°'P;>.
7373707373;73.73
/ 73\. 73!f 73\ 73
737372.72747474747473-73.74.74,74.74:
7.474-
; 7.4-747.4:7.4-7.4-74'74'7.4-7474-757475.7575:91'91,929*90:70^
The flows from most of these wells have remarkably low tem peratures. Some are only a degree or two warmer than the mean annual air temperature of 73.9° (the average for 39 years- at India)-,, and several are colder. One well 400 feet deep in sec. 16'-, T. 7 S.,. R. 8 E., has water 8° warmer than that found in closely adjoining wells of similar depth. The 780-foot well in sec. 34 has. a flow with a temperature of 90°, indicating a rate of increase of 1° in 48 feet, and two wells, near by 220 and 250 feet deep have flows with a tempera ture of 91°, indicating rates of increase of 1° in 13 and 15 feet, re spectively. About 3. and 4 miles to the south, along a prolongation of the same line, are wells, yielding large flows with temperatures of 92°,. 94°, and 90°. It is probable that these wells tap a supply from a fissure, possibly a fault, along which heated waters are rising from a deep-seated source. It is. stated that a 500,-foot hole was sunk in

CALIFORNIA. 27
the bottom of the Salton Basin before the inundation and obtained a flow of water with a temperature of 92°.
OIL REGION.
In investigating the chemistry of the waters of the oil fields in San Joaquin Valley Rogers l determined temperatures of flow from several deep wells in Fresno and Kern counties.
" Temperaiwes in several deep wells in Fresno and Kern counties, Calif.
Location.
Fresno County:Sec. 12, T.21S.,R. 14 E..
Sec. 2, T.20S..R. 14 E..Kern County:
Sec. 9, T.31S.,R. 22 E..
Sec. 32, T. 12 N., R. 23 E.
Sec. 35, T. 31 S., R. 22 E..
Sec. 15, T.32S.,R.23E..
Sec. 25, T. 32-S., R. 23 E..
Sec. 31,T.32S.,R.24E..Sec. 20, T. 12 N., R. 24 W.
Sec. 12, T. 11 N.,R.24\V.
Sec. 35, T.32S..R.23E.. Sec. 28, T.31S.,R.23E..
Depth of source of
flow (feet).
2,077
1,104
3,800
2,505
1,495-1,727
1,705-1,820
1,400.
1,334-1,0092,540-2,500
3,S50
1,090 3,000
Temper ature ( F.).
118
80
131
115
120
102
97
10993
104
84 125
.Meanannual air tempera
ture
oCl.5
01.5
b 05
05
05
05
05
0505
05
05 05
Depth perdegree of increase in tem perature
(feet).
37
Remarks.
Sulphur water COO feet belowoil sand.
45 |j
58i
50
27+
48
40
30+91
91
58 50
Flow probably from 3,000+ feet Below main oil sand.
Flow from below oil sand,about 100 feet above secondoil sand .
About 100 feet below lowestoil sand.
Flow from about 150 feetbelow oil sand.
Flow from about 50 feetbelow oil sand.
Do.Flow from about 125 feet
below oil sand.Flow from about 2,550 feet
below oil sand.Shale of Monterey group. Flow from a few feet below
oil sand.
a Hanford average minus 7° for difference in altitude. 6 Balcersfleld average mimis 1°.
It is-reported that in a 5,390-foot hole at Rosemary station the oil at 3,000 feet had a temperature of 140° to 160°.
GRASS VALLEY.
Lindgren 2 made observations of temperatures in the mines of gold-bearing quartz in the Grass Valley and Nevada City districts in 1894. Thermometers were left in holes with the following re sults: 30 feet below surface, 53|°; 1,513 feet below surface, 66°; 1,513 feet below surface (dry hole in quartz), 67£°; 1,553 feet below surface, 66°. These observations indicate a rate of increase of 1° in 122 feet at 1,553 feet and of 1° in 105 feet at 1,513 feet.
1 Rogers, G. S., Chemical relations of the oil-field waters in San Joaquin Valley, Calif.: U. S. Geol. Survey Bull. 053,1917.
2 Undgron, Waldcmar, The gold quf.rtz veins of Nevada City and Grass Valley districts, Calif.: U. S. Geol. Survey Seventeenth Ann. Kept'., pt. 2, pp. 170-171,1890.
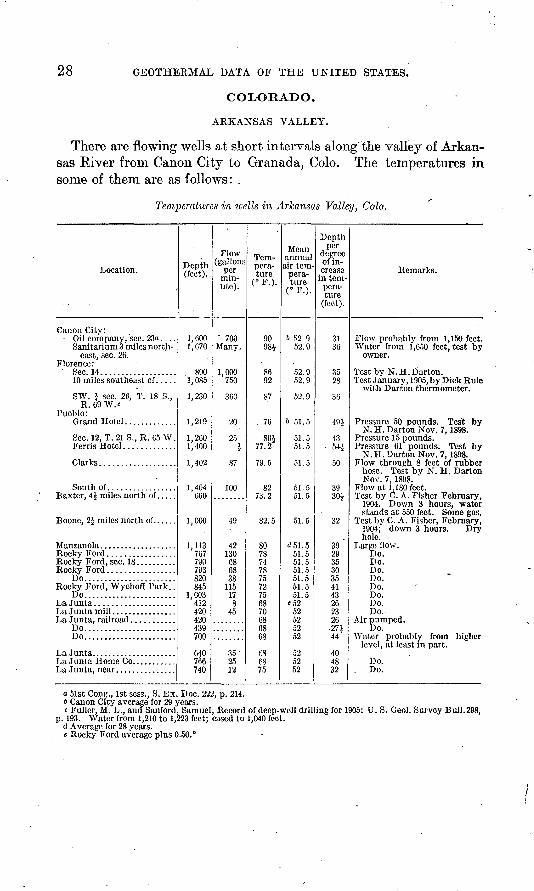
28 GEOTHERMAL DATA OF THE UNITED STATES.
COLORADO.
ARKANSAS VALLEY.
There are flowing wells at short intervals along the valley of Arkan sas Kiver from Canon City to Granada, Colo. The temperatures in some of them are as follows: .
Temperatures in ivclls in Arkansas Valley, Colo.
Location.
Canon City: - Oil company, sec. 23«. ...
Sanitariums miles north east, sec. 26.
Florence: ' Sec. 14...................
SW. i sec. 26, T. 18 S., R. 69 W.c
Pueblo:
Sec. 12, T. 21 S., R. 65 W. Ferris Hotel .............
Baxter, 4 £ miles north of. ....
Boone, 2£ miles north of ......
Do.......................Rocky Ford. Wycholf Park. .
Do.......................
Do.......................Do.......................
Depth (feet).
1,600 1,670
8001,085
1,230
1,219
1,260 1,400
1,402
1,404660
1,000
1.113767790793820845
1,003412420420439700
64.0766740
Flow (gallons
per min ute).
" 700 Many.
1,000750
360
20
25 1
87
100
49
42130086838
115 178
45
35'2512
Tem pera ture
(°F.).
9098J
8692
87
76
80$ 77.2
79.5
8273.2
82.5
807874787572756870686868
686875
Mean annual air tem
pera ture
(°F.).
6 52. 9 52.9
52.952.9
52.9
b 51.5
51.5 51.5
51.5
51.5
d51.551.551.551.551.551.5 51.5
«5252525252
525252
Depth per
degree of in crease
in tem pera ture
(feet).
31 30
359<S
36
49J-
43 54i-
SQ30-i
32
39'
2935303541 43262326
27444
404832
Remarks.
Flew probably from 1,150 feet. Water from 1,650 feet, test by
owner.
Test by N.H.Darton.
with Barton thermometer.
N. H.Darton Nov. 7, 1898. Pressure 15 pounds.
N.H.Darton Nov. 7, 1898.
hose. Test by N. H. Darton Nov. 7, 1898.
Test by C. A. Fisher February,1904. Down 3 hours, water stands at 550 feet. Some gas.
Test by C. A. Fisher, February, 1904; down 3 hours. Dry hole.
Do.Do.Do.Do.Do. Do.Do.Do.
Do.
level, at least in part.
Do.. Do.
a 51st Cong., 1st sess., S. Ex. Doc. 222, p. 214. 6 Canon City average for 29 years.c Fuller, M. L., and Sanford, Samuel, Record of deep-well drilling for 1905: U. S. Geol. Survey Bull.298,
p. 193. Water from 1,210 to 1,223 feet; cased to 1,040 feet, d Average for 28 years. e Rocky Ford average plus 0.50."
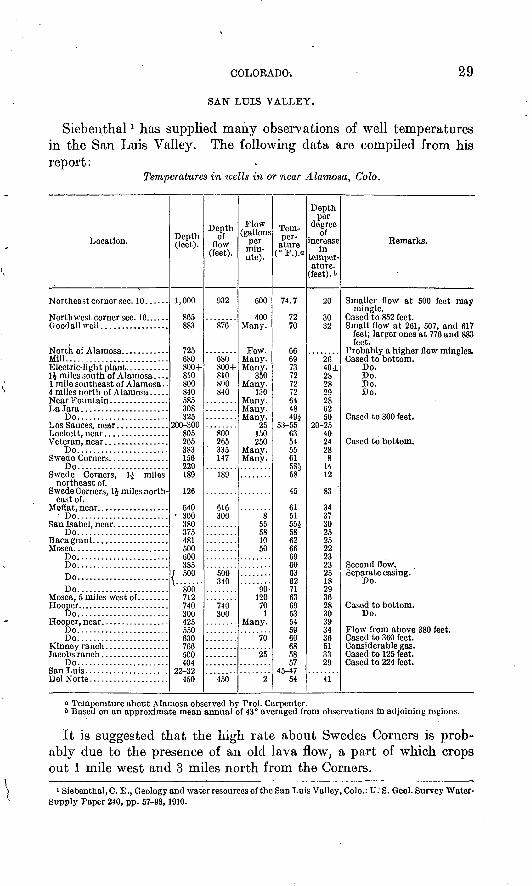
COLOKADO.
SAN LUIS VALLEY.
29
Siebenthal 1 has supplied many observations of well temperatures in the San Luis Valley. The following data are compiled from his report:
Temperatures in wells in or near Alamosa, Colo.
Location.
Goodall well. ................
Mill..........................
li miles south of Alamosa .... 1 mile southeast of Alamosa. . 4 miles north of Alamosa .....
Do.......................
Veteran, near ................Do.......................
Do.......................
northeast of.
east of.
Do.......................
Do.......................
Do.......................Do.......................Do.......................Do.......................
Do............ ...........
Do.......................
Do.......................
Depth (feet).
1,000
865883
725680800+810 800 840 585308325
200-300805265383156220189
126
640 300
380375481500600385
f 500
800712740300
ccn
630766500
22 32
Depth of
flow (feet).
932
876
680800+810 800 840
800265335147
189
616300
500
740300
450
Flow (gallons
per min ute).
600
400
Few
350 Many.
130
or.
150250
855581050
90'12070
1
70
25
2
Tem per ature
(°F.).a
74.7
7270
66fiQ
7372 72 72 644849i
53-556354556158i58
615155£58626669606362 71636953545960685857
45-47KA
Depth per
degree of
increase in
temper ature,
(feet). &
20 ?n32
op.
40±28 28 299<J
6250
20-25402428
8141283 '
343730252522232325lo29362830393436513329
Remarks.
mingle.
feet; larger ones at 776 and 883 feet.
Do.Do. Do. Do.
Cased to bottom.
Separate casing. "
Do.
Flow from above 380 feet.Cased to 360 feet.
a Temperature about Alamosa observed by Trof. Carpenter.6 Based on an approximate mean annual of 43° averaged from observations in adjoining regions.
It is suggested that the high rate about Swedes Corners is prob ably due to the presence of an old lava flow, a part of which crops out 1 mile west and 3 miles north from the Corners.
1 Siebenthal, C. E., Geology and water resources of the San Luis Valley, Colo.: U; S. Geol. Survey Water- Supply Paper 240, pp. 57-98,1910.

30 GEOTHERMAL DATA OF THE UNITED STATES.
The flow from a 405-foot well on Cotton Creek, in Saguache County, is reported to have a temperature of 58 °, but as the mean annual air temperature at that locality is not known the rate of increase can not be calculated.
LEADVILLE.
It is reported x that a 400-foot well in sec. 25 near Leadville yields a flow with a temperature of 58°. As the mean annual air temper ature at Leadville is 35° (average for 18 years) this would indicate a rate of increase of about 1° in 17 feet.
TRINIDAD.
In June, 1905, W. T. Lee made temperature determinations at various depths in a 2,500-foot boring at Trinidad. The hole was found to be plugged at 770 feet, and a Darton thermometer left at that depth for several hours recorded 69.6°. A test at 370 feet gave 67.8°. As the mean annual temperature of Trinidad is 51.3° (average for 15 years) these readings indicate rates of increase of 1° in 42 feet and 22 feet, respectively. The. difference between the two read ings, however, indicates a rate of increase of 1° in 222 feet between depths of 370 and 770 feet. . :
DENVER BASIN.
Few data are available as to the temperatures in many wells in the vicinity of Denver that formerly flowed. The following figures 2 may possibly be significant: -
Temperatures in wells in and near Denver, Colo.
Depth (feet).
350340.407239AAZTtll)
410 563635352620
480
Flow (gallons
per minute).
t3
30Many.
50
2010
140325
300
Tem per aturef° T? \( *.).
565862556258 6662
6526 C5
657
Depthper
degree of
increase of
temperature
(feet). a
56413346
50 3552
16038
G7
Remarks.
Some flow from 240 feet perhaps.
>Same well.Littleton.Cased to 248 feet.Principal flows from 250 and 575 feet.
Both same temperature. Cased to 350 feet.
a Calculated from mean annual temperature of 49.8°, average for 45 years.& Emmons, S. F., Cross, Whitman, and Eldriclge, G. H., Geology ot the Denver Basin in Colorado:
U. S. Geol. Survey Mon. 27, pp. 456-459, 1896.
1 Fifty-first Cong., 1st sess., S. Ex. Doc. 222, p. 329.2 Idem, pp. 188-208, 334, 336, 337.
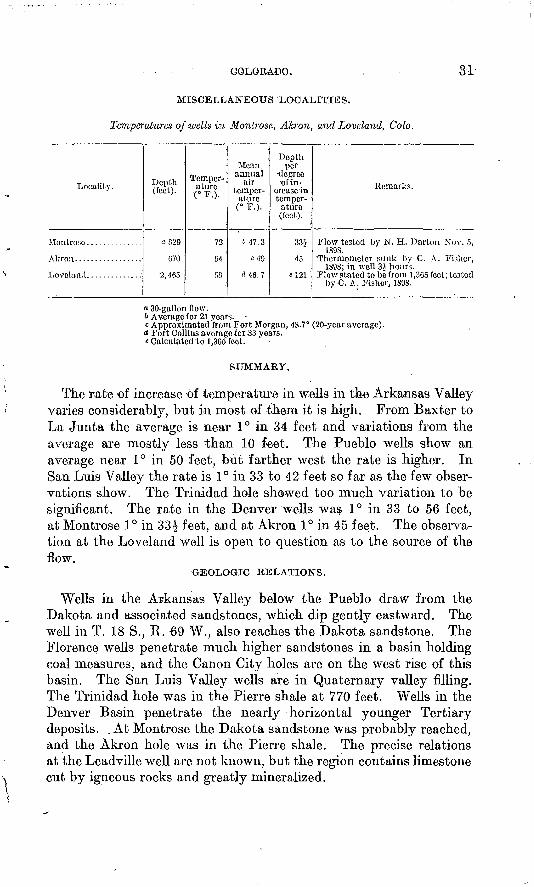
COLORADO.
MISCELLANEOUS LOCALITIES.
Temperatures of wells in Montrose, Akron, and Loveland, Colo.
31
Locality. Depth (feet).
<: 829
070
2,165
Temper ature(°F.).
72
04
58
Meananimal
air temperatureC F-).
i> -17.3c 49
d 46. 7
Depthper
degree ofin-
creasc intemper
ature(feet).
TH
45
«121
Remarks.
1898.
1898; in well 3* hours.
byC. A. .Fisher, 1898.
« 30-gallon flow. 6 Average for 21 years. c Approximated from Fort Morgan, 48.7° (20-year average),
d Fort Collins average for-33 years. «Calculated to 1,365 feet.
SUMMARY.
The rate of increase of temperature in wells in tla« Arkansas Valley varies considerably, but in most of them it is high. From Baxter to La Junta the average is near 1° in 34 feet and variations from the average are mostly less than 10 feet. The Pueblo wells show an average near 1° in 50 feet, but farther west the rate is higher. In San Luis Valley the rate is 1° in 33 to 42 feet so far as the few obser vations show. The Trinidad hole showed too much variation to be significant. The rate in the Denver wells was 1° in 33 to 56 feet, at Montrose 1° in 33£ feet, and at Akron 1° in 45 feet. The observa tion at the Loveland well is open to question as to the source of the flow.
GEOLOGIC RELATIONS.
Wells in the Arkansas Valley below the Pueblo draw from the Dakota and associated sandstones, which dip gently eastward. The well in T. 18 S., H. 6'9 W., also reaches the Dakota sandstone. The Florence wells penetrate much higher sandstones in a basin holding coal measures, and the Canon City holes are on the west rise of this basin. The San Luis Valley wells are in Quaternary valley filling. The Trinidad hole was in the Pierre shale at 770 feet. Wells in the Denver Basin penetrate the nearly horizontal younger Tertiary deposits. . At Montrose the Dakota sandstone was probably reached, and the Akron hole was in the Pierre shale. The precise relations at the LeadviUe well are not known, but the region contains limestone cut by igneous rocks and greatly mineralized.
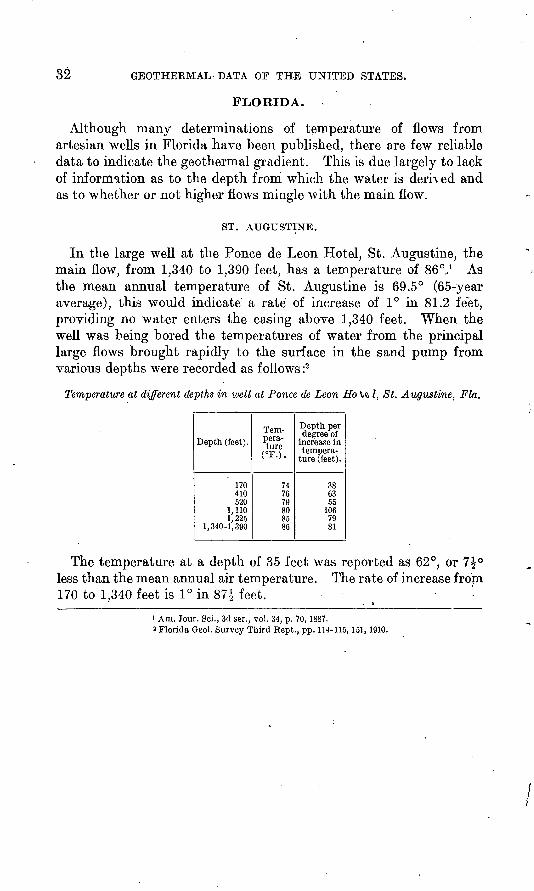
32 GEOTHERMAL' DATA OF THE UNITED STATES.
FLORIDA.
Although many determinations of temperature of flows from artesian wells in Florida have been published, there are few reliable data to indicate the geothermal gradient. This is due largely to lack of information as to the depth from which the water is derrved and as to whether or not higher flows mingle with the main flow.
ST. AUGUSTINE.
In the large well at the Ponce de Leon Hotel, St. Augustine, the main flow, from 1,340 to 1,390 feet, has a temperature of 86 0,1 As the mean annual temperature of St. Augustine is 69.5° (65-year average), this would indicate a rate of increase of 1° in 81.2 feet, providing no water enters the casing above 1,340 feet. When the well was being bored the temperatures of water from the principal large flows brought rapidly to the surface in the sand pump from various depths were recorded as follows :2
Temperature at different depths in well at Ponce de Leon Ho Vt I, St. Augustine, Fla.
Depth (feet).
170 410 520
1,110 1,225
1,340-1,390
Tem pera ture
( F.).
74 76 79 80 85 86
Depth per degree of
increase in tempera
ture (feet).
38 63 55
106 79 81
The temperature at a depth of 35 feet was reported as 62°, or 7|° less than the mean annual air temperature. The rate of increase from 170 to 1,340 feet is 1° in 87£ feet. '
1 Am. Jour. Sci., 3d ser., vol. 34, p. 70, 1887.2 Florida Geol. Survey Third Kept., pp. 114-115,151,1910.

FLORIDA. 33
MISCELLANEOUS, DATA.
Data for Florida, some of which may be reliable, are as follows;
Temperatures in wells in Florida.
Location.
Brevard County:
Melbourne, 1 mile west of.
TitusvilleClay County:
Duval County:.
Jacksonville Electric Co..
Jacksonville city well ....
Do...................Do...................Do...................Do...................Do...................
Jacksonville, 3 mileseast of Lee County:
Fort Myers 1 mile east of. Manatee County :
Do...................Marion County: Ocala .......Nassau County: Fernandina. Osceola County: Kissimmee.. Putnam County:
Do...................Do...................
Do...................
St. Lucie County: Orchid...................Orchid, i mile east of . . . .
Do...................St. John County:
TTpof irifirG
Do...................Volusia County:
Depth (feet).
230 350
400?
500?
350 218
500 362 450
550 ' 1,020
984
498 635
900 1,031
800
496 403
347 400 368 378 350
1,210 700 309
300 160-250
250 225 206 250 280
368 400 460 350
155 337 300
100-163 230 227
Flow (gals.).
Many. Many.
150 Many.
250 Many.
810 Many.
Many. 200-600
500 600
Many. Many. Many.
Many. Many. Many. Many.
120 400 400
Many. Many.
115
Tem pera ture
78 78
77
78
80 75
80 7478
77 81
71 74
74 74 75
80 80
72 80 74 75 76743
75
72 72-75
72 75 76 72 78
78 78 75 75
75 72 72
70-73 70 78
Mean annual
air tem pera ture
o72.6 72.6
72.6
72.6
672 "71.2
(J68.3 68.3 68.3
e 68. 2 68.2
68.2
68.2 68.2 68.268.2 58.2 68.2
/73.1 73.1
0 71. 7 (771.7 071.7 ft 71. 9 ft 71. 9 <70.2 «68.2 <72.3
/69.6 »69.6 *69.6 <69.6 *69.9 *69.9
n»72.6 n»72.6 "72.7 »72.7
o69.6 P68.9 P68.9
970 70 70
Depth per de gree of ncrease in tem pera ture
(feet).
43 65
90
93
44 60
42* 64 46J
62J
118
72 56
48 150 116
73 284 121 52
125 f
83 31 31
119 35
66 74
200 152
29 107 90
28
Remarks.
Large flow; well 325 feet. Large flow; first flow at 280
feet, probably mingles. Large flow; possibly some
from 318 feet. Large flow; may be from 250
feet. Large flow; cased to bottom. Large flow.
300-gallon flow; well 815 feet. Large flow.
Do.
"Flow from 550 feet." Main flow probablv from 555
feet; another at 975 feet. Water probably also from 524,
750, and 860 feet.
1- Mixed flows.
Do. Do.
Flow from bottom.
Cased to bottom. Large flow. 150-gallon flow.
Flow from 347 feet. Flow mostly from 200 feet. Flow from 348 leet. Flow from 360 feet. Flow from 300 feet. Pumped 74 feet.
Water irom 140 feet.
Water from 300 feet. Water from 155 to 200 feet. Water from 200 feet. Water from 168 feet. Water from 190 teet. Water from 250 feet. Water from 280 feet.
Water from 155 feet. Water from 330 feet. Water from 280 feet.
a Malabar average for 25 years.& Orlando average minus 3°.c 21 years average.d Middlcburg average.«Jacksonville average for 46 years./ Average for 48 years.g Average for 33 years.ft Braidentown average plus 2°.i Average for 25 years.
137163° 20 Bull. 701 3
/ Average for 18 years. * Federal Point average plus 0.3°. ' Federal Point average plus 0.4°. m Fort Pierce average minus 0.3°. n Fort Pierce average minus 0.2°. o St. Augustine average plus 0.1°. V St. Augustine average minus 0.6°. « Deland average for 20 years.
34 GEOTHERMAL DATA OF THE UNITED STATES.
SUMMARY.
Apparently the most important data on temperature here pre sented are those from St. Augustine, Fort Myer, Mandarin, and Rockledge. Some of the others may be reliable, but there is a possi bility that in many of the wells higher flows mingle with the main flow. The source of the flows at Melbourne and Micco is not known, and most of the other wells in Brevard County are shallow. The flows at Jacksonville are known to be mixed, for although the main flow is derived from a depth of 555 feet other flows come in, notably in the deeper wells, which tap a flow at a depth of 975 feet, below a body of clay. Temperatures of flows in the 984-foot city well, which is cased only to 494 feet, are stated 1 to be as follows: 524 to 727 ieet, 76° to 77|°; 865 to 970 feet, 78° to 79°; flow at mouth, 77*°. The large flow from the 496-foot well at Fort Myer probably affords a true indication of underground temperature, although it shows a smaller rate of increase than is indicated by the well a mile east of Fort Myer.
GEOLOGIC RELATIONS.
The wells in Florida penetrate sands, clays, and limestones of Tertiary age, which lie nearly horizontal and are uniform in char acter over wide areas. Those at St. Augustine, Jacksonville, and Mandarin penetrate deeply into Oligocene limestones of the Vicks- burg group, which are overlain by clays and sands of later Tertiary age. These limestones were also reached by the holes in Brevard and Clay counties and at Fort Myer. The variations in geothermal gradient have no obvious connection with geologic features.
GEORGIA.
TEMPERATURES.
Local observers have furnished records of the temperature of flows from several wells in Georgia which afford a few data as to the geo thermal gradient. Other facts regarding the wells are given by McCallie 2 and by Stephenson and Veatch. 3
1 U. S. Geol. Survey Bull. 298, p. 196,1906.2 McCallie, S. W., A preliminary report on the artesian-well system of Georgia: Georgia Geol. Survey
Bull. 7,214 pp., 1898; A preliminary report on the underground waters of Georgia: Georgia Geol. Survey Bull. 15, 370 pp., 1908.
8 Stephenson, L. W., and Veatch, J. O., Underground waters of the Coastal Plain of Georgia: U. S. Geol. Survey Water-Supply Paper 341, 539 pp., 1915.
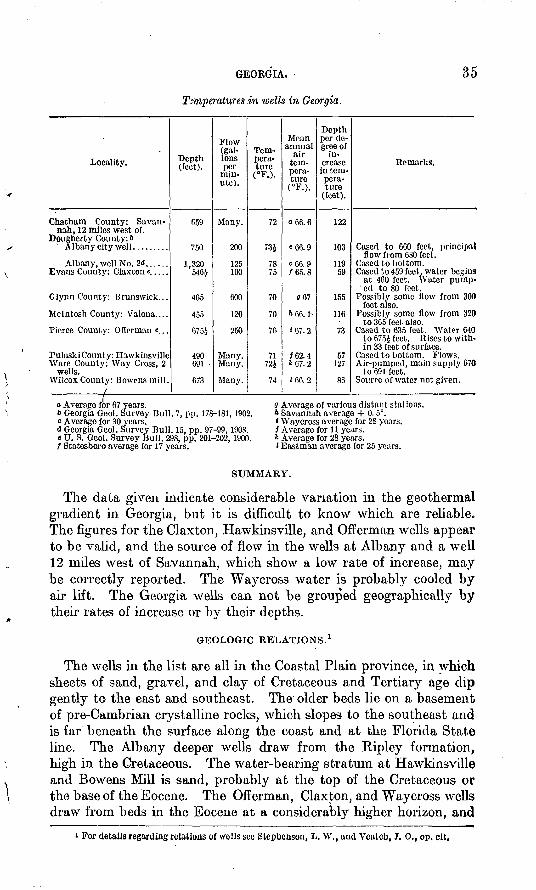
GEORGIA.
Temperatures in wells in Georgia.
35
Locality.
Chatham County: Savannah, 12 miles west of.
Dougherty County: b' Albany city well.........
Albany, well No. 2<J. .....Evans County: Claxton ......
Glynn County: Brunswick...
Mclntosh County: Valona....
Pierce County: Offerman «. . .
Pulaski County: HawkinsvilleWare County: Way Cross, 2
wells.Wilcox County: Bowrns mill.
Depth(feet).
659
750
1,320646J
465
455
675J
490691
673
Flow(gallons per
minute).
Many.
200
125100
600
120
250
Many.Many.
Many.
Tempera ture
"
72
73J
7875
70
70
76
7172J
74
Meanannual
lirailtem perature
066.6
C66.9
C66.9/65.8
1767
h 66. b
<67.2
/62.4*67.2
* 66. 2
Depthper degree of
increase in lem-pera- tu re
(feet).
122
103
11959
155
116
73
57127
86
Remarks.
Cased to 660 feet, principalflow from 680 feet.
Cased to bottom.Cased to 459 feet, water begins
at 460 feet. Water pump. cd to 80 feet.
Possibly some flow from 300feet also.
Possibly some flow from 320to 365 feet also.
Cased to 635 feet. Water 040to 67 5£ feet. R ises to within 33 feet of surface.
Cased to bottom. Flows.Air-pumped, main supply 670
to 691 feet.Sourrc of water not given.
<* Average for 67 years.6 Georgia Geol. Survey Bull. 7, pp. 178-181,1902.c Average for 30 years.<J Georgia Geol. Survey Bull. 15, pp. 97-99,190S.e U. S. Geol. Survey Bull. 298, pp. 201-202,1900./ Statesboro average for 17 years.
a Average of various distant stations. ft Savannah average + 0.5°.* Waycross average for 28 years. i Average for 11 years.* Average for 28 years.l Eastman average for 25 years.
SUMMARY.
The data given indicate considerable variation in the geothermal gradient in Georgia, but it is difficult to know which are reliable. The figures for the Claxton, Hawkinsville, and Offerman wells appear to be valid, and the source of flow in the wells at Albany and a well 12 miles west of Savannah, which show a low rate of increase, may be correctly reported. The Waycross water is probably cooled by air lift. The Georgia wells can not be grouped geographically by their rates of increase or by their depths.
GEOLOGIC RELATIONS. 1
The wells in the list are all in the Coastal Plain province, in which sheets of sand, gravel, and clay of Cretaceous and Tertiary age dip gently to the east and southeast. The older beds lie on a basement of pre-Cambrian crystalline rocks, which slopes to the southeast and is far beneath the surface along the coast and at the Florida State line. The Albany deeper wells draw from the Ripley formation, high in the Cretaceous. The water-bearing stratum at Hawkinsville and Bowens Mill is sand, probably at the top of the Cretaceous or the base of the Eocene. The Offerman, Claxton, and Waycross wells draw from beds in the Eocene at a considerably higher horizon, and
i For details regarding relations of wells see Stephenson, L. W., and Veatcb, J. O., op. cit.
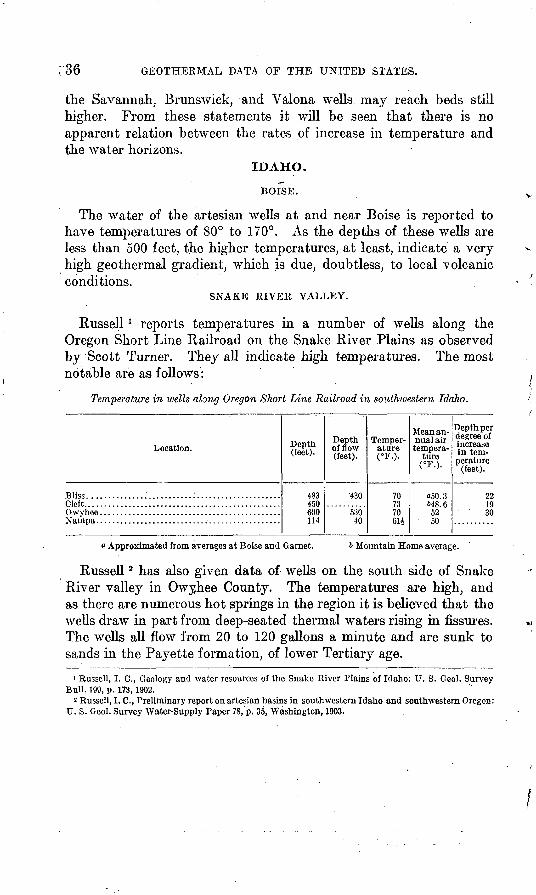
,-36GEOTHEEMAL DATA OF THE UNITED STATES.
the Savannah, Brunswick, and Valona wells may reach beds still higher. From these statements it will be seen that there is no apparent relation between the rates of increase in temperature and the water horizons.
IDAHO.
BOISE.
The water of the artesian wells at and near Boise is reported to have temperatures of 80° to 170°. As the depths of these wells are less than 500 feet, the higher temperatures, at least, indicate a very high geothermal gradient, which is due, doubtless, to local volcanic conditions.
SNAKE EIVEK VALLEY.
Russell 1 reports temperatures in a number of wells along the Oregon Short Line Railroad on the Snake River Plains as observed by Scott Turner. They all indicate high temperatures. The most notable are as follows:
Temperature in wells along Oregon Short Line Railroad in southwestern Idaho.
Location.
Bliss................................................Cleft.................................................
Depth (leet).
483450600114
Depth of flow (feet).
'430
53040
Temper ature . (°F.).
7071
7061*
Mean an nual air tempera
ture (°F.)-
nSO. 3*>48.6w50
Depth per degree of increase in tem perature
(feet).
2210in
Approximated from averages at Boise and Garnet. 6 Mountain Home average.
Russell 2 has also given data of wells on the south side of Snake River valley in Owyjhee County. The temperatures are high, and as there are numerous hot springs in the region it is believed that the wells draw in part from deep-seated thermal waters rising in fissures. The wells all flow from 20 to 120 gallons a minute and are sunk to sands in the Payette formation, of lower Tertiary age.
1 Russell, I, C., Geology and water resources of the Snake River Plains of Idaho: U. S. Geol. Survey Bull. 199, p. 173, 1902.
2 Russell, I. C., Preliminary report on artesian basins in southwestern Idaho and southwestern Oregon: U. S. Geol. Survey Water-Supply Paper 78, p. 35, Washington, 1903.
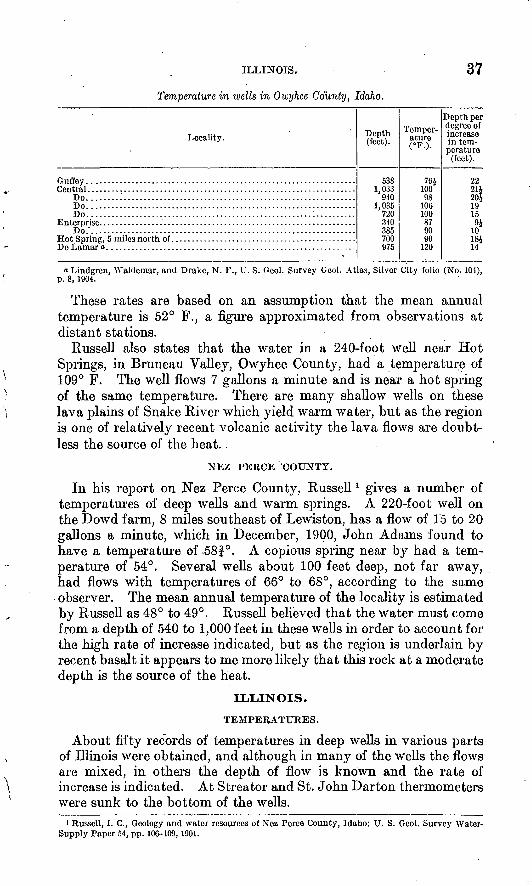
ILLINOIS. 37
Temperature in ivells in Owyhee County, Idaho.
Locality.
Do...................................................................Do...................................................................Do........................................................:..........DO:..................................................................
Depth (feet).
5381.033
9401.035
720340385700975
Temper ature (°F.).
76i-10098
100100879090
120
Depth per degree of increase in tem perature
(feet).
22911
20i1915Ql
1018i14
a Lindgren, Waklemar, and Drake, N. F., U. S. Geol. Survey Geol. Atlas, Silver City folio (No. 104), p. 8, 1904.
These rates are based on an assumption that the mean annual temperature is 52° F., a figure approximated from observations at distant stations.
Russell also states that the water in a 240-foot well near Hot Springs, in Bruneau Valley, Owyhee County, had a temperature of 109° F. The well flows 7 gallons a minute and is near a hot spring of the same temperature. There are many shallow wells on these lava plains of Snake River which yield warm water, but as the region is one of relatively recent volcanic activity the lava flows are doubt less the source of the heat.
NEZ PERCE COUNTY.
In his report on Nez Perce County, Russell 1 gives a number of temperatures of deep wells and warm springs. A 220-foot well on the Dowd farm, 8 miles southeast of Lewis ton, has a flow of 15 to 20 gallons a minute, which in December, 1900, John Adams found to have a temperature of ,58f°. A copious spring near by had a tem perature of 54°. Several wells about 100 feet deep, not far away, had flows with temperatures of 66° to 68°, according to the same observer. The mean annual temperature of the locality is estimated by Russell as 48° to 49°. Russell believed that the water must come from a depth of 540 to 1,000 feet in these wells in order to account for the high rate of increase indicated, but as the region is underlain by recent basalt it appears to me more likely that this rock at a moderate depth is the source of the heat.
ILLINOIS.
TEMPERATURES.
About fifty records of temperatures in deep wells in various parts of Illinois were obtained, and although in many of the wells the flows are mixed, in others the depth of flow is known and the rate of increase is indicated. At Streator and St. John Darton thermometers were sunk to the bottom of the wells.
1 Russell, I. C., Geology and water resources of Ncz Perce County, Idaho: U. S. Geol. Survey Water- Supply Paper 54, pp. 106-109,1901.
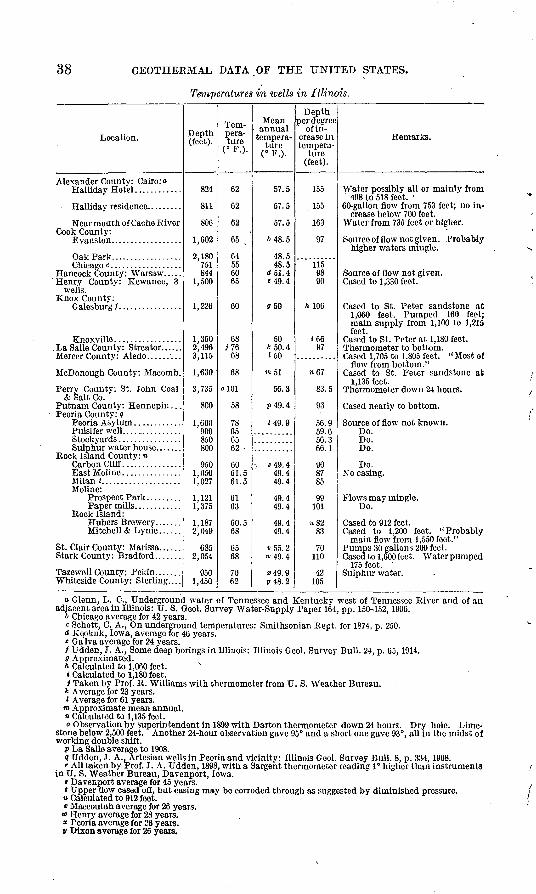
38 GEOTHERMAL DATA OF THE UNITED STATES.
Temperatures in wells in Illinois.
Location.
Alexander County: Cairo: o Halliday Hotel.. ..........
Near mouth of Cache River Cook County:
Oat Parlr
Hancock County: Warsaw..... ' Henry County: Kevvanee, 3
wells. Knox County:
McDonough County: Macomb.
Perry County: St. John Coal & Salt Co.
Putnam County: Hennepin. . . Peoria County: g
Sulphur water house. ......Rock Island County: n
Carbon Cliff... ............
Moline:
Rock Island:
Mitchell & Lynie ......
St. Glair County: Marissa. .....
Tazewell County: Pekin. ......Whiteside County: Sterling....
Depth (feet).
824
811
806
1,602
2,180751844
1,500
1,226
1,3602,4963,115
1,630
3,735
800
1,600QOfl850800
9501,0501,027
1 191
1,375
1,1872,049
685 2,054
9501,450
Tem pera ture
(° F.).
62
62
62
65
645560 65
60
68J76
68
68
olOl
58
78656562 -
6061.561.5
6163
60.568
65 68
7062
Mean annual
tempera ture
(° F.).
57.5
57.5
57.5
648.5
48.548.5
(J51.4 «49.4
050
50*50.4*50
w51
56.3
P49.4
J49.9
; * 49. 449.449 4
49.449 4
49.449.4
"55.2
x 49 91/48.2
Depth per degree
of in crease in tempera
ture (feet).
155
155
163
97
11598 90
ft 106
»6697
»C7
83.5
93
Ifi Qco fi
56.366.1
900785
QQ101
tt S9
83
70 110
42105
Remarks.
Water possibly all or mainly from498 to 518 feet.
60-gallon flow from 753 feet; no in«crease below 700 feet.
Water from 735 feet or higher.
Source of flow not given. Probablyhigher waters mingle.
Source of flow not given. Cased to 1,330 feet."
Cased to St. Peter sandstone at1,060 feet. Pumped 160 feet; main supply from 1,100 to 1,215 feet.
Cased to St. Peter at 1,180 feet.
Cased 1,705 to 1,805 feet. " Most offlow from bottom."
Cased to St. Peter sandstone at 1,135 feet.
Thermometer down 24 hours.
Cased nearly to bottom.
Do.Do.Do.
Do.
Do.
Cased to 1,200 feet. "Probably main flow from 1,550 feet."
Pumps 30 gallons 200 feet.
175 feet. '
a Glenn, L. C., Underground water of Tennessee and Kentucky west of Tennessee River and of an adjacent area in Illinois: U. S. Geol. Survey Water-Supply Paper 164, pp. 150-152,1906.
6 Chicago average for 42 years.c Schott, C. A., On underground temperatures: Smithsonian Rept. for 1874, p. 250.d Ke.okuk, Iowa, average for 46 years.' Ga Iva average for 24 years./ Udden, J. A., Some deep borings in Illinois: Illinois Gcol. Survey Bull. 24, p. 65,1914.Q Approximated.ft Calculated to 1,060 feet. N» Calculated to 1,180 feet.i Taken by Prof. R. Williams with thermometer from U. S. Weather Bureau.
* Average for 23 years.' Average for 61 years.
m Approximate mean annual.« Calculated to 1,135 feet.o Observation by superintendent in 1899 with Darton thermometer down 24 hours. Dry hole. Lime
stone below 2,500 feet. Another 24-hour observation gave 95° and a short one gave 93°, all in the midst of working double shift.
P La Salle average to 1908.9 Udden, J. A.. Artesian wells in Peoria and vicinity: Illinois Geol. Survey Bull. 8, p. 334,1908.r All taken by Prof. J. A. Udden, 1898, with a Sargent thermometer reading 1° higher than instruments
in U. S. Weather Bureau, Davenport, Iowa.i Davenport average for 45 years.t Upper flow cased off. but casing may be corroded through as suggested by diminished pressure.u Calculated to 912 feet.» Maccoutah average for 26 years.
«> Henry average for 28 years.z Peoria average for 26 years.v Dixon average for 26 years.

ILLINOIS. 39
SUMMARY.
The most satisfactory observations of underground temperature in Illinois are those made at St. John and Streator, where thermome ters were sunk to the bottoms of the holes. At St. John the instru ment was left down 24 hours. When withdrawn it read 101°, indi cating a rate of increase of 1° in 83.5 feet. The temperatures in wells in Rock Island County were accurately taken by Prof. Udden. The variation which some of them show is possibly due largely to mingling of flows. However, the observations were made just after vigorous drilling, and some heat of impact may be manifest. The wells at Peoria give results so closely accordant that presumably the flows are all from the bottom or near it. The Hennepin well, "cased nearly to the bottom," and the Knoxville, Chicago, Marissa, and Galesburg wells give close approximations of rate if the water is not cooled by pumping. The temperatures in the Cairo wells may not be accu rately determined.
Flows from the deep well, at Aledo may be mixed, and if so the rate of 1° in 168 feet is not valid. The Oak Park flow is undoubtedly mixed. The high temperature of water from the 950-foot well at Pekin probably indicates a source at the bottom of the well, and the rate of 1° in, 42 feet is considerably higher than that of any other well in the State.
The rates of increase given in the list appear not to have any regional relations but vary from place to place. Galesburg and Knoxville, not far apart, apparently have rates of 1° in 106 feet and 66 feet, respectively. Pekin is not far south of Peoria, where the average rate is 1° in 60 feet.
GEOLOGIC RELATIONS.
The Illinois wells penetrate limestone, shale, #nd sandsfone of Carboniferous to Ordovician age, all lying nearly horizontal, without local disturbances of large amount and with no volcanic rocks. The Streator well is stated to be on a low anticline trending northwest ward. The deep wells in the southern part of the State reach the oldest strata, most of them drawing from the St. Peter sandstone. At Peoria the shallower wells in the Niagara limestone show no material difference in rate of increase in temperature from the deeper ones, which draw from the St. Peter sandstone. A similar condition is presented by various wells of Rock Island County. The Cairo wells penetrate Cretaceous deposits to a depth of about 500 feet and then enter flint rock and sandstone of Mississippian age. If the flow£ are from about 500 feet, the base of the Cretaceous, the rate is 1° in about 110 feet.
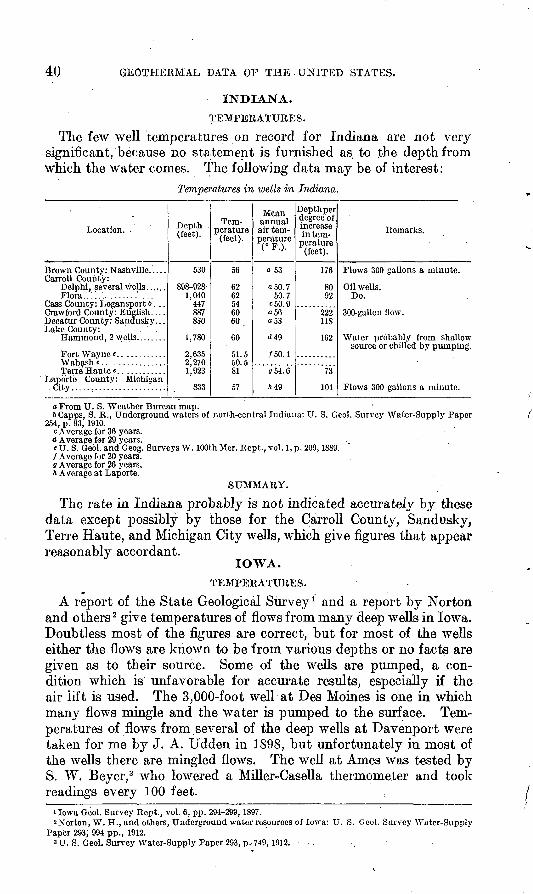
40 GEOTHERMAL DATA OF THE.UNITED STATES.
INDIANA.
TEMPERATURES.
The few well temperatures on record for Indiana are not very significant, because no statement is furnished as to the depth from which the water comes. The following data may be of interest:
Temperatures in wells in Indiana.
Location. .
iBrown County: Nashville. ....Carroll County:
Delphi, several wells ...... Flora..:!.,...... ..'.......
Cass County: Logansport i> . . .Crawford County: English. . . .Decatur County: Sandusky.. .Lake County: . .
Laporte County: MichiganCity........................
Depth (feet).
530
898-928- 1,040
447887830
1,780
2,6352,2701,923
833
Tem perature
(feet).
56
62 62546060
60
51.550.581
57
annual air tem perature
a 53
o50.7 50.7
c50.9
o53
d49
/50.1
054.6
ft 49
Depth perdegree of increase in tem
perature(feet).
176
80 92
222118
162
73
104
Remarks.
Flows 300 gallons a minute.
Oil wells. Do.
300-gallon flow.
source or chilled by pumping.
a From U. S. Weather Bureau map.&Capps, S. R., Underground waters of north-central Indiana: U. S. Geol. Survey Water-Supply Paper
254, p. 93, 1910. c Average for 36 years.d Average for 29 years. . < U. S. Geol. and Geog. Surveys W. 100th Mer. Rcpt., vol. 1, p. 209,1889. / Average for 20 years. g Average for 26 years. A Average at Laporte.
SUMMARY.
The rate in Indiana probably is not indicated accurately by these data except possibly by those for the Carroll County, Sandusky, Terre Haute, and Michigan City wells, which give figures that appearreasonably accordant.
IOWA.
TEMPERATURES.
A report of the State Geological Survey 1 and a report by Norton and others 2 give temperatures of flows from many deep wells in Iowa. Doubtless most of the figures are correct, but for most of the wells either the flows are known to be from various depths or no facts are given as to their source. Some of the wells are pumped, a con dition which is unfavorable for accurate results, especially if the air lift is used. The 3,000-foot well at Des Monies is one in which many flows mingle and the water is pumped to the surface. Tem peratures of flows from several of the deep wells at Davenport were taken for me by J. A. Udden in 1898, but unfortunately in most of the wells there are mingled flows. The well at Ames was tested by S. W. Beyer, 3 who lowered a Miller-Casella thermometer and took readings every 100 feet.
1 Iowa Geol. Survey Rept., vol. 6, pp. 294-299,1897.2 Norton, W. H., and others, Underground water resources of Iowa: U. S. Geol. Survey Water-Supply
Paper 293, 994 pp., 1912. a U. S. Geol. Survey Water-Supply Paper 293, p.-749,1912.
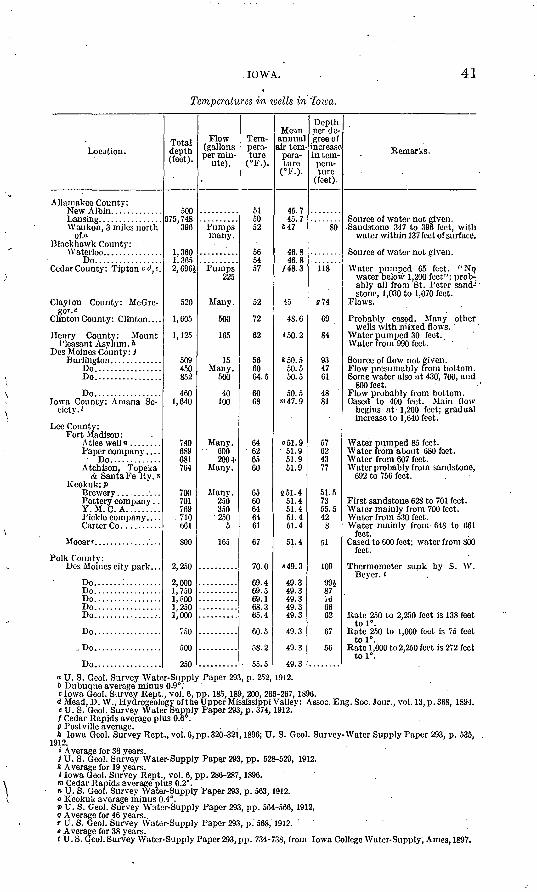
. IOWA. 41
Temperatures in ivells in 'Iowa.
Location.
Allamakee County:
Waukon, 3 miles north of.»
Blackhawk County:
Do.................CedarCounty: Tipton <=<*,«.
Clavton County: McGre- gor.c
Clan ton County: Clinton....
Henry County: Mount Pleasant Asylum. A
DCS Moines County: i
Do.................Do.................
Do.................Iowa County: Amana So
ciety.'
Lee County: Fort Madison :
Paper company ....
Atchison, Topeka & Santa Fe Ry. «
Keokuk: p
Pottery company . . Y.M.C. A.. ...:...Pickle company....
Polk County: DCS Moines city park.. .
Do.................Do................. Do.................Do.................Do..... ............
Do.................
.Do.................
Do.................
Total depth (feet).
500675.748
396
1,3601.3652,696i
520
1,605
1,125
509450852
4601,640
740689 681764
700701 769
. 710 661
800
2, 250
2,0001,750 1,5001,2501,000
7CA
CArt
250
Flow (gallons per min
ute).
Pumps many.
Pumps 225
Many.
500
165
15
500
40100
600 200-t-
Many,
Many.250 350250
5
165
Tem pera ture
(°F.).
515052
565457
52
72
62
566064.5
6068
6462 6560
6560 6464 61
67
70.0
69.469.5 69.168.365.4
firt >;
58.2
55.5
Mean annual air tem
pera ture
(°F.).
45.745.7
647
Afi SAK 8
/48.3
43
4S.6
»50.2
»50.550.550.5
50.5ro47.9
o51.9 51.9
51.951.9
851.451.4 51.451.4 51.4
51.4
«49.3
49.349.3 49.349.349.3
49.3
49.3
Depth per de gree of
increase in tem pera ture
(feet).
80
118
074
69
84
934761
4881
5762 4377
51.57355.542
8
109
99J87 V66662
67
56
Remarks.
Sandstone 347 to 396 feet, with water within 137 feet of surface.
Water pumped 65 foot. "Np water below 1,200 feet"; prob ably all from St. Peter sand- ' stone, 1,030 to 1,070 feet.
Flows.
Probably cased. Many other wells with mixed flows. "
Water pumped 30 feet. Water from 990 feet.
800 feet.
Cased to 400 feet. Main flow begins at 1,200 feet; gradual increase to 1,640 feet.
Water from about 680 feet. Water from 607 feet.Waterprobably from sandstone,
692 to 756 feet.
First sandstone 628 to 701 feet.
Water from 530 feet. Water mainly from 648 to 661
feet.
feet.
Thermometer sunk by S. W. Bcycr. '
Rate 250 to 2,250 feet is 138 feet tol°.
Rate 250 to 1,000 feet is 75 feettol°.
Rate 1,000 to 2,250 feet is 272 feettol°.
« U. S. Geol. Survey Water-Supply Paper 293, p. 252, 1912. b Dubuquc average minus 0.9°:c Iowa Geol. Survey Rept., vol. 6, pp. 185,189, 200, 266-267,1896.
<J Mead, D. W., Hydrogeology of the Upper Mississippi Valley: Assoc. Eng. Soc. Jour., vol. 13, p. 368, 189-1. e U. 8. Geol. Survey Water Supply Paper 293, p. 374,1912. / Cedar Rapids average plus 0.6 . o Postville average. . .A Iowa Geol. Survey Rept., vol. 6, pp. 320-321,1896; U. S. Geol. Survey-Water Supply Paper 293, p. 535.
1912.» Average for 36 years.> U. S. Geol. Survey Water-Supply Paper 293, pp. 528-529, 1912. k Average for 19 years.J Iowa Geol. Survey Rept., vol. 6, pp. 286-287,1896.
«n Cedar Rapids average plus 0.2°.» U. S. Geol. Survey Water-Supply Paper 293, p. 563,1912. o Keokuk average minus 0.4°.p U. S. Geol. Survey Water-Supply Paper 293, pp. 564-566, 1912. 5 Average for 46 years..T U. S. Geol. Survey Water-Supply Paper 293, p. 568, 1912. ' « Average for 38 years. t U. S. Geol. Survey Water-Supply Paper 293, pp. 734-738, from Iowa College Water-Supply, Ames, 1897.
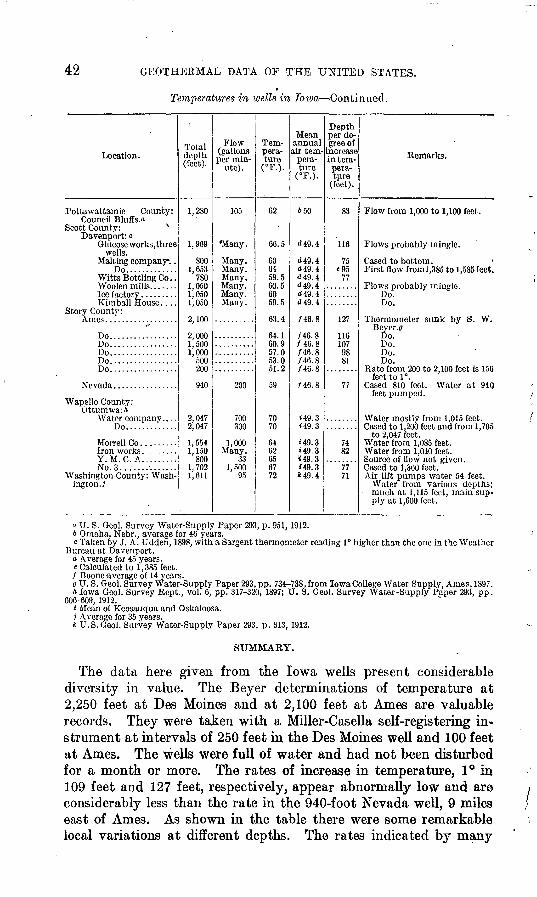
42 GEOTHERMAL DATA OF THE UNITED STATES.
Temperatures in ivells in Toioa Continued.
Location.
Pottawattamie County: Council Bluffs.a
Scott County: v Davenport: c
Glucose works,three wells.
Malting company. . Do.............
Witts Bottling Co..
Story County: A. TUGS f
Do.................Do.................Do.................Do.................Do.................
Wapello County: Ottumwa: ft
Do.........-.--
Y. M. C. A.........No.3. .............
Washington County: Wash ington.;'
Total depth (feet).
1,280
1,969
800 1,653
780 1,0501,0501,050
9 inn
2,0001,500i finfi
500200
940
2,0472,047
1,5541.150
8001,7021,611
Flow (gallons per min
ute).
105
*Many.
Many.
Many.
200
700300
1,000
331,500
95
Tem pera ture
(°F.).
62
66.5
60 6459.5 60.56059.5
63.4
64.160.957.053.051.2
59
7070
6462656772
Mean annual air tem
pera ture
(°F.).
&50
<*49.4
d49.4 d49.4d49.4 d49.4(Z49.4(149.4
/46.8
/46.8/46.8X46.8/46.8/46.8
/46.8
J49.3<49.3
i49.3»49.3»49.3*49.3S49.4
Depth per de gree of
increase in tem pera ture
(feet).
83
116
75
77
127
1161070801
77
7482
7771
Remarks.
Flow from 1,000 to 1,100 feet.
Flows probably mingle.
Cased to bottom.
Do.Do.
Beyer.? Do.Do.Do.Do.
feot to 1°. Cased 810 feot. Water at 940
feet pumped.
to 2,047 feet.
Air lift pumps water 54 feet. Water from various depths; much at 1,115 feet, main sup ply at 1,600 feet.
a. U. S. Geol. Survey Water-Supply Paper 293, p. 951,1912.b Omaha, Nebr., average for 46 years.c Taken by S. A. Udden, 1898, with a Sargent thermometer reading 1° higher than the one in the Weather
Bureau at Davenport.d Average for 45 years.«Calculated to 1,385 feet./ Boone average of 14 years.g TJ. S. Geol. Survey Water-Supply Paper 293, pp. 734-738, from Iowa College Water Supply, Ames, 1897.ft Iowa Geol. Survey Kept., vol. 6, pp. 317-320, 1897; U. S. Geol. Survey Water-Supply Paper 293, pp.
606-609, 1912.i Mean of Keosauqua and Oskaloosa.} Average for 35 years.* U.S.Geol. Survey Water-Supply Paper 293, p. 613, 1912.
SUMMARY.
The data here given from the Iowa wells present considerable diversity in value. The Beyer determinations of temperature at 2,250 feet at Des Moines and at 2,100 feet at Ames are valuable records. They were taken with a Miller-Casella self-registering in strument at intervals of 250 feet in the Des Moines well and 100 feet at Ames. The wells were full of water and had not been disturbed for a month or more. The rates of increase in temperature, 1° in 109 feet and 127 feet, respectively, appear abnormally low and are considerably less than the rate in the 940-foot Nevada well, 9 miles east of Ames. As shown in the table there were some remarkable local variations at different depths. The rates indicated by many

IOWA. 43
records in the southeast corner of the State vary greatly. The deeper Ottumwa wells give 1° in 62£, 77|, 80, and 87 feet, and the 800-foot well at the Young Men's Christian Association Building indicates 1° in 53 feet or less. The Amana data appear to be not worth considering. Some of the Davenport data appear to be con sistent and indicate a rate of 1° in 75 to 77 feet. The Keokuk, Fort Madison, and Burlington rates of 1° in 42 to 73 feet appear to be reliable, but the precise rate for each place is not deducible from the data given. The Mount Pleasant and Washington rates are reasonably consistent with the figures for the adjoining counties. The McGregor and Waukon wells, in the northeast corner of the State, although of moderate depth, appear to afford reliable data. The same is true of Council Bluffs, in the extreme western part of the State, where the rate of increase is the same as in the wells at Omaha, across Missouri River 1° in 83 feet.
GEOLOGIC RELATIONS.
The Iowa wells penetrate limestones, shales, and sandstones of Carboniferous to Cambrian age. They lie nearly horizontal, but most of the State is occupied by a broad, open syncline whose axis extends from east and northeast to southwest and passes near Mus- ca'tine, Oscaloosa, Indianola, Osceola, and Bedford. The Algon- kian rocks are deeply buried, for they were not reached by the 2,696^-foot hole at Tipton, and no igneous rocks or marked local disturbances are known to be near the wells of which data were recorded. The deeper borings and those in the northeast corner of the State draw from the sandstones of Cambrian or Ordovician age, especially the St. Peter sandstone, which is the source of supply at Tipton and Washington and is about 1,300 feet below the surface at Ottumwa, 1,100 feet at Davenport, 950 feet at Burlington, and 900 feet at Keokuk. The Ames, Amana, Davenport, and Des Moines holes penetrate the Jordan sandstone; the Nevada well draws from much higher limestones of Silurian age. The shallow Burlington and Fort Madison wells draw from strata considerably above the Jordan sandstone. When these facts are considered in connection with the rates of increase given in the table there appears to be no connection between the geologic horizon and the rate, so far as is indicated by the data available.
The abrupt change of rate from 1° in 75 feet to 1° in 272 feet at a depth of about 1,000 feet in the Des Moines well .occurs just below the base of the Devonian.
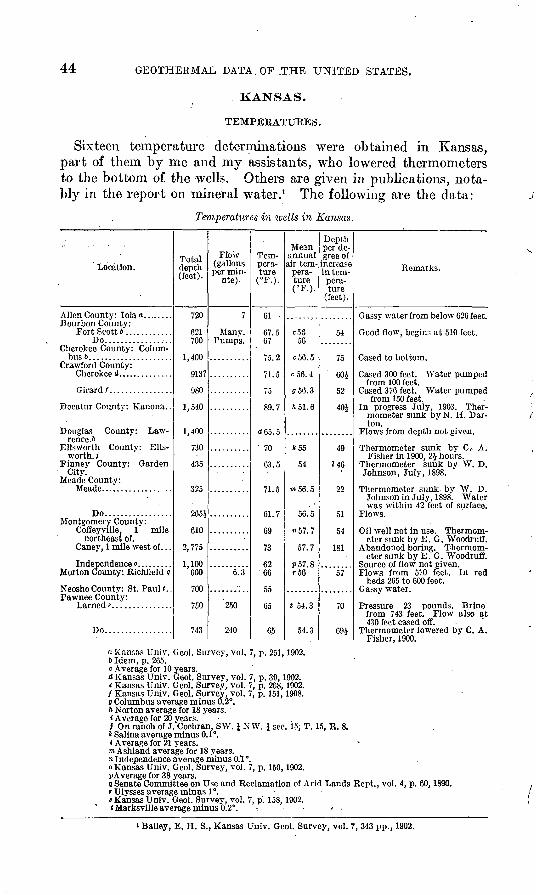
44 GEOTHERMAL DATA. OF .THE UNITED STATES.
KANSAS.
TEMPERATURES.
Sixteen temperature determinations were obtained in Kansas, part of them by me and my assistants, who lowered thermometers to the bottom of. the wells. Others are given in publications, nota bly in the report on mineral water. 1 The following are the data:
Temperatures in wells in Kansas.
Location!
Alien County: lola .........Bourbon County:
Fort Scott 6. ...........Do.................
Cherokee County: Colum-
Crawford County:
Decatur County: Kanona..
Douglas County: Lawrence, ft
Ellsworth County: Ells-worth. ;'
City. Meade County:
Do.................Montgomery County:
Cofieyville. 1 milenortheast of.
Caney, 1 mile west of. . .
Independence o. ........Morton County: Richfield g
Neosho County: St. Paul t. .Pawnee County:
Do.................
Total depth (feet).
720
621700
1,400
Q11?
980
1,540
1,400
730
435
OOK
265$
610
1.100600
700
750
743
Flow (gallons per min-
ate).
7
6.3
'250
240
Tem pera ture
(°F.).
61
67.567
75.2
71.5
89.7
70
63.5
71.5
61.7
fid
7%
6266
55
65
65
Mean annual air tem
pera ture (°F.)-.
56
c56.5
c56.4
556. 3
ft 51. 6
*55
=14
«57.7
57.7
r56
t 54.3
54.3
Depth per de gree of
increase in tem pera ture
(feet).
54
75
60|
eo
40£
49
J46
90
51
54
181
57
70
694
Remarks.
from 100 feet.
from 150 feet. In progress July. 1903. Ther
mometer sunk byN. H. Dar- ton.
Fisher in 1900, 2£ hours.
Johnson, July, 1898.
Johnson in July, 1898. Water was within 42 feet of surface.
eter sunk by E. G. Woodruff.
eter sunk by E. G. Woodruff.
Flows from 570 feet. In red beds 265 to 600 feet.
from 743 feet. Flow also at 430 feet cased off.
Fisher, 1900.a Kansas Univ. Geol. Survey, vol. 7, p. 251,1902.6Idem, p. 265.c Average for 10 years.d Kansas Univ. Geol. Survey, vol. 7, p. 39,1902.< Kansas Univ. Geol. Survey, vol. 7, p. 268,1902./ Kansas Univ. Geol. Survey, vol. 7, p. 151,1908.0 Columbus average minus 0.2°.ft Norton average for 18 years.t Average for 20 years.f On ranch of J. Cochran,.SW. i NW. J sec, 15, T. 15, R. 8.* Salina average minus 0.1°.t Average for 21 years.m Ashland average for 18 years.»Independence average minus 0.1 °.o Kansas Univ. Geol. Survey, vol. 7, p. 150,1902.^Average for 38 years.9 Senate Committee on Use and Reclamation of Arid Lands Rept., vol. 4, p. 60,1890.T Ulysses average minus 1°.« Kansas Univ. Geol. Survey, vol. 7, p. 158,1902.<Marksville average minus 0.2°. - / -
> Bailey, E. H. S., Kansas Univ. Geol. Survey, vol. 7, 343 pp., 1902.
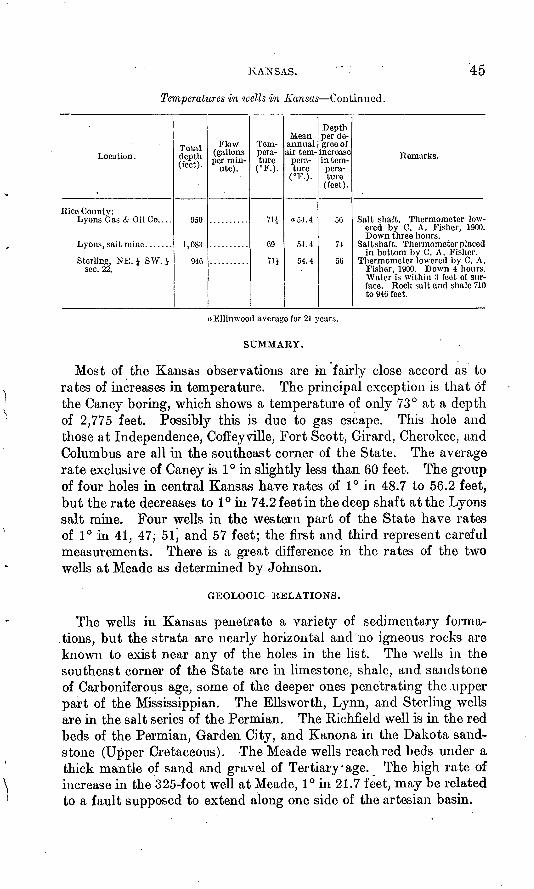
KANSAS.
Temperatures in wells in Kansas Continued.
45
Location .
Rice County:Lyons Gas & Oil Co. . . .
Lyons, salt mine .......
Sterling, NE. i SW. }sec. 22.
Total depth (feet).
950
1,083
94G
Flow (gallons per min
ute).
Tem pera ture
(°F.).
71J
69
711
Meanannual air tem
pera ture
(°F.).
o5-1.4
54.4
54.4
Depthper degree of
increase in tem perature
(feet).
56
74
56
Remarks.
Salt shaft. Thermometer lowered by C. A. Fisher, 1900.Down three hours.
Salt shaft. Thermometer placedin bottom by C. A. Fisher.
Thermometer lowered by C. A .Fisher, 1900. Down 4 hours.Water is within 3 feet of surface. Rock salt and shale 710to 946 feet.
« Kllinwood average for 21 years.
SUMMA11Y.
Most of the Kansas observations are in fairly close accord as to rates of increases in temperature. The principal exception is that of the Caney boring, which shows a temperature of only 73° at a depth of 2,775 feet. Possibly this is due to gas escape. This hole and those at Independence, Coffeyville, Fort Scott, Girard, Cherokee, and Columbus are all in the southeast corner of the State. The average rate exclusive of Caney is 1° in slightly less than 60 feet. The group of four holes in central Kansas have rates of 1° in 48.7 to 56.2 feet, but the rate decreases to 1° in 74.2 feet in the deep shaft at the Lyons salt mine. Four wells in the western part of the State have rates of 1° in 41, 47, 51 j and 57 feet; the first and third represent careful measurements. There is a great difference in the rates of the two wells at Meade as determined by Johnson.
GEOLOGIC RELATIONS.
The wells in Kansas penetrate a variety of sedimentary forma tions, but the strata are nearly horizontal and no igneous rocks are known to exist near any of the holes in the list. The wells in the southeast corner of the State are in limestone, shale, and sandstone of Carboniferous age, some of the deeper ones penetrating the .upper part of the Mississippian. The Ellsworth, Lynn, and Sterling wells are in the salt series of the Permian. The Richfield well is in the red beds of the Permian, Garden City, and Kanona in the Dakota sand stone (Upper Cretaceous). The Meade wells reach red beds under a thick mantle of sand and gravel of Tertiary'age. The high rate of increase in the 325-foot well at Meade, 1° in 21.7 feet, may be related to a fault supposed to extend along one side of the artesian basin.
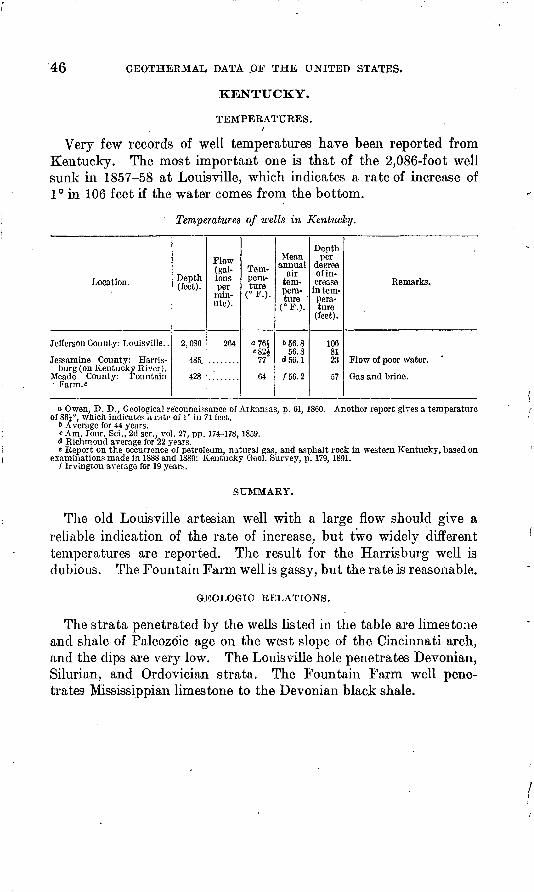
46 GEOTHERMAL DATA .OF THE UNITED STATES.
KENTUCKY.
TEMPERATURES./
Very few records of well temperatures have been reported from Kentucky. The most important one is that of the 2,086-foot well sunk in 1857-58 at Louisville, which indicates a rate of increase of 1° in 106 feet if the water comes from the bottom.
Temperatures of ivells in Kentucky.
Location.
Jefferson County: Louisville..
Jessamine County: Harris-burg (on Kentucky River).
Farm.*
Depth (feet).
2,086
485.
428
(gal lons per
utc).
264
Tem pera ture
t. * )
a76iC S2J
77
64
Meanannual
air tem perature '
(° F.).
656.856.8
£»56.1
/56.2
Depthper
degree of in crease in tem-pera-tu re
(feet).
1068123
57
Remarks.
Flow of poor water.
a Owen. D. D., Geological reconnaissance of Arkansas, p. 61, 1860. Another report gives a temperature of 86i°, which indicates a rate of 1° in 71 feet.
& Average for 44 years.c Am. Jour. Sci., 2d ser., vol. 27, pp. 174-178, 1859.d Richmond average for 22 years.« Report on the occurrence of petroleum, natural gas, and asphalt rock in western Kentucky, based on
examinations made in 1888 and 1889: Kentucky Geol. Survey, p. 179,1891./ Irvington average for 19 years.
SUMMARY.
The old Louisville artesian well with a large flow should give a reliable indication of the rate of increase, but two widely different temperatures are reported. The result for the Harrisburg well is dubious. The Fountain Farm well is gassy, but the rate is reasonable.
GEOLOGIC RELATIONS.
The strata penetrated by the wells listed in the table are limestone and shale of Paleozoic age on the west slope of the Cincinnati arch, and the dips are very low. The Louisville hole penetrates Devonian, Silurian, and Ordovician strata. The Fountain Farm well pene trates Mississippian limestone to the Devonian black shale.
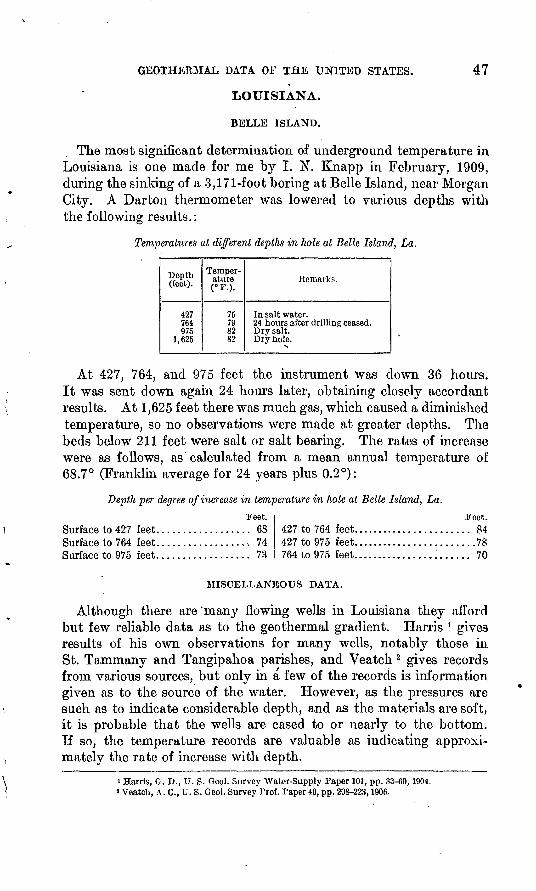
GEOTHERMAL DATA OF THE UNITED STATES. 47
LOUISIANA.
BELLE ISLAND.
The most significant determination of underground temperature in Louisiana is one made for me by I. N. Knapp in February, 1909, during the sinking of a 3,171-foot boring at Belle Island, near Morgan City. A Darton thermometer was lowered to various depths with the following results.:
Temperatures at different depths in hole at Belle Island, La.
Depth (feet).
427764 975
1,625
Temper ature (°F.).
7579 8282
Remarks.
In salt water.24 hours after drilling ceased. Dry salt.Dry hole.
s
At 427, 764, and 975 feet the instrument was down 36 hours. It was sent down again 24 hours later, obtaining closely accordant results. At 1,625 feet there was much gas, which caused a diminished temperature, so no observations were made at greater depths. The beds below 211 feet were salt or salt bearing. The rates of increase were as follows, as calculated from a mean annual temperature of 68.7° (Franklin average for 24 years plus 0.2°):
Depth per degree of increase in temperature in hole at Belle Island, La.Feet.
Surface to 427 feet.................. 68Surface to 764 feet.................. 74Surface to 975 feet.................. 73
Feet. 427 to 764 feet....................... 84427 to 975 feet........................ 78764 to 975 feet....................... 70
MISCELLANEOUS DATA.
Although there are vmany flowing wells in Louisiana they afford but few reliable data as to the geothermal gradient. Harris * gives results of his own observations for many wells, notably those in St. Tammany and Tangipahoa parishes, and Veatch 2 gives records from various sources, but only in a few of the records is information given as to the source of the water. However, as the pressures are such as to indicate considerable depth, and as the materials are soft, it is probable that the wells are cased to or nearly to the bottom. If so, the temperature records are valuable as indicating approxi mately the rate of increase with depth.
i Harris, G. D., U. S. Geol. Survey Water-Supply Paper 101, pp. 33-60,1904. » Veatch, A. C. f U. S. Geol. Survey Prof. Paper 46, pp. 208-223,1906.

48 GEOTHERMAL DATA .OF THE UNITED STATES.
Temperatures in wells in Louisiana.
Location.
Caddo Parish : Shreveport. . . . Calcasieu Parish: Welsh. ....Catahoula Parish: Leland.... Orleans Parish:
New Orleans.............New Orleans, 1 mile west
Of. : Ouachita Parish: Monroe. . . .
St. Tammany Parish: Covington:
Dummet. ............Dixon Academy .....
Courthouse, 1901 .....
H.Hallen............Hernandez. 2 miles north
of. Hernandez...............
Do...........:...:.:.Do.....:.............
Mandeville. ..............Do...................
Chiuchuba ...............Sabine Parish: Negreet. .....Tangipahoa Parish:
Ponchatoula, 3 miles north of.
Do...................Do...................Do...................Do...................Do...................Do...................
Hammond: 1} miles south-south
west of. Do.....---.......
1 J miles south of ...... $ mile southeast of ....
Do...............
1$ miles south-south east of.
Vermillion Parish: Gueydan, 3 miles southwest of.
Winn Parish: Drake Salt Works.
Depth (feet).
996 190
1,550
1,229
«900 385
1,500
572
600520610
610480545V74
526217247325630
232170
272225330265265377300id(\
212
140309 318 302
'380235298
190
»1,011
Flow (gal lons per min ute).
Many. 1,200
10.
55
12 Many.
10
20
30
20 <n38
401654275628
30
310
209).
247
282425
8
330 45 24
. 15
5J
8
18
Tem pera ture
( P.).
84.0 71.586.5
81.5
79 71 70
7472.670
71*
79 d" 74
79
73
72J72}? }7074fiQ ^
717270
7169.5
?fl ^7071.57171717179
69
fid72 70.5 70.570.66970J-
73
75
Mean annual
air tem pera ture
(° P.).
«65. 1 667.4c66.8
d68.2
68.2 /65.6 S 64.8
ft 66. 866.8
66.866.866.866.866.8
66.866.866.866.866.8
<676767
;65.4
67
, 676767676767 .67
67'
6767 67 676767
-67
m 68.3
066.
Depth per
degree of in crease in tem pera ture
(feet).
53 4678
92
S3 71
80
101
83
10098
11107
88937387ft9
65137
5870
8075? <6666
.947568
106
7062 91 86
106
80
40
123
Remarks.
Brine with gas.
Do.
Do.
Flows at 241. to 281 and 998 to1,275 feet; probably mingle.
From 630 feet, but possiblyhigher flows mingle.
Brine from Cretaceous.
» Average for 45 years.& Lake Charles average.« Natchez, Miss., average for 29 years.< Average for 45 years at Station 1.« Cased to bottom.
/ Monroe average for 28 years. o Grand Cane average for 22 years. ft Average for 24 years.* Covington average plus 0.2°./ Average at Nacodoches, Tex.fc Hammond average for 24 years.I Water from 340 to 380 feet.«»Abbeville average.» Veatch, A. E., Louisiana Geol. Survey Kept. lor 1902, pp. 51-64,1903.oMean at Dodson, 1910.
MARYLAND. 49
Water from pumped wells 197 to 315 feet deep in Bossier Parish is reported to have temperatures from 64° to 66°; from a 225-foot well at Belcher, in Caddo Parish, 66°; from wells 137 to 280 feet deep at Shreveport, 66° to 68°; and from severalwells 115 to 368 feet deep in Webster Parish, 65° to 66 0 . 1 All these figures are so near the mean annual air temperature that they throw no light on the rate of increase.
SUMMARY.
None of the rates of the deeper wells given in the list are close approximations. In the Frierson and Negreet wells probably the mingling of flows gives a lower temperature than the water from the lower flow would show. The wells of Tangipahoa Parish are too shallow to be reliable within close limits, but they give an average rate of 1 ° in very nearly 80 feet.
GEOLOGIC RELATIONS.
All the wells in Louisiana are in the great Coastal Plain sedimen tary series of the Mississippi embayment, but several horizons are tapped. The strata are sands, clays, and limestones of Cretaceous and Tertiary age, dipping at low angles in various directions. In northern Louisiana there is a general dip to the east into a basin whose bottom is near Vicksburg, Miss., at a rate of generally from 7 to 10 feet to the mile, with few local variations, some of which are due to sharp local uplifts. This basin widens and deepens to the south and becomes a deep, wide trough containing a great thickness of Tertiary strata. The briny waters of the Shreveport well come from the Nacatoch sand in the Upper Cretaceous, and the brine at the Drake salt works is also from the Cretaceous.. Brine from the Leland well is believed to be from the Eocene Yegua ("Cockfield") formation, 1,500 feet higher. The beds tapped by the shallow wells of Calcasieu, St. Tammany, and Tangipahoa parishes are high in the Tertiary.
MARYLAND.
Only one well temperature was obtained from Maryland that of the 140-galJon flow of saline water from the deep well at Crisfield, Somerset County, on the eastern peninsula. The flow comes from a depth of 1,025,feet in the Potomac group, and the temperature, 79°, was determined by Mr. John Buxton with a reliable thermometer sent to him for the purpose. As the mean annual temperature at Pocomoke City, not far away, is 57.4°, this determination indicates a rate of increase of 1° in 47.4 feet.
i Veatch, A. C., U. S. Geol. Survey Prof. Paper 46, pp. 201-207, 217-223,1906. 137163° 20 Bull. 701 4
50 GEOTHERMAL DATA OF THE UNITED STATES.
MICHIGAN.
SOURCES OF INFORMATION.
Temperature observations that have been made in deep borings and deep mines in Michigan throw important light on the rate of increase in temperature underground. Some of these have been made by A. C. Lane, 1 in part with thermometers which I furnished. On account of the differences in the geology of the two areas it is best to present the results of observations made in southern and central Michigan separately from those of observations made in the area of older rocks in the northern peninsula. Lane has considered the probable mean annual temperature of the northern peninsula and also gives temperatures in shallow borings and in upper levels in cer tain copper mines.
NORTHERN PENINSULA.
Many determinations of underground temperature are available for the northern part of Michigan, mainly in connection with the deep mines.
. In 1895 Alexander Agassiz 2 reported the results of a series of observations made in copper mines of the Calumet & Hecla Co. on Keweenaw Point. This point, which extends 70 miles out into Lake Superior, consists of a series of old igneous and sedimentary rocks dipping 7°-55° and overlain by Cambrian sandstone. The mines are mostly in the older series. The temperatures were taken at inter vals, but only those at 105 feet and 4,580 feet were published. Ne- gretti and Zambra thermometers were used, placed in 10-foot holes, slightly inclined upward, and left from one to three months, the holes plugged with woqd and clay. The results were 59° and 79°, a differ ence of only 20° for the 4,475 feet, or an increase of 1° in 223.7 feet. However, if the 59° observation is disregarded and the increase to 4,580 feet calculated from a mean annual air temperature of 43° 3 the result is 1° in 127 feet, which is borne out by other observations. It is evident that the reading of 59° at 105 feet was defective, because it is 16° to 20° higher than the mean annual air temperature.
In a letter to J. D. Everett in 1896, 4 Agassiz stated that further ob servations had shown that the rate was "different from what it was believed to be when the preliminary announcement was made."
1 Lane, A. C., The Keweenaw series of Michigan: Michigan Geol. and Biol. Survey Pub. 6, vol. 2, pp. 757-773,1911; Am. Jour. Sci., 4th ser., vol. 9, p. 435, 1900.
2 Agassiz, Alexander, On underground temperatures at great depth: Am. Jour. Sci., 3d ser., vol. 50, pp. 503-504, 1895.
3 The mean annual air temperature at Calumet is 39.7° (29-year average), but shallow-water and mine workings indicate several degrees higher, according to Lane.
< Underground temperatures: British Assoc. Adv. Sci., Report of 71st meeting, p. 65, 1901.
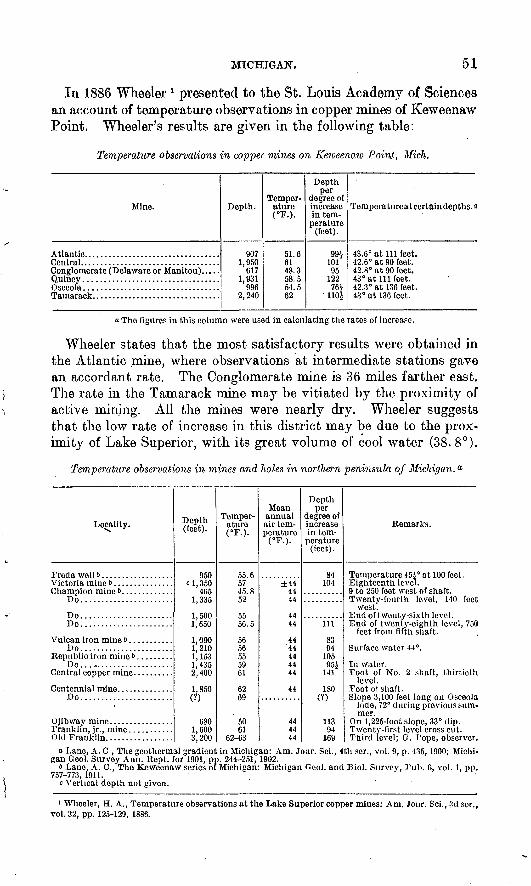
MICHIGAN. 51
In 1886 Wheeler 1 presented to the St. Louis Academy of Sciences an account of temperature observations in copper mines of Keweenaw Point. Wheeler's results are given in the following table:
Temperature observations in copper mines on Keiueenaw Poinf,, Midi.
Mine.
Conglomerate (Delaware or Manitou).
Depth.
9071.950
617 1,931
9962,240
Temperature(°F.).
51.66148.3 58.554.562
Depthper
degree ofincreasein temperature
(feet).
99$10195
12276.V
IIOJ-
Temperatureatcertaindepths.o
43.6° at 111 feet.42.6° at 90 feet.42.8° at 90 feet. 43° at 111 feet.42.3° at 130 feet.43° at 136 feet.
o The figures in this column were used in calculating the rates of increase.
Wheeler states that the most satisfactory results were obtained in the Atlantic mine, where observations at intermediate stations gave an accordant rate. The Conglomerate mine is 36 miles farther east. The rate in the Tamarack mine may be vitiated by the proximity of active mining. All the mines were nearly dry. Wheeler suggests that the low rate of increase in this district may be due to the prox imity of Lake Superior, with its great volume of cool water (38. 8°).
Temperature observations in mines and holes in northern peninsula of Michigan. a
Locality.>v
Do.......................
Do.......................Do.......................
Do.......................
Do..... ..................
Do.......................
Old Franklin. ................
Depth(feet).
nrn
c 1,3504«c
1,335
1,650
1,0901,2101,1531, 4352,400
1.850&
6801,6003.200
Temper ature(°F.).
55.65745.8V)
Cp. K
56
555961
6269
5061
62-63
Moanannual air temperature
( F.).
±44
44
444444
44
444444
Depthper
degree of increasein temperature
(feet).
84104
111
8394
10595i
141
180(?)
94169
Remarks.
Eighteenth level.
west.
feet from fifth shaft.
level.
lode, 72° during previous summer.
Third level: G. Pone, observer.o Lane, A. C., The geothermal gradient in Michigan: Am. Jour. Sci., 4th ser., vol. 9, p. 435,1900; Michi
gan Geol. Survey Ann. Kept, for 1901, pp. 244-251, 1902.6 Lane, A. C., The Keweenaw series of Michigan: Michigan Geol. and Biol. Survey. Pub. 6, vol. 1. pp.
757-773, 1911.c Vertical depth not given.
1 Wheeler, H. A., Temperature observations at the Lake Superior copper mines: Am. Jour. Sci., 3d ser., vol. 32, pp. 125-129, 1886.
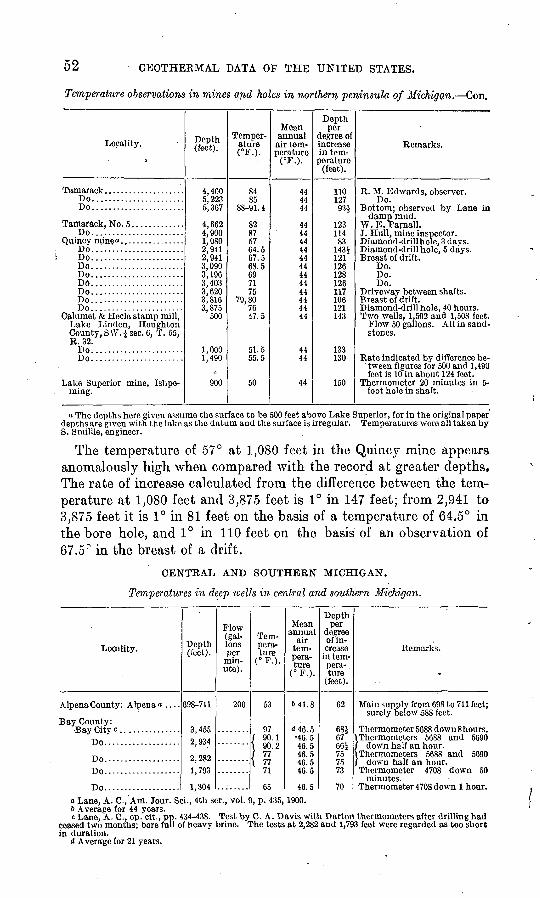
52 GEOTHERMAL DATA OF THE UNITED STATES.
Temperature observations in mines and holes in northern peninsula of Michigan. Con.
Locality.
Do.......................Do.......................
Do.......................
Do.......................Do.......................Do.......................Do.......................Dd.......................Do.......................Do.......................Do.......................
Calumet & Hecla stamp mill, Lake Linden, Houghton County, S W. i sec. 6, T. 55, R. 32.
Do.......................Do.......................
Lake Superior mine, Ishpe- rning.
Depth (feet).
4,4005 OOO
5,367
4,6624 onn1,0802,9412,9413,0903,1963,4033,6203,8163,875
500
1,0001,490
900
Temper ature (°F.).
QA
QX
88-91. 4
8987
5764.567.568.5697175
79,807647.5
51.555.5
50
Mean annual air tem perature
(°F.).
444444
444444
4444444444444444
4444
44
Depth per
degree of increase in tem
perature (feet).
110
Q3X
11400
143-|
126
126117106121143
133130
150
Remarks.
Do.
damp mud. W.E.Tarnall.
Do.Do.Do.
Two wells, 1.502 and 1,508 feet. Flow 50 gallons. All in sand stones.
tween figures for 500 and 1,490 feet is 10 in about 124 feet.
Thermometer 20 minutes in 5- foot hole in shaft.
a The depths here given assume the surface to be 500 feet above Lake Superior, for in the original paper depths are given with the lake as the datum and the surface is irregular. Temperatures were all taken by S. Smillie, engineer.
The temperature of 57° at 1,080 feet in the Quincy mine appears anomalously high when compared with the record at greater depths. The rate of increase calculated from the difference between the tem perature at 1,080 feet and 3,875 feet is 1° in 147 feet; from 2,941 to 3,875 feet it is 1° in 81 feet on the basis of a temperature of 64.5° in the bore hole, and 1° in 110 feet on the basis of an observation of 67.5 n in the breast of a drift.
CENTRAL AND SOUTHERN MICHIGAN.
Temperatures in deep wells in central and southern Michigan.
Locality.
Alpena County: Alpena« ....
Bay County: BayCityc.. .............
Do...................
Do...................Do...................
Do...................
Depth (feet).
698-711
3,4552,934
9i, loi
1,793
1,304
Flow(gal lons per
minute).
200
Tem pera ture
53
97/ 90.1 \ 90.2/ 77\ 77
71
65
Meanannual an te m- pera-ture
641.8
d 46. 5 46.5 46.546.546.546.5
46.5
Depthper
degree of in crease
in tempera- . ture
(feet).
62
68J6775*
7573
70
Remarks.
^
Main supply from 698 to 711 feet; surely below 588 feet.
Thermometer 5688 downShours.^Thermometers 5688 and 5690 / down half an hour.\Thermomcters 5688 and 5690/ down half an hour.Thermometer 4708 down 50
minutes.Thermometer 4708 down 1 hour.
a Lane, A. C., Am. Jour.b Average for 44 years.c Lane, A. C., op. cit., pi
ceased two months; bore ml in duration.
d Average for 21 years.
Sci., 4th ser., vol. 9, p. 435,1900.
i . 434-438. Test by C. A. Davis with Darton thermometers after drilling had of heavy brine. The tests at 2,282 and 1,793 feet were regarded as too short
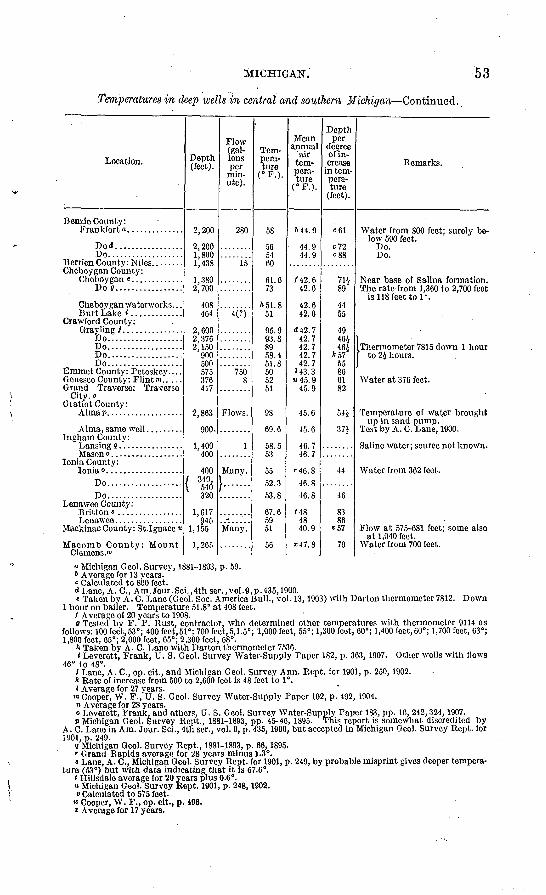
MICHIGAN. 53
Temperatures in deep wells in central and southern Michigan Continued..
Location.
Bemie County:
Do*. ................Do...................
Cheboygan County:
Do g..^.. ............
Crawford County: Grayling/...............
Do................... Do...................Do...................Do...................
Emmet County: Petoskey. . . . Gcnesoe County: Flint"*.. . . .
City, o Giatiot County:
Ingham County:
Ionia County:
Do...................Do...................
Lenaweo County: Britton* ................
Mackinac County: St.Ignace «
demons."'
Depth (feet).
2,200
2 200
1,438
1 ISO
2,700
408464
2,600 2,376 2,150
onn500575 376417
2,863
900.
1 400'400
400/ 340,I 540
320
1,617 945
1,155
1, 265
Flow (gal lons per
min ute).
OCA
15
4(?)
7508
Flows.
1
Many.
Tem pera ture
( F.).
nQ
^fi54CO
61.673
A 51. 851
95.9 93.8 8958.451.850 52 51
98
69.6
11
52.353.8
67.6CO
51
56
Mean annual
air tem pera ture
(°F.).
644.9
44 944 9
/42.042.6
42.642.6
d42.7 42.7A 1) 7
42.742.7
'43.3 » 45. 9
45.9
A*, fi
46.746.7
r46.846.846.8
t48 4840.9
Z47.8
Depth per
degree of in crease
in tem pera ture
(feet).
cei
r 79
c88
71J89
4455
49 46i 46>i
*575586 6182
071
44
46
83 86
»57
79
Remarks.
low 590 feet. Do.Do.
The rate from 1,360 to 2,700 feet is 118 feet to 1°.
Water at 376 feet.
up in sand pump. Test by A. C. Lane, 1900.
Flow at 575-681 feet; some also at 1,040 feet.
Water from 700 feet.
« Michigan Geol. Survey, 1881-1893, p. 59.6 Average for 13 years.« Calculated to 800 feet.d Lane, A. C., Am.Jour.Sci.,4th ser.,vol.9,p.435,1900.t Taken by A. C. Lane (Geol. Soc. America Bull., vol. 13,1903) with Darton thermometer 7812. Down
1 hour on bailer. Temperature 51.8° at 408 feet./ Average of 20 years to 1908.o Tested by F. P. Rust, contractor, who determined other temperatures with thermometer 9114 as
follows: 100 feet,53°; 400 feet,51°; 700 feet,5,1.5°; 1,000 feet, 55°; 1,300 feet, 60°; 1,400 feet, 60°; 1,700 feet, 63°; 1,800 feet, 65°; 2,000 feet, 65°; 2,300 feet, 68°.
ft Taken by A. C. Lane with Darton thermometer 7536.< Leverett, Frank, U. S. Geol. Survey Water-Supply Paper 182, p. 363, 1907. Other wells with flows
46° to 48°.i Lane, A. C., op. cit., and Michigan Geol. Survey Ann. Rept. for 1901, p. 250,1902.* Rate of increase from 500 to 2,600 feet is 48 feet to 1°.J Average for 27 years.
m Cooper, W. F., U. S. Geol. Survey Water-Supply Paper 102, p. 492,1904.» Average for 28 years.o Loverett, Frank, and others, U. S. Geol. Survey Water-Supply Paper 183, pp. 16, 242,324,1907.P Michigan Geol. Survey Rept., 1881-1893, pp. 45-46, 1895. This report is somewhat discredited by
A. C. Lane in Am. Jour. Sci., 4th ser., vol. 9, p. 435,1900, but accepted in Michigan Geol. Survey Rept. for 1901, p. 249.
i Michigan Geol. Survey Rept., 1881-1R93, p. 66,1895." Grand Rapids average for 28 years minus 1.3°.> Lane, A. C., Michigan Geol. Survey Rept. for 1901, p. 249, by probable misprint gives deeper tempera
ture (53°) but with data indicating that it is 67.6°.' Hillsdale average for 20 years plus 0.6°.« Michigan Geol. Survey Kept. 1901, p. 248,1902.» Calculated to 575 feet.
«> Cooper, W. F., op. cit., p. 498.* Average for 17 years.
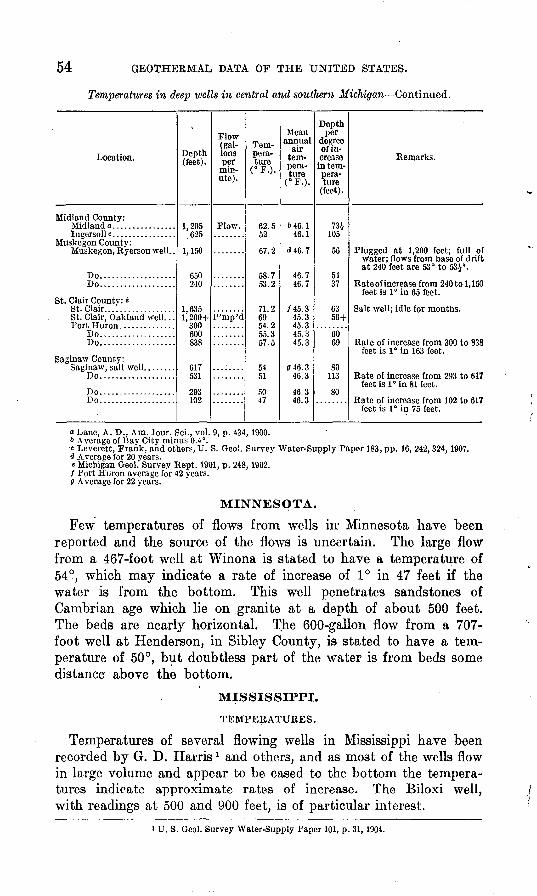
54 GEOTHERMAL DATA OF THE UNITED STATES.
Temperatures in deep wells in central and southern Michigan Continued.
Location.
Midland County:
Muskegon County:Muskegon, Kyerson well. .
Do...................Do...................
St. Glair Count v: <St. Glair.. ................St. Clair, Oakland well. . -
Do...................Do...................
Saginaw County:
Do...................
Do...................Do...................
Depth (feet).
1,205
1,150
fi*>0240
1,6351. 200+
300
838
617
OAO
102
(gal lons per
P'mp'd
Tem pera ture
( * )
62.552
67.2
5S 7(TO 2
n o
69W 9
57 5
C4
51
5047
Meanannual
air tem perature
<°F.).
646.146.1
d46.7
46.746.7
/45.345.345.3
45.3
?46.346.3
AR Q
46.3
Depthper
degree of in crease in temperature
(feet).
701105
56
5437
6356+
6069
80113
80
Remarks.
Plugged at 1,200 feet; full of water; flows from base of driftat 240 feet are 53° to 53i°.
feet is 1° in 65 feet.
feet is 1° in 163 feet.
feet is 1° in 81 feet.
feet is 1° in 75 feet.
a Lane, A. D., Am. Jour. Sci., vol. 9, p. 434,1900.b Average of Bay City minus 0.4°.c Leverett, Frank, and others, U. S. Geol. Survey Water-Supply Paper 183, pp. 16, 242,324,1907.<J Average lor 20 years.e Michigan Geol. Survey Kept. 1901, p. 248,1902./ Port Huron average for 42 years.a Average for 22 years.
MINNESOTA.
Few temperatures of flows from wells hr Minnesota have been reported and the source of the flows is uncertain. The large flow from a 467-foot well at Winona is stated to have a temperature of 54°, which may indicate a rate of increase of 1° in 47 feet if the water is from the bottom. This well penetrates sandstones of Cambrian age which lie on granite at a depth of about 500 feet. The beds are nearly horizontal. The 600-gallon flow from a 707- foot well at Henderson, in Sibley County, is stated to have a tem perature of 50°, but doubtless part of the water is from beds some distance above the bottom.
MISSISSIPPI.
TEMPERATURES.
Temperatures of several flowing wells in Mississippi have been recorded by G. D. Harris l and others, and as most of the wells flow in large volume and appear to be cased to the bottom the tempera tures indicate approximate rates of increase. The Biloxi well, with readings at 500 and 900 feet, is of particular interest.
U. S. Geol. Survey Water-Supply Paper 101, p. 31,1904.
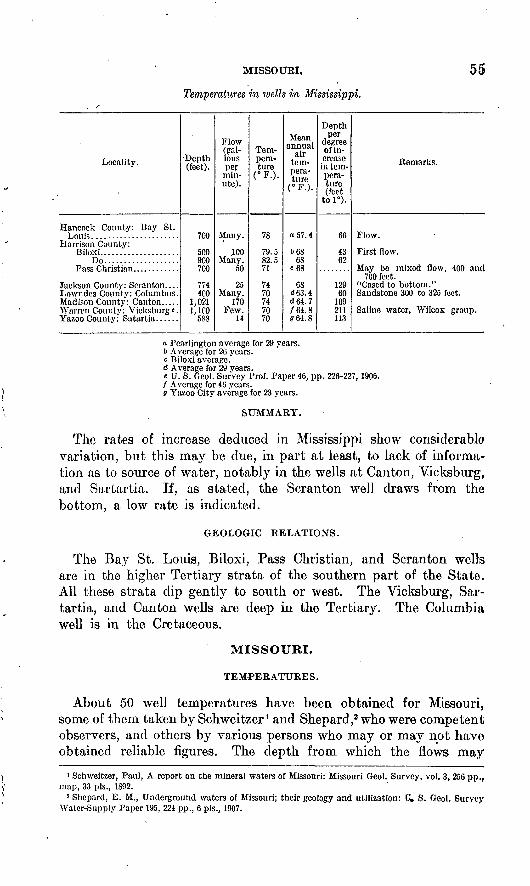
MISSOURI.
Temperatures in wells in Mississippi.
55
Locality.
Hancock County: Bay St.Louis........-...-..--..-.-
Harrison County:Biloxi....................
Do...................Pass Christian. ...........
Jackson County: Scranton....Lowndes County: Columbus.Madison County: Canton.....Warren County: Vicksburg e. Yazoo County: Satartia. .....
Depth (feet).
700
500900700
774400
1,0211,100
CQQOoo
Flow (gallons perminute).
Many.
JOOMany.
50
25Many.
170Few.
14
Tempera ture
(°F.).
78
79.582.571
74707470 70
Meanannual
airtill
tempera ture
(° F.).
a 57. 4
66868
c68
68d63.4d64.7764.8 064.8
Depthper
uegreo of increase in temperature (feet
to 1°).
66
4362
12960
109211
Remarks.
Flow.
First flow.
May be mixed flow, 400 ami700 feet.
"Cased to bottom ."Sandstone 300 to 325 feet.
Saline water, Wilcox group.
a Pearlington average for 29 years.6 Average for 26 years.c Biloxi average.d Average for 29 years.e U. S. Geol. Survey Prof. Taper 46, pp. 226-227,1906./ Average for 46 years.g Yazoo City average for 23 years.
SUMMARY.
The rates of increase deduced in Mississippi show considerable variation, but this may be due, in part at least, to lack of informa tion as to source of water, notably in the wells at Canton, Vicksburg, and Sartartia. If, as stated, the Scranton well draws from the bottom, a low rate is indicated.
GEOLOGIC RELATIONS.
The Bay St. Louis, Biloxi, Pass Christian, and Scranton wells are in the higher Tertiary strata of the southern part of the State. All these strata dip gently to south or west. The Vicksburg, Sar tartia, and Canton wells are deep in the Tertiary. The Columbia well is in the Cretaceous.
MISSOURI.
TEMPERATURES.
About 50 well temperatures have been obtained for Missouri, some of them taken by Schweitzer 1 and Shepard,2 who were competent observers, and others by various persons who may or may not have obtained reliable figures. The depth from which the flows may
' Schweitzer, Paul, A report on the mineral waters of Missouri: Missouri Geol. Survey, vol. 3, 256 pp., map, 33 pis., 1892.
2 Shepard, E. M., Underground waters of Missouri; their geology and utilization: Ci, S. Geol. Survey Water-Supply Paper 195, 224 pp., 6 pis., 1907.
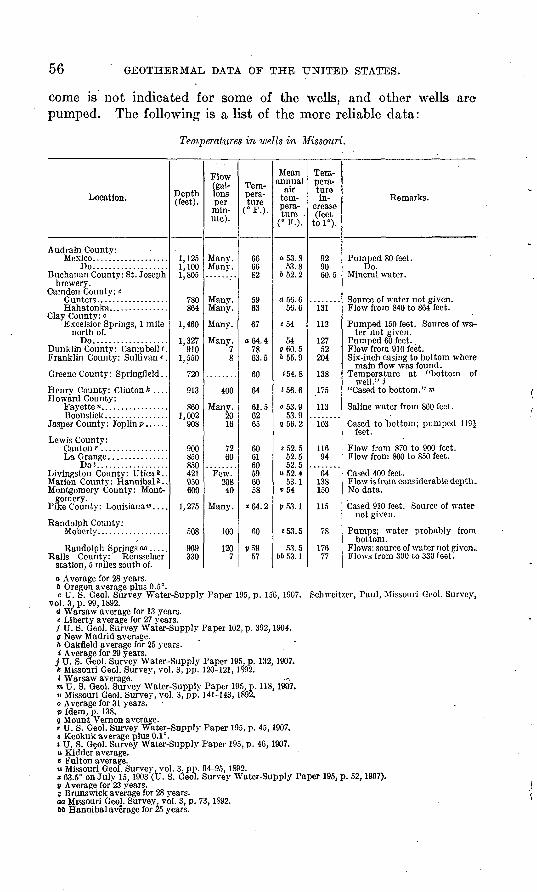
56 GEOTHEEMAL DATA OF THE UNITED STATES.
come is not indicated for some of the wells, and other wells are pumped. The following is a list of the more reliable data:
Temperatures in wells in Missouri.
Location.
Audrain County:
Do...................
brewery. Cam den County: c
Clay County: c Excelsior Springs, 1 mile
north of. Do...................
Dunklin County: Campbell/. Franklin County: Sullivan c.
Henry County: Clinton fc . . . . Howard County:
Lewis County:
Livingston County: Uticafc.. Marion County: Hannibal*-. Montgomery County: Mont
gomery. Pike County : Louisiana w . . . .
Randolph County:
Randolph Springs ao ..... Rails County: Rensselaer
station, 5 miles south of.
Depth (feet).
1,1251,1001,805
780864
1,460
1,327910
1,550
720
913
8601,002
908
900850ocn
421 950 600
1,275
.508
969 330
Flow (gal lons per
min ute).
Many.
78
400
2016
7260
Few. 208 40
Many,
inn
1207
Tem pera ture
(°F.).
666682
<;Q63
67
o64.478 63.5
60
64
61.56265
60616059 6058
*64.2
fin
!/59 57
Mean annual
air tem pera ture
(°F.).
o53.853.8
652.2
d56.656.6
«54
54060.5 ft 55. 9
»54.8
J56.6
o53.953.9
356.2
*52.552.552.5
"52.4 53.1
054
V 53. 1
*53.5
53.5 bb 53. 1
Tem pera ture in
crease (feet
to 1°).
92on60.5
112
12752
204
138
175
113
103
11694
64 138 150
115
78
17677
Remarks.
Do.
Pumped 150 feet. Source of wa ter not given.
Flow from 910 feet. Six-inch casing to bottom where
main flow was found.
well." i "Cased to bottom." m
Cased to "bottom; pumped 119ifeet.
Flow from 870 to 900 feet.Flow from 800 to 850 feet.
Cased 400 feet. Flow is from considerable depth. No data.
Cased 910 feet. Source of water- not given.
bottom. Flows; source of water not given.. Flows from 300 to 330 feet.
a Average for 28 years. b Oregon average plus 0.5°.c U. S. Geol. Survey Water-Supply Paper 195, p. 156, 1907.
vol. 3, p. 99,1892. d Warsaw average for 13 years. e Liberty average for 27 years./ U. S. Geol. Survey Water-Supply Paper 102, p. 392,1904. g New Madrid average, ft Oakfleld average for 25 years. i Average for 29 years.j U. S. Geol. Survey Water-Supply Paper 195, p. 132,1907. * Missouri Geol. Survey, vol. 3, pp. 120-121,1892. i Warsaw average. ^ ro U. S. Geol. Survey Water-Supply Paper 195, p. 118,1907. n Missouri Geol. Survey, vol. 3, pp. 141-143,1892. o Average for 31 years. P Idem, p. 138. q Mount Vernon average.r U. S. Geol. Survey Water-Supply Paper 195, p. 45,1907. s Keokuk average plus 0.1°.t U. S. Ge.ol. Survey Water-Supply Paper 195, p. 46,1907. « Kidder average.
Fulton average.
Schweitzer, Paul, Missouri Geol. Survey,.
to Missouri Geol. Survey, vol. 3, pp. 94-95,1892.x 63.5° on July 15,1903 (U. S. Geol. Survey Water-Supply Paper 195, p. 52,1907).V Average for 23 years.z Brunswick average for 28 years.oo Missouri Geol. Survey, vol. 3, p. 73,1892.66 Hannibal average for 25 years.

MISSOURI.
Temperature in ivellsin Missouri Continued.
57
Location.
St. Louis County:St. Louis:
Asylum..............Belcher well <=........
Do/. ............
Union Power Co .....North St. Louis......
Vernon County :aNevada, near.............Nevada ..................Richards. ................
Depth (feet).
3,843i2,200"
1,5901,470
735
800/ 8691 1,001
650
Flow(gallons per
minute).
"""75"
Many.Manv.
60
120/Many.
Few.
Tempera ture
al0573.4
6970
636762
Meanannual
air temperature
6 55. 8<*55.8
55.855.855.8
A 555555
Temperature in
crease(feej;
7S.1«S5.3
102103118
100
93
Remarks.
Granite, etc., 3,558 to 3,843 feet.Water from 1,515 feet; much
H2S; water-bearing sandstonefrom 1,502 to 1,640 feet.
Water from 1,351 feet.Water pumped 70 feet.Water pumped 45 feet. Source
of water not given.
Flow from below 785 feet./Flow from below 785 feet; pump- \ ed 78 feet.Gtissy.
a Broadhead. G. C. (St. Loin's Acad. Sci. Trans., vol. 3, p. 216, 1878), who used a registering thermora eter and gave temperatures of 106° at 3,127 feet; 107° at 3,129 feet; 106° at 3,264 feet; 1053 at 3,473 feet; 105°. 4 o POO f«~4.. irvrO «j. o m\A *««4-. M\AfO n * O fi A 1 fn^t> TAClO rt 4- Q 7OQ fn.n+ rtTi/1 ins° of 9. CHfl fn/\*- r\Kc?nr^rnfl iirtfKat 3,533 feet; 105° at 3,604 feet; 104J° at 3,641 feet; 105J° at 3,728 feet; and 105° at 3,800 feet, observed with thermometer reading to one-fifth of 1°. .
6 Average for 44 years.c Litten, A., Belcher & Bros, artesian well (St. Louis Acad. Sci. Trans., vol. 1, pp. 80-86, 1856-1860). .
Another authority gives 2.199 feet (U. S. Geol. Survey Water-Supply Paper 195, p. 159, 1907).d Litten gives 55.22° as deduced from observations by Engleman for 22 years, indicating a gradient of
1° to 83.3 feet.e Calculated to a depth of 1,502 feet./ Am. Jour. Sci., 2d ser., vol. 15, p. 460,1853.o U. S. Geol. Survey Water-Supply Paper 195, p. 104,1907.ft Average for 22 years.
SUMMARY.
The data from the Missouri wells listed above appear to indicate considerable diversity in gradient, but doubtless some of this diversity is due to error, especially as to source .of water. The tests by Broadhead and Litten in the deep wells of St. Louis are most valu able, giving mean rates of increase of 1° in about 78 and 85 feet. The apparent decrease of 2° from 3,127 to 3,843 feet and some other inconsistent variations are difficult to explain. Some of the shal lower wells appear to indicate a diminishing rate toward the surface, but uncertainty as to source of flow and influence of pumping may affect the observations. The Clinton well, which is said to.be cased to the bottom, indicates the surprisingly low rate of 1° in 175 feet, and the Sullivan well shows a .rate of 1° in 153 feet. The rates indicated for the Springfield well, 1° in 138 feet; the Canton well, 1° in 132 feet; the Hahatonka well, 1° in 131 feet; and the Fayette well, 1° in 113 feet, are valid if, as is reported, all these wells are cased to or nearly to the bottom. The data from Mexico, Excelsior Springs, Hannibal, Louisiana, Montgomery, Moberly, and Randolph Springs may be defective. The relatively high rates of 1° in 52 feet indicated by the Campbell well and 1° in 53 feet by the Utica well
58 GEOTHERMAL DATA OF THE UNITED STATES.
are exceptional but almost surely correct. The rate indicated by the St. Joseph brewery well, l°.in 60£ feet, is also regarded as reliable, although the source of the water is not given precisely.
GEOLOGIC EELATIONS.
The southeastern third of Missouri consists of a low dome hi the center of which the pre-Cambrian granites and other rocks are exposed in the Iron Mountain region. West of this dome, the strata dip west, and north of it they slope gently to the north and north west. At Kansas City and northward the pre-Cambrian rocks are far below the surface. The wells included in the above list pene trate a great variety of strata, all on the north or west slopes of the dome. The 3,843-foot hole at St. Louis is the only one that reached the granite, but its water supply is derived from sandstones of Ordovician age. The wells at Moberly, Hannibal, Canton, Lagrange, Louisiana, Rensselaer, Gunters, Hahatonka, Fayette, Sullivan, Montgomery, Springfield, Nevada, and Richards all draw from sandstones in the Ordovician or Cambrian. The deep well near St. Joseph entered Mississippian limestones at 1,250 feet and pos sibly reached the St. Peter sandstone. The deep borings of Excel sior Springs are believed to draw their mineralized waters from the "Jefferson City limestone and base of the Pennsylvanian." 1 The well at Campbell, in the southeast corner of the State, penetrates a thick deposit of clay of the Lagrange formation (Tertiary) and draws from the sand of the upper part of the Ripley formation (Cretaceous). The well at Utica draws water from the base of the Cherokee shale (Pennsylvanian).
There is no evidence that the variations in rate of increase in temperature are related to the horizons from which the waters are derived, to structural features, or to proximity to the pre-Cambrian rocks, with the possible exception of the high rate at the Campbell well, which is in the Tertiary and Cretaceous. The St. Joseph and Utica wells which show high rates are higher in the Paleozoic succes sion than the wells farther east and south.
MONTANA.
ANACONDA MINE.
In 1899 H. V. Winchell made a series of observations in the Ana conda mine, near Butte. He placed Darton thermometers in drill holes at various depths and left them for several days. The follow ing, results were obtained:
i Shepard, E. M., op. cit., p. 58.

MONTANA. 59
Temperature at different depths in the Anaconda mine, near Butte, Mont.
200-foot level... ..........................................................
800-foot level .............................................................
Altitude (feet).
5,8775,6735.4715,2715,0814,477
Temper ature ( F.).
45.849.551.469.862.074.3
Depthper
degree of increase in temperature(feet).o
53.053. 063.828.850.049.2
o Based on mean annual air temperature of 42°, average for 21 years at Butte.
The reading at a depth of 800 feet is abnormally high, probably on account of some local, condition. The rates of increase indicated between various depths are as follows: 200 to 1,600 feet, 1° in 49.8 feet; 400 to 1,000 feet, 1° in 48.2 feet; 400 to 1,600 feet, 1° in 48.5 feet; 600 to 1,600 feet, 1° in 43.6 feet; 1,000 to 1,600 feet, 1° in 48.8 feet. S. F. Emmons made an additional observation in the Gagnon mine 1,550 feet below the surface. The Darton thermometer was placed in a 3-foot drill hole and read 79° after 48 hours and 79^° after 7 days. As the mean annual temperature here is 42° the rate indicated is l°in 41.7 feet. This mine is the nearest one to the latest rhyolite eruption.
MILES CITY.
The flow from a 456-foot well in Miles City, Ouster County, is reported l to have a temperature of 57°. Its volume is 5 gallons a minute and its pressure 7 pounds. Flows were also found at 300 and 390 feet, but presumably they are cased off. The mean annual air temperature at this place is 44.1° (average for 39 years), or 12.9° less than the temperature of the flow^ a difference indicating a rate of increase of 1° in 35.3 feet.
LITTLE BITTERROOT VALLEY.
Meinze*r 2 has given some data on temperature in artesian wells in Little Bitterroot Valley.
' Nettleton, E. S., Final report on artesian and underflow investigations, pt. 2: 52d Cong., 1st sess., S. Ex. Doc. 41, pt. 2.
s Meinzer, O. E., Artesian water for irrigation in Little Bitterroot Valley, Mont.: U. S. Cool. Survey. Water-Supply Paper 400, pp. 9-37, map, 1916.
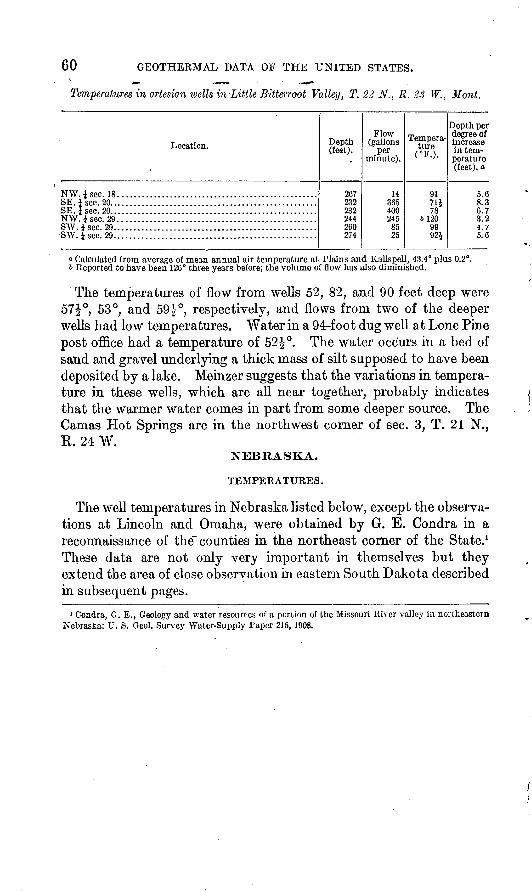
60 GEOTHERMAL DATA OF THE UNITED STATES.
Temperatures in artesian wells in Little Bitterroot Valley, T. 22 N., R. 23 W., Mont.
Location.
NW.Jscc. 18....................................... ...........SE. J sec. 20. ...................................................SE. Jsec. 20.. ..................................................N W. J sec. 29 ..................................................SW. i sec. 29. .................................................. SW.Jsec. 29.. .................................................
Depth (feet).
267232232244260274
Flow (gallons
perminute).
14365400245
8525
Tempera ture
( * ).
91
786120
9992J
Depth perdegree of increase in temperature(feet). a
5.68.36.73.2i.'f5.6
n Calculated from average of mean annual air temperature at Plains and Kalispell, 43.4° plus 0.2°. b Reported to have been 126° three years before; the volume of flow has also diminished.
The temperatures of flow from wells 52, 82, and 90 feet deep were 57£°, 53°, and 59^°, respectively, and flows from two of the deeper wells had low temperatures. Water in a 94-foot dug well at Lone Pine post office had a temperature of 52£°. The water occurs in a bed of sand and gravel underlying a thick mass of silt supposed to have been deposited by a lake. Meinzer suggests that the variations in tempera ture in these wells, which are all near together, probably indicates that the warmer water comes in part from some deeper source. The Camas Hot Springs are in the northwest corner of sec. 3, T. 21 N., R. 24 W.
NEBRASKA.
TEMPERATURES.
The well temperatures in Nebraska listed below, except the observa tions at Lincoln and Omaha, were obtained by G. E. Condra in a reconnaissance of the" counties in the northeast corner of the State.1 These data are not only very important in themselves but they extend the area of close observation in eastern South Dakota described in subsequent pages.
1 Condra, G. E., Geology and water resources of a portion of the Missouri Eiver valley in northeastern Nebraska: U. S. Geol. Survey Water-Supply Paper 215,1908.

NEBRASKA. 61
Temperatures in wells in Nebraska.
Location.
Boyd County:
Cedar County: Sec. 17, T. 33, N.I W....
Sec. 17, T. 33, N.I W.... Sec. 16, T. 33, N.I W....
.Sec. 10, T. 33, N.I W.... Sec. 16, T. 33, N.I W.... Sec. 9, T. 33, N. 1W..... Sec. 10, T. 33, N.I W.... Sec. 12, T. 33, N.I W.... Sec. 12, T. 33, N.I W.... Sec. 8, T. 33, N.I E......Sec. 17, T. 33, N.I E..... Sec. 10, T. 33, N.I E..... Sec. 17, T. 33, N.I E..... Sec.22,T.33,N.lE..... Sec. 24, T. 33, N.I E..... Sec. 30, T. 33, N.I E..... Sec.34,T.33,N.2E..... Sec. 28, T. 33.N. 2E..... Sec. 5, T. 32, N. 2E......Sec. 10, T. 32.N. 2E.....Sec. 8, T. 32, N. 2E......Sec. 10, T. 32, N.2E..... Sec.lO,T.32,N.2E..... Sec. 10, T. 32,N.2E..... Sec. 12, T. 32, N.2E..... Sec. 14, T. 32, N.2E..... Sec. 15, T. 32,N.2E..... Sec. 11,T.32,N.2E..... Sec. 11, T. 32,N.2E..... Sec. 13, T.32.N.2E..... Sec. 24, T. 32, N.2E..... Sec. 25, T. 32.N.2E..... Sec. 14, T. 32, N. 2E..... Sec.7,T. 32,V. 3E......Sec. 8,T. 32, N. 3E......Sec. 8, T.32, N. 3 E......finp Q T 39 M 3 V,Sec. 15, T. 32, N. 3E..... Sec. 15, T. 32, R.3E..... Sec. 15, T. 32, E. 3E..... Sec. 16, T. 32, R. 3E..... Sec. 12, T. 32, E. 3E..... Scc.21,T.32,E.3E.....Sec. 21, T. 32, B.3E..... Sec. 16, T. 32, E. 3E..... Sec. 7, T. 32. E. 3E...... Sec. 21, T.32, E. 3E..... Sec. 21, T. 32, E.3E.... Sec.l4,T.32,E.3E.... Sec. 12, T.32. E. 3 E..... Sec. 23. T.32, E. 3 E.... Sec. 11, T.32, E. 3 E.... Sec. 24, T. 32, E. 3 E. ... Sec. 24, T.32, E. 3 E....Sec. 24, T.32, E. 3 E....
Dixon County: Sec. 19, T.32, E. 4 E.... Scc.l9,T.32,E.4E.... Sec.29,T.32,E.4E.... Sec. 29, T.32, E. 4 E.... Sec. 28, T.32, E. 4 E.... Sec. 28, T.32, E. 4 E.... Sec. 28, T.32, E. 4 E.... Sec. 34, T.32. E. 4E.... Sec. 28, T.32, E. 5 E.... Sec. 32, T.32, E. 5 E.... Sec. 32, T.32, E. 5E....
Depth (feet).
797 923
500
365 400 400 400 400 400 400 380 360 420 360 454 500 350 530 280 420 500
530 241 400 360 300 400 320 417 300 400 300 340 520 400 400 300 280 305 310 240 270 310
340 400 300 327 310 270 250 530 245 280
340
300 300 280 280 290 277 177 300 265 265 400
Flow (gal lons per
min- . ute).
405 Many.
26 Many.
7 7 7
15 7
44 52
5J
15-20
30
4
2
11 1
9
li
7 Several.
3 4 8 3 1 5
3 20 8
12 11
2
2 2
1
1
3 3
Tem pera ture
(T.).
79J 90
59
59J 59* 60 58!
' 58! 59 59*. 60 59*. 59 58 58i 62 00 03 00 60! 01 CO! 60! 60 60 59 59 GO 59 58 58*. 59 59 58 62! 01 00| 58J 59 57 60 58 58J 59! 59! 59 59! 59 55! 55 59i 57 59 57! 59 63! 60
61 61 61 60! 601 60} 59 58 61 55 54
Mean annual
air tem pera ture
(°F.).
47.9. 47.9
a46.5
46.5 40.5 46.5 46.5 46.5 40.5 46.5 46.5 46.5 46.5 46.5 46.5 46.5 46.5 46.5 46.5 46.5 46.5 46.5 46.5 46.5 46.5 46.5 40.5 40.5 46.5 40.5 40.5 40.5 40.5 40.5 46.5 46.5 46.5 46.5 46.5 46.5 40.5 46.5 46.5 46.5 40.5 40.5 46.5 46.5 46.5 46.5 46.5 46.5 46.5 46.5 46.5 46.5 46.5
048.3 48.3 48.3 48.3 48.3 48.3 48.3 48.3 48.3 48.3 48.3
Depth per
degree of in crease n tem pera ture
(feet).
23.1 20.8
28.0 30.8 29.6 33.3 33.3 32.0 30.8 28.1 27.7 18.7 31.2 37.8 32.2 25.9 32.1 20.7 30.0 34.4
37.8 17.9 29.6 28.8 24.0 29.5 25.6 36.2 25.0 32.0 24.0 29.6 32.5 27.6 28.5 25 22.4 34.8 22.9 20.9 22.5 23.8
27.2 30.8 24 36.3 36.5 21.2 23.8 42.4 22.3 22.4
25.2
23.6 23.6 22.0 22.9 24.1 22.1 16.5 30.9 20.9 39.6 70.0
Remarks.
Flow 761 to 797 feet. Third flow from 875 feet.
Flow probably in part from 400 feet.
Flow at 337 feet.
o Yankton, S. Dak., average for 43 years. i> Vermilion, S. Dak., average for 10 years.
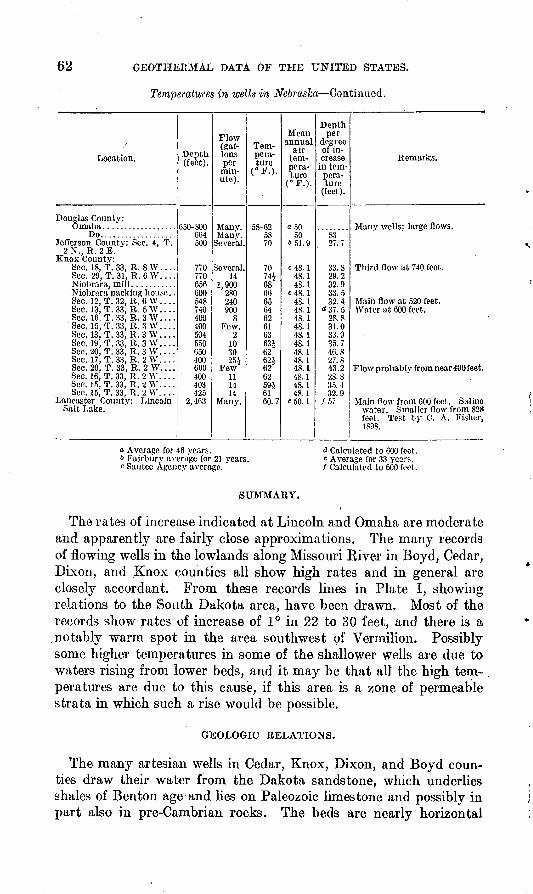
GEOTHERMAL DATA OF THE UNITED STATES.
Temperatures in wells in Nebraska Continued.
Location.
Douglas County: Omaha. . /...............
Do...................Jefferson County: Sec. 4, T.
2 N., R. 2 E.Knox Countv:
Sec. 18, t. 33, R. 8W.Sec. 29, T. 31. R. 6W.Niobrara, mill ........Niobrara packing house Sec. 12, T. 32, R. 6W.Sec. 13, T.33, R. 5 W.Sec. 16. T.33, R. 3 W.Sec. 15, T.33, R. 3 W.Sec. 13, T.33, R. 3 W.Sec. 19, T.33, R. 3 W.Sec. 20, T.33. R. 3 W.Sec. 17, T.33, R. 2 W.Sec. 20, T. 33, R. 2 W. Sec. 16, T.33, R. 2W.Sec. 15, T.33, R. 2W.Sec. 15, T.33, R. 2W.
Lancaster County: LincolnSalt Lake.
Depth (feet).
650-800
500
770770656600548740400400504550650400600
' 400403425
2, 4fi3
Flow (gal lons per minute).
Many.Many.
Several.
Several.14
1,900280 240900
8Few.
2103025J
Few 111414
Many.
Tem pera ture
(°F.).
58-625870
707446866 656462616363*62"
62462 6259J6160.7
Meanannual
air tem perature
50651.9
c48. 148.148. 1
4&148.148.148.148.148.148.148.148.148.148.148.1
«50. 1
Depthper
degree of in crease
in tempera ture
(feet).
8327.7
33.829.232 933.' 5 32.4
<* 37. 528.831.033.935.746.827.843.228.835.432.9
/57
Remarks.
Many wells; large flows.
Third flow at 740 feet.
Main flow at 520 feet.Water at 600 feet.
Flowprobably from near 400 feet.
Main flow from 600 feet. Salinewater. Smal ler flow from 828feet. Test by 0. A. Fisher,18DS.
o Average for 46 years.6 Fairburv average for 21 years.c Santee Agency average.'
d Calculated to 600 feet. < Average for 33 years. / Calculated to 600 feet.
SUMMARY.
The rates of increase indicated at Lincoln and Omaha are moderate and apparently are fairly close approximations. The many records of flowing wells in the lowlands along Missouri River in Boyd, Cedar, Dixon, and Knox counties all show high rates and in general are closely accordant. From these records lines in Plate I, showing relations to the South Dakota area, have been drawn. Most of the records show rates of increase of 1° in 22 to 30 feet, and there is a
.notably warm spot in the area southwest of Vermilion. Possibly some higher temperatures in some of the shallower wells are due to waters rising from lower beds, and it may be that all the high tem peratures are due to this cause, if this area is a zone of permeable strata in which such a rise would be possible.
GEOLOGIC EELATIONS.
The many artesian wells in Cedar, Knox, Dixon, and Boyd coun ties draw their water from the Dakota sandstone, which underlies shales of Ben ton age-and lies on Paleozoic limestone and possibly in part also in pre-Cambrian rocks. The beds are nearly horizontal
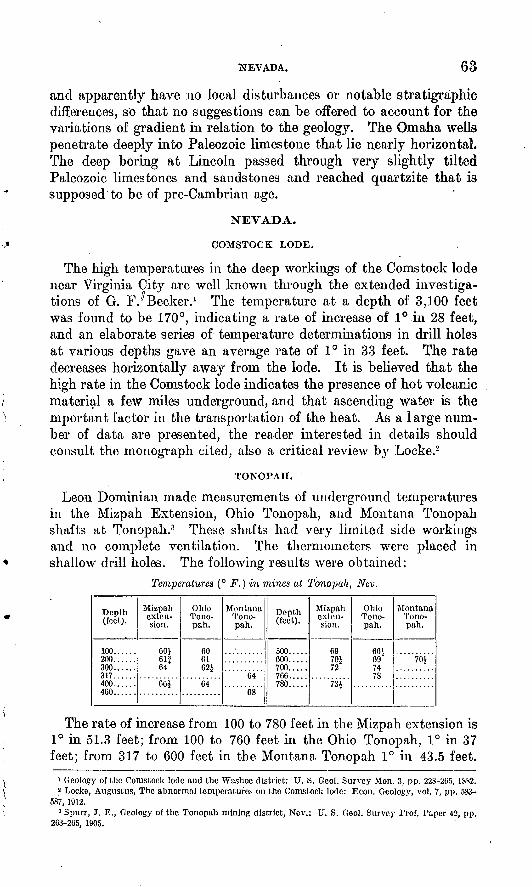
NEVADA. 63
and apparently have no local disturbances or notable stratigraphic differences, so that no suggestions can be offered to account for the variations of gradient in relation to the geology. The Omaha wells penetrate deeply into Paleozoic limestone that lie n,early horizontal. The deep boring at Lincoln passed through very slightly tilted Paleozoic limestones and sandstones and reached quartzite that is supposed to be of pre-Cambrian age.
NEVADA.
COMSTOCK LODE.
The high temperatures in the deep workings of the Comstock lode near Virginia City are well known through the extended investiga tions of G. F/Becker.1 The temperature at a depth of 3,100 feet was found to be 170°, indicating a rate of increase of 1° in 28 feet, and an elaborate series of temperature determinations in drill holes at various depths gave an average rate of 1° in 33 feet. The rate decreases horizontally away from the lode. It is believed that the high rate in the Comstock lode indicates the presence of hot volcanic material a few miles underground, and that ascending water is the mportant factor in the transportation of the heat. As a 1 arge num ber of data are presented, the reader interested in details should consult the monograph cited, also a critical review by Locke.2
TONOPAH.
Leon Dominiau made measurements of underground temperatures in the Mizpah Extension, Ohio Tonopah, and Montana Tonopah shafts at Tonopah.3 These shafts had very limited side workings and no complete ventilation. The thermometers were placed in shallow drill holes. The following results were obtained:
Temperatures (° F.) in mines at Tonopah, Nev.
Depth (feet).
100......200......300......317......400......460......
Mizpah exten sion.
60}61J64
66*
Ohio Tono pah.
606162J
64
Montana Tono pah.
64
68
Depth (feet).
500. ....600.700. ....766.....780. ....
Mizpah exten sion.
6970172
73J
Ohio Tono pah.
66t69"
7478
Montana Tono pah.
70i
The rate of increase from 100 to 780 feet in the Mizpah extension is 1° in 51.3 feet; from 100 to 760 feet in the Ohio Tonopah, 1° in 37 feet; from 317 to 600 feet in the Montana Tonopah 1° in 43.5 feet.
1 Geology of tho Comstock lode and the Washoe district: U. S. Geol. Survey Mon. 3, pp. 228-265, 18S2.? Locke, Augustus, The abnormal temperatures on the Comstock lode: Econ. Geology, vol. 7, pp. 583-
587, 1912.3 Spurr, J. E., Geology of the Tonopah mining district, Nov.: U. S. Geol. Survey Prof. 1'c.per 42, pp.
263-265, 1905.
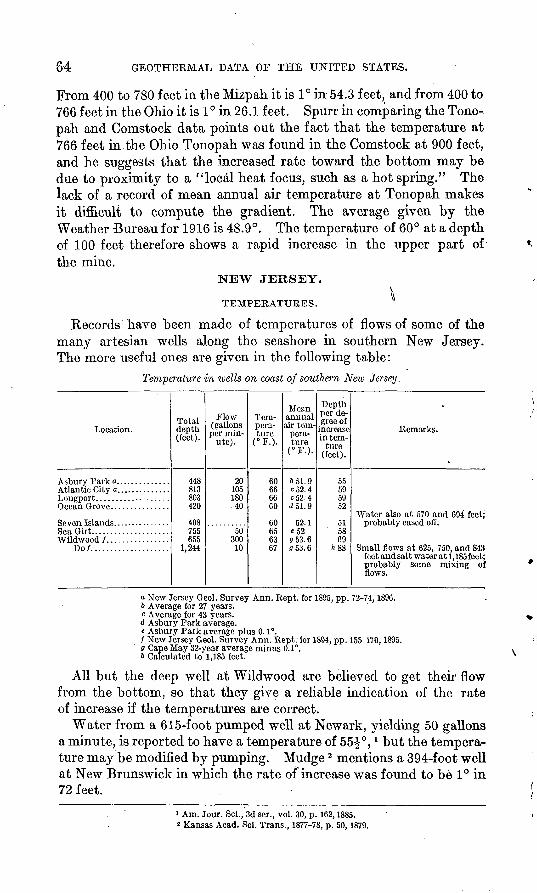
64 GEOTHERMAL DATA OF THE UNITED STATES.
From 400 to 780 feet in the Mizpah it is 1° in 54.3 feet, and from 400 to 766 feet in the Ohio it is 1 ° in 26.1 feet. Spurr in comparing the Tono pah and Comstock data points out the fact that the temperature at 766 feet in the Ohio Tonopah was found in the Comstock at 900 feet, and he suggests that the increased rate toward the bottom may be due to proximity to a "local heat focus, such as a hot spring." The lack of a record of mean annual air temperature at Tonopah makes it difficult to compute the gradient. The average given by the Weather Bureau for 1916 is 48.9°. The temperature of 60° at a depth of 100 feet therefore shows a rapid increase in the upper part of the mine.
NEW JERSEY.
TEMPERATURES.
Records have been made of temperatures of flows of some of the many artesian wells along the seashore in southern New Jersey. The more useful ones are given in the following table:
Temperature in wells on coast of southern New Jersey.
Location.
Sea Girt.. ..................
Do/... .................
Total depth (feet).
448813803420
408755655
1,244
Flow (gallons per min
ute).
2010518040
50300
10
Tem pera ture
(°F.).
60666660
60656367
annual air tem
pera ture
(°F.).
651.9c52.4C52.4dol.9
52.1e52053.6053.6
Depthper de gree of
increase intem-
ture(feet).
55595952
515869
ft 88
Remarks.
.
Water also at 570 and 694 feet-
Small flows at 625, 750, and 843feet and salt water at 1,185 feet;probably some mixing offlows.
a New Jersey Geol. Survey Ann. Rept. for 1895, pp. 72-74,1896.6 Average for 27 years.c Average for 43 years.d Asbury Park average.« Asbury Park average plus 0.1°./ New Jersey Geol. Survey Ann. Kept, for 1894, pp. 155-170,1895.a Cape May 32-year average minus 0.1°.A Calculated to 1,185 feet.
All but the deep well at Wildwood are believed to get their flow from the bottom, so that they give a reliable indication of the rate of increase if the temperatures are correct.
Water from a 615-foot pumped well at Newark, yielding 50 gallons a minute, is reported to have a temperature of 55-|°, * but the tempera ture may be modified by pumping. Mudge 2 mentions a 394-foot well at New Brunswick in which the rate of increase was found to be 1° in 72 feet.
i Am. Jour. Sci., 3d ser., vol. 30, p. 162,1885. * Kansas Acad. Sci. Trans., 1877-78, p. 50,1879.
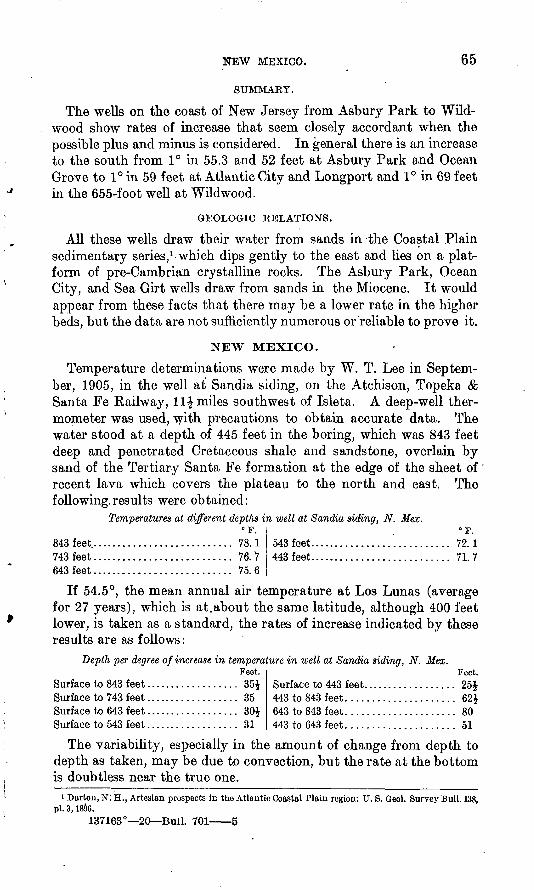
NEW MEXICO. 65
SUMMARY.
The wells on the coast of New Jersey from Asbury Park to Wild- wood show rates of increase that seem closely accordant when the possible plus and minus is considered. In general there is an increase to the south from 1° in 55.3 and 52 feet at Asbury Park and Ocean Grove to 1° in 59 feet at Atlantic City and Longport and 1° in 69 feet in the 655-foot well at Wildwood.
GEOLOGIC RELATIONS.
All these wells draw their water from sands in the Coastal Plain sedimentary series, 1 which dips gently to the east and lies on a plat form of pre-Cambrian crystalline rocks. The Asbury Park, Ocean City, and Sea Girt wells draw from sands in the Miocene. It would appear from these facts that there may be a lower rate in the higher beds, but the data are not sufficiently numerous or reliable to prove it.
NEW MEXICO.
Temperature determinations were made by W. T. Lee in Septem ber, 1905, in the well at Sandia siding, on the Atchisori, Topeka & Santa Fe Railway, 11^ miles southwest of Isleta. A deep-well ther mometer was used, with precautions to obtain accurate data. The water stood at a depth of 445 feet in the boring, which was 843 feet deep and penetrated Cretaceous shale and sandstone, overlain by sand of the Tertiary Santa Fe formation at the edge of the sheet of recent lava which covers the plateau to the north and east. The following. results were obtained:
Temperatures at different depths in well at Sandia siding, N. Mex.
543 feet........................... 72.1443 feet........................... 71.7
843 feet............................ 78.1743 feet........................... 76. V643 feet........................... 75. 6
If 54.5°, the mean annual air temperature at Los Lunas (average for 27 years), which is at.about the same latitude, although 400 feet lower, is taken as a standard, the rates of increase indicated by these results are as follows:
Depth per degree of increase in temperature in well at Sandia siding, N. Mex.Feet.
Surface to 843 feet.................. 35}Surface to 743 feet.................. 35Surface to 643 feet.................. 30}Surface to 543 feet.................. 31
Feet.Surface to 443 feet.................. 25}443 to 843 feet..................... 62}643 to 843 feet..................... 80443 to 643 feet..................... 51
The variability, especially in the amount of change from depth to depth as taken, may be due to convection, but the rate at the bottom is doubtless near the true one.
1 Barton, N: H., Artesian prospects in the Atlantic Coastal Plain region: U. S. Geol. Survey Bull. 138, pi. 3,18&6.
137163° 20 Bull. 701 5
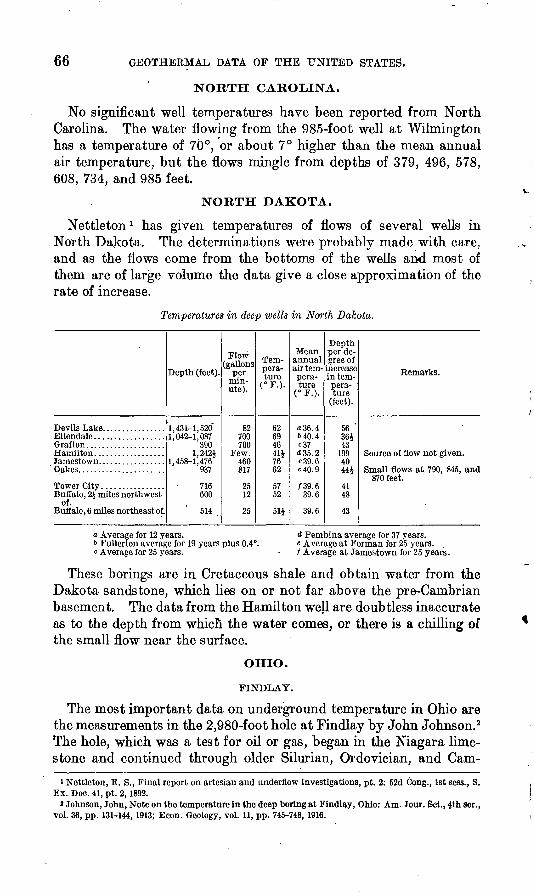
66 GEOTHERMAL DATA OF THE UNITED STATES.
NORTH CAROLINA.
No significant well temperatures have been reported from North Carolina. The water flowing from the 985-foot well at Wilmington has a temperature of 70°, or about 7° higher than the mean annual air temperature, but the flows mingle from depths of 379, 496, 578, 608, 734, and 985 feet.
NORTH DAKOTA.
Nettleton l has given temperatures of flows of several wells in North Dakota. The determinations were probably made with care, and as the flows come from the bottoms of the wells and most of them are of large volume the data give a close approximation of the rate of increase.
Temperatures in deep wells in North Dakota.
Devils Lake. ...............Ellendale..................Grafton.. ..................
Tower City ................Buffalo, 2£ miles northwest
of.Buffalo, 6 miles northeast of.
Depth (feet).
1,431-1,520"1,042-1,087
390
l,458-l'476937
716600
514
Flow (gallons
per
ute).
82700700
Few.460817
2512
25
Tem pera ture
(°F.).
626946
7662
5752
51J
Mean annual air tem perature
o36.4640.4
cJ35.2«39.6«40.9
/39.639.6
39.6
Depthper de gree of
increase in tempera ture
(feet).
56 '
4319940
4148
43
Remarks.
870 feet.
a Average for 12 years.6 Fullerton average for 19 years plus 0.4°.c Average for 25 years.
<J Pembina average for 37 years. « Average at Forrnan for 25 years. / Average at Jamestown for 25 years.
These borings are in Cretaceous shale and obtain water from the Dakota sandstone, which lies on or not far above the pre-Canabrian basement. The data from the Hamilton well are doubtless inaccurate as to the depth from whicn the water comes, or there is a chilling of the small flow near the surface.
OHIO.
FINDLAY.
The most important data on underground temperature in Ohio are the measurements in the 2,980-foot hole at Findlay by John Johnson.2 The hole, which was a test for oil or gas, began in the Niagara lime stone and continued through older Silurian, Ordovician, and Cam-
1 Nettleton, E. S., Final report on artesian and underflow investigations, pt. 2: 52d Gong., 1st sess., S. Ex. Doc. 41, pt. 2,1892.
* Johnson, John, Note on the temperature In the deep boring at Findlay, Ohio: Am. Jour. Sci., 4th ser., vol. 36, pp. 131-144, 1913; Econ. Geology, vol. 11, pp. 745-748, 1916.
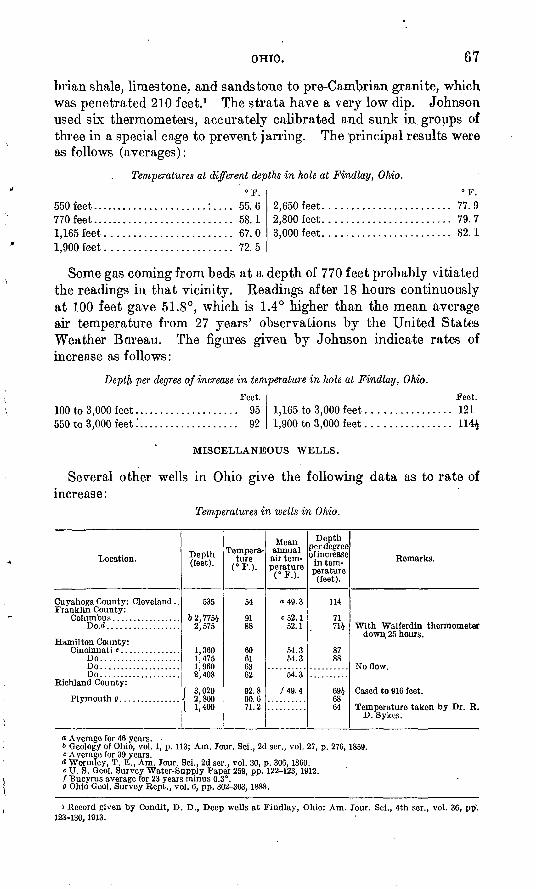
OHIO. 67
brian shale, limestone, and sandstone to pre-Cambrian granite, which was penetrated 210 feet. 1 The strata have a very low dip. Johnson used six thermometers, accurately calibrated and sunk in groups of three in a special cage to prevent jarring. The principal results were as follows (averages):
Temperatures at different depths in hole at Findlay, Ohio.
550feet......................:.... 55.6770feet........................... 58.11,165 feet........................ 67.01,900 feet........................ 72. 5
F.2,650 feet........................ 77.92,800 feet........................ 79.73,000 feet........................ 82.1
Some gas coming from beds at a depth of 770 feet probably vitiated the readings in that vicinity. Readings after 18 hours continuously at 100 feet gave 51.8°, which is 1.4° higher than the mean average air temperature from 27 years' observations by the United States Weather Bureau. The figures given by Johnson indicate rates of increase as follows:
Feet.1,165 to 3,000 feet................ 1211,900 to 3,000 feet...............
Depth per degree of increase in temperature in hole at Findlay, Ohio.
Feet. 100 to 3,000 feet.................... 95550 to 3,000 feet.'................... 92
MISCELLANEOUS WELLS.
Several other wells in Ohio give the following data as to rate of increase:
Temperatures in wells in Ohio.
Location.
Cuyahoga County: Cleveland . . Franklin County:
Hamilton County:
Do....................Do....................Do....................
Richland County:
Depth (feet).
535
&2,775i2,575
1,3601. 4751,9602,408
f 3,020 < 2,8001 1,400
Tempera ture
54
9188
60616362
92.8 90.671.2
Mean annual air tem perature (°F.).
o49.3
c52.152.1
54.354.3
54.3
749.4
Depth per degree of increase in tem perature (feet).
114
71
8788
6864
Remarks.
With Walferdin thermometerdown, 25 hours.
Cased to 916 feet.
D. Sykcs.
o Average for 46 years. 6 Geology of Ohio, vol. 1, p. 113; Am. Jour. Sci., 2d ser., vol. 27, p. 276,1859.c Average for 39 years.d Wormley, T. E., Am. Jour. Sci.. 2d ser., vol. 30, p. 306, 1860.« U. S. Geol. Survey Water-Supply Paper 259, pp. 122-123, 1912./ Bucyrus average for 23 years minus 0.3°.a Ohio Geol. Survey Rept., vol. 6, pp. 302-303,1888.
i Record given by Condit, D. D., Deep wells at Findlay, Ohio: Am. Jour. Sci., 4th ser., vol. 36, pp. 123-130,1913.

68 GEOTHEBMAL DATA OF THE UNITED STATES.
The Cleveland well is pumped and the water in whole or part may come from higher beds. Temperatures were taken in the bottom of the old Columbus well and at 3,020, 2,800, and 1,400 feet in the Plymouth well. In the Plymouth well the rate of increase from 1,400 to 2,800 feet is 1° iii 76.2 feet, and from 1,400 to 3,020 feet 1° in 70.5 feet. The strata in all these holes are limestones, sandstones, and shales dipping at; low angles. The Columbus and Plymouth wells penetrated to a horizon low in the Ordovician. The Cleveland hole was sunk for water in sandstone of Devonian age.
OKLAHOMA.
TEMPERATUBES.
A series of careful observations in wells and borings at several points in Oklahoma were made in 1906 by E. G. Woodruff, who used maximum thermometers lent by the Weather Bureau and lowered them to the depths given in the table. The following are the results:
Temperatures in deep wells in Oklahoma.
. Location.
Cleveland County:
Do....................Kay County: Newkirk, 9 miles
southeast of.
Logan County: Meridian ...... Muskogee County:
Do....................Noble County: Perry, 1 mile
east of. Pawnee County:
Do....................Ralston, l mile west of. ....
Pittsburg County: McAlester, 2 miles northwest of.
Tulsa County: Red Fork, 2 miles north
east of. sec. 14.
Wagoner County: Wagoner....
Washington County:
Owen, 2 miles northeast of.
Ramona, 5 miles west of. . .
Depth (feet).
407240760
5252,200
. 1,020410500
1,6501,6252,3502 cnn
540
705
1,170
1,010
1,1001,275
1,700
Tempera ture
(°F.).
65.062.576.0
63.082.0
84.0'67.068.0
107107128 12473
78
98
78
86 .84
103
Mean annual air tem perature (°F.).
60.5fin s58.7
o60.4660.3
c60.460.4
<*59.0
«59.259.2
/59.2 59 1
063
A 60.3
fin ?
<60.3
i t& 9*50
59.4
Depth per degree ofincrease in tem
perature (feet).
90i12044
202lOli
436255J
34£3434 38.554
40
31
57
4151
39
Remarks.
Old well, plugged.
Gas well, 970 feet deep. Salt water.
Boring in progress.
Old oil well.Do.
Old boring.
In progress.
In coal, diamond drill, stopped 17 hours before test.
Abandoned hole full of salt water; some gas.
only for test. Small salty flow. Temperature 68°.
Oil well; tubing just with drawn.
Do.
a Guthrie average for 24 years plus 0.1°6 Guthrie average.c Average for 18 years.d Average for 10 years.e Average for 14 years./ Stillwater average for 24 years.
a Average for 12 years.ft Tulsa average for 13 years.* Average for 20 years.i Pawhuska average plus 0.1°.* Pawhuska average minus 0.1° ' Pawhuska average plus 0.3°.

PENNSYLVANIA. 69
SUMMARY.
All the borings tested are in the northeastern part of the State except the one at McAlester, which is considerably south of the others. The results show a considerable range in the geothermal gradient, but exclusive of the pumping well at Norman, the old hole at Fallis, and the deep boring at Meridian the rate of increase is 1 ° in 34 to 62 feet. The boring at Meridian was in progress and may have been chilled by the pumping of cool surface water to remove the drillings. All the conditions in the Fallis well are not known, but they appeared to be favorable for a reliable test. For many "of the localities there is some uncertainty as to the mean annual air tem perature, which had to be approximated from stations at some dis tance. The holes in Pawnee and Tulsa counties and at Yale and Rampna, which show rates of 1° in 30 to 40 feet, appear to be con sistent in indicating a high rate of increase for at least a portion of the central-northeastern part of the State.
, GEOLOGIC RELATIONS.
The borings all penetrate limestone and shale of Carboniferous age, which dip at a low angle to the west and southwest. There are no notable local disturbances and no igneous rocks, and the pre-Cam- brian rocks lie far below the surface.
PENNSYLVANIA.
ANTHRACITE REGION.
In 1909 to 1911 I made a series of careful determinations of under ground temperatures in the anthracite coal fields. Thermometers were sunk in bore holes and in several places buried for a while in holes in remote chambers in coal mines. The following results were obtained:
Temperatures in coal mines in anthracite region of Pennsylvania.
Location.
Scranton, Pine Brook mine....
Throop, 1 mile northeast of. ....Storrs mine, gangway, l.C Big
bed.Sloan mine, lowest Dunmore
bed.Wood ward mine, gangway No.
O l*j.South Wilkes-Barre, mine, 9
slope, Baltimore bed.
Depth (feet).
960
540776
580
1,200
1,300
Tempera ture
( o T? \a.).
59.5
53.560.0
64.5
61.0
64.0
Meanannual tempera
turef<> 1? \(. * )
"49.3
49.349.3
49.3
649.8
49.8
Depth perdegree of increase in tem
perature(feet) .
94
12972£
38
107
9U
Remarks.
Borehole 670 feet deep in mine,290 feet below surface. Waterflows. Boring suspended 18hours.
Drilling finished 24hours.Old boring 405 feet deep in mine
371 feet oelow ground.In new chamber in a 6-foot hole
bored in coal the day before.6-foot hole in coal; no ventila
tion.6-foot hole in coal ; some ventila
tion.a Average for 16 years. t> Scranton average plus 0.50°
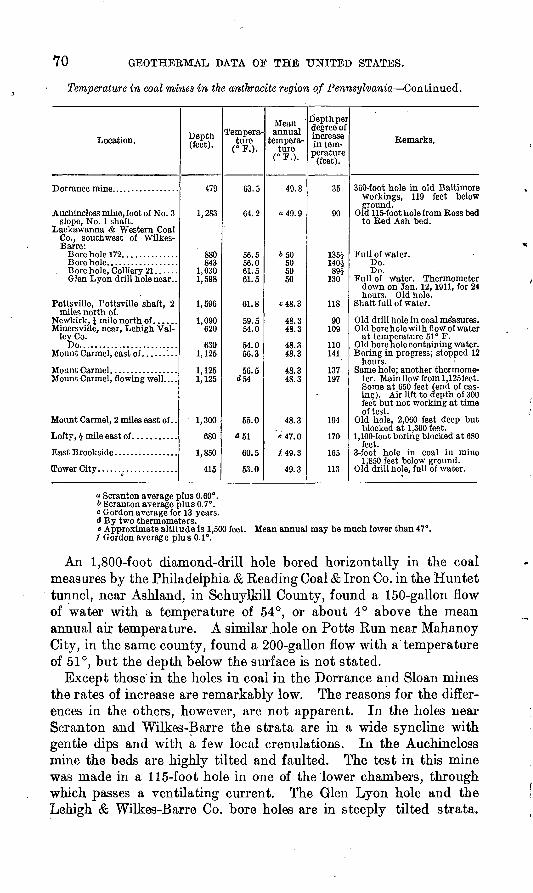
70 GEOTHERMAL DATA OF THE UNITED STATES.
Temperature in coal mines in the anthracite region of Pennsylvania Continued.
Location.
Dorrance mine.................
Auchincloss mine, foot of No. 3 slope, No. 1 shaft.
Lackawanna & Western Coal Co., southwest of Wilkes- Barre:
. B ore hole, Colliery 21 ......Glen Lyon drill hole near..
Pottsville, Pottsville shaft, 2 miles north of.
Newkirk. 1 mile north of ......Minersville, near, Lehigh Val
ley Co. Do.........................
Mount Carmel, flowing well. . . .
Mount Carmel, 2 miles east of . .
Lofty, £ mile east of ...........
Depth (feet).
479
1,283
880843
1,0301,598
1,596
1,090620
6301,125
1,1251,125
1,300
680
1,850
41 1
Tempera ture
(° F.).
63.5
64.2
56.556.061.561.5
61.8
59.554.0
Mo56.3
<\fi z,<*54
55.0
<»51
60.5
is n
Mean annual
tempera ture
( e F.).
49.8
o49.9
650505050
C48.3
48.348.3
48.348.3
48.348.3
48.3
'e47.0
/49.3
40 ^
Depth per degree of increase in tem perature
(feet).
35
90
13<;1140£89£
130
118
90109
110141
137197
194
170
165
113
Remarks.
360-foot hole in old Baltimoreworkings, 119 feet below ground.
Old 115-foot hole from Ross bed to Red Ash bed.
Full of water.Do.Do.
Full of water. Thermometer down on Jan. 12, 1911, for 24 hours. Old hole.
Shatt full of water.
Old drill hole in coal me'asures.Old bore hole with flow of water
at temperature 51° F. Old bore hole containing water.Boring in progress; stopped 12
hours. Same hole; another thermome
ter. Main flow from 1,125 feet. Some at 650 feet (end of cas ing). Air lift to depth of 300 feet but not working at time of test.
Old hole. 2,060 feet deep but blocked at 1,300 feet.
1,100-foot boring blocked at 680feet.
1:850 feet below ground. Old drill hole, full of water.
a Scranton average plus 0.60°.6 Scranton average plus 0.7°.c Gordon average for 13 years.d By two thermometers.« Approximate altitude is 1,500 feet. Mean annual may be much lower than 47°./ Gordon average plus 0.1°.
An 1,800-foot diamond-drill hole bored horizontally in the coal measures by the Philadelphia & Reading Coal & Iron Co. in the Huntet tunnel, near Ashland, in Schuylkill County, found a 150-gallon flow of water with a temperature of 54°, or about 4° above the mean annual air temperature. A similar hole on Potts Run near Mahanoy City, in the same county, found a 200-gallon flow with a' temperature of 51°, but the depth below the surface is not stated.
Except those in the holes in coal in the Dorrance and Sloan mines the rates of increase are remarkably low. The reasons for the differ ences in the others, however, are not apparent. In the holes near Scranton and Wilkes-Barre the strata are in a wide syncline with gentle dips and with a few local crenulations. In the Auchincloss mine the beds are highly tilted and faulted. The test in this mine was made in a 115-foot hole in one of the lower chambers, through which passes a ventilating current. The Glen Lyon hole and the Lehigh & Wilkes-Barre Co. bore holes are in steeply tilted strata.
PENNSYLVANIA. 71
The Pottsville shaft was an abandoned shaft at a mine that had been full of water for several years. This and the remaining observations in the table were made in the southern anthracite basin, where the strata lie in a deep syncline with rather steep dips on the sides.
WEST ELIZABETH.
A well 5,386 feet deep has been put down on Peters Creek about 2£ miles west of West Elizabeth and about 12 miles south-southeast of Pittsburgh. The rocks are nearly horizontal and comprise strata from those not far below the Pittsburgh coal bed to those near the base of the Devonian. Temperatures in this well were taken by William Hallock1 in 1897, by lowering four thermometers to a depth of 5,000 feet and leaving them suspended for 16 hours. The reading waa 120.9°, an increase of 68.2° over the mean annual air temperature at Pittsburgh for 46 years (52.7°), which indicates a rate of 1° to 73.3 feet. A reading at 2,350 feet gave about 78°, indicating a somewhat higher rate, but this observation was not considered satisfactory.
MCDONALD.
Some preliminary information regarding a 6,975-foot hole 4 miles northwest of McDonald, 15 miles southwest of Pittsburgh, has been given by I. C. White and C. E. Van Orstrand.2 Until recently this was the deepest hole in the United States. Precise determinations of temperature have been made by C. E. Van Orstrand, some of which are as follows:
100 feet.......................... 57.0350 feet.......................... 59. 21,100 feet................ -........ 64.42,100 feet............."............ 76.32,600 feet......................... 82.43,100 feet......................... 88. 23,600 feet......................... 96. 84,100 feet......................... 104.4
4,600 feet......................... 110.55,100 feet......................... 121.15,600 feet......................... 133.36,000 feet......................... 140.06,600 feet......................... 144,16,775 feet......................... 145.86,975 feet......................... 144.9
The rates of increase indicated by some of these figures are as follows:
Feet per degree F. 100 to 6,775 feet.................. 75. 2100 to 6,600 feet.................. 75. 8100 to 5,600 feet.................. 72.11,100 to 6,775 feet................. 69. 7
Feet per degree F. 3,100.to 6,775feet................. 63.84,100 to 6,775 feet................. 64. 65,100 to 6,775 feet................. 67. 7
1 Hallock, WilUam, Subterranean temperatures at Wheeling, W. Va., and Pittsburgh, Pa.: School of Mines Quart., vol. 18, pp. 151-153,1897.
8 White, I. C., Discussion of the records of some very deep wells in the Appalachian oil fields of Pennsylvania, Ohio, and West Virginia; West Virginia: Geol. Survey, Barbour and Upshur counties, pp. xxv-lxv, 5 pis. (incl. maps), 1918.
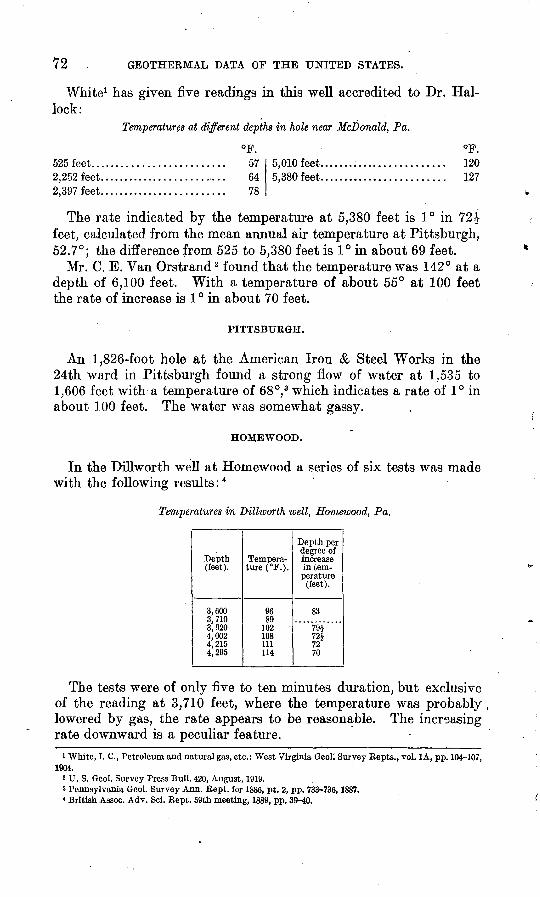
72 GEOTHERMAL DATA OF THE UNITED STATES.
White1 has given five readings in this well accredited to Dr. Hal- lock:
Temperatures at different depths in hole near McDonald, Pa.
525 feet... 2,252 feet. 2,397 feet.
576478
5,010 feet......................... 1205,380 feet......................... 127
The rate indicated by the temperature at 5,380 feet is 1° in feet, calculated from the mean annual air temperature at Pittsburgh, 52.7°; the difference from 525 to 5,380 feet is 1° in about 69 feet.
Mr. C. E. Van Orstrand 2 found that the temperature was 142° at a depth of 6,100 feet. With a temperature of about 55° at 100 feet the rate of increase is 1 ° in about 70 feet.
PITTSBURGH.
An 1,826-foot hole at the American Iron & Steel Works in the 24th ward in Pittsburgh found a strong flow of water at 1,535 to 1,606 feet with a temperature of 68°, 3 which indicates a rate of 1° in about 100 feet. The water was somewhat gassy.
HOMEWOOD.
In the Dillworth well at Homewood a series of six tests was made with the following results: 4
Temperatures in Dillworth well, Homewood, Pa.
Depth(feet).
3,6003,7103,9204,0024,2154,295
Temperature (°F.).
9689
102 '108111114
Depth per degree of increasein temperature
(feet).
83
79Jm7270
The tests were of only five to ten minutes duration, but exclusive of the reading at 3,710 feet, where the temperature was probably lowered by gas, the rate appears to be reasonable. The increasing rate downward is a peculiar feature.
1 White, I. C., Petroleum and natural gas, etc.: West Virginia GeoK Survey Repts., vol. 1A, pp. 104-107, 1904.
a U. S. Geol. Survey Press Bull. 420, August, 1919. s Pennsylvania Geol. Survey Ann. Rept. for 1886, pt. 2, pp. 733-736,1887. 4 British Assoc. Adv. Sci. Rept. 59th meeting, 1889, pp. 39-40.
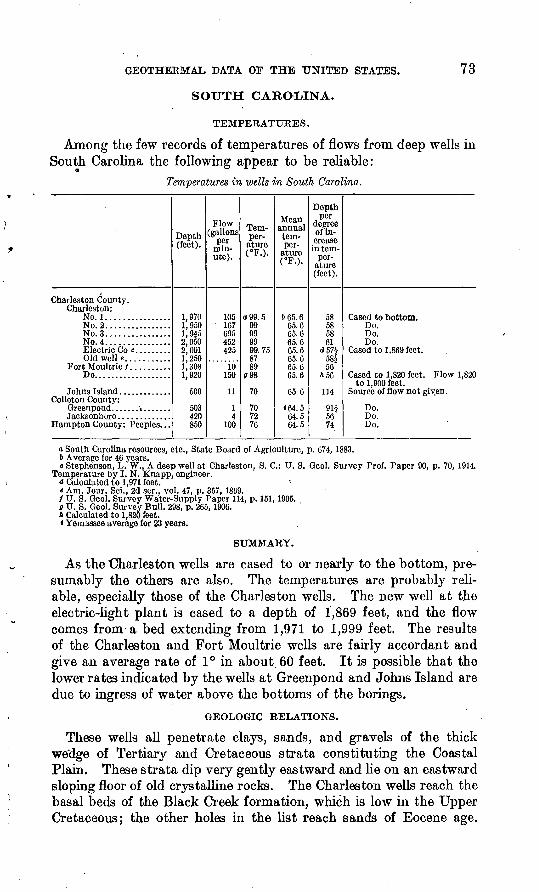
GEOTHERMAL DATA OF THE UNITED STATES. 73
SOUTH CAROLINA.
TEMPEKATTJEES.
Among the few records of temperatures of flows from deep wells in South Carolina the following appear to be reliable:
Temperatures in wells in South Carolina.
Charleston County:Charleston:
No.l. ...............No. 2. ...............No.3....... .........No.4................Electric Co e, ........Old well e...........
Fort Moultrie /..........Do...................
Colleton County:
Hampton County: Peoples. . .
Depth (feet).
1.9701,9501,9452,0502,0011,2501,3081,920
500
503420850
Flow
per min ute).
105167695452425
10150
11
14
100
Temper atureCF.).
o99.599999999.758789
098
70
707276
Mean annualtem per
ature( OTJl \
665.665.665.665.665.665.665.665.6
65 6
<64.564.564.5
Depthper
degreeofin- crease in tem
perature(feet).
58585861
<*57£58£56
h <>r.
114
91£5674
Do.Do.Do.
Cased to 1,869 feet.
Cased to 1,820 feet. Flow 1,820to 1,900 feet.
Source of flow not given.
Do.Do.Do.
o South Carolina resources, etc., State Board of Agriculture, p. 674, 1883. ft Average for 46 years.c Stephenson, L. W., A deep well at Charleston, S. C.: U. S. Geol. Survey Prof. Paper 90, p. 70, 1914.
Temperature by I. N. Knapp, engineer. d Calculated to 1,971 feet. e Am. Jour. Sci., 2d ser., vol. 47, p. 357, 1869. / U. S. Geol. Survey Water-Supply Paper 114, p. 151,1905. a U. S. Geol. Survey Bull. 298, p. 265,1906. ft Calculated to 1,820 feet. * Yemassee average for 23 years.
SUMMARY.
As the Charleston wells are cased to or nearly to the bottom, pre sumably the others are also. The temperatures are probably reli able, especially those of the Charleston wells. The new well at the electric-light plant is cased to a depth of 1,869 feet, and the flow comes from-a bed extending from 1,971 to 1,999 feet. The results of the Charleston and Fort Moultrie wells are fairly accordant and give an average rate of 1° in about 60 feet. It is possible that the lower rates indicated by the wells at Greenpond and Johns Island are due to ingress of water above the bottoms of the borings.
GEOLOGIC RELATIONS.
These wells all penetrate clays, sands, and gravels of the thick we'dge of Tertiary and Cretaceous strata constituting the Coastal Plain. These strata dip very gently eastward and lie on an eastward sloping floor of old crystalline rocks. The Charleston wells reach the basal beds of the Black Creek formation, which is low in the Upper Cretaceous; the other holes in the list reach sands of Eocene age.
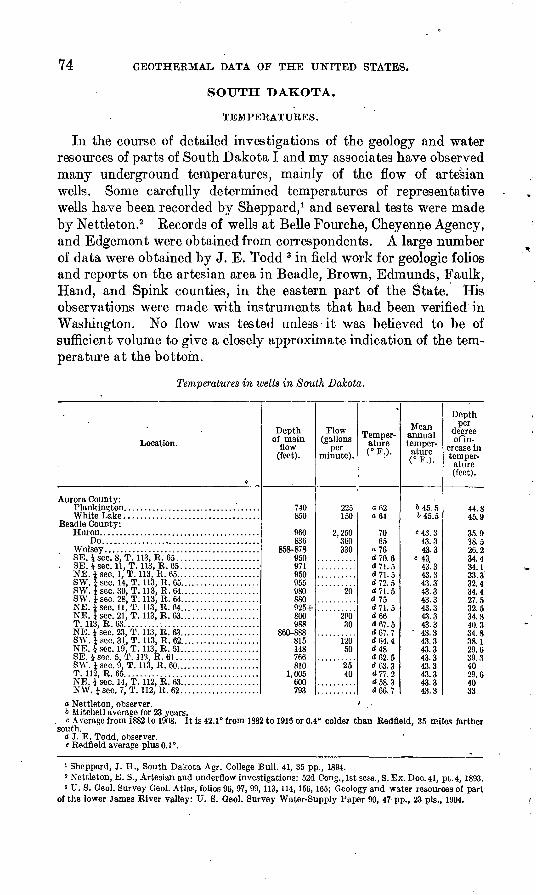
GEOTHERMAL DATA OF THE UNITED STATES.
SOUTH DAKOTA.
TEMPERATURES.
In the course of detailed investigations of the geology and water resources of parts of South Dakota I and my associates have observed many underground temperatures, mainly of the flow of artesian wells. Some carefully determined temperatures of representative wells have been recorded by Sheppard, 1 and several tests were made by Nettleton.2 Records of wells at Belle Fourche, Cheyenne Agency, and Edgemont were obtained from correspondents. A large number of data were obtained by J. E. Todd 3 in field work for geologic folios and reports on the artesian area in Beadle, Brown, Edmunds, Faulk, Hand, and Spink counties, in the eastern part of the State. His observations were made with instruments that had been verified in Washington. No flow was tested unless-it was believed to be of sufficient volume to give a closely approximate indication of the tem perature at the bottom.
Temperatures in wells in South Dakota.
Location.
0
Aurora County:
White Lake... ...............................Beadle County:
Do........................................Wolsey . ......................................SE. tsec. 8, T. 113, R. 65. ....................
. SE. J sec. 11, T. 113, R. 65 ....................NE. Jsec. 1, T. 113, R. 65.....................S W. J sec. 14. T. 113, R. 65. ...................SW. Jsec. 30, T. 113, R. 64.. ..................SW. 1 sec. 28, T. 113, R. 64. ...................NE. Jsec. 11, T. 113, R. 64....................NE. 1 sec. 21, T. 113, R. 63.. ..................T. 113, R. 63......... ..........................NE. J sec. 23, T. 113, R. 63. ...................SW . J sec. 31, T. 113, R. 62. ...................NE. i sec. 19, T. 113, E.. 81. ...................SE. 1 sec. 5, T. 113, R. 61 .....................SW. * sec. 9, T. 113, R. 60. ....................T. 112, R. 65. .................................NE. J sec. 14, T. 112, R. 63. ...................N W. i sec. 7, T. 112, R. 62. ...................
Depth of main
flow (feet).
740850
960836
858-878950971950955980880925+800988
860-888815148766810
1,005600793
Flow (gallons
per minute).
2251 ^ft
2.250 }fin330
20
9flfisn
12050
2540
Temper ature (°F.).
a 62a64
7065
a 76<J70.6d 71. 5(J71.5(J72.5 J71.5d75d71.5<J66<J67.5d 67. 7
<J48<J62.5<*63.3e«77.2<*5S.3<*66.7
Mean annual temper ature C F.).
& 45. 5645.5
M3.343.343.3
e 43.43.343.3<W 340 <y
43.343 }
43.343.3
43 3<13 *
43.343.343.343.343.343.3
Depth per
degree of in
crease in temper ature (feet).
44.8AC. Q
1% 0on e
26.234.434 1oq Q'On .J
34.497 tl32 534 ft40 3O4 Q
OQ I
on c
39.34029.64033
a Nettleton, observer. ' . o.Mitchell average for 23 years.
. c Average from 1882 to 1908. It is 42.1° from 1882 to 1915 or 0.4° colder than Redfleld, 35 miles farther south.
d 3. E. Todd, observer.e Redfleld average plus 0.1°.
» Sheppard, J. H., South Dakota Agr. College Bull. 41, 35 pp., 1894.2 Nettleton, E. S., Artesian and underflow investigations: 52d Cong.,lst sess., S. Ex. Doc. 41, pt.4, 1893.3 U. S. Geol. Survey Geol. Atlas, folios 96, 97, 99,113,114,156, 165; Geology and water resources of part
of the lower James River valley: U. S. Geol. Survey Water-Supply Paper 90, 47 pp., 23 pis., 1904.
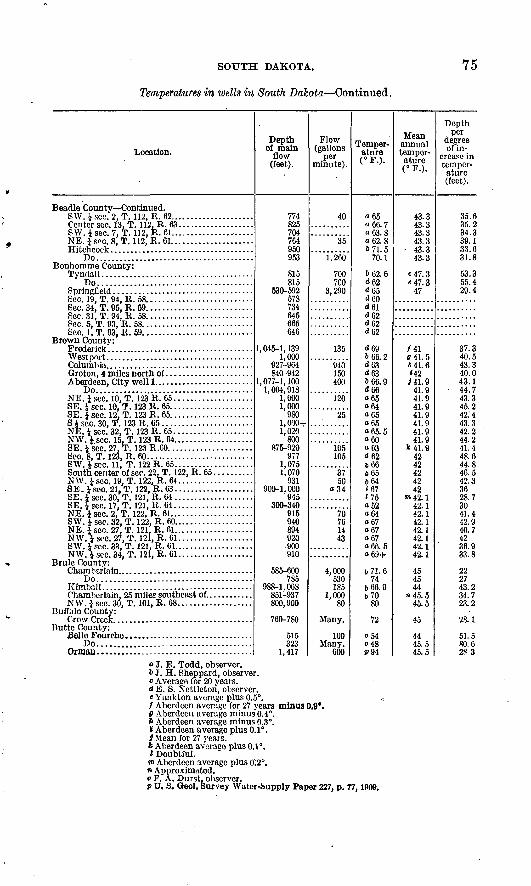
SOUTH DAKOTA.
Temperatures in wells in South Dakota Continued.
75
Location.
Beadle County Continued. S W. i sec. 2, T. 112, R. 62. ....................
SW. isec. 7, T. 112, R. 61.... ..................NE. i sec. 8, T. 112, R. 61.. ...................
Do........................................Bonhomme County:
Do.......................................
Sec. 19, T. 94. R. 58..... ......................Sec. 34, T. 95, R. 69...........................Sec. 31, T. 94, R. 58. ..........................Sec. 5, T. 93, R. 58. ...........................Sec. l.T. 93, R. 59............................
Brown County: Frederick"
Do.......................................NE. i sec. 10, T. 123 R. 65 ....................SE. Jsec. 10, T. 123 R. 65.....................SE. Jscc. 12, T. 123 R. 65.....................S J sec. 30, T. 123 R. 65 .......................N T? 1. oor» OO T 19Q R fi*i
N W. i sec. 15. T. 123 R. 64. ...................SE. Jsec. 27. T. 123 R.60. ....................ftnr» ft T1 193 T? fiOSW. i sec. 11, T. 122 R. 65. ...................South center of sec. 22, T. 122, R. 65 ..........N W. i sec. 19, T. 122, R. 64. ..................SE.isec. 21, T. 122, R. 63........... .........SE. i sec. 30, T. 121 , R. 64 ....................SE. £ sec. 17, T. 121, R. 64 ....................NE. i sec. 2, T. 122, R. 61. ....................SW. i see. 32, T. 122, R. 60.. ..................NE. isec. 27, T. 121. R. 61.. .................."MW A. cn/> 97 T 1O1 "R fil
SW. i sec. 33. T. 121, R. 61. ...................NW.isec.34, T. 121, R. 61. ..................
Brule County:
Do.......................................Kimball.. ....................................
NW.isec.80, T. 101, R.68.... ...............Buffalo County:
Crow GreetButte Countv:
Do.......................................Oman... ....................................
Depth of main
flow (feet).
774 825 704 764 950 953
815 815
530-592 578 734 645 665 646
1. 045-1, 139 1,000
927-964 840-942
1,077-1,100 1,004,918
1,000 1,000
980 1,000+1,020
800 875-920
977 1,075 1,070
931 900-1,000
945 300-340
915 940 894 920 .900 910
585-600 785
988-1,068 851-937 800, 900
760-780
515 323
1.417
Flow (gallons
per minute).
40
35
1,260
700 700
3,290
135
940 150 400
120
25
105 105
37 50
o34
70 76 14 43
4,000 530 185
1,000 80
Many.
100 Many.
600
Temper ature (°F.).
o65 o66.7 Q63.8 o62.8 671.5
70.1
662.6 <*62 o"65 d60 <*61 d62 <*62 <*62
<J69 666.2 «J63 <*63 666.9 466 065 o64 065 o65 065.5 o60 o63 <J62 666 665 664 J67 '75 052 o64 o67 o67 o67 o66.5 o69+
671.6 74
666.9 670
80
72
«54 048 P94
Mean annual temper ature (°F.).
43.3 43.3 43.3 43.3
43.3 43.3
C47.3 M7.3
47
/41 041.5 A 41. 6 <42 J41.9
41.9 41.9 41.9 41.9 41.9 41.9 41.9
* 41. 9 42 42 42 42 42
»»42.1 42.1 42.1 42.1 42.1 42.1 42.1 42.1
45 45 44
"45.5 45.5
45
44 45.5 45.5
Depth per
degree of in
crease in temper ature (feet).
35.6 35.2 34.3 39.1 33.6 31.8
53.355.4 29.4
37.340.5 43.3 40.0 43.1
44.7 43.3 45.2 42.'4 43.3 42.2 44, 2 41.4 48.6 44.8 46.5 42.3 36 28.7 30 41.4 42.9 40.7 42 36.9 33.8
22 27 43.2 34.7 23.2
28.1
51.5 80.6 28 3
o J. E. Todd, observer.6 J. H. Sheppard, observer.c Average for 20 years.d E. S. Nettleton, observer.e Yankton average plus 0.5°./ Aberdeen average for 27 years minus 0.9*.e Aberdeen average minus 0.4°.R Aberdeen average minus 0.3°.* Aberdeen average plus 0.1°. S Mean for 27 years.* Aberdeen average plus 0.1°.
> Doubtful.«n Aberdeen average plus 0?2".» Approximated.o P. A. Durst, observer.p U. S. Qeol. Survey Water-Supply Paper 227, p. 77, 1909.
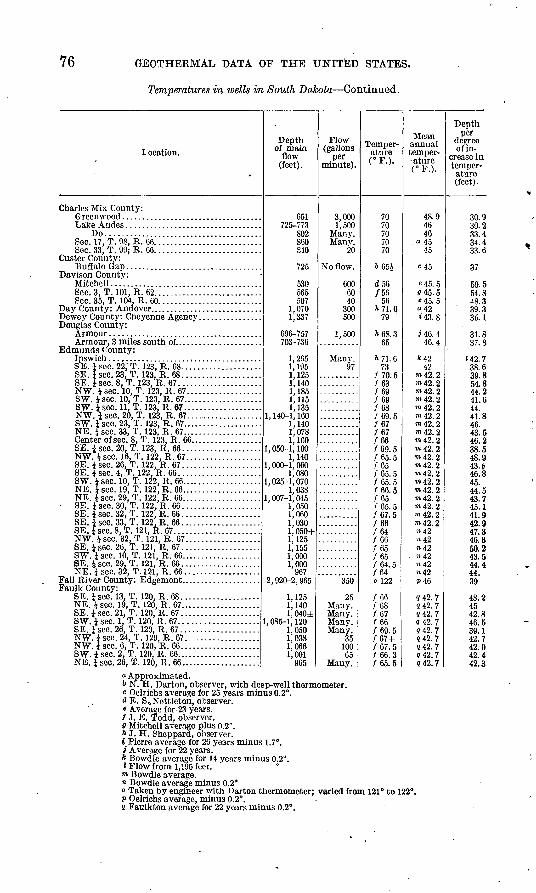
76 GEOTHERMAL DATA OF THE UNITED STATES.
Temperatures in wells in South Dakota Continued.
I ocation.Depth
of mainflow
(feet).
Flow (gallons
per minute).
Temper ature
Mean annual temper- ature
Depthper
degree of in
crease in temper ature (feet).
Charles Mix Count}7 :Greenwood................................... 651 3.000LakeAndes.................................. 725-773 1,500
Do....................................... 802 Many.Sec. 17, T. 08, R. 66........................... 860 Manv.Sec. 33, T. 99; R. 66........................... 840 20
Custer County:Buffalo Giap.................................. 725 No flow.
Davison County:Mitchell...................................... 530 600Sec. 3, T. 101, R. 62........................... 565 60Sec. 35, T. 104. R. 60.......................... 507 40
Day County: Andover............................ 1,070 300Dewey County: Cheyenne Agency................ 1,337 500Douglas County:
Armour...................................... 696-757 1,500Armour, 3 miles south of...................... 703-736
Edmunds County:Ipswich...................................... 1 265SE. 1 sec. 22, T. 123, R. 68.................... 1,195SE. i sec. 23, T. 123, R. 68.................... 1,125SE. i sec. 8, T. 123, R. 67..................... 1,140NW. i sec. 10, T. 123, R. 67................... 1,185SW. i sec. 10, T. 123, R. 67.................... 1,115SW. i sec. 11, T. 123, R. 67.................... 1,135NW. i sec. 20, T. 123, R. 67.................... 1,140-1,160SW. i sec. 23, T. 123, R. 67.................... 1,140NE. isec. 33, T. 123, R. 67.................... 1,078Center of sec. 8. T. 123, R. 66.................. 1,100SE. isec. 20, T. 123, R. 66.................... 1,050-1,100NW. i sec. 16, T. 122. R. 67................... 1,140SE. i sec. 26, T. 122, R. 67.................... 1,000-1.060SE. isec. 4..T. 122, R. 66..................... 1,080SW. i sec. 10, T. 122, R. 66.................... 1,025-1,070NE. i sec. 19, T. 122, R. 66.................... 1,038NE. i sec. 29, T. 122, R. 66.................... 1,007-1,045
SE. isec. 30, T. 122, R. 66.................... 1,050SE. i sec. 32, T. 122, R. 66.................... 1,060SE. i sec. 33, T. 122, R. 66.................... 1,030SE. i sec. 8, T. 121, R. 67...................... 1,050+NW. i sec. 32, T. 121. R. 67................... 1,125SE. i sec. 26, T. 121, R. 67..................... 1,155SW. isec. 10, T. 121, R. 66.................... 1,000SE. isec. 29, T. 121, R. 66.................... 1,000NE.Jsec.32, T.I 21, R. 66................... 967
Fall River County: Edgemont.................... 2,920-2,965 350Faulk County:
SE. isec. 13. T. 120, R. 68.................... 1,125 25NE. isec. 19, T. 120, R. 67.................... 1,140 Many.SE. i sec. 21, T. 120, R. 67.................... 1,040± Many.SW. i sec. 1, T. 120, R. 67.................... 1,085-1,120SE. isec. 26, T. 120, R. 67.................... 1,050 Many.NW. isec. 24, T. 120, R. 67................... 1,038 35NW. isec. 6, T. 120, R. 66.................... 1,066 100SW. isec. 2, T. 120, R. 66.....'................ 1,001 65NE. isec. 26, T-. 120, R. 66.................... 965 Many.
a Approximated.6 N. a.. Darton, observer, with deep-well thermometer.c Oelrichs average for 25 years minus 0.2°.d E. S,, Nettleton, observer.« Average for 23 years./ J. E. Todd, observer.a Mitehell average plus 0.2°.ft J. H. Sheppard, observer.i Pierre average for 26 years minus 1.7°.i Average for 22 years.* Bowdfe average for 14 years minus 0.2".* Flow from 1,195 feet.m Bowdle average.« Bowdle average minus 0.2°o Taken by engineer with Darton thermometer; varied from 121p Oelrichs average, minus 0.2°.9 Faulkton average for 22 years minus 0.2°.
/5656
ft 71. 679 '
ft 68.3 65
ft 71. 673
/70.5 /63 /69 /69 /68 /69.5 /67 /67 /66 /69.5 /65.5 /65 /65.5 /65.5 /66.5765f65.5/67.5/66/64/66/65/65/64.5/64o 122
766768/67/66/69.5/67+/67.5/66.3765.5
48.9
46 <»45
«45.5 045.5 «45. 5 042 < 43. 8
i 46.1 46.4
*42 42
TO 42.2 TO 42. 2 m 42. 2 TO 42. 2 TO 42. 2 ra 42. 2 m 42.2 n» 42. 2 TO 42. 2 m 42. 2 TO 42. 2 m 42. 2 m 42. 2 TO 42. 2 m 42. 2 TO 42. 2 m 42. 2 TO 42. 2 TO 42. 2 »42 »42 "42 7i42 »42 «42 P46
842.7 ?42. 7 942.7 942.7 942.7 742.7 942.7 942.7 942.7
30.930.233.434.433.6
37
50.554.848.339.335.1
31.837.8
'42.7 38.6 39.8 54.8 44.2 41.6 44. 41.8 46. 43.5 46.2 38.5 48.9 43.fr 46.8 45. 44.5 43.7 45.1 41.9 42.9 47.8 46.8 50.2 43.5 44.4 44. 39
48.24542.846.539.142.742.942.442.3
to 122°
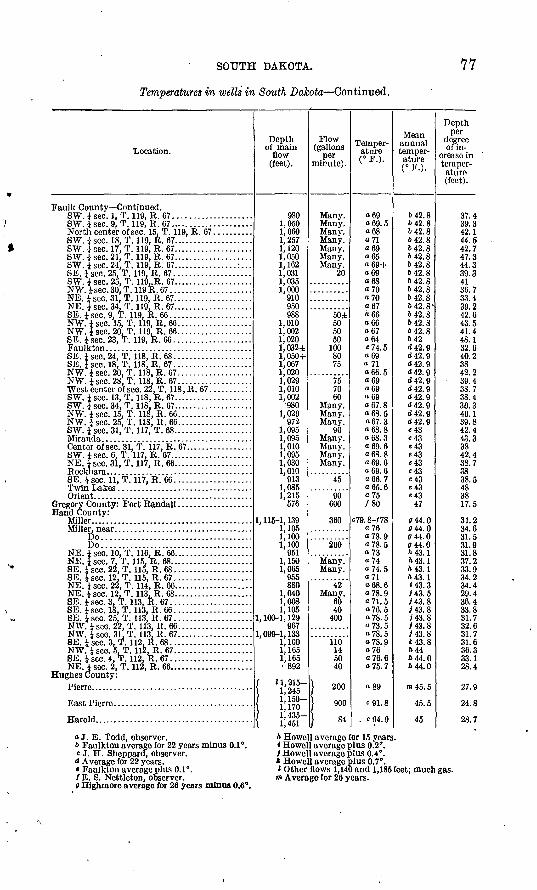
SOUTH DAKOTA.
Temperatures in wells in South Dakota Continued.
77
Location.
Faulk County Continued. SW. isec. 1, T. 119, R. 67.... ................SW. * sec. 9, T. 119, R. 67 .....................
8W. i sec. 18. T. 119. R. 67. ...................SW. -}aec. 17, T. 119, R. 67.. ..................SW. i sec. 21, T. 119, R. 67.. ..................SW. i sec. 24, T. 119, R. 67. ...............:...SE. i sec. 25, T. 119, R. 67 ....................SW. isec. 25, T. 119..R. 67........ ............NW.Jsec.30,T.119R. 67.. ...................NE. i sec. 31. T. 119, R. 67. ....................NE. i sec. 34, T. 119, R. 67....................SE.iscc.9, T. 119, R. 66. ....................NW. i sec. 15, T. 119, R. 66. ..................N W . i sec. 20, T. 1 19, R . 66 ...................SE. i sec. 23, T. 119, R. 66 ....................
SE. i sec. 24, T. 118, R. 68 ....................SE. i sec. 18, T. 118, R. 67 ....................NW. i sec. 20, T. 118, R. 67. ..................NW. i sec. 28, T. 118, R. 67 ...................
SW. i sec. 13, T. 118, R. 67. ...................SW. i sec. 34. T. 118, R . 67. ...................NW. i sec. 15, T. 118, R. 66 ...................NW. i sec. 25, T. 118, R. 66. ..................SW. i sec. 31, T. 117, T. 68.... ................
Center of sec. 31, T. 117, R. 67. ................SW. isec. 6, T. 117. R. 67.. ...................NE. | sec. 31, T. 117, R. 66. ...................
SE. i sec. 11, T. 117, R. 66 ....................
Hand County: MiHer.........................................
Do......................................Do......................................
NE. i sec. 10, T. 116, R. 66. ...................NE. i sec. 7, T. 115. R. 68. ....................SE. isec. 22, T. 115, R. 68.. ..................SE. J sec. 12, T. 115, R. 67....................NE. J sec. 22, T. 114, R. 66. ...................NE. J sec. 12. T. 113. R. 68. ...................SE. i sec. 3, T. 113, R. 67.. ...................SE. i sec. 18, T. 113, R. 66 ....................SE. £ sec. 25, T. 113, R. 67 ....................NW. i sec. 22, T. 113, R. 66. ..................NW. i sec. 31. T. 113, R. 67. ..................SE. i sec. 3, T. 112, R. 68 .....................NW. isec. 5, T. 112, R. 67....... .............SE. J sec. 4. T. 112. R. 67 .....................NE.isecJ, T. 112, R. 66....... ..............
Hughes County: Piorrc
Depth of main
flow (feet).
9801,0501,0601,2571,1201,0501,1621,0311,0351,000
910950988
1,0101,0021,0201,032±1,050+1,0671,0201,0291.0101,002
9801,029
9721,0951,0951,0101,0951,0301,010
9131,0851,215
576
1, 115-1, 1391,1051,1001,100
9511,1501,065
955880
1,0401,0081,105
1, 100-1, 129967
1,099-1,1331,1001,1651,165 892
1 1,215-1,245 1,150-1,170 1, 435-1,451
Flow (gallons
per mirute).
Many.
20
50±505050
1008075
757060
Many.
90Many.
Many.Many.
45
90600
360
200
Many.
42Many
6040
400
110145040
} 200
1 900
} 84
Temper ature (°F.).
o69o69.5068»71o69o65o69+o69068o70o70o67066066o67o64C74.5o69a 71066.5o69o69<»69o67.8o68.5o67.3068.8068.3o69.6068.8o69.6o69.6o66.7o65.6o75/80
C79.8-/78o?6o78.9»78.5o73o74o74.5a 71068.6078.9o71.5o76.5078.5o73.5o78.5o78.9o76o76.6o75.7
o89
C91.8
- CQ4.9
Mean annual temper ature (° F.).
642.8642.8642.8642.8642.8642.8642.8642.8642.8642.8642.8642.8^642.8642.8642.8642(J42.9d42.9(J42.9d42.9(J42.9<J42.90-42.9(Z42.9d42.9d42.9«43«43«43e43«43«43«43«43<43
47
(744.0044.094-1.0044.0"43.1ft 43.1ft 43.1h 43.1<43.3M3.5M3.8/43.8J43.8J43.8*43.8*43.8ft44ft 44.0ft 44.0
m45.5
45.5
45
Depth per
degree of in
crease in temper ature (feet).
37.439.342.1AA C
42.747.344.339.341W\ 733.43Q 942.643.541.448.132.640.23842.239.438.738.439.340.139.842.443.33842.438.73838.5483817.5
31.234.6si 531.931.837.233.934.234.429.436.433.831.732.631.731.636.333.128.4
27.9
24.8
28.7
o J. E. Todd, observer.6 Faulkton average for 22 years minus 0.1°.c J. H. Sheppard, observer.d Average for 22 years.« Faulkton average plus 0.1°./E. S. Nettleton, observer.o Highmore average for 26 years minus 0.6°.
A Howell average for 15 years.< Howell average plus 0.2'./ Howell average plus 0.4°.* Howell average plus 0.7°.' Other flows 1,140 and 1,185 feet; much gas.
m Average for 26 years.
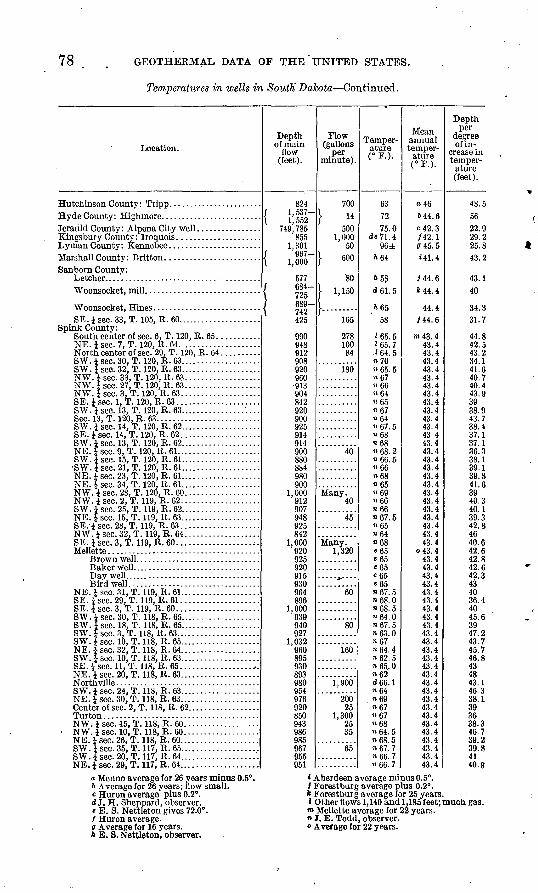
78 GEOTHERMAL DATA OF THE UNITED STATES.
Temperatures in wells in Soutti Dakota Continued.
Location.
Sanborn County:
SE.Jsec. 33, T. 105, R. 60....... ..............Spink County:
NE. i sec. 7, T. 120, K. 64. ....................North center of sec. 29, T. 120, R. 64 ..........S W. i sec. 30, T. 120, R. 63. ...................SW . J sec. 32, T. 120, R. 63. ....................NW. 1 sec. 33, T. 120, R. 63. ..................NW. i sec. 27, T. 120, R. 63. ..................NW.Jsec. 3, T. 120, R. 63....................SE . 1 sec. 1, T. 120, R. 63 .....................SW. i sec. 13, T. 120, R. 63. ...................Sec. 13, T. 120, R. 63. .........................SW. i sec. 14, T. 120, R. 62. ...................SE. J sec. 14, T. 120, R. 62. ...................SW. 1 sec. 13, T. 120, R. 62. ...................NE . J sec. 9, T. 120, R. 61. ....................
SW. 1 sec. 21, T. 120, R. 61. ...................NE. \ sec. 23, T. 120, R. 61. ...................NE. 1 sec. 34, T. 120, R. 61. ...................NW. i sec. 28, T. 120, R. 60. ..................NW. i sec. 2, T. 119, R. 62. ...................SW. i sec. 25, T. 119, R. 62. ...................NE. i sec. 15, T. 119, R. 63. ...................SE. i sec. 28, T. 119, R. 63 ....................N W. i sec. 32. T. 119. R. 64. ..................SE. i sec. 3, T. 119, R. 60. ....................Mellette ......................................
leaker well
NE. i sec. 31, T. 119, R. 61. ...................SE. 1 sec. 29, T. 119, R. 61 ....................SE. J sec. 3, T. 119, R. 60. ....................SW . i sec. 30, T. 118, R. 65. ...................S W. i sec. 18, T. 118, R. 65. ...................SW. J sec. 3, T. 118, R. 63. ....................SW. £ sec. 10, T. 118, R. 65. ...................NE. i sec. 32, T. 118, R. 64. ...................SW. i sec. 10, T. 118, R. 63. ...................SE.isec. 11, T. 118, R. 65...... ..............NE. 1 sec. 20, T. 118, R. 63. ...................
SW. i sec. 24, T. 118, R. 63. ...................NE. | sec. 30, T. 118, R. 63.. ..................Center of sec. 2, T. 118, R. 62. .................
NW. i sec. 15, T. 118, R. 60. .................. NW. j sec. 10, T. 118, R. 60. ..................
NE. i sec. 26, T. 118, R. 60. ...................SW. i sec. 35, T. 117, R. 65.... ................SW. i sec. 20, T. 117, R. 64. ..................'.NE. * sec. 29. T. 117. R. 64. ...................
Depth of main
flow (feet).
824 f 1,537- \ 1, 552
749.785 855
1.301 f 967- \ 1,000
577 !684-
725 689- 742 425
990 948 912 908 920 960 913 904 842 920 900 925 914 914 900 880 884 980 900
1,000 912 907 948 925 842
1,000 920 925 920 915 930 964 896
1,000939 940 927
1,032 960 895 930 893 980 954 976 920 850 943 986 985 967 955 951
Flow (gallons
per minute).
700
} »500
1,000 50
} 600
'80
^ 1,150
.........165
278 100
84
180
40
Many. 40
45
Many. 1,320
60
80
160
1,900
200 25
1,300 25 35
65
Temper ature (°F.).
63 7275.0
<*e71.4 96±
ft 64
ft 58 <»61.5
ft 65 58
'65.5 '65.7 '64.5 "70 "65.5 "67 "66 "64 "65 "67 "64 "67.5 "68 "68 "68.2 "66.5 "66 "68 "65 "69 "66 "66 "67.5 "65 "64 "68 e65 «65 <65 665 665 "67.5 "68.0 "68.5 »64.0 "67.5 "63.0 "67 "64.4 "62.5 «65.0 "62 (J66.1 "64 "69 "67 "67 "68 "64.5 "68.5 "67.7 "66.7 "66.7
Mean annual temper
ature (°F.).
o46 644.6c42.3 /42.1 (745.5 <41.4
*44.6 *44.4
44.4 J44.6
TO 43. 4 43.4 43.4 43.4 43.4 43.4 43.4 43.4 43.4 43.4 43.4 43.4 43.4 43.4 43.4 43.4 43.4 43.4 43.4 43.4 43.4 43.4 43.4 43.4 43.4 43.4
o43.4 43.4 43.4 43.4 43.4 43.4 43.4 43.4 43.4 43.4 43.4 43.4 43.4 43.4 43.4 43.4 43.4 43.4 43.4 43.4 43.4 43.4 43.4 43.4 43.4 43.4 43.4
Depth per
degree of in
crease in temper ature (feet).
48.5 5622.9 29.2 25.8 43.2
43.1 40
34.3 31.7
44.8 42.5 43.2 34.1 41.6 40.7 40.4 43.9 39 38.9 43.7 38.4 37.1 37.1 36.3 38.1 39.1 39.8 41.6 39 40.3 40.1 39.3 42.8 46 40.6 42.6 42.8 42.6 42.3 43 40 36.4 40 45.6 39 47.2 43.7 45.7 46.8 43 48 43.1 46.3 38.1 39 36 38.3 46.7 39.2 39.8 41 40.8
a Menno average for 26 years minus 0.5°b Average for 26 years; flow small.c Huron average plus 0.2°.d J. H. Sheppard, observer.« E. S. Nettleton gives 72.0°./ Huron average.g Average for 16 years.ft £. S. Nettleton, observer.
< Aberdeen average minus 0.5°.i Forestburg average plus 0.2°.* Forestburg average for 25 years.J Other flows 1,140 and 1,185 feet; much gas.m Mellette average for 22 years.» J. E. Todd, observer.o Average for 22 years.
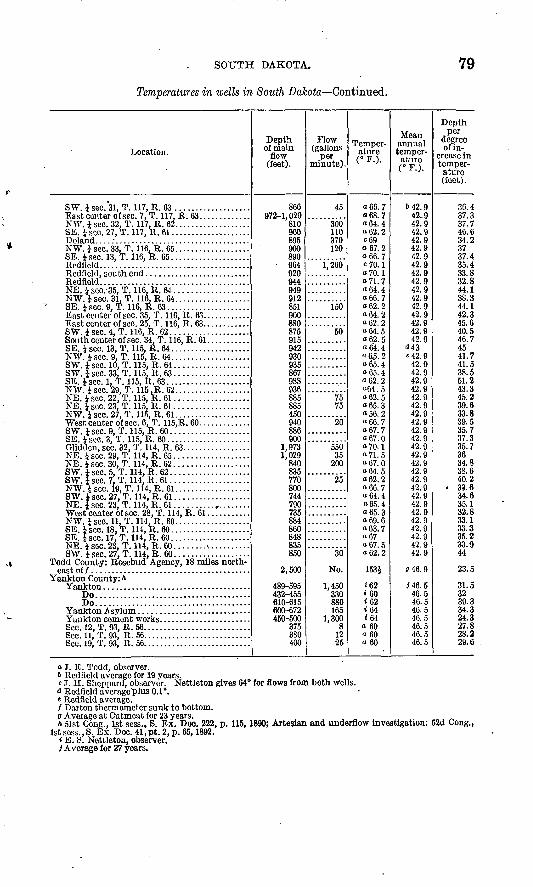
SOUTH DAKOTA.
Temperatures in wells in South Dakota Continued.
79
Location.
SW. 1 sec.°31, T. 117, R. 63 ...................East center ofsec. 7, T. 117, B. 63. ............NW. J sec. 32, T. 117, R. 62. ..................SE. i sec. 27, T. 117, R. 61 ....................Doland. ...:..................................NW. J sec. 33, T. 116, R. 65. ..................SE. i sec. 13, T. 116, R. 65.. ..................Redfield...................... ................
Redfleld. .....................................NE. i sec/35. T. 116, R. 64 ...................NW. isec. 31, T. 116. R. 64...................SE. i sec. 9, T. 116, R. 63.....................East center of sec. 35, T. 116, R. 63. ...........East center of sec. 25, T. 116, R. 63. ...........SW. i sec. 4, T. 116, R. 62 ....................
SE. i sec. 13, T. 115, R. 64 ....................NW. i sec. 9, T. 115, R. 64 ....................SW. i sec. 10, T. 115, R. 64 ...................SW. isec. 33, T. 115, R. 63..... ..............SE. i sec. 1, T. 115, R. 63 .....................NW. i sec. 29, T. 115 ,R. 62. ..................NE. i sec. 22, T. 115, R. 61 ...................NE. 1 sec. 23, T. 115, R. 61 ...................NW. isec. 27, T. 115, R. 61.......... .........
SW. 1 sec. 9, T. 115, R. 60 ....................SE. 4- sec. 3, T. 115, R. 60 .....................Glidden, sec. 32, T. 114, R. 63. ................NE. isec. 29, T. 114, R. 65. ..................NE. isec. 30, T. 114, R. 62...................SW. i sec. 5, T. 114, R. 62 ....................SW. i sec. 7, T. 114, R. 61 ....................NW. i sec. 19, T. 114, R. 61 ...................SW. i sec. 27, T. 114, R. 61 ...................NE. | sec. 23, T. 114, R. 61 ...................West center of sec. 28, T. 114, R. 61 ...........>Jw ior>f> 11 T lid p RnSE. isec. 18, T. 114, R. 60. ...................SE. | sec. 17. T. 114, R. 60 ....................NE. isec. 23, T. 114, R. 60...... ..............SW. isec. 27, T. 114, R. 60..... ..............
Todd County: Rosebud Agency, 18 miles north-
Yankton County: ft
Do.......................................Do.......................................
Sec. 12, T. 93, R. 56. ..........................Sec. 11, T. 93, R. 56. ..........................Sec. 19, T. 93, R. 56. ..........................
Depth of main
flow (feet).
866972-1,020
810900895900890964920044949912851900880875915942930935867988936885885450940886900
1,9731,029
840835770800744790735884860848835850
2,500
489-595432-455610-615600-672450-500
375380400
Flow (gallons
per minute).
45
300110370120
1,260
150
50
7575
20
55035
200
25
30
No.
1,450330880165
1,3008
1225
Temper ature (° F.).
o66.7068.7o64.4o62.2«69067.2066.7«70.1o70.1071.7064.4066.7062.2o64.2Q62.2o64.5062.5a 64. 406.5.2065.4065.4062.2Q64.5062.5065.3056.2066.7067.7067.0070;1071.5o67.0o64.5062.2066.7064.4o65.4065.3069.6o63.7o67a67.5o62.2
153J
<62»60<62<64<64
o 60o60o 60
Mean annual temper ature (° F.).
642.942..942.942.942.942.942.942.942.942.942.942.942.942.942.942.942.9
<*43«42.9
42.942.942.942.942.942.942.942.942.942.942.942.942.942.942.942.942.942.942.942.942.942.942.942.9
046.9
/46.546.546.546.546.546.546.546.5
Depth per
degree of in
crease in temper ature (feet).
36.437.337.746.634.23737.435.433.832.844.138.344.142.345.640.546.74541.741.538.551.243.345.239.633.839.535.737.335.73634.838.640.2
33.634.635.132.833.133.335.233.944
23.5
31.53239.334.324.327.828.229.6
o J. E. Todd, observer. 6 Redileld average for 19 years.c J. H. Sheppard, observer. Nettleton gives 64° for flows from both wells.
<J Redfleld average'plus 0.1°. « Redfleld average./ Darton thermometer sunk to bottom. o Average at Cutmeat for 23 years.ft 51st Cong., 1st sess., S. Ex. Doc. 222, p. 115, 1890; Artesian and underflow investigation: 52d Cong.,
1st sess., S. Ex. Doc. 41, pt. 2, p. 65,1892. i E. 8. Nettleton, observer. /Average for 27 years.
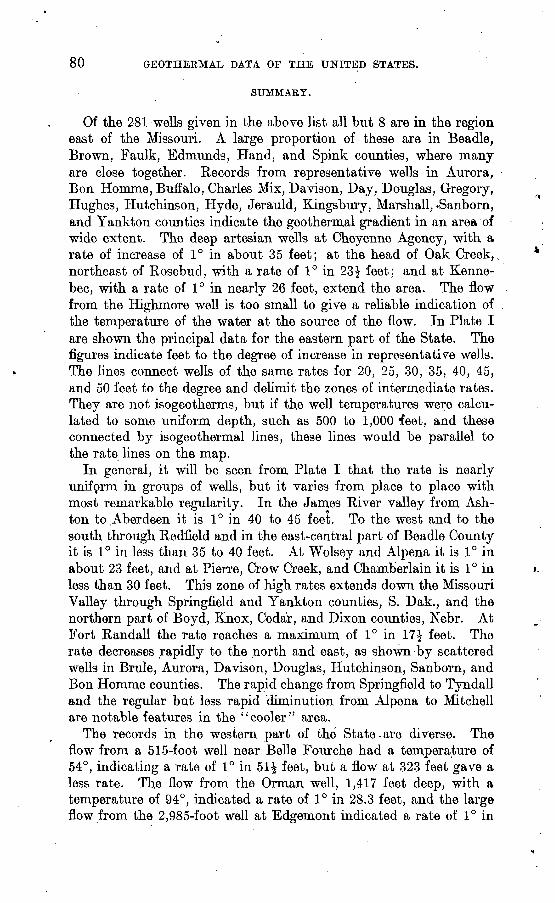
80 GEOTHERMAL DATA OF THE UNITED STATES.
SUMMARY.
Of the 281 wells given in the above list all but 8 are in the region east of the Missouri. A large proportion of these are in Beadle, Brown, Faulk, Edmunds, Hand, and Spink counties, where many are close together. Records from representative wells in Aurora, Bon Homme, Buffalo, Charles Mix, Davison, Day, Douglas, Gregory, Hughes, Hutchinson, Hyde, Jerauld, Kingsbury, Marshall, -Sanborn, and Yankton counties indicate the geothermal gradient in an area of wide extent. The deep artesian wells at Cheyenne Agency, with a rate of increase of 1° in about 35 feet; at the head of Oak Creek,, northeast of Rosebud, with a rate of 1° in 23£ feet; and at Kenne- bec, with a rate of 1° in nearly 26 feet, extend the area. The flow from the Highmore well is too small to give a reliable indication of , the temperature of the water at the source of the flow. In Plate I are shown the principal data for the eastern part of the State. The figures indicate feet to the degree of increase in representative wells. The lines connect wells of the same rates for 20, 25, 30, 35, 40, 45, and 50 feet to the degree and delimit the zones of intermediate rates. They are not isogeotherms, but if the well temperatures were calcu lated to some uniform depth, such as 500 to 1,000 *feet, and these connected by isogeothermal lines, these lines would be parallel to the rate lines on the map.
In general, it will be seen from Plate I that the rate is nearly uniform in groups of wells, but it varies from place to place with most remarkable regularity. In the James River valley from Ash- ton to Aberdeen it is 1° in 40 to 45 feet. To the west and to the south through Redfield and in the east-central part of Beadle County it is 1° in less than 35 to 40 feet. At Wolsey and Alpena it is 1° in about 23 feet, and at Pierre, Crow Creek, and Chamberlain it is 1° in less than 30 feet. This zone of high rates extends down the Missouri Valley through Springfield and Yankton counties, S. Dak., and the northern part of Boyd, Knox, Cedar, and Dixon counties, Nebr. At Fort Randall the rate reaches a maximum of 1° in 17^ feet. The rate decreases rapidly to the north and east, as shown 'by scattered wells in Brule, Aurora, Davison, Douglas, Hutchinson, Sanborn, and Bon Homme counties. The rapid change from Springfield to Tyndall and the regular but less rapid diminution from. Alpena to Mitchell are notable features in the "cooler" area.
The records in the western part of the State-are diverse. The flow from a 515-foot well near Belle Fourche had a temperature of 54°, indicating a rate of 1° in 51 £ feet, but a flow at 323 feet gave a less rate. The flow from the Orman well, 1,417 feet deep, with a temperature of 94°, indicated a rate of 1° in 28.3 feet, and the large flow from the 2,985-foot well at Edgemont indicated a rate of 1° in

U. S. GEOLOGICAL SURVEY BULLETIN 701 PLATE I
k u / !>'*.> 'r'-'.- i X J~' iULiJj^avai^ j^a. Jt aihftiouii
MAP OF EASTERN SOUTH DAKOTA AND SOUTHEASTERN NORTH DAKOTAShowing relation of configuration of bedrock floor under the artesian basin
to rates of increase of underground temperature in deep wells.
EXPLANATION
Underground cot)tours ( L'nder artesian ftajtn)Contour interval 100ft., bruken line approximate
.*?-- ;.3t ,.'
Temperature curves Figure* show itrpth in/ret per degree q/' mcreuic in temperature ax indicated by flows of refjreienlative deeii wells.

00
N.
Sh
a/e
:-:-DaK
of3:-:-:r:ss^r>c/st:one.S
ha/e
iJ5
,Sft3
/e
&
-§ .2 o 1
"§
^r^Cw
O
«*
j§
IS5 -s - -§s ^ ^2
5 ®
So w>:g
§
jl
S *
ij^t!
<ri Q
= 11
rtzffi
Ho
rizon
tal s
cale
25
SO75 M
ilesV
ertic
al s
cale
O
5,0
00 F
ee
t
Pi
P-
flfi
O ^
O
^
rO co
-*^>J
<
-r-l
o -3
JH
O
O
o
r
S.&l>s 03
FlG
UE
E
i-3
bJO
-2 ^CJ
^W
£
® ~
r^l
JO
-U
I t
g-u
feft<so «
-g W
g0
rt03
rS
0«3Oeo^ 0̂3-s
3. Sections across
sandstone, the many wells
given on
the list draw
from the Dakota and
associated sand
stones. In the western
eastern
part of the State these sandstones
overlie
South
o3
nd fl«3
^<x> pq' d o&
thick succession of
Dakota.
Paleozoic limestonesand
sandstones, but
o c*-c
d ""32
0
g
0
*>° A
OS
1, Section from
west to east;
2, section from north to south.
. s
eS o
<D p!
is.fi'sisiiiii^iiii-sii M
"^lia«
fa.ll:i.;iiisiill|i: j|.,|.. 4
!1|ll1
l!j^«illL
.!ilQ
j^ftO
oP
^S
fl^cn
O-^P
io
S'isS
tS
^
'S
CT'E-i
'En
1ii0a aPa
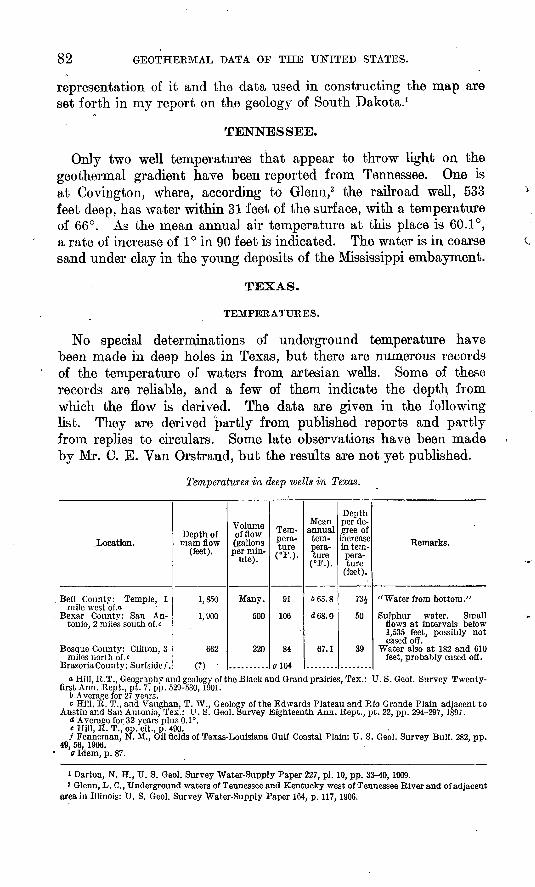
GEOTHEEMAL DATA OF THE UNITED STATES.
representation of it and the data used in constructing the map are set forth in my report on the geology of South Dakota. 1
TENNESSEE.
Only two well temperatures that appear to throw light on the geothermal gradient have been reported from Tennessee. One is at Covington, where, according to Glenn,2 the railroad well, 533 feet deep, has water within 31 feet of the surface, with a temperature of 66°. As the mean annual air temperature at this place is 60.1°, a rate of increase of 1° in 90 feet is indicated. The water is in coarse sand under clay in the young deposits of the Mississippi embayment.
TEXAS.
TEMPERATURES.
No special determinations of underground temperature have been made in deep holes in Texas, but there are numerous records of the temperature of waters from artesian wells. Some of these records are reliable, and a few of them indicate the depth from which the flow is derived. The data are given in the following list. They are derived partly from published reports and partly from replies to circulars. Some late observations have been made by Mr. C. E. Van Orstrand, but the results are not yet published.
Temperatures in deep wells in Texas.
.Location.
Bell County: Temple, 1mile west of.o
Bexar County: San Antonio, 2 miles south of.c
Bosque County: Clifton, 3miles north of.e
BrazoriaCountv: Surf side/.
Depth of main flow
(feet).
1,850
1,900
662
m
Volume of flow (gallons per min
ute).
Many.
500
220
Tem pera ture
91
106
84
0104
Mean annual tem pera ture
665.8
<*68.0
67.1
Depthper de gree of
increase in tem pera ture
(feet).
73J
50
39
Remarks.
"Water from bottom."
Sulphur water. Smallflows at intervals below1,535 feet, possibly notcased off.
Water also at 182 and 610feet, probably cased off.
a Hill, R.T., Geography and geology of the Black and Grand prairies, Tex.: U. S. Geol. Survey Twenty- first Ann. Kept., pt. 7, pp. 529-530, 1901.
6 Average for 27 years.c Hill, R. T., and Vaughan, T. W., Geology of the Edwards Plateau and Rio Grande Plain adjacent to
Austin and San Antonio, Tex.: IT. S. Geol. Survey Eighteenth Ann. Rept., pt. 22, pp. 294-297, 1897.d Average for 32 years plus 0.1°.« Hill, R. T., pp. cit., p. 490. / Fennen
49, 56, 1906.
., op. / Fenneman, N. M., 'Oil fields of Texas-Louisiana Gulf Coastal Plain: U. S. Geol. Survey Bull. 282, pp.
a Idem, p. 87.
» Darton, N. H., U. S. Geol. Survey Water-Supply Paper 227, pi. 10, pp. 33-40,. 1909. * Glenn, L. C., Underground waters of Tennessee and Kentucky west of Tennessee River and of adjacent
area in Illinois: U. S. Geol. Survey Water-Supply Paper 164, p. 117,1906.
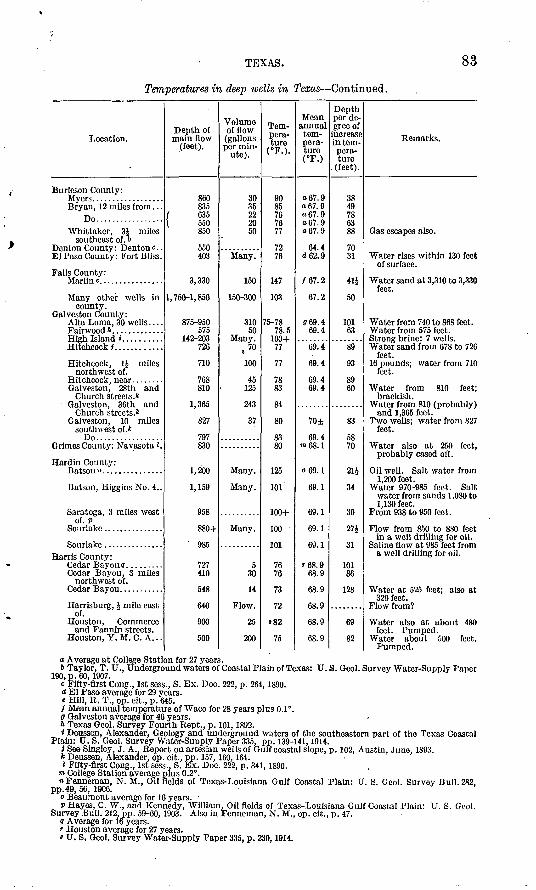
TEXAS. 83
Temperatures in deep wells in Texas Continued.
Location.
Burleson County:
Bryan, 12 miles from. . . Do.................
Whittaker, 3J miles southeast of. 6
El Paso County: Fort Bliss.
Falls County:
Many other wells in county.
Galveston County: Alta Loma, 30 wells. . . .
High Island t. .........
Hitchcock, 1J miles northwest of.
Galveston, 28th and Church streets.*
Church streets.* Galveston, 10 miles
southwest of.* Do.................
Hardin County:
Batson, Higgins No. 4..
of. P
Harris County:
Cedar Bayou, 3 miles northwest of.
of. Houston, Commerce
and Fannin streets. Houston, Y.M.C. A...
Depth of main flow
(feet).
860835
f 635\ 550
850
550403
3,330
1,750-1,850
875-950 575
142-203726
710
768810
1,365
827
797830
1,200
1,159
958
880+
' 985
727410
548
640
900
500
Volume of flow (gallons per min
ute).
3035 2220 50
Many.
150
150-300
310 50
,70
100
45125
243
37
Many.
530
14
25
200
Tem pera ture
(°F.).
9085 767677
7276
147
103
75-78 78.5
100+77
77
7883
at
80
8380
125
101
inn 4-
100 '
101
7676
73
72
«82
75
Mean annual tem pera ture (°F.)
o67.9o67.9 o67.9o67.9 o67.9
64.4d62.9
/67.2
67.2
(769.4 69.4
69.4
69.4
69.469.4
70±
69.4m 68.1
069.1
69.1
69.1
69.1
fid i
r68.968.9
ftS O
68.9
68.9
68.9
Depth per de gree of
increase in tem pera ture
. (feet).
38497863 88
7031
«i50
101 63
89
93
8960
83
5870
21J
34
30O7JL
qi
10186
19Q
69
82
Eemarks.
Gas escapes also.
Water rises within 130 feet of surface.
Water sand at 3,310 to 3,330feet.
Water from 740 to 868 feet.
Water sand from 678 to 726feet.
16 pounds; water from 710 feet.
Water from 810 feet; brackish.
and 1,365 feet. Two wells; water from 827
feet.
probably cased off.
1,200 feet. Water 970-985 feet. Salt
water from sands 1,080 to 1,130 feet.
Flow from 850 to 880 feetin a well drilling for oil.
a well drilling for oil.
"Wfltcr &t 525 foot* £ilso fit320 feet.
Water also at about 480 feet. Pumped.
Water about 500 feet. Pumped.
o Average at College Station for 27 years.6 Taylor, T. U., Underground waters of Coastal Plain of Texas: U. S. Geol. Survey Water-Supply Paper
190, p. 60,1907.c Fifty-first Cong., 1st sess., S. Ex. Doc. 222, p. 264, 1890.<J El Paso average for 29 years.e Hill, R. T., op. cit., p. 645./ Mean annual temperature of Waco for 28 years plus 0.1°.g Galveston average for 46 years.ft Texas Geol. Survey Fourth Kept., p. 101,1892.< Deussen, Alexander, Geology and underground waters of the southeastern part of the Texas Coastal
Plain: U. S. Geol. Survey Water-Supply Paper 335, pp. 139-141,1914.i See Singley. J. A., Report on artesian wells of Gulf coastal slope, p. 102, Austin, June, 1893.* Deussen, Alexander, op. cit., pp. 157,160,164.i Fifty-first Cong., 1st sess., S, Ex. Doc. 222, p. 341,1890.
m College Station average plus 0.2°.nFenneman, N. M., Oilfields of Texas-Louisiana Gulf Coastal Plata: U. S. Geol. Survey Bull. 282,
pp.49, 56, 1906.o Beaumont average for 16 years.p Hayes, C. W., and Kennedy, William, Oil fields of Texas-Louisiana Gulf Coastal Plain: U. S. Geol.
Survey Bull. 212, pp. 59-60,1903. Also in Fenneinan, N. M., op. cit., p. 47.? Average for 16 years.r Houston average for 27 years.» U. S. Geol. Survey Water-Supply Paper 335, p. 230,1914.

84 GEOTHERMAL DATA OF THE UNITED STATES.
Temperatures in deep wells in Texas Continued.
Location.
Hays County: San Marcos .
Jefferson County: Beaumont. 1 mile west
of.
La Salle County: Cotulla c.
Matagorda County: Big Hill.
McLennan County:
China Springs, 12 miles northwest of Waco.
Hermosa, near Waco. - .
Waco:
Moore's well ft .....
11 wells of Water Co.<
Nacogdoches County: Na cogdoches.
Navarro County:
Corsicana No. 2........
Tarrant County: Fort Worth............
Marine, £ mile northeast Travis County:
Austin Natatorium r. . .
Waller County: Hempstead Williamson County:
Roundrock. Zavalla County: Carrizo
Springs, 22 miles north.
Depth of main flow
(feet).
1,490
1,034
1,400±
1,008
722
1,565
1,380
1,730
1 030
991
1,4701,852'
1,828-1,860
1,607 1,812 1,820 1,860
1,776 1,866
500
2,4832,515
2,500
3,250
1,200
1,875
2,560
1,131 1,400
910
Volume of flow (gallons per min
ute).
100
8
Many.
Many.
150
Many.
150
350
350Many.
Many.
Many. Many. Many. Many.
Many. Many.
500
200200
200
545
300
700
100 Many.
Several.
Tem pera ture (°F.).
73
o4
o80
86
99.6
95
102
103
82 1
82
90103
103
97 100 102J 103
103 103J
ft 74
126126
126
ol26
78
100
93
80 95
J/90
Mean annual tem pera ture (°F.).
67.5
669.1
69.1
(*71
«70
/67.1
67.1
67.1
67.1
67.1
67.1 7.1
67.1
67.1 67.1 67.1 67.1
67.1 67.1
J65.4
66
66
P65
65
«67.4
67.4
to 68. 6 a; 67. 4
z72
Depth per de gree of
increase in tem pera ture
(feet).
271
204
128±
67
23J
56' 37
48
69
66£
6451i
51
53J 55 51 52
49J 51
39J
4140
«i
18i
74
*51
»48i
97i 51
40
Remarks.
Small flow at 1,345 feet, probably cased off.
Flow from 1,000 feet; higher flows may mingle.
Source not known. Flow supposed to be from
1,008 feet. Flow from 700-730 feet.
cased off. Flows at 500, 600, 800, and
1,100 feet, probably cased off.
Flows at 670 and 1,400 feet. (Hill.)
(Hill.)
Caused to 735 feet.First water at 1,000 feet.
(Hill.) Flows at 700-800 and 1,100
feet also. Do. Do. Do.
Flow from 1.800 to 1,815 feet. (Hill.)
Sandstone, 1,760-1,861 feet. (Hill.) 1
Flow from 340-500 feet.
Water sand, 2,400 to 2,460feet.
feet. Water from 960-1,000 feet.?
Cased to 1,100 feet. Small flow at 1,215 feet; not cased oft. Mainflow 1,875 feet from sandstone (1,675 to 1,875 feet).
Water-bearing rock 1,250 to1,400 feet.
Flow from 1,110 feet. Pumped.
Cased 720 feet to main flow.
a U. S. Geol. Survey Water-Supply Paper 335, p. 265,1914.
t> Average for 16 years.c Rept. Special Comm. on Irrigation and Recla
mation of Arid Lands, U.S. Senate, vol. 4, p. 62,1890.d Eagle Pass average for 40 years.e Galveston average plus 0.6°./ Waco average for 28 years.g Rossler, A. R., Report on preliminary investi
gation to determine proper location of artesian wells within the area of the 97th meridian and east of the foothills of the Rocky Mountains: 51st Cong., S. Ex. Doc. 222, p. 257,1890.
ft 51st Cong., 1st sess., S. Ex. Doc. 222, p. 340,1890.< Hill, R. T.. op. cit., p. 108./ Idem, p. 542.* Average for 28 years.l Average for 18 years.
m Hill, R. T., op. Cit., p. 311.« Hill, R. T., op. cit., p. 641.o Idem, p. 576.V Average for 22 years.q Hill, R. T., op. cit., p. 577.r U. S. Geol. Survey Eighteenth Ann. Rept., pt.
2, p. 284.* Average for 61 years.< Calculated to 1,675 feet.« U. S. Geol. Survey Eighteenth Ann. Rept., pt.
2, pp. 284-286,1898; Twenty-first Ann. Rept., pt. 7, pp. 511-514. 1901; Water-Supply Paper 335, p. 355, 1914.
» Calculated to 1,250 feet.to Houston average minus 0.3°.z Austin average.v Eagle Pass average plus 0.1°.2 U. S. Geol. Survey Bull. 298, p. 286,1906.

C TEXAS. 85
SUMMARY.
It is difficult to judge the relative values of the Texas temperature records. Some may not be correct, and others may not represent the temperature at the depth stated owing to the mingling of flows. The flow from the deep well at Marlin is supposed to come from a depth of 3,350'feet, and if so it indicates a rate of 1° in 42 feet. The several wells at Waco, not far southeast of Marlin, give rates of 1° in 49$ to 53 feet. Other wells in the same county (McLennan) indicate 1° in 48, 64, 66$, 69, and 56 feet, but the apparent lower rate is possibly due to the ingress of higher waters. The warm flow from a depth of 1,380 feet at China Springs, 12 miles northwest of Waco, indicates the exceptionally high rate of 1° in nearly 37 feet. A similar rate is indicated by the Clifton well in Bosque County, about 25 miles northwest of China Springs. The three deep wells at Corsicana, still farther north, give a rate of 1° in 40 to 41$ feet. Fort Worth has a rate of 1° in 18$ feet if all the flow is derived from a depth of 1,127 feet, as stated. The rate at Nacogdoches may be as high as 1° in 39$ feet if the flow comes from a depth of 340 feet. The Austin wells indicate rates of 1° in 48$ and 51 feet, but the true rate here may be considerably less if the flow is from a deeper source' than the depth used in the calculations. The Round Rock figure is uncertain, but the rates for Hempstead and Navasota appear to be valid. The data for Harris County, Port Arthur, and Beaumont are not satisfactory,, and the wells 2 miles south of San Antonio and at Cotulla and Temple may not give reliable data. The temperature given for the San Marcos well is doubtless unreliable. The five wells in Hardin County appear to have rates of 1° in 21$, 27$, 30, 31, and 34 feet, without likelihood of much error. The Big Hill 722-foot well has a similar rate, and the High Island well evidently indicates a steep rate. The rate indicated by the Galveston County wells varies, but the figures 60 and 63 feet to the degree appear the most accurate, there being uncertainty as to the source of the water in the others. As the water at Fort Bliss is pumped the temperature given may not be as high as that in the bottom of the well, but the figure given (76°) indicates that the rate is 1° in at least 31 feet.
GEOLOGIC RELATIONS.
The wells in the above list penetrate a great variety of formations, which are mostly, however, of Cretaceous and Tertiary age. In most parts of the area the shales are tilted at low angles and in places traversed by faults. No igneous rocks are reported near any of the wells listed, and the granites or other old bedrocks are far beneath the surface. The wells in the southeastern part of the State and along the coast draw from sands of Tertiary age. In the oil fields of Hardin County there are sharp local uplifts or domes. The Nacogdoches well draws from lower beds in the Eocene.
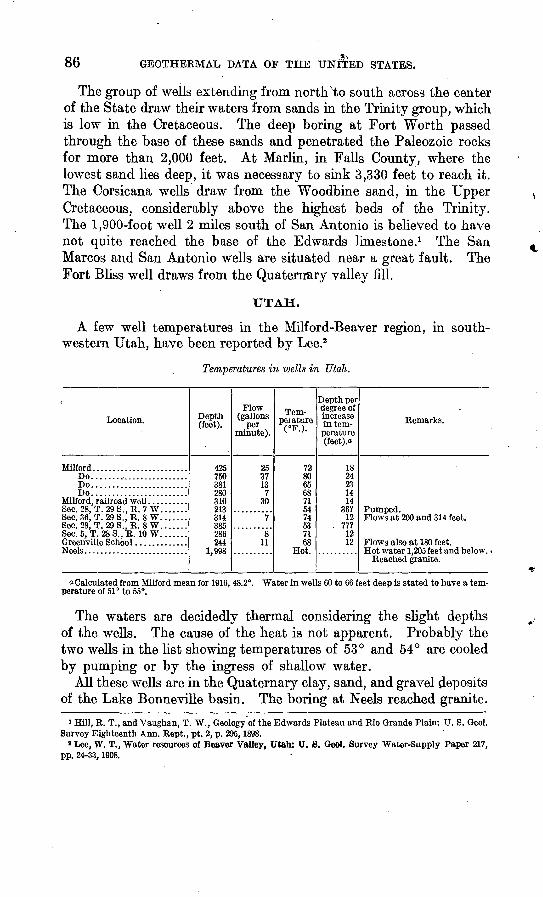
86 GEOTHERMAL DATA OF THE UNITED STATES.
The group of wells extending from north Nto south across the center of the State draw their waters from sands in the Trinity group, which is low in the Cretaceous. The deep boring at Fort Worth passed through the base of these sands and penetrated the Paleozoic rocks for more than 2,000 feet. At Marlin, hi Falls County, where the lowest sand lies deep, it was necessary to sink 3,330 feet to reach it. The Corsicana wells draw from the Woodbine sand, in the Upper Cretaceous, considerably above the highest beds of the Trinity. The 1,900-foot well 2 miles south of San Antonio is believed to have not quite reached the base of the Edwards limestone.1 The San Marcos and San Antonio wells are situated near a great fault. The Fort Bliss well draws from the Quaternary valley fill.
UTAH.
A few well temperatures in the Milford-Beaver region, in south western Utah, have been reported by Lee.2
Temperatures in wells in Utah.
Location.
Milford...... ..................Do.........................Do........................Do........................
Sec. 28. T. 29 S.. R. 7 W. . . . . . .Sec. 36. T. 29 S.. R. 8 W. . . . . . .Sec. 28, T. 29S..R. 8W.......Sec. 5, T. 28 S., R. 10 W. ......Greenville School .............
Depth (feet).
425750381280310213314385286244
1,998
Flow (gallons
per minute).
253713
730
7
811
Tem perature ( P.).
72806568715474537168
Hot.
Depth per degree of increase in tem perature (feet).o
1824231414
36?12
. 77?1212
Remarks.
Flows also at 180 feet.
Reached granite.
a Calculated from Milford mean for 1916, 48.2°. Water in wells 60 to 66 feet deep is stated to have a tem perature of 51° to 55°.
The waters are decidedly thermal considering the slight depths of the wells. The cause of the heat is not apparent. Probably the two wells in the list showing temperatures of 53° and 54° are cooled by pumping or by the ingress of shallow water.
All these wells are in the Quaternary clay, sand, and gravel deposits of the Lake Bonneville basin. The boring at Neels reached granite.
1 Hill, R. T., and Vaughan, T. W., Geology of the Edwards Plateau and Rio Grande Plain: U. S. Geol. Survey Eighteenth Ann. Kept., pt. 2, p. 295,1898.
s Lee, W. T., Water resources of Beaver Valley, Utah: U. S. Geol. Survey Water-Supply Paper 217, pp. 24-33,1908.
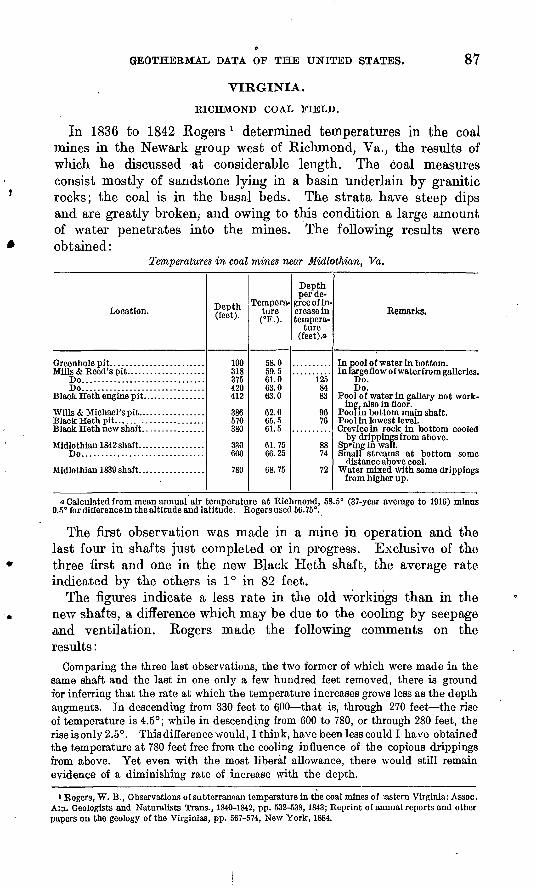
GEOTHERMAL DATA OF THE UNITED STATES. 87
VIRGINIA.
RICHMOND COAL FIELD.
In 1836 to 1842 Rogers l determined temperatures in the coal mines in the Newark group west of Richmond, Va., the results of which he discussed ^at considerable length. The coal measures consist mostly of sandstone lying in a basin underlain by granitic rocks; the coal is in the basal beds. The strata have steep dips and are greatly broken, and owing to this condition a large amount of water penetrates into the mines. The following results were obtained:
Temperatures in coal mines near Midlothian, Va.
Location.
Do...............................Do...............................
Wills & Michael's pit.... . ............Black Heth pit... . ...................
Midlothian 1842 shaft.... . ............Do...............................
Midlothian 1839 shaft.. ...............
Depth (feet).
100 318 375 420 412
386 570 380
330 600
780
Tempera ture (°F.).
58.0 59.5 61.0 63.0 63.0
62.0 65.5 61.5
61.75 66.25
68.75
Depth per de
gree of in crease in tempera
ture (feet).a
12584 83
96 76
88 74
72
Remarks.
In pool of water in bottom. In large flow o f water from galleries.
Do. Do.
Pool of water in gallery not work ing, also in floor.
Poolin bottom main shaft. Pool in lowest level. Crevice in rock in bottom cooled
by drippings from above. Spring in waD. Small streams at bottom some
distance above coal. Water mixed with some drippings
from higher up.
a Calculated from mean annual air temperature at Richmond, 58.5° (37-year average to 1916) minus 0.5° for difference in the altitude and latitude. Rogers used 56.75°.
The first observation was made in a mine in operation and the last four in shafts just completed or in progress. Exclusive of the three first and one in the new Black Heth shaft, the average rate indicated by the others is 1° in 82 feet.
The figures indicate a less rate in the old workings than in the new shafts, a difference which may be due to the cooling by seepage and ventilation. Rogers made the following comments on the results:
Comparing the three last observations, the two former of which were made in the same shaft and the last in one only a few hundred feet removed, there is ground for inferring that the rate at which the temperature increases grows less as the depth augments. In descending from 330 feet to 600 that is, through 270 feet the rise of temperature is 4.5°; while in descending from 600 to 780, or through 280 feet, the riseisonly 2.5°. This difference would, I think, have been less could I have obtained the temperature at 780 feet free from the cooling influence of the copious drippings from above. Yet even with the most liberal allowance, there would still remain evidence of a diminishing rate of increase with the depth.
» Rogers, W. B., Observations of subterranean temperature in the coal mines of eastern Virginia: Assoc. An. Geologists and Naturalists Trans., 1840-1842, pp. 532-538, 1843; Reprint of annual reports and other papers on the geology of the Virginias, pp. 567-574, New York, 1884.

88 GEOTHERMAL DATA OF THE UNITED STATES.
Rogers considered the observations at 330 and 600 feet in the Midlothian shaft the most reliable, and these give a rate of 1° in 88 and 74 feet, respectively; the difference between them is 1° in 60 feet. The rate for the 780-foot reading (1° in 72 feet) is accordant, although, as suggested by Rogers, the water may be cooled slightly by drippings from above.
FORT MONROE.
In 1902 a 2,130-foot boring was made at Fort Monroe, and Capt. C. P. Townsley kindly lowered a Darton thermometer in it. After two hours the instrument recorded 92.5°. As the mean annual air temperature at Newport News is about 59.4°, a rate of 1° in 64 feet is indicated. The boring passed through Tertiary and Cretaceous formations of the Coastal Plain to the basement of pre-Cambrian granite. The hole was full of salty water.
REEDVILLE.
At Reedville, in Northumberland County, the 85-gallon flow from a 680-foot well is reported to have a temperature of 78°. As calculated from the mean annual air temperature at Warsaw, 56.4°, a rate of 1° in 31£ feet is indicated.
WASHINGTON.
YAKIMA ARTESIAN BASIN.
There are numerous flowing wells in the vicinity of Yakima which afford data as to underground temperature. In most of them, however, several flows are intermixed, so that the observations do not indicate the temperature at any definite depth. There are three wells which reach the upper flow only and three others in which the casing is so set that only one flow can enter. They are in an area about 1J miles long.and within 120 feet elevation. The data for these six wells, as given by Geo. Otis Smith,1 are as follows:
Temperature at different depths in six wells in Yakima artesian basin, Wash
Depth of flow (feet).
515 637 835 625 752 820
Flow (gal- Ions per minute).
Many. 120 60
Many. 300 360
Tempera ture (° F.).
70.7 72.2 73.2 73.2 72.2 72.7
Depth per degree of
increase in tempera
ture (feet).o
25.0 28.0 36.1 27.0 34.0 36.2
<j Calculated on basis of mean annual air temperature of 50.1°, mean of 17 years given by United States Weather Bureau.
1 Smith, G. O., Geology and water resources of a portion of Yakima County, Wash.: U. S. Geol. Survey Water-Supply Paper 55, pp. 49-62,1901.
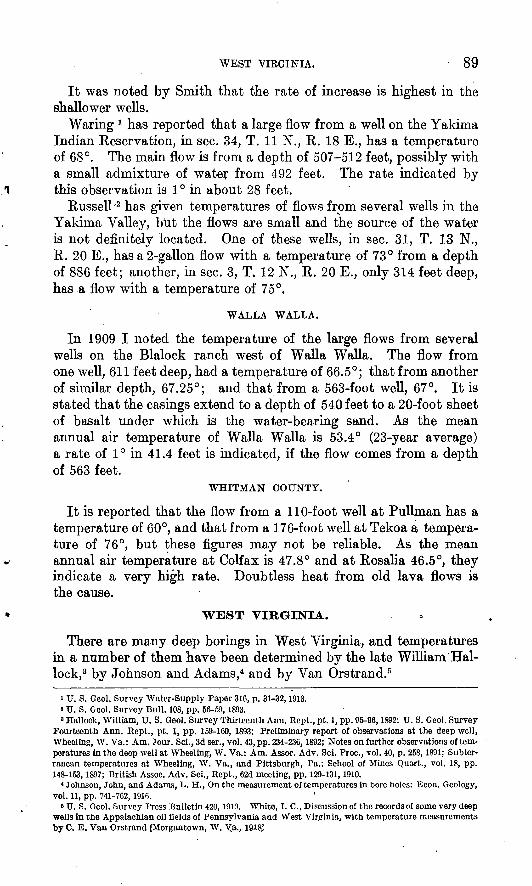
WEST VIRGINIA. 89
It was noted by Smith that the rate of increase is highest in the shallower wells.
Waring 1 has reported that a large flow from a well on the Yakima Indian Reservation, in sec. 34, T. 11 N., R. 18 E., has a temperature of 68°. The main flow is from a depth of 507-512 feet, possibly with a small admixture of water from 492 feet. The rate indicated by this observation is 1° in about 28 feet.
Russell'2 has given temperatures of flows from several wells in the Yakima Valley, but the flows are small and the source of the water is not definitely located. One of these wells, in sec. 31, T. 13 N., R. 20 E., has a 2-gallon flow with a temperature of 73° from a depth of 886 feet; another, in sec. 3, T. 12 N., R. 20 E., only 314 feet deep, has a flow with a temperature of 75°.
WALLA WALLA.
In 1909 I noted the temperature of the large flows from several wells on the Blalock ranch west of Walla Walla. The flow from one well, 611 feet deep, had a temperature of 66.5°; that from another of similar depth, 67.25°; and that from a 563-foot well, 67°. It is stated that the casings extend to a depth of 540 feet to a 20-foot sheet of basalt under which is the water-bearing sand. As the mean annual air temperature of Walla Walla is 53.4° (23-year average) a rate of 1° in 41.4 feet is indicated, if the flow comes from a depth of 563 feet.
WHITMAN COUNTY.
It is reported that the flow from a 110-foot well at Pullman has a temperature of 60°, and that from a 176-foot well at Tekoa a tempera ture of 76°, but these figures may not be reliable. As the mean annual air temperature at Colfax is 47.8° and at Rosalia 46.5°, they indicate a very high rate. Doubtless heat from old lava flows is the cause.
WEST VIRGINIA.
There are many deep borings in West Virginia, and temperatures in a number of them have been determined by the late William Hal- lock,3 by Johnson and Adams/ and by Van Orstrand.5
1 U. S. Geol. Survey Water-Supply Paper 316, p. 31-32,1913.« U. S. Geol. Survey Bull. 108, pp. 56-59,1893.8 Hallock, William, U. S. Geol. Survey Thirteenth Ann. Kept., pt. 1, pp. 95-96,1892; U. S. Geol. Survey
Fourteenth Ann. Kept., pt. 1, pp. 159-160, 1893; Preliminary report of observations at the deep well, Wheeling, W. Va.: Am. Jour. Sci., 3d ser., vol. 43, pp. 234-236,1892; Notes on further observations of tem peratures in the deep well at Wheeling, W. Va.: Am. Assoc. Adv. Sci. Proc., vol. 40, p. 258,1891; Subter ranean temperatures at Wheeling, W. Va., and Pittsburgh, Pa.: School of Mines Quart., vol. 18, pp. 148-153,1897; British Assoc. Adv. Sci., Kept., 62d meeting, pp. 129-131,1910.
< Johnson, John, and Adams, L-. H., On the measurement of temperatures in bore holes: Econ. Geology, vol. 11, pp. 741-762, 1916.
& U. S. Geol. Survey Press Bulletin 420,1919. White, I. C., Discussion of the records of some very deep wells In the Appalachian oil fields of Pennsylvania and West Virginia, with temperature measurements by C. E. Van Orstrand [Morgantown, W. Ya., 1918J
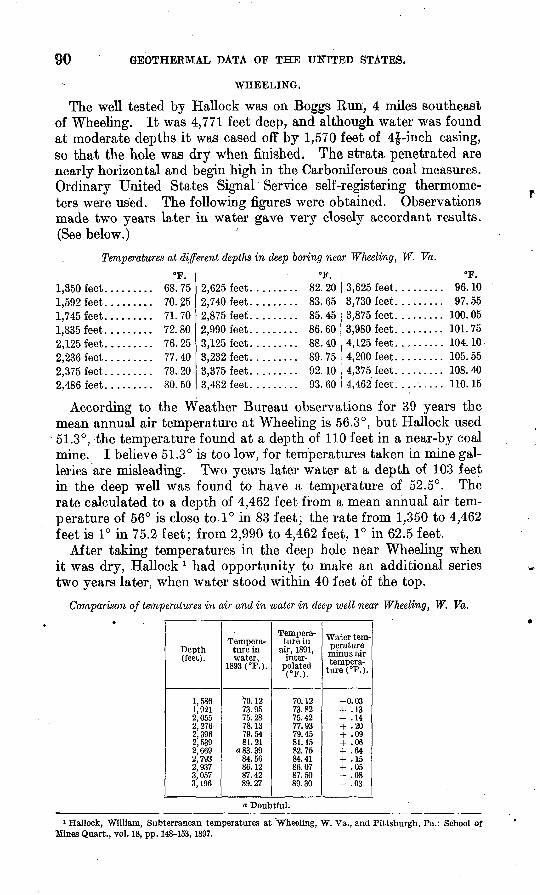
90 GEOTHERMAL DATA OF THE UNITED STATES.
WHEELING.
The well tested by Hallock was on Boggs Run, 4 miles southeast of Wheeling. It was 4,771 feet deep, and although water was found at moderate depths it was cased off by 1,570 feet of 4£-inch casing, so that the hole was dry when finished. The strata penetrated are nearly horizontal and begin high in the Carboniferous coal measures. Ordinary United States Signal Service self-registering thermome ters were used. The folio whig figures were obtained. Observations made two years later in water gave very closely accordant results. (See below.)
Temperatures at different depths in deep boring near Wheeling, W. Va.
1,350 feet......... 68.751,592 feet......... 70.251,745 feet......... 71.701,835 feet......... 72.802,125 feet......... 76.252,236 feet......... 77.402,375 feet......... 79.202,486 feet. ........ 80.50
2,625 feet......... 82.202,740 feet......... 83.652,875 feet......... 85.452,990 feet......... 86.603,125 feet......... 88.403,232 feet......... 89.753,375 feet......... 92.103,482 feet......... 93.60
3,625 feet......... 96.103,730 feet......... 97.553,875 feet......... 100.053,980 feet......... 101.754,125 feet......... 104.104,200 feet......... 105.554,375 feet......... 108.404,462 feet......... 110.15
According to the Weather Bureau observations for 39 years the mean annual air temperature at Wheeling is 56.3°, but Hallock used 51.3°, the temperature found at a depth of 110 feet in a near-by coal mine. I believe 51.3° is too low, for temperatures taken in mine gal leries are misleading. Two years later water at a depth of 103 feet in the deep well was found to have a temperature of 52.5°. The rate calculated to a depth of 4,462 feet from a mean annual air tem perature of 56° is close to 1° in 83 feet; the rate from 1,350 to 4,462 feet is 1° in 75.2 feet; from 2,990 to 4,462 feet, 1° in 62.5 feet.
After taking temperatures in the deep hole near Wheeling when it was dry, Hallock l had opportunity to make an additional series two years later, when water stood within 40 feet of the top.
Comparison of temperatures in air and in water in deep well near Wheeling, W. Va.
Depth (feet).
1,5861.9212; 0552, 2762,3962,5392,6692,7932,9373,0573,196
Tempera ture in water,
1893 (°F.).
Y0.1273.9575.2878.1379.5481.21
o83.3984.5686.1287.4289.27
Tempera ture in
air, 1891, inter
polated (°F.).
70.1273.8275.4277.9379.4581.1582.7584.4186.0787.5089.30
Water tem perature minus air tempera
ture (°P.).
-0.03+ .13- .14+ .20+ .09+ .06+ .64+ .15+ .05- .08- .03
Doubtful.
1 Hallock, William, Subterranean temperatures at Wheeling, W. Va., and Pittsburgh, Pa.: School of Mines Quart., vol. 18, pp. 148-153,1897.
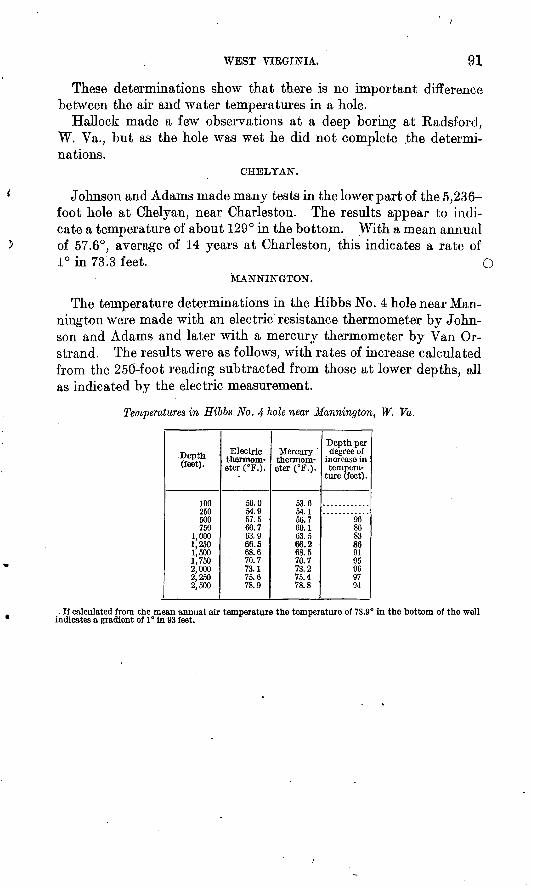
WEST VIRGINIA. 91
These determinations show that there is no important difference between the air and water temperatures in a hole.
Hallock made a few observations at a deep boring at Radsford, W. Va., but as the hole was wet he did not complete .the determi nations.
CHELYAN.
Johnson and Adams made many tests in the lower part of the 5,236- foot hole at Chelyan, near Charleston. The results appear to indi cate a temperature of about 129° in the bottom. With a mean annual of 57.6°, average of 14 years at Charleston, this indicates a rate of 1° in 73.3 feet. O
MANNINGTON.
The temperature determinations in the Hibbs No. 4 hole near Man- nington were made with an electric resistance thermometer by John son and Adams and later with a mercury thermometer by Van Or- strand. The results were as follows, with rates of increase calculated from the 250-foot reading subtracted from those at lower depths, all as indicated by the electric measurement.
Temperatures in Hibbs No. 4 hole near Mannington, W. Va.
Depth (feet).
innAuU250500750
1,0001.2501,5001,7502,0002.2502,500
Electric thermom eter (°F.).
56.0M o . u57.560.763.966.568.670.773.175.678.9
Mercury thermom eter (°F.).
CO Roo. o54.156.760.163.566.268.570.773.275.478.8
Depth perdegree of
increase in tempera
ture (feet).
968683869195969794
If calculated from the mean annual air temperature the temperature of 78.9° in the bottom of the well indicates a gradient of 1° in 93 feet.
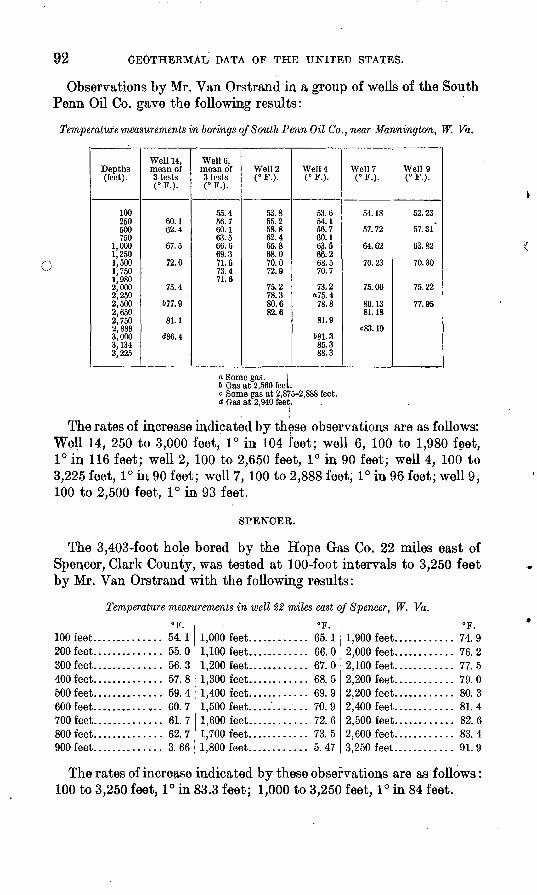
92 GEOTHERMAL DATA OF THE UNITED STATES.
Observations by Mr. Van Orstrand in a group of wells of tbe South Penn Oil Co. gave the following results:
Temperature measurements in borings of South Penn Oil Co., near Mannington, W. Fa.
O
Depths (feet).
100250500750
1,0001,2501.5001,7501,9802,0002,2502,5002,6502,7502,8883,0003,1343,225
Well 14, mean of 3 tests ("P.).
60.162.4
67.5
72.0
75.4
677.9
81.1
"J86.4
Well 6, mean of 3 tests ( P.).
55.456.760.163.566.669.371.673.471.6
Well 2 ("P.).
53.855.258.862.465.868.070.072.9
75.278.380.682.6
Well 4 ( P.).
53.654.156.760.163.566.268.570.7
73.2o75.478.8
81.9
681.385.388.3
Well 7 ( P.).
54.18
57.72
64.62
70.23
75.00
80.1381.18
c83.19
Well 9 <°F.).
52.23
57.31*
63.82
70.30
75.22
77.95
a Some gas. 16 Gas at 2,560 feet.c Some gas at 2,875-2,888 feet.d Gas at 2,940 feet.
The rates of increase indicated by these observations are as follows: Well 14, 250 to 3,000 feet, 1° in 104 feet; well 6, 100 to 1,980 feet, 1° in 116 feet; well 2, 100 to 2,650 feet, 1° in 90 feet; well 4, 100 to 3,225 feet, 1° in 90 feet; well 7, 100 to 2,888 feet; 1° in 96 feet; well 9, 100 to 2,500 feet, 1° in 93 feet.
SPENCER.
The 3,403-foot hole bored by the Hope Gas Co. 22 miles east of Spencer, Clark County, was tested at 100-foot intervals to 3,250 feet by Mr. Van Orstrand with the following results:
Temperature measurements in well 22 miles east of Spencer, W. Va.
100 feet.............. 54.1200 feet.............. 55.0300 feet.............. 56.3400feet.............. 57.8500 feet.............. 59.4600 feet.............. 60.7700feet.............. 61.7800 feet.............. 62.7900 feet.............. 3.66
1,000 feet............ 65.11,100 feet............ 66.01,200 feet............ 67.01,300 feet............ 68.51,400 feet............ 69.91,500 feet....."....... 70.91,600 feet............ 72.61,700 feet............ 73.51,800 feet............ 5.47
1,900 feet............ 74.92,000 feet............ 76.22,100 feet............ 77.52,200 feet............ 79.02,200 feet............ 80.32,400 feet............ 81.42,500 feet............ 82.62,600 feet............ 83.43,250 feet............ 91.9
The rates of increase indicated by these observations are as follows: 100 to 3,250 feet, 1° in 83.3 feet; 1,000 to 3,250 feet, 1° in 84 feet.
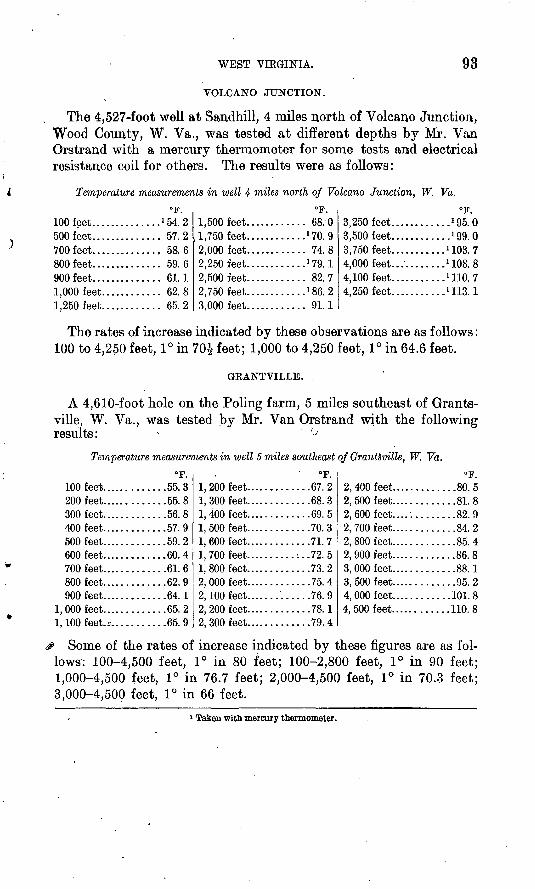
WEST VIRGINIA. 93
VOLCANO JUNCTION.
The 4,527-foot well at Sandhill, 4 miles north of Volcano Junction, Wood County, W. Va., was tested at different depths by Mr. Van Orstrand with a mercury thermometer for some tests and electrical resistance coil for others. The results were as follows:
Temperature measurements in well 4 miles north of Volcano Junction, W. Va.
100 feet.............. 1 54.2500 feet.............. 57.2700 feet.............. 58.6800 feet.............. 59.6900feet.............. 61.11,000 feet............ 62.81,250 feet............ 65.2
1,500 feet............ 68.01,750 feet............'TO. 92,000 feet............ 74.82,250 feet............^G.l2,500 feet............ 82.72,750 feet............'86. 23.000 feet............ 91.1
3.250 feet............ J 95.03,500 feet............ J 99.03,750 feet...........UOS. 74,000 feet........... 1 108. 84,100 feet........... 1 110. 74,250 feet...........UlS.l
The rates of increase indicated by these observations are as follows: 100 to 4,250 feet, 1° in 70£ feet; 1,000 to 4,250 feet, 1° in 64.6 feet.
GEANT VILLE.
A 4,610-foot hole on the Poling farm, 5 miles southeast of Grants- ville, W. Va., was tested by Mr. Van Orstrand with the following results: v '- J
Temperature measurements in well 5 miles southeast of Grantsville, W. Va.
100 feel............55. 3200 feet.............55. 8300 feet.............56. 8400 feet.............57. 9500 feet.............59. 2600 feet.............60.4700 feet.............61. 6800 feet.............62. 9900 feet.............64.1
1,000 feet.............65. 21,100 feet..............65. 9
1,200 feet.............67. 21,300 feet.............68. 31,400 feet.............69. 51,500 feet.............70. 31,600 feet.............71. 71,700 feet..........:..72. 51,800 feet.............73. 22, 000 feet.............75. 42,100 feet.......'......76. 92, 200 feet.............78.12, 300 feet.............79. 4
2,400 feet.............80. 52, 500 feet.............81. 82, 600 feet....'.........82. 92, 700 feet.............84. 22, 800 feet.............85. 42, 900 feet.............86. 83,000 feet.............88.13, 500 feet.............95. 24,000 feet............101. 84, 500 feet............110. 8
? Some of the rates of increase indicated by these figures are as fol lows: 100-4,500 feet, 1° in 80 feet; 100-2,800 feet, 1° in 90 feet; 1,000-4,500 feet, 1° in 76.7 feet; 2,000-4,500 feet, 1° in 70.3 feet; 3,000-4,500 feet, 1° in 66 feet.
1 Taken with mercury thermometer.

94 GEOTHERMAL DATA OF THE UNITED STATES.
SHINNSTON.
The 4,920-foot hole bored by the Hope Gas Co. on the farm of E. Robinson- at Wyatt, 5 miles northwest of Shinnston, was tested at every hundred feet to a depth of 2,000 feet by Mr. Van Orstrarid with the following results:
Temperature measurements in a 4,290-foot hole at Wyatt, W. Va.
100 feet...............54. 5200 feet...............55. 5300 feet. ............56.3400 feet...............57. 5500 feet........... -....58. 9600 feet..............59.9700 feet..............61.0
800 feet..............62.0900 feet..............62.91,000 feet............64. 21,100 feet............65.01,200 feet............65. 61,300 feet............66. 51,400 feet............67.7
1,500 feet.. ........... 68. 41,600 feet. ........... ̂ S.O1,700 feet.. ........... 70. 71,800 feet. ........... 71. 91,900 feet.. ........... 72. 92, 000 feet.. ...........74.1
The rate of increase indicated by the difference, in temperature between 100 and 2,000 feet is close to 1° in 96 feet; from 1,000 to 2,000 feet the rate is 1° in 101 feet.
LAKE WELL.
This well reached a depth of 7,579 feet when drilling ceased in 1919. It is about 8 miles south of Fairmont, W. Va. Van Orstrand found .the temperature at 7,500 feet to be 168.6°, indicating an average rate of temperature increase of 1° in 66 feet.
Mr. Van Orstrand has also given a series of measurements from 100 to 5,400 feet as follows:
Temperature measurements in well on Lake Farm, 4 miles northeast of Valley Falls, W. Va.
100 feet...............53.7200 feet...............55.8300 feet...............57.5400 feet...............58.8500 feet...............59.9600 feet...............61.0700 feet...............62.2800 feet...^...........62.8900 feet..............'.64.41,000 feet............65. 61,100 feet............66. 81,200 feet............68.1
1,300 feet............69.21,400 feet............70. 61,500 feet............. 71. 81,600 feet............73.11,700 feet............74. 31,800 feet............75. 31,900 feet............76.72,000 feet.............78.42,250 feet............82. 42,500 feet............86.02,750 feet............89. 23,000 feet............90.5
3,250 feet............93.63,500 feet............95.43,750 feet...........100. 94,000 feet...........104. 54,250 feet...........106.04,500 feet...........111. 44,750 feet...........116. 25,000 feet...........120.75,250 feet...........126.15,400 feet...........129.2
The rate of increase from 100 to 5,400 feet is 1° in 70 feet.
GOFF WELL.
The well on the Goff farm is about 8 miles northeast of Clarksburg in the northern part of West Virginia. Its depth is 7,386 feet.
A small discharge of gas occurs ot 1,610 feet.
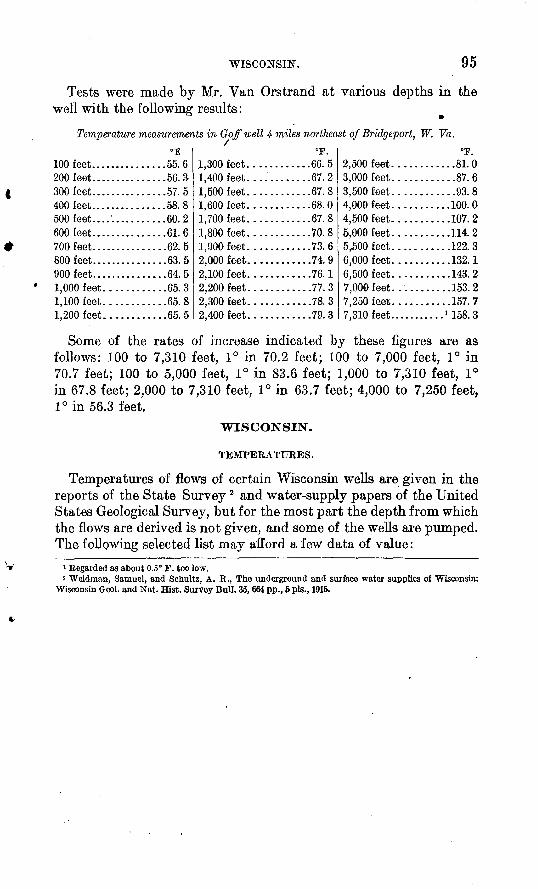
WISCONSIN-. 95
Tests were made by Mr. Van Orstrand at various depths in the well with the following results:
Temperature measurements in Goff well 4 miles northeast of Bridgeport, W. Va.
100 feet...............55.6200 feet...............56.3300 feet...............57.5400 feet...............58.8500 feet....'...........60.2600 feet...............61.6700 feet...............62.5800 feet...............63.5900 feet................64. 51,000 feet............65. 31,100 feet............65.81,200 feet............65. 5
1,300 feet............66. 51,400 feet............67. 21,500 feet............67.81,600 feet............68.01,700 feet............67. 81,800 feet............70.81,900 feet............73. 62,000 feet............74.92,100 feet............76.12,200 feet............77. 32,300 feet............78. 32,400 feet............79.3
2,500 feet............81.03,000 feet............87. 63,500 feet............93.84,000 feet........... 100.04,500 feet...........107.25,000 feet...........114. 25,500 feet...........122.36,000 feet...........132.16,500 feet...........143.27,000 feet...........153. 27,250 feet...........157.77,310 feet........... 1 158.3
Some of the rates of increase indicated by these figures are as follows: 100 to 7,310 feet, 1° in 70.2 feet; 100 to 7,000 feet, 1° in 70.7 feet; 100 to 5,000 feet, 1° in 83.6 feet; 1,000 to 7,310 feet, 1° in 67.8 feet; 2,000 to 7,310 feet, 1° in 63.7 feet; 4,000 to 7,250 feet, 1° in 56.3 feet.
WISCONSIN.
TEMPERATURES.
Temperatures of flows of certain Wisconsin wells are given in the reports of the State Survey 2 and water-supply papers of the United States Geological Survey, but for the most part the depth from which the flows are derived is not given, and some of the wells are pumped. The following selected list may afford a few data of value:
1 Eegarded as about 0.5° F. too low.2 Weidman, Samuel, and Schultz, A. E., The underground and surface water supplies of Wisconsin:
Wisconsin Geol. and Nat. Hist. Survey Bull. 35,664 pp., 5 pis., 1915.
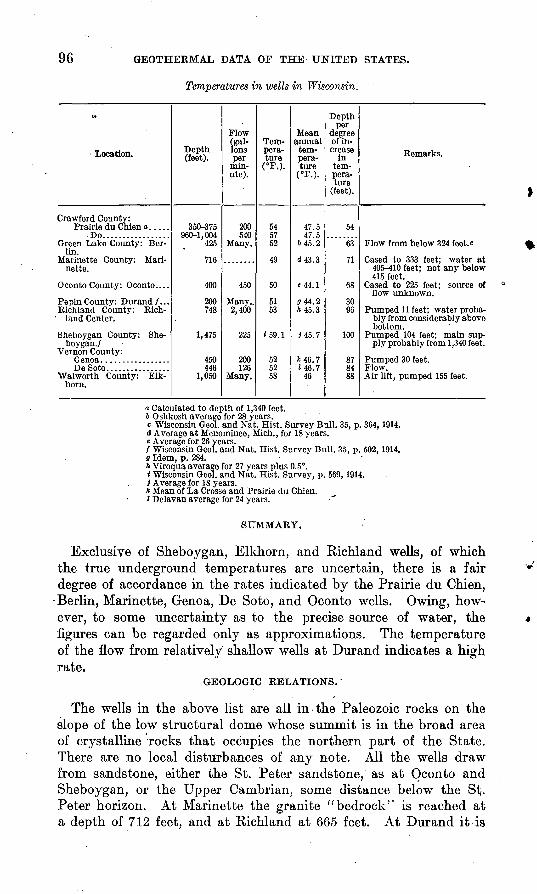
96 GEOTHERMAL DATA OF THE UNITED STATES.
Temperatures in wells in Wisconsin.
o
Location.
Crawford County:Prairie duChieno. ....
Do.................Green Lake County: Ber
lin.Marinette County: Mari-
nette.
O conto County : 0 conto ....
Pepin County: Durand/...Richland County: Rich-
land Center.
Sheboygan County: She- boygan./
Vernon County:Genoa. ................DeSoto................
Walworth County: Elk-horn.
Depth (feet).
350-375960-1.004
425*
716
400
200748
1,475
450446
1,050
Flow(gallons per
minute).
200540
Many.
450
Many..2,400
225
200126
Many.
Tempera ture
(°F.).
545752
49
50
5153
<59.1
525258
Meanannualtem perature
(°F.).
47.547.5
645.2
(J43.3
«44.1
(744.2» 45. 3
H5.7
*46.7U6.7
46
Depthper
degreeof increase
intemperature
(feet).
54
63
71
68
3096
100
878488
Remarks.
Flow from below 324 feet.c
Cased to 333 feet; water at405-410 feet; not any below415 feet.
Cased to 225 feet; source offlow unknown.
Pumped 11 feet; water proba bly from considerably abovebottom.
Pumped 104 feet; main sup ply probably from 1,340 feet.
Pumped 30 feet.Flow.Air lift, pumped 155 feet.
a Calculated to depth of 1,340 feet.6 Oshkosh average for 28 years.c Wisconsin Geol. and Nat. Hist. Survey Bull. 35, p. 364,1914.<J Average at Menominee, Mich., for 18 years.« Average for 26 years./ Wisconsin Geol. and Nat. Hist. Survey Bull. 35, p. 502,1914.g Idem, p. 284.ft Viroqua average for 27 years plus 0.5°.< Wisconsin Geol. and Nat. Hist. Survey, p. 569,1914.i Average for 18 years.* Mean of La Crosse and Prairie du Chien.i Delavan average for 24 years.
SUMMARY.
Exclusive of Sheboygan, Elkhorn, and Richland wells, of which the true underground temperatures are uncertain, there is a fair degree of accordance in the rates indicated by the Prairie du Chien, Berlin, Marinette, Genoa, De Soto, and Oconto wells. Owing, how ever, to some uncertainty as to the precise source of water, the figures can be regarded only as approximations. The temperature of the flow from relatively shallow wells at Durand indicates a high rate.
GEOLOGIC RELATIONS.
The wells in the above list are all in-the Paleozoic rocks on the slope of the low structural dome whose summit is in the broad area of crystalline rocks that occupies the northern part of the State. There are no local disturbances of any note. All the wells draw from sandstone, either the St. Peter sandstone, as at Oconto and Sheboygan, or the Upper Cambrian, some distance below the St. Peter horizon. At Marinette the granite "bedrock'' is reached at a depth of 712 feet, and at Richland at 665 feet. At Durand it is

WYOMING. 97
not far below the bottom of the 200-foot well. At Sheboygan a hole 1,782 feet deep did not reach the bedrock. There is no appar ent relation between the gradients and geologic conditions-.
WYOMING.
The deep-well temperatures in Wyoming given in the following table were carefully determined with Darton thermometers sunk to the bottom of the holes by my assistants or myself.
Temperatures in wells in Wyoming.
Big Horn County:SW. JSE. Jsec. 27, T. 102
R. 48, 10 miles south westof Meteetse.
Cambria...................
Newcastle, 2 miles west.. . .
Depth (feet).
1,400
1,475
374
Tem perature
< 8F.).
66
59
63
Meanannual air tem perature
(°F.).
a 40
645.2
45.2
Depthper
degree of increase in temperature(feet).
54
107
21
Remarks.
Dry hole; thermometer sunk by C. A. Fisher.
Thermometer sunk by O. B.Richardson, 1899.
Thermometer sunk by N. H.Darton, 1900.
a Mean annual air temperature at Four Bear, 10 miles west, plus 0.3° for lower altitude. 6 Newcastle average.
All theso figures are correct, and no vitiating conditions are indi cated. The Cambria and Newcastle wells were full of water. The steep gradient of the Newcastle well, is inexplicable.
137163° 20 Bull. 701 7
ADDITIONAL COPIESOP THIS PUBLICATION MAY BE PROCURED FROM
THE SUPERINTENDENT OF DOCUMENTSGOVERNMENT PRINTING OFFICE
WASHINGTON, D. C.AT
20 CENTS PER COPY