geotechnical reconnaissance and liquefaction analyses of a ... · geotechnical reconnaissance and...
TRANSCRIPT

Engineering Geology 123 (2011) 235–245
Contents lists available at SciVerse ScienceDirect
Engineering Geology
j ourna l homepage: www.e lsev ie r .com/ locate /enggeo
Geotechnical reconnaissance and liquefaction analyses of a liquefaction site with siltyfine sand in Southern Taiwan
Wen-Jong Chang a,⁎, Sheng-Huoo Ni a, An-Bin Huang b, Yan-Hong Huang a, Yu-Zhang Yang a
a Department of Civil Engineering, National Cheng Kung University, Tainan 70101, Taiwanb Department of Civil Engineering, National Chiao Tung University, Hsinchu 300, Taiwan
⁎ Corresponding author. Tel.: +886 6 2757575 63128E-mail address: [email protected] (W.-J. C
0013-7952/$ – see front matter © 2011 Elsevier B.V. Alldoi:10.1016/j.enggeo.2011.09.003
a b s t r a c t
a r t i c l e i n f oArticle history:Received 25 October 2010Received in revised form 1 August 2011Accepted 4 September 2011Available online 19 September 2011
Keywords:Soil liquefactionFines contentSilty sandCase history
Geotechnical reconnaissance of a recurrent liquefaction site at a Quaternary alluvial deposit in southern Taiwanwas conducted to establish a comprehensive case history for liquefaction on silty fine sand with high finescontent. The liquefaction occurred at a silty fine sand layer with D50=0.09 mm and fines content greaterthan 35% and was triggered by a Mw=6.4 earthquake on March 4, 2010, which induced maximum horizontalacceleration up to 0.189 g at the site. In situ subsurface characterizations, including standard penetration test,cone penetration test, and shear wave velocity measurement, were performed as well as cyclic simple sheartests on undisturbed specimens retrieved by a modified hydraulic piston sampler. Comparisons of cyclic re-sistance ratios (CRRs) indicate that CPT sounding with standard penetration rate could overestimate the re-sistance ratio and drainage conditions during penetration should be considered for high fines content soil inthe liquefaction analysis. Additionally, variations of CRRs from different in situ tests indicate that correlationsamong in situ tests and CRR could be soil specific and precautions should be taken when using these curveson silty fine sands.
; fax: +886 6 2358548.hang).
rights reserved.
© 2011 Elsevier B.V. All rights reserved.
1. Introduction
The Jiasian earthquake (Mw=6.4) occurred at 8:18 local time on 4March 2010 with the epicenter 17 km southeast of Jiasian Townshipin Kaohsiung County, Southern Taiwan, and was the biggest earth-quake in the Kaohsiung area since 1900. The seismic event caused64 injuries and over 340 buildings were damaged. In addition, thestrong ground motion de-railed two wheels of a Taiwan High SpeedRail (THSR) train and the THSR service was suspended for two days.
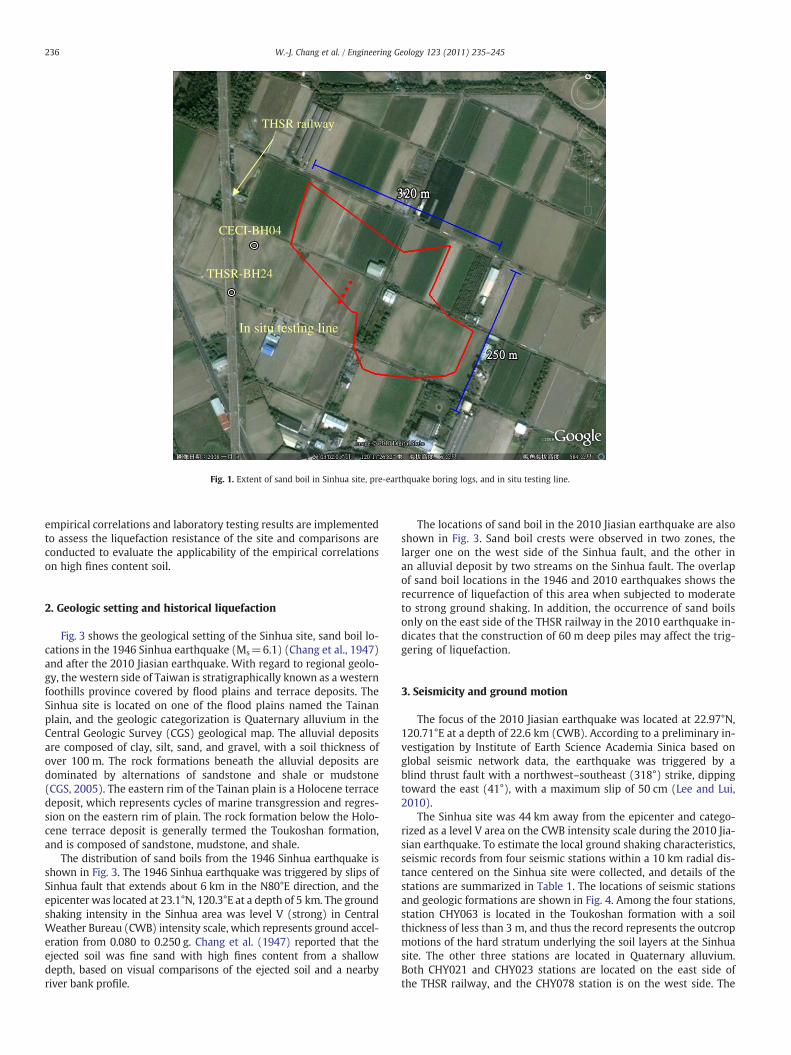
Sand boils from soil liquefaction were observed in Sinhua Town-ship, which is about 40 km away from the epicenter. Sand boil crestswere randomly spread within a 350 m long and 250 m wide paddyfield, as shown in Fig. 1, and this soil liquefaction site is named theSinhua site hereafter. The position of the sand boil zone in relationto the THSR railway and the typical sand boil pattern in the Sinhuasite are shown in Fig. 2. Each sand boil has several aligned ventsand the ejected sand is mainly grey fine sands with yellowishbrown silts. The pore pressure dissipation process lasted at least 36hours, and a significant amount of water was squeezed out after theearthquake, causing significant soaking at nearby surface and a riseof water level in the irrigation channels.
The Sinhua site has four significant features that deserve more de-tailed study. First, the sand boil spots by the 2010 Jiasian earthquake
overlapped with the locations of soil liquefaction in the 1946 Sinhuaearthquake, which was triggered by the slip of Sinhua fault, only1.5 km from the Sinhua site. This recurrence provides an opportunityto study the geologic and geotechnical conditions for the recurrenceof soil liquefaction. Second, sand boils were observed only on eastside of the THSR elevated railway, although soil liquefaction occurredon both sides of THSR railway in the 1946 Sinhua earthquake. Becausethe THSR piers are supported by 60 m piles with 30 m spacing, thepile rows may have created a wave propagating boundary at a shal-low depth. Consequently, dynamic soil-structure interactions arelikely to play an important role in altering the ground shaking andsubsequently triggering the liquefaction. Third, pre-earthquake bor-ing logs conducted four months before the Jiasian earthquake areavailable at the Sinhua site, which provides a case to study the varia-tion of subsurface conditions after liquefaction. Finally, the soil stra-tums in this liquefied layers show fines content of over 35% and thesite provides a case history to verify liquefaction evaluation tech-niques in high fines content soils.
Due to these above mentioned features, geotechnical reconnais-sance was conducted two days after the earthquake. The subsurfacecharacterization work included standard penetration tests (SPT)with split tube sampling, seismic cone penetration tests with porepressure measurement (SCPTu), multichannel analysis of surfacewaves (MASW), and cyclic simple shear tests on undisturbed speci-mens by a modified hydraulic piston sampler. This paper presentsthe preliminary geotechnical reconnaissance results with a focus onthe engineering properties related to soil liquefaction. Additionally,
THSR railway
In situ testing line
CECI-BH04
THSR-BH24
Fig. 1. Extent of sand boil in Sinhua site, pre-earthquake boring logs, and in situ testing line.
236 W.-J. Chang et al. / Engineering Geology 123 (2011) 235–245
empirical correlations and laboratory testing results are implementedto assess the liquefaction resistance of the site and comparisons areconducted to evaluate the applicability of the empirical correlationson high fines content soil.
2. Geologic setting and historical liquefaction
Fig. 3 shows the geological setting of the Sinhua site, sand boil lo-cations in the 1946 Sinhua earthquake (Ms=6.1) (Chang et al., 1947)and after the 2010 Jiasian earthquake. With regard to regional geolo-gy, the western side of Taiwan is stratigraphically known as a westernfoothills province covered by flood plains and terrace deposits. TheSinhua site is located on one of the flood plains named the Tainanplain, and the geologic categorization is Quaternary alluvium in theCentral Geologic Survey (CGS) geological map. The alluvial depositsare composed of clay, silt, sand, and gravel, with a soil thickness ofover 100 m. The rock formations beneath the alluvial deposits aredominated by alternations of sandstone and shale or mudstone(CGS, 2005). The eastern rim of the Tainan plain is a Holocene terracedeposit, which represents cycles of marine transgression and regres-sion on the eastern rim of plain. The rock formation below the Holo-cene terrace deposit is generally termed the Toukoshan formation,and is composed of sandstone, mudstone, and shale.
The distribution of sand boils from the 1946 Sinhua earthquake isshown in Fig. 3. The 1946 Sinhua earthquake was triggered by slips ofSinhua fault that extends about 6 km in the N80°E direction, and theepicenter was located at 23.1°N, 120.3°E at a depth of 5 km. The groundshaking intensity in the Sinhua area was level V (strong) in CentralWeather Bureau (CWB) intensity scale, which represents ground accel-eration from 0.080 to 0.250 g. Chang et al. (1947) reported that theejected soil was fine sand with high fines content from a shallowdepth, based on visual comparisons of the ejected soil and a nearbyriver bank profile.
The locations of sand boil in the 2010 Jiasian earthquake are alsoshown in Fig. 3. Sand boil crests were observed in two zones, thelarger one on the west side of the Sinhua fault, and the other inan alluvial deposit by two streams on the Sinhua fault. The overlapof sand boil locations in the 1946 and 2010 earthquakes shows therecurrence of liquefaction of this area when subjected to moderateto strong ground shaking. In addition, the occurrence of sand boilsonly on the east side of the THSR railway in the 2010 earthquake in-dicates that the construction of 60 m deep piles may affect the trig-gering of liquefaction.
3. Seismicity and ground motion
The focus of the 2010 Jiasian earthquake was located at 22.97°N,120.71°E at a depth of 22.6 km (CWB). According to a preliminary in-vestigation by Institute of Earth Science Academia Sinica based onglobal seismic network data, the earthquake was triggered by ablind thrust fault with a northwest–southeast (318°) strike, dippingtoward the east (41°), with a maximum slip of 50 cm (Lee and Lui,2010).
The Sinhua site was 44 km away from the epicenter and catego-rized as a level V area on the CWB intensity scale during the 2010 Jia-sian earthquake. To estimate the local ground shaking characteristics,seismic records from four seismic stations within a 10 km radial dis-tance centered on the Sinhua site were collected, and details of thestations are summarized in Table 1. The locations of seismic stationsand geologic formations are shown in Fig. 4. Among the four stations,station CHY063 is located in the Toukoshan formation with a soilthickness of less than 3 m, and thus the record represents the outcropmotions of the hard stratum underlying the soil layers at the Sinhuasite. The other three stations are located in Quaternary alluvium.Both CHY021 and CHY023 stations are located on the east side ofthe THSR railway, and the CHY078 station is on the west side. The
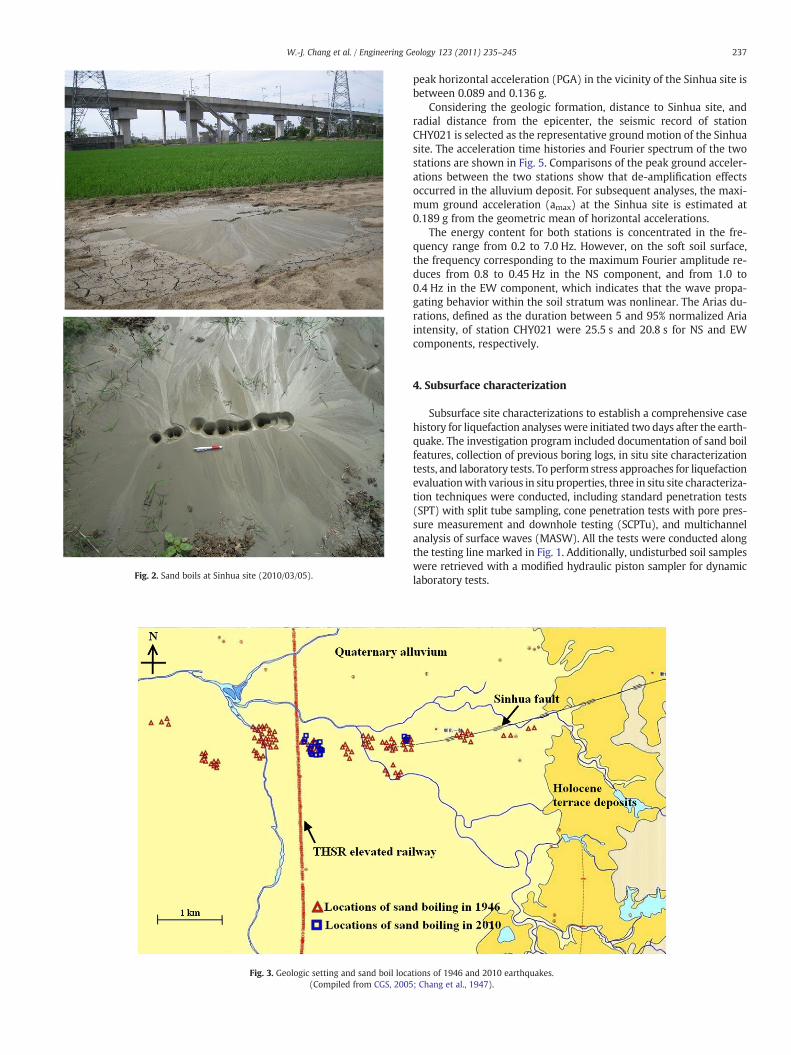
Fig. 2. Sand boils at Sinhua site (2010/03/05).
Fig. 3. Geologic setting and sand boil loca(Compiled from CGS, 2005
237W.-J. Chang et al. / Engineering Geology 123 (2011) 235–245
peak horizontal acceleration (PGA) in the vicinity of the Sinhua site isbetween 0.089 and 0.136 g.
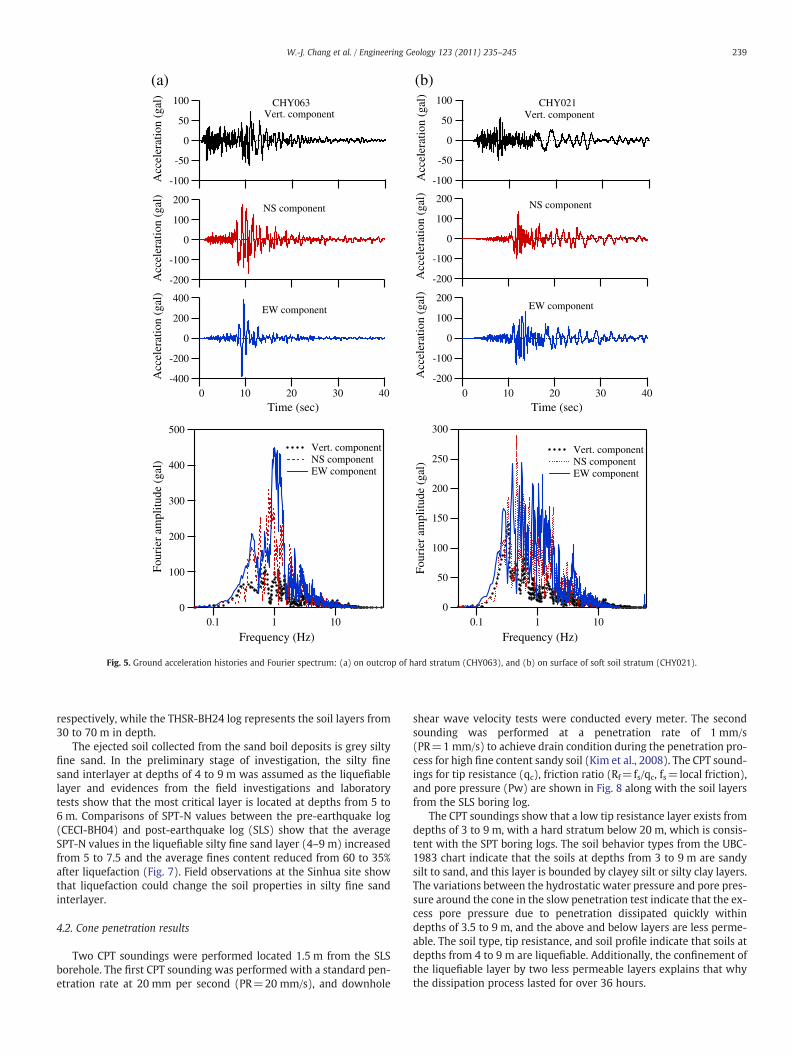
Considering the geologic formation, distance to Sinhua site, andradial distance from the epicenter, the seismic record of stationCHY021 is selected as the representative groundmotion of the Sinhuasite. The acceleration time histories and Fourier spectrum of the twostations are shown in Fig. 5. Comparisons of the peak ground acceler-ations between the two stations show that de-amplification effectsoccurred in the alluvium deposit. For subsequent analyses, the maxi-mum ground acceleration (amax) at the Sinhua site is estimated at0.189 g from the geometric mean of horizontal accelerations.
The energy content for both stations is concentrated in the fre-quency range from 0.2 to 7.0 Hz. However, on the soft soil surface,the frequency corresponding to the maximum Fourier amplitude re-duces from 0.8 to 0.45 Hz in the NS component, and from 1.0 to0.4 Hz in the EW component, which indicates that the wave propa-gating behavior within the soil stratum was nonlinear. The Arias du-rations, defined as the duration between 5 and 95% normalized Ariaintensity, of station CHY021 were 25.5 s and 20.8 s for NS and EWcomponents, respectively.
4. Subsurface characterization
Subsurface site characterizations to establish a comprehensive casehistory for liquefaction analyses were initiated two days after the earth-quake. The investigation program included documentation of sand boilfeatures, collection of previous boring logs, in situ site characterizationtests, and laboratory tests. To perform stress approaches for liquefactionevaluationwith various in situ properties, three in situ site characteriza-tion techniques were conducted, including standard penetration tests(SPT) with split tube sampling, cone penetration tests with pore pres-sure measurement and downhole testing (SCPTu), and multichannelanalysis of surface waves (MASW). All the tests were conducted alongthe testing line marked in Fig. 1. Additionally, undisturbed soil sampleswere retrieved with a modified hydraulic piston sampler for dynamiclaboratory tests.
tions of 1946 and 2010 earthquakes.; Chang et al., 1947).

Scale 1: 250000
Fig. 4. Locations of nearby seismic stations and geologic formations.(Modified from CGS, 2010).
238 W.-J. Chang et al. / Engineering Geology 123 (2011) 235–245
4.1. Borehole data
Two borehole logs (THSR-BH24 and CECI-BH04) are presented toshow the pre-earthquake soil strata, and the locations of the twoboreholes are shown in Fig. 1. The two borehole logs, as shown inFig. 6, were conducted for previous construction projects in the prox-imity of Sinhua site. The THSR-BH24 borehole log, acquired from Da-tabase Integrated Construction Project of CGS, was conducted in 1993for the THSR pile-supported railway and located 100 m away fromthe closest sand boil spot. The soil stratum for the top 20 m are con-sisted of sandy clay, clayey sand, and fine sand with SPT-N values(blow counts per foot in a standard penetration test) of less than11. Below the soft cover layers, the intercalation of silty sand andsilty clay extends to 70 m deep (the bottom of the borehole). Forthe intercalation strata, the average SPT-N value for silty clay is 20,and over 30 for silty sand. The CECI-BH04 borehole log was conductedin 2009 for a local road and located only 30 m away from the closestsand boil spot. This borehole data shows that the top 20 m is very soft,with SPT-N values from 3 to 7. In addition, a silty sand layer at a depthfrom 2.2 to 5.8 m has an average SPT-N value of 5 and is intercalatedby silty clay layers. The ground water table in this area is generallyless than 1.5 m from surface.
Table 1Summary of seismic stations around the Sinhua site.
Station Distance toepicenter(km)
Distance toSite (km)
MHA (gal)Vertical/NS/EW
Geologic formation
CHY063 37.6 6.4 71.2/ 174.7/ 385.2 Toukoushan formationCHY021 44.1 3.2 57.4/ 136.1/ 130.9 Quaternary alluviumCHY023 43.3 9.5 37.0/ 89.0/ 121.5 Quaternary alluviumCHY078 49.1 5.9 25.3/ 61.5/ 101.7 Quaternary alluvium
Note: The epicenter distance for the Sinhua site is 44 km.
Although the distance between the two boreholes is only 80 m,the soil layer sequences of the top 20 m show slight differences inthe elevation and thickness of the loose silty sand layer. To clarifythe depth of the liquefied layers, another three boreholes were drilledright on the sand boil crests on the investigation line marked on Fig. 1.Among the three boreholes, one is for continuous SPT tests with splittube samples for physical property tests, and the other two are for re-trieving undisturbed samples. The procedure of SPT complied withASTM D1586 using a safety hammer with rope-cathead operation.According to Moh and Associates (2000), the energy ratio (ER) ofSPT in west central Taiwan can be represented as:
ER %ð Þ ¼ 30z11
þ 50 for z≤11 ð1aÞ
ER %ð Þ ¼ 80 for z>11 ð1bÞ
where z is the depth from surface in meter. Although no energy mea-surement was conducted in this study, the SPT equipment, operationprocedure, and soil layer in this area are similar to those casesreported in Moh and Associates (2000); therefore, the energy ratioexpressed in Eq. (1) would be the best estimation.
The first borehole is named SLS (Sinhua liquefaction site), and thetest results are shown in Table 2. The profiles of the SPT-N value, finescontent (particle sizeb0.075 mm), and plasticity index (PI) fromTHSR-BH24, CECI-BH04, and SLS are compiled and plotted in Fig. 7.The borehole data from CECI-BH04 and SLS show that a silty finesand layer at depths of 4 to 9 m is intercalated by two silty clay layers.The soil layer at depths from 20 to 33 m consists of hard silty sandwith an SPT-N value greater than 30. Based on the data from THSR-BH24, intercalation among silty sand, silty clay, and clayey silt layerswas found below 33 m. Considering the distance to liquefied zone andconsistency of layer sequence, the CECI-BH04 and SLS logs representthe pre-earthquake and post-earthquake soil strata of the top 20 m
-100
-50
0
50
100
Acc
eler
atio
n (g
al)
Vert. component CHY063
(a)
-100
-50
0
50
100
Acc
eler
atio
n (g
al)
CHY021 Vert. component
(b)
-200
-100
0
100
200
Acc
eler
atio
n (g
al)
NS component
-200
-100
0
100
200
Acc
eler
atio
n (g
al)
NS component
-400
-200
0
200
400
Acc
eler
atio
n (g
al)
403020100 Time (sec)
EW component
-200
-100
0
100
200
Acc
eler
atio
n (g
al)
403020100 Time (sec)
EW component
500
400
300
200
100
0
Fou
rier
am
plitu
de (
gal)
0.1 1 10
Frequency (Hz)
Vert. component NS component EW component
300
250
200
150
100
50
0
Fou
rier
am
plitu
de (
gal)
0.1 1 10
Frequency (Hz)
Vert. component NS component EW component
Fig. 5. Ground acceleration histories and Fourier spectrum: (a) on outcrop of hard stratum (CHY063), and (b) on surface of soft soil stratum (CHY021).
239W.-J. Chang et al. / Engineering Geology 123 (2011) 235–245
respectively, while the THSR-BH24 log represents the soil layers from30 to 70 m in depth.
The ejected soil collected from the sand boil deposits is grey siltyfine sand. In the preliminary stage of investigation, the silty finesand interlayer at depths of 4 to 9 m was assumed as the liquefiablelayer and evidences from the field investigations and laboratorytests show that the most critical layer is located at depths from 5 to6 m. Comparisons of SPT-N values between the pre-earthquake log(CECI-BH04) and post-earthquake log (SLS) show that the averageSPT-N values in the liquefiable silty fine sand layer (4–9 m) increasedfrom 5 to 7.5 and the average fines content reduced from 60 to 35%after liquefaction (Fig. 7). Field observations at the Sinhua site showthat liquefaction could change the soil properties in silty fine sandinterlayer.
4.2. Cone penetration results
Two CPT soundings were performed located 1.5 m from the SLSborehole. The first CPT sounding was performed with a standard pen-etration rate at 20 mm per second (PR=20 mm/s), and downhole
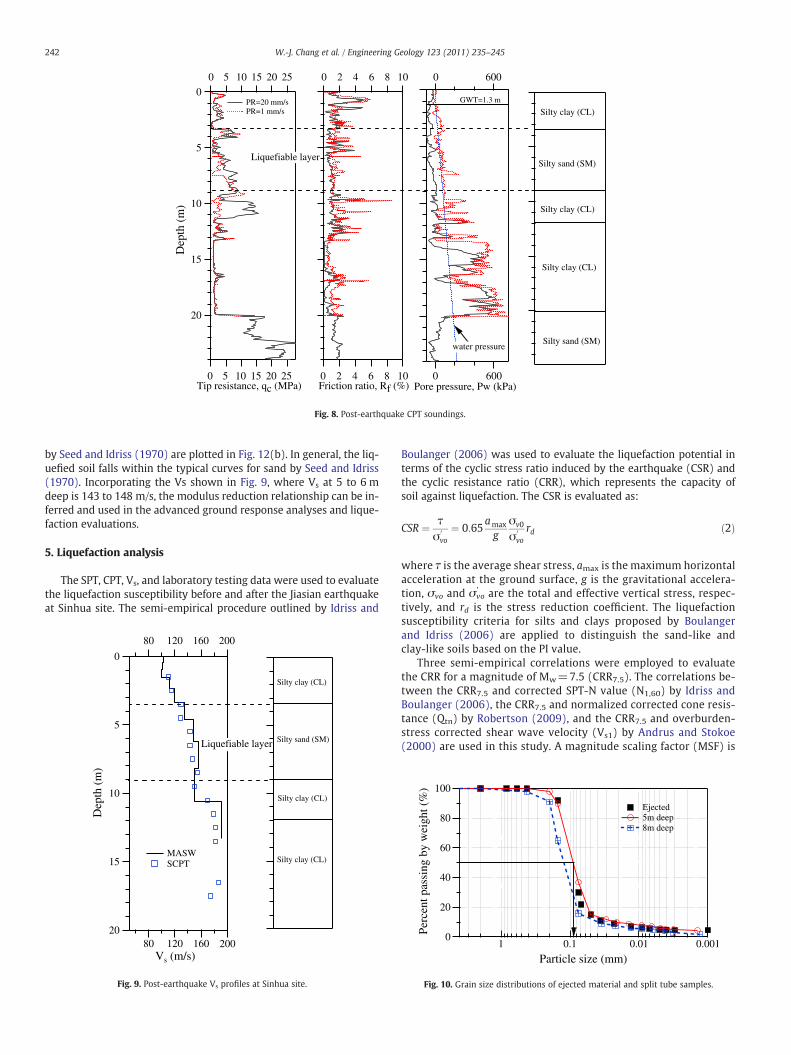
shear wave velocity tests were conducted every meter. The secondsounding was performed at a penetration rate of 1 mm/s(PR=1 mm/s) to achieve drain condition during the penetration pro-cess for high fine content sandy soil (Kim et al., 2008). The CPT sound-ings for tip resistance (qc), friction ratio (Rf=fs/qc, fs=local friction),and pore pressure (Pw) are shown in Fig. 8 along with the soil layersfrom the SLS boring log.
The CPT soundings show that a low tip resistance layer exists fromdepths of 3 to 9 m, with a hard stratum below 20 m, which is consis-tent with the SPT boring logs. The soil behavior types from the UBC-1983 chart indicate that the soils at depths from 3 to 9 m are sandysilt to sand, and this layer is bounded by clayey silt or silty clay layers.The variations between the hydrostatic water pressure and pore pres-sure around the cone in the slow penetration test indicate that the ex-cess pore pressure due to penetration dissipated quickly withindepths of 3.5 to 9 m, and the above and below layers are less perme-able. The soil type, tip resistance, and soil profile indicate that soils atdepths from 4 to 9 m are liquefiable. Additionally, the confinement ofthe liquefiable layer by two less permeable layers explains that whythe dissipation process lasted for over 36 hours.

clayey silt (CL)
silty sand (SM)
clayey silt (ML)
silty clay (ML)
(b)
20
15
10
5
0
Dep
th (
m)
50
50
40
40
30
30
20
20
10
10
0
0SPT-N value
GWT=1.3 msilty clay (CL)
silty clay (CL)clayey silt (ML)
silty clay (CL)
silty sand (SM)
clayey silt (ML)
silty clay (CL)
silty sand (SM)
silty clay (CL)
clayey silt (ML)
silty sand (SM)
silty clay (CL)
silty/clayey sand(SM/ML)
70
60
50
40
30
20
10
0
Dep
th (
m)
50
50
40
40
30
30
20
20
10
10
0
0SPT-N value
GWT=1.0 m
(a)
Fig. 6. Pre-earthquake boring logs: (a) THSR-BH24, and (b) CECI-BH04.
240 W.-J. Chang et al. / Engineering Geology 123 (2011) 235–245
4.3. Shear wave velocity profile
Two in situ shear wave velocity measurement techniques, includ-ing multichannel analysis of surface waves (MASW, Park et al., 1999)and downhole tests during the CPT penetration process (SCPT), areemployed in this investigation for cross verifications. The MASWwas performed three days after the earthquake using a 12 lb sledgehammer and a rubber strike plate as the energy source, whichresulted in sampling depth down to 11 m. The downhole tests wereperformed during the CPT penetration at 1 m intervals down to22 m deep. The downhole seismic data were processed with an inter-val downhole method and the results represent the average shearwave velocity (Vs) between two measuring depths.
The Vs profiles from both techniques are plotted in Fig. 9 alongwith the soil layers from the borehole log of SLS. The results showthat the Vs profiles from both techniques are very consistent for thetop 10 m of soils, indicating the high confidence of the testing data.The MASW results also show that the ground water table was at0.4 m deep three days after the earthquake. Based on the Vs profile,the shear wave velocity of the silty sand layer is 120 to 150 m/safter the earthquake, which indicates that liquefaction could be easilytriggered based on correlations by Andrus and Stokoe (2000).
4.4. Laboratory testing
To evaluate the liquefaction potential with different techniques,laboratory tests for soil physical properties, dynamic soil properties,and liquefaction resistance of the liquefied stratum were conducted.
The grain size distribution tests were conducted on ejected soils col-lected from sand boil deposits and split tube samplers from the lique-fied soil layer. The grain size distribution curves of the ejected soil andsilty sands at depths of 5 and 8 m are plotted in Fig. 10. The grain sizeanalysis shows that the grain size distribution of the ejected soil isclose to the two curves from the silty sand layer at depths from 4 to9 m and the D50 of the liquefied soil is 0.09 mm. Visual inspectionalso shows that both the ejected soil and the silty sand are angularto subangular fine sand with grey color. From the soil color, shape,grain size distribution, and soil classification of the ejected soil andthe silty fine sand, it confirms that the silty sand layer at depthsfrom 4 to 8 m did liquefy during the Jiasian earthquake.
To directly evaluate the liquefaction resistance of the liquefiedsilty fine sand, cyclic direct simple shear tests under K0-condition(K0-CDSS) were performed on undisturbed specimens retrieved atdepths from 5 to 6 m. To reduce the disturbance during sampling pro-cess, a gel-push sampler was used and Vs of specimen was measuredto assess the quality of soil samples. The gel-push sampler developedin Japan (Tani and Kaneko, 2006) was modified from a 75 mm Oster-berg piston sampler. Huang et al. (2008) reported the use of a gel-push sampler to recover high quality samples in silty sands at a testsite in Southern Taiwan, where the fines contents varied from 5 toover 60%. Their results indicate that the laboratory Vs falls within orclose to the range of those from SCPT at comparable depths. Thesame crew and equipment is employed to operate the gel-push sam-pler in this investigation and the Vs of specimens consolidated to thefield vertical effective stress (~55 kPa) ranged from 135 to 145 m/s,which is within the range of in situ Vs from MASW and SCPT. The Vs

Table 2Post-earthquake borehole data.
Depth(m)
Soil description SPT-N
Sand(%)
Silt(%)
Clay(%)
USCS PI(%)
γ(t/m3)
1 yellow silty clay 1.3 m 5 11 45 44 CL 10 1.972 yellow silty fine sand 2.9 m 4 23 52 25 ML NP 1.783 2 23 57 20 ML NP 1.854 grey silty clay 3.4 m 7 46 40 14 ML NP 2.00
grey silty fine sand withsilt seams 8.1 m
5 3 70 27 3 SM NP 1.836 6 54 43 3 SM NP 1.987 9 72 23 5 SM NP 1.878 12 81 15 4 SM NP 1.919 grey silty fine sand 9.0 m 4 77 19 4 SM NP 1.7910 grey silty clay with silt
seams 10.7 m4 2 54 44 CL 12 1.78
11 4 1 54 45 CL-ML
5 1.89
12 grey silty clay 11.9 m 7 2 54 44 CL 8 1.8713 grey silty clay with silt
seams 20.0 m5 14 46 40 CL 14 2.05
14 3 6 54 40 CL 13 1.8315 3 12 53 35 CL 12 1.8216 5 7 50 43 CL 22 1.7817 5 4 58 38 CL-
ML5 1.97
18 5 1 48 51 CL 11 1.9019 7 1 51 48 CL 12 2.0420 6 1 51 48 CL 14 1.9721 grey silty fine sand
~30.0 m37 72 23 5 SM – 1.91
22 32 85 10 5 SM – 1.8723 53 61 34 5 SM – 1.8924 62 67 28 5 SM – 2.0125 64 63 32 5 SM – 2.0226 42 60 35 5 SM – 1.96
Note: 1. Ground water table at 1.4 m below surface.2. Silt defined as grain size between 5 and 75 μm.3. Clay defined as grain size smaller than 5 μm.
241W.-J. Chang et al. / Engineering Geology 123 (2011) 235–245
comparison between the field and laboratory soils indicates that thedisturbance from sampling and specimen preparation process isinsignificant.
The K0-CDSS system uses a circular soil container consisted with alatexmembrane reinforcedwith stack rings tomaintain the K0 condition,defined as non-lateral expansion when subjected vertical loading. Thetesting procedure combined the ASTM D5311-92 (triaxial liquefaction
10
10
80
80
60
60
40
40
20
20
0
0Fines content (%
25
20
15
10
5
0
Dep
th (
m)
40
40
30
30
20
20
10
10
0
0SPT-N value
GWT=1.3 m
SLS THSR-BH24 CECI-BH04
Liquefiable layer
Fig. 7. Compiled borehole
potential testing) and D6528-07 (consolidated undrained direct simpleshear testing) standards. After the completion of saturation, an effectivevertical stress (σvo
' ) of 55 kPawas applied on specimens for consolidation,and this replicated the in situ stress conditions. A sinusoidal shear stresswith a constant stress amplitude at a shearing frequency of 0.1 Hzwas ap-plied on specimens in an undrained condition until the soil reached initialliquefaction, defined as 100% excess pore pressure ratio ru (ru=Δu/σvo
' ,Δu=excess pore pressure) or a shear strain level in excess of 3.75%.Due to the high fines content, the initial liquefaction of the silty finesand is defined on the shear strain level criteria. The liquefaction resis-tance test results in terms of the cyclic stress ratio (CSR= τ/σvo
' ,τ=shear stress amplitude) and number of cycles to trigger initial lique-faction are plotted in Fig. 11. Following the magnitude-duration correla-tion proposed by Seed and Idriss (1982), the cyclic resistanceresistances for Mw=7.5 (NL=15 cycles) and Mw=6.4 (NL=6 cycles)are 0.137 and 0.152, respectively.
Dynamic soil properties represented as modulus reduction anddamping curves are important parameters when performing site spe-cific response analysis and advanced dynamic analysis. To establishthe variations of secant shear modulus and damping ratio at differentshear strain levels, resonant column (RC) and K0-CDSS tests were per-formed on undisturbed specimens. The resonant column test wasperformed under an isotropic consolidation stress, but the K0-CDSSwas tested under an anisotropic consolidation stress. To reduce theeffect from different confining stresses, the variations of shear modu-lus with shear strain amplitude (γ) are presented as normalizedmod-ulus, which is defined as the shear modulus at different shear strainamplitudes (G(γ)) divided by the maximum shear modulus (Gmax),defined as the shear modulus at shear strain levels of less than10−4%. For the resonant column test, the maximum shear strain am-plitude is up to 10−2%. For the K0-CDSS test, the shear strain ampli-tude ranges from 5.5×10⁻² to 10%, and the Gmax was evaluatedusing integrated bender elements. The normalized modulus reduc-tion curves for soil at depths of 5 to 6 m are plotted in Fig. 12(a),along with the mean and upper bound curves for sandy soil by Seedand Idriss (1970). In addition, the results for silty fine sand soil fitwell to the modified hyperbolic relationship proposed by Hardinand Drenvich (1972) with reference shear strain (γr) of 0.045. Thedamping ratios of the test data and the mean and lower bound curves
silty clay (CL)
silty sand (SM)
silty clay (CL)
silty clay (CL)
silty sand (SM)
25
25
20
20
15
15
10
10
5
5
0
0
PI (%)
0
0)
logs and soil layers.
Silty clay (CL)
Silty sand (SM)
Silty clay (CL)
Silty clay (CL)
Silty sand (SM)
600
600
0
0
Pore pressure, Pw (kPa)
GWT=1.3 m
10
10
8
8
6
6
4
4
2
2
0
0
Friction ratio, Rf (%)
20
15
10
5
0
Dep
th (
m)
25
25
20
20
15
15
10
10
5
5
0
0
Tip resistance, qc (MPa)
PR=20 mm/s PR=1 mm/s
Liquefiable layer
water pressure
Fig. 8. Post-earthquake CPT soundings.
242 W.-J. Chang et al. / Engineering Geology 123 (2011) 235–245
by Seed and Idriss (1970) are plotted in Fig. 12(b). In general, the liq-uefied soil falls within the typical curves for sand by Seed and Idriss(1970). Incorporating the Vs shown in Fig. 9, where Vs at 5 to 6 mdeep is 143 to 148 m/s, the modulus reduction relationship can be in-ferred and used in the advanced ground response analyses and lique-faction evaluations.
5. Liquefaction analysis
The SPT, CPT, Vs, and laboratory testing data were used to evaluatethe liquefaction susceptibility before and after the Jiasian earthquakeat Sinhua site. The semi-empirical procedure outlined by Idriss and
Silty clay (CL)
Silty sand (SM)
Silty clay (CL)
Silty clay (CL)
20
15
10
5
0
Dep
th (
m)
200
200
160
160
120
120
80
80
Vs (m/s)
MASW SCPT
Liquefiable layer
Fig. 9. Post-earthquake Vs profiles at Sinhua site.
Boulanger (2006) was used to evaluate the liquefaction potential interms of the cyclic stress ratio induced by the earthquake (CSR) andthe cyclic resistance ratio (CRR), which represents the capacity ofsoil against liquefaction. The CSR is evaluated as:
CSR ¼ τσ
0vo
¼ 0:65amax
gσv0
σ0vo
rd ð2Þ
where τ is the average shear stress, amax is the maximum horizontalacceleration at the ground surface, g is the gravitational accelera-tion, σvo and σvo
' are the total and effective vertical stress, respec-tively, and rd is the stress reduction coefficient. The liquefactionsusceptibility criteria for silts and clays proposed by Boulangerand Idriss (2006) are applied to distinguish the sand-like andclay-like soils based on the PI value.
Three semi-empirical correlations were employed to evaluatethe CRR for a magnitude of Mw=7.5 (CRR7.5). The correlations be-tween the CRR7.5 and corrected SPT-N value (N1,60) by Idriss andBoulanger (2006), the CRR7.5 and normalized corrected cone resis-tance (Qtn) by Robertson (2009), and the CRR7.5 and overburden-stress corrected shear wave velocity (Vs1) by Andrus and Stokoe(2000) are used in this study. A magnitude scaling factor (MSF) is
100
80
60
40
20
0 Per
cent
pas
sing
by
wei
ght (
%)
0.0010.010.11
Particle size (mm)
Ejected 5m deep 8m deep
Fig. 10. Grain size distributions of ejected material and split tube samples.

0.24
0.22
0.20
0.18
0.16
0.14
0.12
0.10
Cyc
lic s
tres
s ra
tio,τ
/σv0
'
12 3 4 5 6 7 8
102 3 4 5
Number of cycles, NL
Undisturbed specimenDepth=5~6 mFines content=42 %
CRR6.4=0.152
CRR7.5=0.137
Fig. 11. Liquefaction resistance of undisturbed specimen by K0-CDSS test.
243W.-J. Chang et al. / Engineering Geology 123 (2011) 235–245
applied to evaluate the CRR for earthquake magnitude M (CRRM)by:
CRRM ¼ CRR7:5×MSF ð3Þ
A factor of safety against liquefaction (FSLF), defined as the ratiobetween CRR and CSR, of less than 1.0 indicates that the soil couldliquefy.
1.0
0.8
0.6
0.4
0.2
0.0
G(γ
)/G
max
0.0001 0.001 0.01 0.1 1 10 Shear strain, γ (%)
Shear strain, γ (%)
RC test K0-CDSS test Hardin r=0.045
Depth= 5~6 m
Seed mean
Seed upper bound
(a)
30
25
20
15
10
5
0
Dam
ping
rat
io (
%)
0.0001 0.001 0.01 0.1 1 10
RC Test K0-CDSS Test
Seed mean
Seed lower bound
(b)
γ
Fig. 12. Dynamic soil properties of Sinhua site at depths of 5 to 6 m: (a) normalizedmodulus reduction curve, and (b) damping curve.
For the Sinhua site subjected to the 2010 Jiasian earthquake, theamax is 0.189 g (geometric mean of two horizontal components)and the Mw is 6.4, which corresponds to a magnitude scaling factorof 1.34 (Idriss and Boulanger, 2006). When computing the factor ofsafety against liquefaction (FSLF) with CRR-N1,60 curve, the soil layerswith PIN7 and soils deeper than 20 mwere considered non-liquefiedsoil layers. As a result, liquefaction analyses were only performed forthe silty sand layer at depths from 4 to 9 m.
The revised CRR7.5-(N1,60) relationship, fines content correction,and overburden correction factor by Idriss and Boulanger (2006) areused to evaluation the pre- and post-earthquake CRR correspondingto Jiasian earthquake with CECI-BH04 and SLS boring log, respective-ly, and the results are shown in Fig. 13. Pre-earthquake analysisshows that the critical layer is located at depths from 4 to 6 m withfines content of 37 to 64%. The post-liquefaction analysis indicatesthat liquefaction could occur only at depths from 5 to 6 m. The post-earthquake liquefaction analysis with the curve of CRR7.5-Vs1 byAndrus and Stokoe (2000) is also plotted in Fig. 13 and it indicatesthat soil liquefaction could occur at depths from 4 to 9 m.
The normalized cone parameter (Qtn) recommended by Robertson(2009) is implemented to assess the liquefaction resistance with thetwo CPT soundings and the results are plotted in Fig. 14. The soil be-havior type index (Ic) values of 2.5 and 2.7 are plotted to representthe drained, partially drained, and undrained conditions during pen-etration. The results from the CPT sounding with slow penetrationrate (PR=1 mm/s) indicates that soil could liquefy at depths from4.5 to 7 m. However, the results from the CPT sounding with standardpenetration rate (PR=20 mm/s) shows that the factor of safety isgreater than 1 at the depth of 5.2 m due to high Ic value (Ic=2.79).The adverse results from the two CPT soundings with different pene-tration rates indicate that drainage condition during penetrationshould be carefully treated for high fines content soil in the liquefac-tion analysis.
The outcomes of liquefaction potential evaluation with pre- andpost-earthquake in situ index properties show that the critical layeris located at depths from 5 to 6 m for the Jiasian earthquake. To testthe performance of different semi-empirical correlations on siltyfine sands with high fines content in this area, comparisons of cyclicresistances from different in situ testing techniques and laboratoryK0-CDSS on undisturbed specimens are conducted. To make fair com-parisons, the laboratory CRR7.5 from K0-CDSS is multiplied with a fac-tor of 0.9 to take into account of the multidirectional shaking effectsas proposed by Seed (1979). The average values of CRR7.5 evaluatedfrom in situ testing at depths from 5 to 6 m are presented inTable 3. In addition to the abovementioned correlations, the bound-ary curve of CRR7.5-(qc/Vs) for Holocene soils proposed by Roy(2008) is also included in the comparisons. The comparisons showthat CRR7.5 by CPT with standard penetration rate is overestimatedin this silty fine sand layer due to high Ic value. Additionally, the var-iations of CRRs from different in situ tests indicate that those correla-tions are soil specific as addressed by Baxter et al. (2008) andprecautions should be taken when using these on silty fine sandlayers.
6. Summary and conclusion
This paper presents the comprehensive geotechnical reconnais-sance of a liquefaction site at a Quaternary alluvial deposit in southernTaiwan. Liquefaction was triggered by a Mw=6.4 earthquake about44 km away at a silty fine sand layer located at depths of 5 to 6 mwith D50=0.09 mm and fines content greater than 35%. The recur-rence of liquefaction, influence of dynamic soil-structure interactionon triggering liquefaction, availability of pre-earthquake logging,and high fine content in the liquefied soil stratum make this casevaluable for detail study. Subsurface characterizations, includingSPT, CPT, Vs, and K0-CDSS tests on undisturbed specimens retrieved

Silty clay (CL)
Silty sand (SM)
Silty clay (CL)
1.2
1.2
0.8
0.8
0.4
0.4
0.0
0.0
FSLF
SPT-N (pre) SPT-N (post) Vs (post)
0.25
0.25
0.00
0.00
CRR
10
8
6
4
2
0
Dep
th (
m)
0.20
0.20
0.10
0.10
0.00
0.00
CSR
Fig. 13. Liquefaction analyses results with SPT-N and Vs at Sinhua site.
244 W.-J. Chang et al. / Engineering Geology 123 (2011) 235–245
with a modified hydraulic piston sampler, were performed to estab-lish a comprehensive case history for liquefaction study.
The grain size distribution and visual color of the ejected soil,back-calculated liquefaction potential with a pre-earthquake boringlog, and post-earthquake boring log show that the silty sand layer atdepths from 5 to 6 m liquefied during the 2010 Jiasian earthquake.Comparisons between the pre- and post-earthquake boring logs indi-cate that the average SPT-N values in the liquefiable silty fine sand
3.
3.
2.0
2.0
1.0
1.0
0.0
0.0
Ic
PR=20 mm/s PR=1 mm/s
Ic=2.5
Ic=2.7
10
8
6
4
2
0
Dep
th (
m)
120
120
80
80
40
40
0
0
Qtn
PR=20 mm/s PR=1 mm/s
Fig. 14. Liquefaction analyses of C
layer (4–9 m) increased from 5 to 7.5 and the average fines contentreduced from 60 to 35% after liquefaction. The results show that liq-uefaction could change the soil properties in silty fine sand interlayerat Sinhua site.
The revised simplified procedure by Idriss and Boulanger (2006) isused in evaluating the CSR and CRR from SPT-N values. Pre-earthquakeanalysis confirms that soil at depths from 5 to 6 m liquefied duringthe Jiasian earthquake. Liquefaction resistances from post-earthquake
Silty clay (CL)
Silty sand (SM)
Silty clay (CL)
0
0
0.30
0.30
0.25
0.25
0.20
0.20
0.15
0.15
0.10
0.10
CSR & CRR
CSRCRR (PR=20 mm/s)CRR (PR=1 mm/s)
PT soundings at Sinhua site.

Table 3Comparison of CRR7.5 at depths of 5–6 m in Sinhua Site.
Method CRR7.5CRRin−situCRRlab
Reference
K0-CDSS 0.123 1 Seed (1979)SPT-N 0.12 0.98 Idriss and Boulanger (2006)CPT(PR=20 mm/s)
0.131 1.06 Robertson (2009)
CPT(PR=1 mm/s)
0.09 0.73 Robertson (2009)
Vs 0.1 0.81 Andrus and Stokoe (2000)qc/Vs 0.075 0.61 Roy (2008)
245W.-J. Chang et al. / Engineering Geology 123 (2011) 235–245
in situ tests, including SPT, CPT with two penetration rates, and Vs
measurement, are evaluated for the liquefied silty fine sand layer atdepths from 5 to 6 m and the results are compared with laboratoryK0-CDSS tests on undisturbed specimens. The cyclic resistances fromthe two CPT soundings show that CRR7.5 by CPT with standard pene-tration rate could be overestimated in this silty fine sand layer due tohigh Ic value and the drainage condition during penetration should beconsidered for high fines content soil in the liquefaction analysis. Ad-ditionally, variations of CRRs from different in situ tests indicate thatcorrelations among CRR and in situ tests could be soil specific andprecautions should be taken when using these curves on silty finesand layers. Nevertheless, liquefaction analyses with in situ test dataand laboratory results show that this site is still highly susceptibleto liquefaction.
Acknowledgements
This study was supported by the National Science Council,Taiwan, ROC, under grant No. NSC 98-2211-E-260-029. The authorsare also grateful for the graduate students at NCKU for conductingthe laboratory work. Any opinions, findings, and conclusions or rec-ommendations expressed in this material are those of the authors,and do not necessarily reflect the views of the National ScienceCouncil.
References
Andrus, R.D., Stokoe II, K.H., 2000. Liquefaction resistance of soils from shear-wave ve-locity. Journal of Geotechnical and Geoenvironmental Engineering, ASCE 126 (11),1015–1025.
Baxter, C.D.P., Bradshaw, A.S., Green, R.A., Wang, J.H., 2008. Correlation between cyclicresistance and shear-wave velocity for Providence silts. Journal of Geotechnicaland Geoenvironmental Engineering, ASCE 134 (1), 37–46.
Boulanger, R.W., Idriss, I.M., 2006. Liquefaction susceptibility criteria for silts and clays.Journal of Geotechnical and Geoenvironmental Engineering, ASCE 132 (11),1413–1426.
Central Geological Survey, MOEA, 2005. Geologic map of Taiwan: Shinhua sheet.Central Geological Survey, 2010. MOEA, Taiwan. http://www.moeacgs.gov.tw/.Chang, L.S., Chow, M.C., Chen, P.Y., 1947. The Tainan earthquake of December 5, 1946.
Bulletin of Geological Survey, Taiwan 1, 11–18.Hardin, B.O., Drenvich, V.P., 1972. Shear modulus and damping in soils: design equa-
tions and curves. Journal of the Soil Mechanics and Foundations Division, ASCE98 (SM7), 667–692.
Huang, A.B., Tai, Y.Y., Lee, W.F., Ishihara, K., 2008. Sampling and field characterization ofthe silty sand in Central and Southern Taiwan. Proc. 3rd International Conferenceon Site Characterization (ISC-3). Taylor and Francis, Taipei, pp. 1457–1463.
Idriss, I.M., Boulanger, R.W., 2006. Semi-empirical procedures for evaluating liquefac-tion potential during earthquakes. Soil Dynamics and Earthquake Engineering 26(2–4), 115–130.
Kim, K., Prezzi, M., Salgado, R., Lee, W., 2008. Effect of penetration rate on cone pene-tration resistance in saturated clayey soils. Journal of Geotechnical and Geoenvir-onmental Engineering, ASCE 134 (8), 1142–1153.
Lee, S.J., Lui, S., 2010. 2010/03/04 M6.4 earthquake, Taiwan Finite-fault source ruptureprocess: preliminary result. http://www.earth.sinica.edu.tw/~sjlee/eq20100304/index_e.htm.
Moh and Associates, 2000. Site investigation of liquefied soil at Nantou and Wufengareas. (in Chinese).
Park, C.B., Miller, R.D., Xia, J., 1999. Multichannel analysis of surface waves. Geophysics64 (3), 800–808.
Robertson, P.K., 2009. Performance based earthquake design using the CPT. Proc., ISTokyo Conf. CRC Press/Balkema, Taylor and Francis Group, Tokyo.
Roy, D., 2008. Coupled use of cone tip resistance and small strain shear modulus to as-sess liquefaction potential. Journal of Geotechnical and Geoenvironmental Engi-neering, ASCE 134 (4), 519–530.
Seed,H.B., 1979. Soil liquefactionand cyclicmobility evaluation for level groundduring earth-quakes. Journal of the Geotechnical Engineering Division, ASCE 105 (2), 201–255.
Seed, H.B., Idriss, I.M., 1970. Soil moduli and damping factors for dynamic response an-alyses. Report EERC 70–10. Earthquake Engineering Research Center, University ofCalifornia, Berkeley.
Seed, H.B., Idriss, I.M., 1982. Ground motions and soil liquefaction during earthquakes.Earthquake Engineering Research Institute, Berkeley, California.
Tani, K., Kaneko, S., 2006. Method of recovering undisturbed samples using water-soluble thick polymer (in Japanese) Tsuchi-to-Kiso, Journal of Japanese Geotechni-cal Society 54 (4), 145–148.