geotechnical properties and slope stability analysis of
TRANSCRIPT

Cedarville UniversityDigitalCommons@Cedarville
Science and Mathematics Faculty Publications Department of Science and Mathematics
1981
Geotechnical Properties and Slope StabilityAnalysis of Surficial Sediments on the BaltimoreCanyon Continental Slope: U.S. Geological SurveyOpen-File Report 81-733J. S. Booth
R. A. Farrow
Thomas L. RiceCedarville University, [email protected]
Follow this and additional works at: http://digitalcommons.cedarville.edu/science_and_mathematics_publications
Part of the Geology Commons
This Report is brought to you for free and open access byDigitalCommons@Cedarville, a service of the Centennial Library. It hasbeen accepted for inclusion in Science and Mathematics FacultyPublications by an authorized administrator ofDigitalCommons@Cedarville. For more information, please [email protected].
Recommended CitationBooth, J. S.; Farrow, R. A.; and Rice, Thomas L., "Geotechnical Properties and Slope Stability Analysis of Surficial Sediments on theBaltimore Canyon Continental Slope: U.S. Geological Survey Open-File Report 81-733" (1981). Science and Mathematics FacultyPublications. 309.http://digitalcommons.cedarville.edu/science_and_mathematics_publications/309

UNITED STATES DEPARTMENT OF THE INTERIOR
GEOLOGICAL SURVEY
GEOTECHNICAL PROPERTIES AND SLOPE STABILITY ANALYSIS
OF SURFICIAL SEDIMENTS ON THE
BALTIMORE CANYON CONTINENTAL SLOPE
By James S. Booth, Richard A. Farrow, and Thomas L. Rice
Prepared in cooperation with theU.S. BUREAU OF LAND MANAGEMENT
under Memoranda of Understanding AA551-MU9-4, AA851-MUO-18
U.S. Geological Survey Open-File Report 81-
This report is preliminary and has not been reviewed for conformity with U.S. Geological Survey editorial standards and stratigraphic nomenclature. Any use of trade names is for descriptive purposes only and does not imply endorsement by the USGS or the Bureau of Land Management.
1981

Table of Contents
Page
Introduction. ........................... 1
Methods .............................. 3
Shipboard ............................ 3
Laboratory. ........................... 6
Index properties. ....................... 6
Triaxial testing. ....................... 7
Results and interpretations .................... 8
Shear strength. ......................... 8
Index properties. ........................ 21
Triaxial testing. ........................ 38
Slope stability .......................... 40
Conclusions ............................ 44
References. ............................ 45
Appendix I: Shear strength data. ................. 48
Appendix II: Index properties. .................. 52
Appendix III: Triaxial test results. ............... 56

INTRODUCTION
Evidence of a major episode of mass movement northeast of
Wilmington Canyon (McGregor, 1977) has underscored the need for research
on potential geologic hazards in the Baltimore Canyon lease area.
However, despite the fact that this mass movement event has focused
attention on the possibility of future events, it is not necessarily a
precursor to them. That is, the central question of whether the slope
is unstable may not find its answer from the study of past events, but
rather from studies of current slope conditions.
The geologic setting bears directly on the question of current
conditions, and it has been thoroughly investigated. In addition to the
aforementioned study by McGregor (1977), seismic studies by Emery and
Uchupi (1972), Embley and Jacobi (1977), and Robb and others (1981) have
shown that this portion of the Continental Slope is relatively steep
(gradients of 10 are common), is incised by numerous major canyons and
lesser valleys, and may contain a Pleistocene sediment section up to a
few hundred meters thick. In addition, the slope is frequently marked
by evidence suggesting mass movement. As pointed out by Robb and others
(1981), however, mass movement may not be as ubiquitous as some other
studies have implied.
It is likely, though, that rapid deposition, a common predecessor
of mass movement, occurred over the whole Mid Atlantic Continental Slope
area during times of lowered sea level. At those times stream discharge
was greater because of glacial meltwater runoff. The associated greater
sediment load was carried across the present shelf directly to the slope
(e.g., Twichell and others, 1977). The high rate of deposition,
particularly as it involved the fine-grain sediments that characterize

the area (Doyle and others, 1979; Keller and others, 1979), may have
generated excess pore pressures within the sediment section and, hence,
created a condition of instability on the slope. Although sedimentation
rates are probably lower at present than they were during the past, the
dissipation of these excess pore pressures may be incomplete. If this
is the case, the slope would still be underconsolidated and thus be
prone to fail - especially in conjunction with the rather steep
gradients.
Results of analyses of samples from this and adjacent slope areas
are mixed. In a study south of Baltimore Canyon, for example, McGregor
and others (1979) noted the presence of underconsolidated sediment and
other conditions suggesting instability. Within the lease area itself,
however, similar conditions have not been identified. Slope stability
analyses by Keller and others (1979) indicated that the surficial
sediments were generally stable, and piston cores examined by Doyle and
others (1979) showed no evidence of mass movement. Samples from a 300 m
drill hole (AMCOR 6021) near Toms Canyon also indicated stability
(Sangrey and others, 1979), although the large quantities of methane
found at that site were not considered in the calculations as
instability due to excess pore pressures generated by gas accumulation
has not been investigated in the area. The massive slide deposit
northeast of Wilmington Canyon, which is up to 300-m thick and involves
3 11 km of sediment (McGregor, 1977), has been examined by Bennett and
others (1977) for its geotechnical properties. Their evidence does not
refute the hypothesis that the feature is a slide deposit, and they
present additional evidence that creep is occurring upslope from the
apparent mass movement scar.
The previous acoustic and sampling studies established the

framework for the research of hazard-related problems in the Baltimore
Canyon lease area. It was our objective to provide quantitative
information regarding slope stability and other potential hazards, and
establish the general geotechnical properties of the sediment. Piston
cores were the principal research tool used in the investigation. Site
selection for these cores was based on the need to achieve geographic
and geologic coverage, and thus a variety of environments from different
locales were sampled. These included open slope areas, valley walls,
valley floors, lobate sediment masses, and others. Locations are shown
in Figure 1. The scope of our investigations is limited by the
generally less than 10 m penetration of piston coring. Nonetheless,
data from the surficial sediments is an important part of an overall
evaluation.
METHODS
Shipboard
The piston cores used for the geotechnical studies were collected
aboard the R/V ENDEAVOR in August 1979 and October 1980. The coring
system was designed to obtain cores with minimal mechanical disturbance
because many geotechnical properties, especially those related to
strength, are vulnerable to the effects of disturbance. The system thus
differed from conventional systems in many respects. Core sample
diameter was 89 mm, which is larger than normal piston cores. This
extra size not only reduces disturbance during the act of coring, but,
in the event of distortion on the core edge due to wall friction,
permits removal of a relatively undisturbed inner core (subcore) for
triaxial and consolidation testing. The liner was protected against

73°00 72°OO
0______10______20 kmHBHBT ' RHHCT
CONTOURS IN METERS
HUDSON CANYON
TOMS CANYON
LINDENKOHL CANYON
Fig. 1. Core locations. Labeling refers to core number, not site number.

collapse from differential pressure by a special sleeve and 0-ring
assembly at the joints between the outer barrels. The cutter unit had a
cutting angle of less than 10°, which assured optimum penetration with a
minimum of disturbance. Liner sections (up to 4, 3m long sections per
core) were taped at the ends in order to achieve a snug fit against the
barrel and were beveled inside each end to promote a smooth piston
action. Using this system, 13 cores up to 10 m long were recovered.
As was the case during the sampling operation, avoiding disturbance
was the prime consideration during core processing and storage. Once on
board, the cores were cut into 1-1/2 m sections by using a tube cutter
to sever the liner and wire saw to part the sediments. Two 40 cm
subsections were also cut for later triaxial testing, and a 15 cm
subsection was removed for consolidation testing. All subsections,
which were cut from the bottom portions of the cores, were X-rayed in
order to judge the condition of the sample; only "undisturbed" samples
were retained for later testing. Finally, the subsections were capped,
taped, sealed with wax, and stored under refrigeration. They were kept
in the in situ position in specially fabricated boxes padded with foam
rubber.
The remaining core sections were split lengthwise: one part of each
section served as an archive half, the other as a working half. The
archive half was placed in a D-tube and stored in a refrigerated van.
The working half was taken to the shipboard laboratory for description,
strength testing, and subsampling.
After a cursory description, "undisturbed" shear strength was
measured. A four-bladed, 12.7-mm-square laboratory vane was used at
intervals of 0.50 m and at lithologic changes. Obvious sand layers,
which are cohesionless and therefore inappropriate for this type of
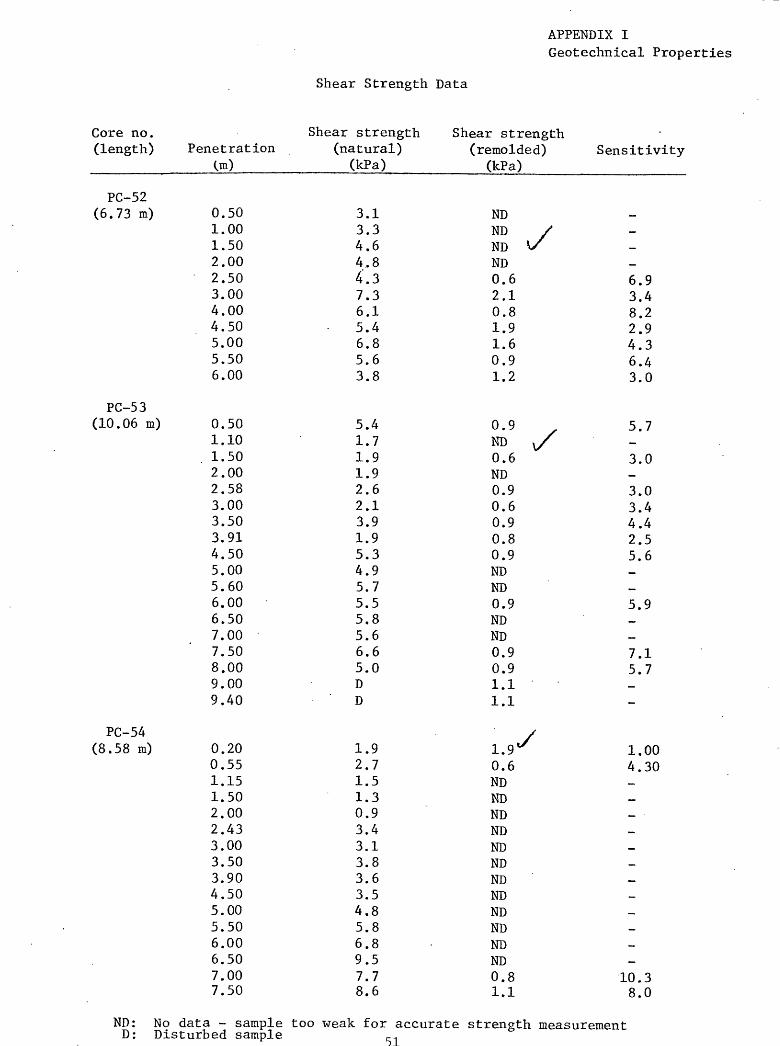
test, were avoided. The blade was inserted normal to the long direction
of the core and buried at least 20 mm into the sample. In order to
guard against sample drainage during the application of torque, a
rotation rate of 0.0262 rad/s (90°/min) was used. Because of potential
disturbance associated with prolonged exposure to ship motion and
vibrations, this rapid rate also serves the function of allowing the
test to be completed quickly, thus reducing the probability of this type
of disturbance. The accuracy of the vane shear measurements is + 0.30
kiloPascals (kPa). It is assumed on the basis of previous experience
(e.g., Booth, 1979) that strength reduction due to the release of
in situ stresses and mechanical disturbance is generally between 15 and
30 percent. Remolded strength (strength of thoroughly kneaded sample)
was also determined with the vane apparatus. Subsamples for index
property testing were taken at the locations of strength measurements,
placed in plastic bags, and sealed in cans for later laboratory testing.
These samples, and those taken for triaxial and consolidation testing,
were transported to the laboratory in a refrigerated (4°C.) van.
Laboratory
Index Properties
The suite of index property tests (bulk density, water content,
liquid and plastic limits, and grain specific gravity) was conducted
according to procedures recommended by ASTM (1977), with two exceptions.
Grain specific gravity was measured with an air comparison pycnometer
and all water content data were corrected for salt content. Precisions
were: water content, + 3% (relative); liquid limit, + 3% (absolute);
plastic limit, + 2% relative. Derived from this basic data set were

plasticity index, liquidity index, and porosity. The values of the
index properties are presented in Appendix II.
Triaxial Testing
Consolidated undrained triaxial tests with pore pressure
measurements were conducted in accordance with procedures given by
Bishop and Henkel (1957). Briefly, for each set of tests three
specimens were cut from the prime core sample and trimmed to a right
cylinder 50 mm in diameter and 100 mm in height. The specimens were
then placed in triaxial cells, saturated, and consolidated to
approximately 1.0, 2.0, and 4.0 times the assumed in situ overburden
pressure. After consolidation was complete, the specimens were sheared:
generally at a rate of 0.015 mm/min. Data from all phases of the tests
were logged by an automatic data acquisition system.
The test results are presented in tables and graphs in
Appendix III. Information about each sample, including index
properties, test conditions, and laboratory data are given in that
appendix along with a full explanation of symbols and graphs.
The angle of internal friction with respect to effective stress
(0'), which is necessary for evaluating slope stability, was derived
from p'-q diagrams. Specifically, a continuous plot of p' = (a^ + cr«)/2
versus q = (a-^-a^/2') each of the three levels of confining pressure
results in three stress paths, where O-^ andcr^ are the major and minor
principal stresses and crj^ and cr^ are the major and minor effective
principal stresses. The line that best encloses these stress paths is
drawn, and its slope and its intercept a are calculated. The values
of internal friction 0' and cohesion C' are calculated from the
following relationships: sin0' = tana and C' = a/cos0'.

RESULTS AND INTERPRETATIONS
Analyses of the 13 cores recovered are still underway, as are the
analyses of the 21 piston cores recovered during sampling operations
during 1980. The results presented herein are thus partial, and
generalizations or interpretations based on them are subject to change.
All types of analyses that are complete or nearly complete for an entire
core are included in this report.
Shear Strength
The widespread occurrence of discrete sand layers, variable sand
percentages, and other lithologic inconsistencies observed during
cursory core descriptions indicate a complex depositional environment
which is reflected in the strength profiles (figs. 2a-21). In
particular, variations in sand percentage contribute to the sawtooth
nature of some of the plots (e.g., fig. 2e). Such textured variations
can greatly influence the strength even within a basically cohesive
sediment. Despite these variations the usual strength increase with
depth is seen in most of the cores. A lack of strength increase with
depth is not unusual in such short cores, and it is not surprising that
this relationship did not show in all cases. Although strength usually
increases with depth, absolute strength values and the rates of strength
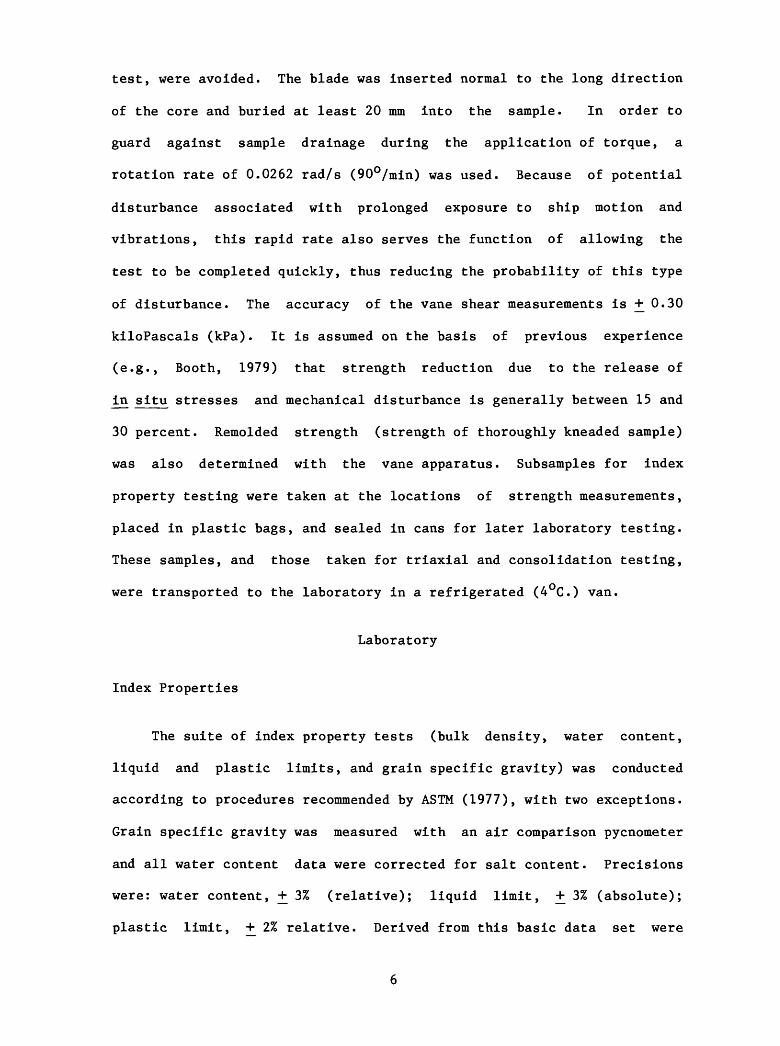
increase in the tested cores are quite variable. As examples, cores
PC-46 and PC-53 (figs. 2i and 2k) have an initial low shear strength and
increase gradually to a strength of about 6 pKa. The low rate of
increase along with the low absolute values indicate that these cores
are abnormally weak. In contrast, core PC-8 (fig. 2a) shows a rapid

SHEAR STRENGTH (hPA)
02 4 6 8 IB 12 14 16 18
-1
-2
-3
CO
(5
-4
-5
cdCO
-7
-8
-91
STRENGTH PROFILE: PH8
Figure 2a. Shear strength (S ) vs. depth in core.

B 1 2
SHEAR STRENGTH (kPA)
34 5 6 7 8 9 10
-1
-2
-3
00
Q3
-4
-5
cdca
-7
-8
-9.
-101
STRENGTH PROFILE: PC-13
Figure 2b. Shear strength (S ) vs. depth in core.
10

SHEAR STRENGTH (kPA)
B 1 11 12 13 14
-1
-2
-3
-4
-5
CO
-6
-7
-8
-9
-IBl
STRENGTH PROFILE: PC-39
Figure 2c. Shear strength (S ) vs. depth in core,
15H
11

SHEAR STRENGTH (kPA)
2 3 4 5 6 7 8 9 10H h H I H h
-1
-2
-3
-4
-5
-6
-7
-8.
-9.
-101
STRENGTH PROFILE: PC-40
Figure 2d. Shear strength (Su ) vs. depth in core,
12

SHEAR STRENGTH (kPA)
-1
-2
-3
CO
oi s-4
-5
CD
-6
-7
-9
-IBl
STRENGTH PROFILE: PC-41
Figure 2e. Shear strength (S ) vs. depth in core,
13

El 1 2 3 i i h
-1
-2
-3
CO
CD -*->
J
-4
-5
cdon
-6
-7
-8.
-9
-101
9 AR STRENGTH (kPA)
4 5 6
STRENGTH PROFILE: PC-43
Figure 2f. Shear strength (Su) vs. depth in core,
789 10 H
14

SHEAR STRENGTH (kPA)
-1
-2
-3
-4
-5
-6
-7
-8
-9.
STRENGTH PROFILE: PC-44
-Hi
Figure 2g. Shear strength (Su> vs. depth in core,
15

0
SHEAR STRENGTH (kPA)
0 1 2 3 4 5 6 7 8 9 10 11 12 13 14 15
-1
-2
00
QJ
-4
-5
criCO
-6
-7
_g
-9.
-101
STRENGTH PROFILE: PC-45
Figure 2h. Shear strength (Su) vs. depth in core,
16
01
SHEAR STRENGTH (kPA)
2 3 4 5 6 7 8 9 IB
-1
-2
-3
_ -4w ~o> -«-> o>
-5
-7
-8
-9
-101
STRENGTH PROFILE: PC-46
Figure 21. Shear strength (Su) vs. depth in core
17

0123Kh | | |-
-2
-3
J
cdOD
-6
-7
-8
-9.
-101
SHEAR STRENGTH (KPA)
456I I h-
STRENGTH PROFILE: PC-52
7 8 9 10
Figure 2j. Shear strength (S ) vs. depth in core,
18

81
SHEAR STRENGTH (kPA)
2 3 4 5 6 7 8 9 IB
-11
-2
-3
-4
1S
-5
-6
-7
-8
-9
-10
STRENGTH PROFILE: PC-53
Figure 2k. Shear strength (S ) vs. depth in core
19

SHEAR STRENGTH (hPA)
01 2 3 4 56 7 8 9 IB 1 . I I
-11
-21
-31
-41
-51
-61
-71
-81
-91
STRENGTH PROFILE: PC-54
-101Figure 21. Shear stength (S ) vs. depth in core,
u
20

increase in strength up to 18 kPa at 4 m. This sediment is stronger
than would normally be expected despite the fact that its surface
strength is comparable to the previously mentioned cores. Overall, the
shear strengths of these sediments span values from below the limit of
accurate measurement (less than 0.5 kPa) to 46.7 kPa (see table 1). The
average value of 5.5 kPa is typical for cohesive surficial marine
sediments.
Sensitivity, the ratio of natural shear strength to remolded shear
strength of a sediment, is an important measure of the amount of
strength lost by a sediment after it has been disturbed by earthquakes
or other forms of loading. As shown in table 1, the mean sensitivity of
these sediments is about 6, which corresponds to an 86% reduction in
strength after remolding. According to the classification of Rosenquist
(1953), these sediments, on average, would be considered very sensitive
and range from insensitive to slightly quick. Marine fine-grain
sediments generally have sensitivities of 4 or less; thus these
sediments are slightly more sensitive than normal.
Index Properties
The water content, bulk density, and porosity data shown in table 1
would usually be considered incompatible with the reported shear
strength data. In fact, they also differ markedly from the average
values for the Mid-Atlantic Slope reported by Keller and others (1979),
who found higher water contents and porosities, and lower bulk densities
than are shown in table 1. In this case these differences can be
attributed to the presence of sand. Cohesion and void space would be
reduced with an increasing percentage of sand and, therefore, strength,
water content, and porosity would decrease while bulk density would
21

Table 1. Summary of geotechnical data
Natural Water Bulkshear strength Sensitivity content density Porosity
(kPa)_____________________(%)________(g/cc)___________(%)min avg max min avg max min avg max min avg max min avg max
5.5 46.7 1.0 6.0* 13.8* 26 58 119 1.44 1.73 2.06 41 60 76
Liquid Plastic Plasticity Liquidity limit_______________limit________________index_____________index______
min avg max min avg max min avg max min avg max
21 48 91 15 23 40 8 25 60 0.73 1.42 2.20
^Because many samples were too weak to measure after remolding, these values are minimums.
22

increase. Thus, just as sand is in part responsible for some of the
erratic strength profiles, it also may be responsible for the unusual
combination of water content, bulk density, and porosity and shear
strengths noted here. Because the results of the textural analyses on
these cores are not yet available, the influence of sands in the cores
cannot be evaluated beyond the level that simple core description
permits.
Grain specific gravity, measured on 62 samples, averaged 2.70.
This value is typical of fine-grained terrigenous sediment and is
identical to the value reported for the Mid-Atlantic slope cores
recovered by Keller and others (1979).
The plasticity data, which here includes liquid and plastic limits,
plasticity index (liquid limit minus plastic limit), and liquidity index
(the ratio of natural water content minus plastic limit to plasticity
index) provide a means for classifying sediments. The plasticity chart
devised by Casagrande (1948) was used as the method of classification.
The chart is divided into fields that embrace the different plasticity
characteristics of different sediment (soil) types. Figure 3 is the
plot of the samples from this study on such a chart. Note the spread of
data points along "Line A". This indicates that a wide variety of
sediment types are represented by the cores. Specifically, the
sediments have a low organic content and include sands, silts, and
clays. The fields marked as inorganic clays of low or medium plasticity
also include sandy and silty clays (Keller and others, 1979).
Approximately half of the samples from this study fall into those two
categories. This tendency toward coarse grain sizes is also reflected
on the data summary (table 1), which shows liquid limit, plastic limit,
and plasticity index values slightly below those of a sediment totally
23

60 T
o
WT
= 50
50"
WL =
3040
-
30
Inorganic
clay
s of
medium
plasticity
Inorganic
clay
s of
low
plasticity
20 "
10
--
0 *
Inorganic
clays
of
high plasticity
oooo
oOO OO
o ooo
o
o
o
o
ooo o
OO O
oO
>r
0
O
O
Inorganic
silt
s of
hi
gh compressibility
and
orga
nic
clays
Inorganic
silt
s of
medium co
mpre
ssib
ilit
y an
d or
gani
c silt
s
1030
Fig.
3,
40
50
60
Liquid li
mit WL
(%)
Clas
sifi
cati
on of
se
dime
nts
base
d on
plasticity ch
arac
teri
stic
s.
7080
90100

dominated by fines. Compared to typical values of many types of
terrestrial soils, these plasticity data do not imply any anomalous
sediment types or extraordinary conditions. The spread of the data on
the plasticity chart indicates a complex depositional environment, but
the area is characterized by sediments with a common range in texture
and common mineralogy.
The textural variability again manifests itself in the plastic
limit-liquid limit-water content plots (figs. 4a-41) that show the
changes in the three variables down core. An increase in the percentage
of coarser grain sizes is often mirrored by a decrease in both plastic
and liquid limit (the change in liquid limit generally being the most
striking), and in the plasticity (shown in the figures as the distance
between the two limits). Most of the cores show this effect to some
degree with some of the cores, e.g., PC-40 (fig. 4a), possibly
manifesting multiple changes in textural properties.
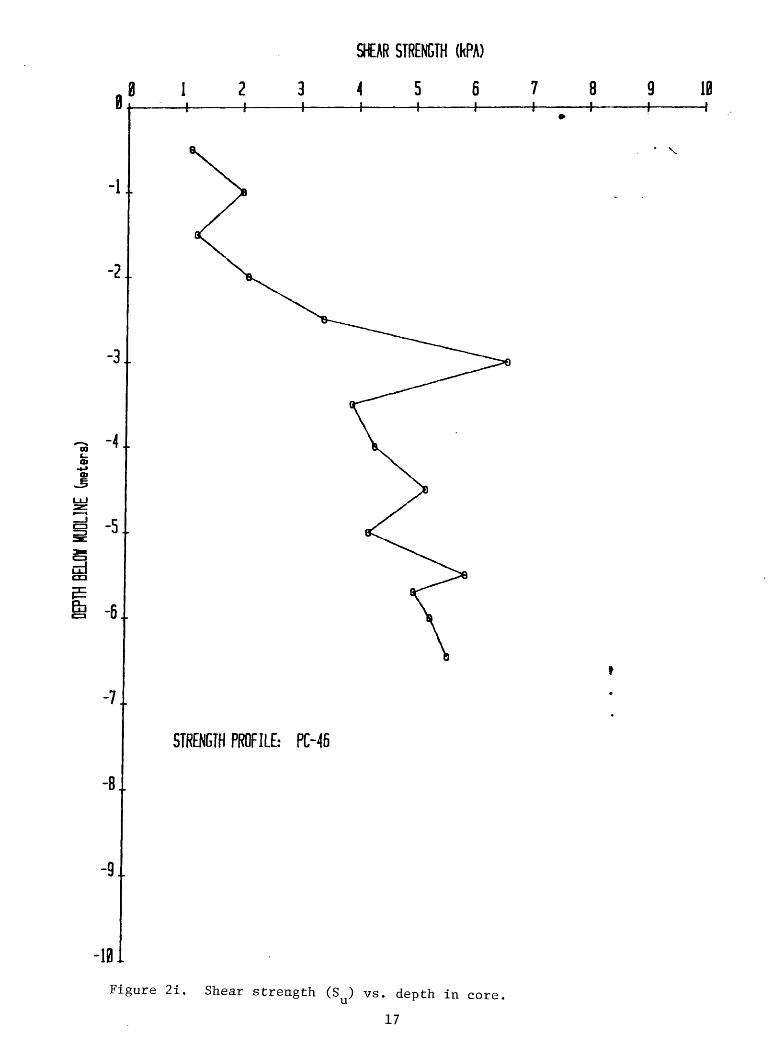
The vertical profiles of liquidity index, represented by the
relationship between natural water content and liquid limit, are also
shown in figures 4a-41. A profile typical of most surficial sediments
is observed in figure 4a. The water content is above the liquid limit
in the upper portion of core PC-8, then it falls below the liquid limit
for the remainder of the core. Although typical for most surficial
sediments, this relationship is not typical of most of the cores in this
study. Throughout their length, water content values consistently match
or exceed liquid limits. The average liquidity index of 1.40 (table 1)
underscores this relationship. Thus, upon remolding from a shock or
other mode of disturbance, these sediments would behave more as a liquid
than as a plastic, a fact that has implications regarding slope
stability. Further, these data also have implications regarding the
25
-o-IMR VALUE: PLASTIC LINITtt)-o-HIGHER VALUE: LIQUID LIHITtt)
IB 20 38 40 SBH I I I I
-x-WTER CONTENT 0)
7BH
PC-B8
1BB 11B 12B_, I 4
-1..
-3
? -<o>
-5
-6
-7
plastic limit
liquid limit
water content
-8
-9. Figure 4a. Plastic limit, liquid limit, and natural water content vs. depth in core.
-IB I 26

-o-LOKR VALUE: PLASTIC LINITtt) -x-KATER CONTENTU)-o-HIGHER VALUE: LIQUID LIHITtt) PC-13
2B 30 40 50 70 80 110 120
-1..
-2..
-3..
-4.. s
-5..
-6..
-7..
-8..
-§ .. Figure 4b. Plastic limit, liquid limit, and natural water content vs. depth in core.
-IB I 27

0
-i
-2
-3
-4
-5
cdCO
-fiU
-7
-8
-9.
o-LOYER VALUE: PLASTIC LIKITtt) o-HIGHER VALUE: LIQUID LIMITtt)
-x-KATER CONTENTtt)PC-39
0 IB 20 30 40 50 60 70 90 100 110 120H I I I
Figure 4c. Plastic limit, liquid limit, and natural water content vs. depth in core.
28

-o-LWER VALUE: PLASTIC LIHIT(I) -x-WTER CONTENT CO-o-HlGHER VALUE: LIQUID UNIT CD
0 10 20 30 40 50 60 70
-7..
PC-40
120i i i i
-8..
-9..Figure 4c. Plastic limit, liquid limit, and natural water content
vs. depth in core. *
29-101

-o-LOKER VALUE: PLASTIC LIMIT(I)-o-HIGHER VALUE: LIQUID LIMIT (I)
-x-KATER CONTENT«)PC-41
lie 120
-5..
cd00
-6..
-7..
-8
~9 .. Figure 4e. Plastic limit, liquid limit, and natural water content vs. depth in core.
-101 30

B
-o-LWER VALUE: PLASTIC LIMIT Q)-o-HIGHER VALUE: LIQUID LIMIT(Z)
B IB 2B 3B 4B 5B
-1
-3
-5
cd00
-fi0
-7
-8.
-9.
-1B1
-x-WTER CONTENT (Z)
7B 8B
PC-43
IBB IIB I2B
Figure 4f. Plastic limit, liquid limit, and natural water content vs. depth in core.
31

-o-LWER VALUE: PLASTIC LIMIT (I)-o-HIGHER VALUE: LIQUID LIMIT CD
-x-WTER CONTENT CDPC-44
19 It 20-4-
3B 70 80 90 100 110 120_, i
-1
-2
-3
» -4
-5
LZJ
-6
-7
-8
Figure 4g. Plastic limit, liquid limit, and natural water content ~9 .. vs. depth in core.
-10 i 32

e
-i.
-3.
-4..01
4-»QJ
-5.
-7
-8.
-IB I
-o-LOIER VALUE: PLASTIC LIHIT(Z)-o-HIGHER VALUE: LIQUID LIMIT(Z)
-x-WTER CONTENT (Z)
B IB 2B 3B 5B 6B 7B 8B
LZJCO
1 ' -6.
m
6
0
PC-45
-.0
110 120
Figure 4h. Plastic limit, liquid limit, and natural water content vs. depth in core.
33

-o-LOVER VALUE: PLASTIC LIHITCD-o-HIGHER VALUE: LIQUID LIHITCD
-x-MTER CONTENT 0)PC-46
Figure 4i. Plastic limit, liquid limit, and natural water content vs. depth in core.
34

0
-i
-2
-3
-4
-5
cd00
-6
-7
-8
-9.
-101
-o-LOVER VALUE: PLASTIC LIHITO)-o-HIGHER VALUE: LIQUID LIHITO
-x-MTER CONTENT (»PC-52
B IB 2B 3B 4B 5B 6B 7B 8B 110 120
Figure 4j. Plastic limit, liquid limit, and natural water content vs. depth in core.
35

-1..
-2.
-3..
-,
-7..
-8
-9 .
-101
-o-LOKER VALUE: PLASTIC LIHITtt)-o-HIGHER VALUE: LIQUID LIMIT(Z)
IB 2% 30 40 SBH I I I !
-x-KATER CONTENT 0)
7B 8B 9BH I h-
PC-53
11B 12B
Figure 4k. Plastic limit, liquid limit, natural water content vs. depth in core.
36

-1
-2
-3
~» ~403
-5
cden
-8
_g
-101
-o-LOKER VALUE: PLASTIC LIHITO)-o-HIGHER VALUE: LIQUID LIHITO
rWTER CONTENT COPC-54
i i i i
Figure 41. Plastic limit, liquid limit, and natural water content vs. depth in core.
37

consolidation state of the sediments. These are discussed in the
section on slope stability.
Triaxial Testing
The results of the triaxial tests are given in table II. These
data do not reflect any unusual sediment characteristics, although the
angle of internal friction (0') is somewhat low for cores PC-53 and
PC-54. For the other cores the 0' values are typical of essentially
fine-grain marine sediments. The highest value (29.9°) is associated
with PC-43. As inferred from the plasticity data (e.g., fig. 4f), this
core has relatively coarser grain sizes in its lower portion. This is
compatible with the higher friction angle noted here in that 0' tends to
increase with increasing grain size. The slightly lower values of 22.0°
and 21.5° for cores PC-53 and PC-54 may also indicate a textural effect;
in this case, finer grain sizes. A change to a smectite dominated clay
mineral suite may also be responsible for the low values.
Cohesion (C') represents the strength of the sediment at zero
effective stress; that is, the strength due to interparticle attraction
alone. The values shown in table II are typical of the types of
sediment discussed thus far.
The stress-strain relationships of the samples indicate that
failure occurs generally between 2% and 20% strain. This large spread
reflects the variety of sediment present. Generally, strains above 5%
are common for cohesive sediments and plastic failure (i.e., no discrete
failure plane(s) is typical. Such was the case for these sediment. A
few samples reached failure at less than 5% strain, however, indicating
a less plastic sediment. Stress-strain curves are shown in
Appendix III.
38

Table II. Summary of selected triaxial dataC 1
Core (kPa)
PC-39
PC-40
PC-43
PC-44
PC-45
PC-46
PC-52
PC-53
PC-54
Average
7.8
4.0
8.7
7.4
2.7
2.2
4.8
1.9
5.5
5.0 kPa
25.2°
26.0°
29.9°
27.5°
29.1°
24.1°
27.5°
22.0°
21.5°
25.9°
39

SLOPE STABILITY
The geotechnical evidence clearly suggests that this area of the
Continental Slope has been subjected to a complex and variable pattern
of deposition in recent geologic time. It is an obvious hypothesis,
therefore, that the mass movement potential of these surficial sediments
is likewise variable. This hypothesis may be tested directly through
slope stability analysis and indirectly by determining the consolidation
state of the sediment.
Although several methods of stability analysis are applicable the
general infinite slope model was selected for use here. Other methods
will be presented in a later report. The general equation is:
F = (1 - ue/y'ZCOS2a)tan0'/tana
where F is the factor of safety against failure (<1 is unstable, >1 is
stable), u is the excess pore pressure (relative to hydrostatic
pressure), y' is the buoyant unit weight (bulk density minus the density
of seawater), Z is the thickness of sediment, a is the slope angle, and
0' is the angle of internal friction. For a first approximation, u ise
assumed to be zero, and the equation may be rewritten as
F = tan0'/tana
Therefore, failure should only occur where the slope was equal to or
greater than the angle of internal friction. Table III shows the
results of the calculations. The F values in all cases indicate that
these sediments are inherently stable. Thus, if they are normally
consolidated or overconsolidated, mass movement would be unlikely under
all but extreme circumstances.
A knowledge of pore pressures is absent in this study. This
40

Table III. Factor of safety against mass movement (F = tan <J>'/ tan a)
Core
PC-39
PC-40
PC-43
PC-44
PC-45
PC-46
PC-52
PC-53
PC-54
a*
8°
11°
5°
9°
6°
9°
13°
10°
7°
4125.2°
26.0°
29.9°
27.5°
29.1°
24.1°
27.5°
22.0°
21.5°
F
3.3
2.5
6.6
3.4
5.3
2.8
2.3
2.3
3.3
^Approximate slope angle
41

absence presents the one serious drawback of applying this type of
analysis to these sediments: a state of normal consolidation (no excess
pore pressures) must be assumed. In particular, if a state of
underconsolidation exists, excess pore pressure is implied and the
calculated F values would be too high. Consolidation state can also be
used an an independent means for evaluating mass movement potential
because it can reflect the presence of abnormal strength or weakness in
a sediment column. All other properties being equal, overconsolidation
denotes a relatively high strength-stability under most circumstances,
normal consolidation denotes standard strength-stability at typical
slope angles and in the absence of outside forces, and
underconsolidation denotes relative weakness and highest probability of
sediment failure. Establishing a criterion for normal consolidation in
the context of this study is the key step, because normal consolidation
is the barometer for interpreting the other states.
By using the ratio of strength to overburden (S /Q' ), a state of
normal consolidation may be recognized. Skempton (1954) has shown that
for normally consolidated sediment the S /<j' value is related to the
plasticity index in the following manner:
su/a'v = 0.11 + 0.00371
If we use the plasticity indices from this study an average value of
0.20 is predicted. The range is generally between 0.17 and 0.24. Thus,
values within this range indicate normal consolidation, ratios below the
minimum value indicate underconsolidation, and ratios above indicate
overconsolidation. Because the estimate of the S /a' range for normal
consolidation is only approximate because of the effects of disturbance
on the strength measurements (S values), this criterion is restricted
to qualitative assessment. In fact, this uncertainty about data
42

accuracy prevents us from using the S /a" ratio in an undrained
stability analysis, which will be presented when the question of
accuracy will have been more thoroughly addressed.
The vane shear data (S ) and computed overburden pressures (which
were determined by summing buoyant bulk density values) were combined to
get the S /a" values for the cores. Results of the comparisons are
shown in table IV. The S /o" value for each core represents an average
for the bottom meter or so. This comparison reduces the effects of the
inconsistencies in lithology or undetected disturbance. Finally, the
qualitative statements concerning consolidation state are intentionally
conservative. That is, the core value had to be significantly below or
above the stated range for normally consolidated sediment before a core
was judged to be under or overconsolidated. Significance was
arbitrarily defined as more than a 25% departure from the values of the
end members of the range; thus, a value of 0.13 or less signified
underconsolidation and a value of 0.30 or more signified
overconsolidation. the analysis (table IV) indicates that the expected
variability of consolidation states is present. Of particular interest,
however, is that five cores may be underconsolidated. These are PC-40,
PC-43, PC-45, PC-46, and PC-53. The sites of these cores may be more
vulnerable to failure than the other sites at least in the upper few
meters.
Skempton (1970) has shown that the relationship of liquidity index
to overburden pressure may also be used to judge consolidation state.
At the overburden pressure presumed for these cores, a liquidity index
greater than 1.0 would indicate possible underconsolidation. This
criterion was met by each of the 5 cores previously labeled as being
underconsolidated. Accordingly, the factor of safety for these cores
43

shown in table III would be smaller than the given value.
In summary, the slope stability and consolidation analyses suggest
that the surficial sediments in the study area are essentially stable,
although some sites may be marginally so.
Evaluating the potential for a major mass movement event (i.e.,
several tens of meters thick or more) is not possible because of the
limited penetration of the piston cores. If rates of deposition were
high at certain times in the past thick sections of underconsolidated
sediment could still exist. Because of the associated excess pore
pressures, marginally stable sediments may be present in some areas.
The fact that geophysical evidence indicates the absence of past large
mass movement events (Robb and others, 1981) may imply that the
sediments, even during the periods of rapid deposition, never reached a
critical value of F. This does not necessarily bear on the central
question of present-day stability, but, with assumed low rates of
deposition for the past several thousand years, it does suggest that
mass movement did not occur during the time that the slope would have
been the most vulnerable to failure. Further, given lower rates of
deposition and time, the excess pore pressures would tend to dissipate
and the sediments would become increasingly more stable. Until more
evidence becomes available, as from a deep-drilling program, the exact
condition of the sediment must remain unknown, however.
CONCLUSIONS
The following conclusions are based on analyses completed to date:
1. Erratic strength profiles and variability of index properties
implies that the Baltimore Canyon Continental Slope is a complex
depositional environment. The sediments are essentially inorganic
44

sands, silts, and clays, and range from low to high plasticity. No
exotic minerals or abnormal textures were indicated by the
geotechnical data.
2. Based on slope stability analyses without pore pressure data, the
surficial sediments represented by the cores are stable. However,
index property data and assessments of consolidation state suggest
that excess pore pressures may exist in some areas, and thus these
areas may be only marginally stable. This conclusion applies to
the sites of PC-40, PC-43, PC-45, PC-46, and PC-53.
3. All possible consolidation states are represented by the cores, as
judged from the strength and plasticity data.
REFERENCES
American Society for Testing and Materials, 1977, 1977 Annual Book of
ASTM Standards, Part 19, Natural Building Stones; Soil and
Rock; Peats, Mosses, and Humis: Philadelphia, 494 p.
Bennett, R. H., Lambert, D. N., and Hulbert, M. H., 1977,
Geotechnical properties of a submarine slide area on the U.S.
Continental Slope northeast of Wilmington Canyon: Marine
Geotechnology, v. 2, p. 245-261.
Bishop, A. W., and Henkel, D. J., 1957, The Measurement of Soil
Properties in the Triaxial Test: Edward Arnold, London, 225 p.
Booth, J. S., 1979, Recent history of mass-wasting on the upper
Continental Slope, northern Gulf of Mexico, as interpreted from
the consolidation states of sediment, in Pilkey, 0. H., and
Doyle, L. J., eds., Geology of the Continental Slopes, SEPM
Special Publication No. 27, p. 153-164.
Casagrande, A., 1948, Classification and identification of soils:
45

Transactions, Am. Soc. Civil Engineers, v. 113, p. 901-991.
Doyle, L. J., Pilkey, 0. H., and Woo, C. C., 1979, Sedimentation on
the eastern United States Continental Slope; In Doyle, L. J.,
and Pilkey, 0. H., eds., Geology of the Continental Slopes:
SEPM Special Publication No. 27, p. 119-129.
Embley, R. W., and Jacobi, R., 1977, Distribution and morphology of
large submarine sediment slides and slumps on Atlantic
Continental margins: Marine Geotechnology, v. 2, p. 205-228.
Emery, K. 0., and Uchupi, E., 1972, Western North Atlantic Ocean:
topography, rocks, structure, water, life, and sediments: Am.
Assoc. Petroleum Geologists Memoir 17, 532 p.
Keller, G. H., Lambert, D. N., and Bennett, R. H., 1979, Geotechnical
properties of Continental Slope deposits - Cape Hatteras to
Hydrographer Canyon, in Doyle, L. J., and Pilkey, 0. H., eds.,
Geology of the Continental Slopes: SEPM Special Publication
No. 27, p. 131-151.
McGregor, B. A., 1977, Geophysical assessment of submarine slide
northeast of Wilmington Canyon: Marine Geotechnology, v. 2,
p. 229-244.
McGregor, B. A., Bennett, R. H., and Lambert, D. N., 1979, Bottom
processes, morphology, and geotechnical properties of the
Continental Slope south of Baltimore Canyon: Applied Ocean
Research, v. 1, p. 177-187.
Robb, J. M., Hampson, J. C., Kirby, J. R., and Twichell, D. C., 1981,
Geology and potential hazards of the Continental Slope between
Lindenkohl and South Toms Canyons, offshore Mid-Atlantic United
States, U.S. Geological Survey Open-File Report, in press.
Rosenquist, I. Th., 1953, Considerations on the sensitivity of
46

Norwegian quick clays: Geotechnique, v. 3, p. 195-200.
Sangrey, D. A., Booth, J. S., and Hathaway, J. C., 1979, The Atlantic
Margin coring project (AMCOR) of the USGS: geotechnical
observations: Proceedings, Fifth International Conference on
Port and Ocean Engineering under Arctic conditions, Trondheim,
p. 951-961.
Skempton, A. W., 1954, Discussion of the structure of inorganic soil:
Jour. Soil Mechanics and Foundation Division, Proc. ASCE,
v. 80, Kept. No. 478, p. 19-22.
Skempton, A. W., 1970, The consolidation of clays by gravitation
compaction: Geol. Soc., London Quart. Jour., v. 125,
p. 373-411.
Twichell, D., Knebel, H., and Folger, D.W., 1977, Delaware River:
evidence for its former extension to Wilmington Submarine
Canyon: Science, v. 195, p. 483-485.
47

APPENDIX I Geotechnical Properties
PC-13 (5.32 m)
PC-39 (5.72 m)
Shear Strength Data
Core no. (length)
PC-8(5.85 m)
Penetration (m)
0.250.501.001.501.752.002.152.502.753.504.004.25
Shear strength . (natural)
(kpa)
ND0.82.7ND6.27.78.6
13.613.215.017.111.9
Shear strength (remolded)
(kPa)
NDND0.6ND1.31.10.63.12.41.92.32.0
Sensitivity
__4.8_6.26.8
13.84.35.57.77.65.9
5.005.50
0.320.50
0050005000505000
5.25
0.250.50,00500050700050
3.90
14.1 D
5.5 6.8 6.3 6.3 7.5 8.4 6.6 6.8
10.5 8.3 D
1.4 1.9 3.9 4.1 2.5 4.1 4.1 5.7 6.5
11.8
3.5 2.4
1.1 0.81.20.60.61.321.71.11.41.5 1.8
ND0.7ND0.8NDNDND1.01.21.7
3.8
4.98.35.0
10.112.06.43.96.07.65.5
2.8
5.5
5.7 5.2 7.0
ND: no data - sample too weak for accurate strength measurement D: Disturbed sample
48

APPENDIX I Geotechnical Properties
Shear Strength Data
Core no. (length)
PC-40(7.08 m)
PC-41(4.54 m)
PC-43(9.42 m)
Penetration (m)
.10
.501.001.502.002.473.003.503.964.505.006.006.32
0.150.501.001.852.352.853.203.503.90
0.501.001.502.002.503.003.253.504.004.504.705.005.506.006.507.007.408.008.50
Shear strength (natural)
(kPa)
NDNDND2.82'.0
3.43.12.33.64.84.84.66.0
1.25.43.66.83.45.16.38.05.3
2.82.62.93.34.03.86.32.14.96.44.64.49.83.54.15.56.66.37.8
Shear strength (remolded)
(kPa)
NDNDNDNDNDNDNDNDND0.6ND0.80.6
ND1.00.51.11.11.21.50.8ND
NDNDNDND0.70.70.8NDND1.40.9NDNDNDND0.60.80.80.8
Sensitivity
- _ _ 7.6_6.29.6
5.47.26.03.04.34.2
10.7-
___5.75.58.3_-*4.65.3 _ 9.88.28.39.6
ND: No data - sample too weak for accurate strength measurement D; Disturbed sample
49

APPENDIX I Geotechnical Properties
Shear Strength Data
Core no. (length)
PC-44(4.50 m)
Penetration (m)
0.160.501.001.532.002.473.503.85
Shear strength (natural)
(kPa)
6.65.96.88,3
10.39.07.24.8
Shear strength (remolded)
(kPa)/-
1.01.21.41.21.40.91.30.9
Sensitivity
6.64.74.96.67.5
10.35.75.1
PC-45(6.97 m) 0.41 1.8 ND
1.00 ND1.50 2.1 ND2.00 2.1 ND2.50 3.4 ND3.00 4.8 ND3.50 12.8 2.5 5.14.00 4.6 ND4.50 6.5 0.9 7.04.90 3.1 1.1 2.85.60 4.1 1.2 3.26.00 3.8 1.8 2.16.35 3.0 1.4 2.2
PC-46(7.05 m) 0.50 1.1
1.00 2.0 ND1.50 1.2 ND2.00 2.1 ND2.50 3.4 ND3.00 6.6 ND3.50 3.9 ND4.00 4.3 ND4.50 5.2 ND5.00 4.2 ND5.50 5.9 ND5.70 5.0 0.8 6.76.00 5.3 0.8 7.06.45 5.6 ND
PC-51(0.17 m) 0.05 15.5 - y
0.12 46.7
ND: No data - sample too weak for accurate strength measurement D: Disturbed sample
50
APPENDIX I Geotechnical Properties
Shear Strength Data
Core no. (length)
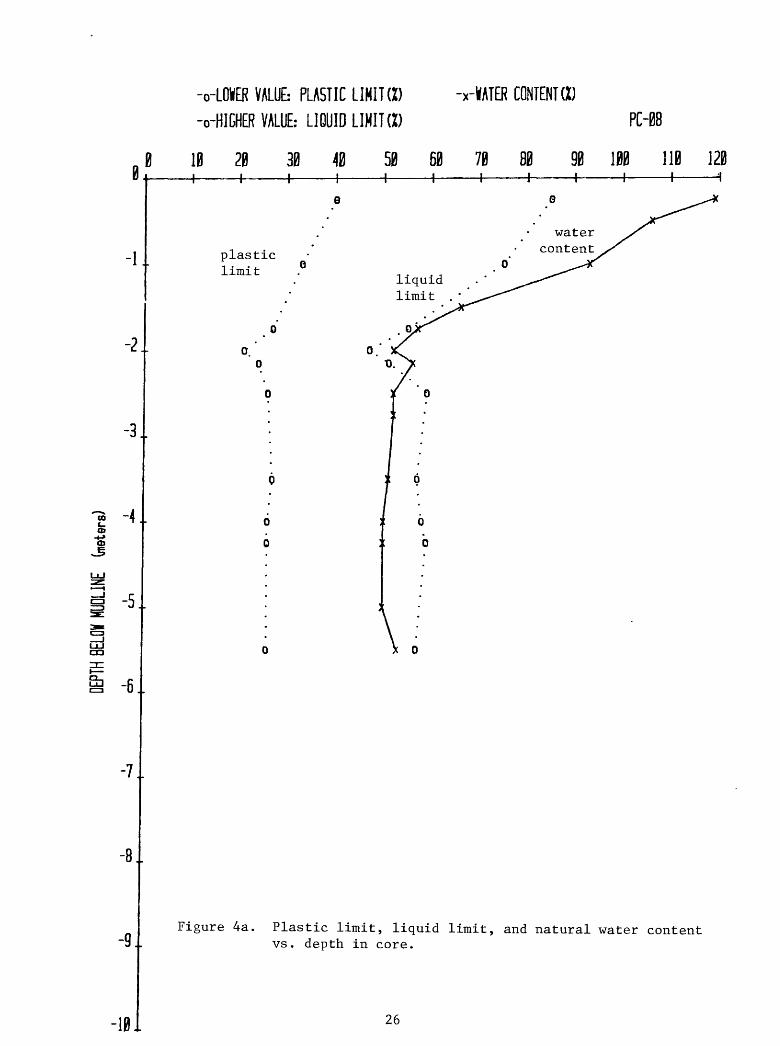
PC-52(6.73 m)
Penetration Cm)
0.501.00 1.502.002.503.004.004.505.005.506.00
Shear strength (natural)
(kPa)
3.13.3 4.64,84.37.36.15.46.85.63.8
Shear strength (remolded)
(kPa)
NDND / ND V/ND0.62.10.81.91.60.91.2
Sensitivity
-
_6.93.48.22.94.36.43.0
PC-53(10.06 m) 0.50 5.4 0.9 5.7
1.10 1.7 ND ^/. 1.50 1.9 0.6 3.02.00 1.9 ND2.58 2.6 0.9 3.03.00 2.1 0.6 3.43.50 3.9 0.9 4.43.91 1.9 0.8 2.54.50 5.3 0.9 5.65.00 4.9 ND5.60 5.7 ND -6.00 5.5 0.9 5.96.50 5.8 ND7.00 5.6 ND7.50 6.6 0.9 7.18.00 5.0 0.9 5.79.00 D 1.19.40 D 1.1
PC-54 /(8.58 m) 0.20 1.9 1.9*7 1.00
0.55 2.7 0.6 4.301.15 1.5 ND1.50 1.3 ND2.00 0.9 ND2.43 3.4 ND3.00 3.1 ND3.50 3.8 ND3.90 3.6 ND4.50 3.5 ND5.00 4.8 ND5.50 5.8 ND6.00 6.8 ND6.50 9.5 ND7.00 7.7 0.8 10.37.50 8.6 1.1 8.0
ND: No data - sample too weak for accurate strength measurement D: Disturbed sample

APPENDIX II Geotechnical Properties
Index Properties
Core no. (length)
PC-8(5.85 m)
Penetration (m)
0.250.501.001.501.752.002.152.502.753.504.004.255.005.50
Water content
(%)
119106936657525652525150505053
Bulk density (g/cc)
1.441.481.521.661.721.751.721.751.751.761.771.771.771.75
Porosity (%)
7674716461596159595858585859
Liquid limit
85-75 55475159-575859-57
Plastic limit
40-33 27212426-272626 26
Plasticity index
45-42 28262733-303233-31
Liquidity index
1.76-1.43 1.071.191.190.79-0.800.750.73-0.87
PC-13 (5.32 m) 0.32
0.501.001.502.002.503.003.504.505.005.25
6336454162586152596065
1.671.911.811.861.681.711.691.75-1.701.69-1.66
6350555363616259626264
-27393959515553576260
-15191925242422262425
-12202034273131313835
-1.751.301.101.091.261.190.971.060.951.14
PC-39(5.72 m) 0.25 62 1.68 63
0.50 57 1.72 61 51 24 27 1.241.00 58 1.71 61 55 23 32 1.091.50 60 1.70 62 53 26 27 1.262.00 60 1.70 622.50 57 1.72 61 52 26 26 1.192.70 57 1.72 61 46 23 23 1.223.00 43 1.85 54 45 21 24 0.923.50 50 1.77 583.90 43 1.85 54 43 19 24 1.004.79 47 1.81 56 44 23 21 1.14
52

Index Properties
APPENDIX II Geotechnical Properties
Core no.
(length) Penetration c^nt den'sity Porosity ^
m (g/cc)limit
PC-40 (7.08 m)
PC-41
Plasticity Liquidity index index
0.10 0.50 1.00 1.50 2.00 2.47 3.00 3.50 3.96 4.50 5.00 6.00 6.32 6.56
78 77 77 60 65 68 51 54 54 54 50 56 47 48
1.59 1.60 1.60 1.70 1.67 1.65 1.76- 1.74 1.74 1.74 1.78- 1.73 1.80 1.79
68 68 68 62 64 65 58 60 60 60 58 60 56 57
57 54 52 43
46 33 36 37 40 36 45 34 39
27 25 23 22
22 17 18 20 20 18 21 21 19
31 29 29 21
24 16 18 17 20 18 24 13 20
1.68 1.79 1.86 1.81
1.88 2.12 2.00 2.00 1.70 1.75 1.46 2.00 1.45
(4.54 m) 0.15 0.501.001.85 2.352.85 3.20 3.50 3.904.22
PC-43(9.42 m) 0.50
1.00 1.50 2.00 2.503.00 3.253.504.00 4.50 4.70 5.00 5.50 6.00 6.50 7.00 7.40 8.008 C A,_>0
9.07
108 797834 2940 37 37 2627
6252 52 50 5567 726181 73 66 76 67 66 30 36 28 273229
1.48 1.591.591.95 2.021.87 1.91 1.91 2.062.04
1.691.76 1.76 1.78 1.741.65 1.621.691.58 1.62 1.66 1.60 1.65 1.66 2.00 1.92 2.03 2.051.972.01,
75 686848 4452 50 50 4142
6359 59 58 6065 666269 66 64 67 65 64 45 49 43 424744
-
26
37 37 34 2227
39 41 42
56
61 57 52 60 62 52 23 31 23 21
27
-
15
19 17 17
16
19 20 22
25~
35 26 24 25 26 22 15 17 15
l s
-
11
18 20 17
11
20 21 20
31
26 31 28 35 36 30 8
14 8
1 O
_
1.73
1.17 1.00 1.18
1.00
1.65 1.52 1.40
1.35-
1.77 1.52 1.50 1.45 1.14 1.47 1.88 1.36 1.62~
T 1 ^1.17
53

APPENDIX II Geotechnical Properties
Index Properties
Core no. Water Bulk Liquid Plastic Plasticity Liquidity(length) Penetration content density Porosity limit limit index index
(m) (%) (g/cc) (%)
PC-44 (4.50 m) 0.16
0.501.001.532.002.473.503.854.28
PC-45(6.97 m) 0.41
1.001.502.002.503.003.504.004.504.905.606.006.356.60
PC-46(7.05 m) 0.00
0.501.001.502.002.503.003.504.004.505.005.505.706.006.456.71
434338504446444645
79-626253425074788272676455
87708180745862636746435044474548
1.841.841.901.781.831.811.831.811.82
1.59-1.691.691.751.851.781.611.591.571.621.651.671.73
1.551.641.581.581.611.711.681.681.651.811.841.781.831.801.821.79
545450585456555655
68-636359535867686966656460
70656969676163636556545855565557
-3544-42414641
60--4440403967918064-6658
61505953-4450535840384035383840
-1821_21192121
30--2221202227312927272527
30232525-2122242521192018191820
-1723-21222520
30--2219201740605137-4131
31273428-2328293319192017192020
-1.181.26-1.101.141.001.20
1.60--1.821.681.101.651.18.78
1.041.22-0.940.90
1.841.741.651.97-1.611.431.341.271.321.261.501.531.471.351.40
54

Index Properties
APPENDIX II Geotechnical Properties
Core no. Water Bulk Liquid Plastic Plasticity Liquidity(length) Penetration content density Porosity limit limit index index
(m) (%) (g/cc) (%)
PC-52 0.50(6.73 m) 1.00
1.502.002.503.004.004.505.005.506.006.37
PC-53(10.06 m) 0.50
1.101.502.002.583.003.503.914.505.005.606.006.507.007.508.009.009.409.66
PC-54(8.58 m) 0.20
0.551.151.502.002.433.003.503.904.505.005.506.006.507.007.508.28
5148474756545152505353
65-8489695869534951535154555251485150
8976868970766865676655586464677059
1.771.791.801.801.731.741.771.761.781.751.75
1.67-1.571.541.641.711.641.751.781.771.751.771.741.741.761.771.791.771.78
1.541.601.561.541.641.601.651.671.651.661.741.711.671.671.651.641.70
5857565660605859585957
64-6971656165595758595860605958575858
7167707165676564656460616464656562
383938395353-55524540
56-5658524247373837443941433840414344
6162575452594445504745445558595862
171718182424-22222220
27 2326242020202020212321232021202220
2627252524272322242421232731212730
212220212929 33302420
29-3332292227171817231620201819212124
3535322928322123262324212827383132
1.621.411.451.391.101.03-0.910.931.361.40
1.31-1.851.971.741.731.811.941.781.821.521.771.651.601.781.581.331.381.25
1.801.401.912.201.641.532.141.871.651.831.441.671.321.221.211.390.91

APPENDIX III Geotechnical Properties
TRIAXIAL TEST RESULTS
GENERAL TEST INFORMATION
SAMPLE INFORMATIONSAMPLE ID*
INTERVAL Cmeters):GENERAL LOCATIONr
DESCRIPTION:DATE FINISHED!
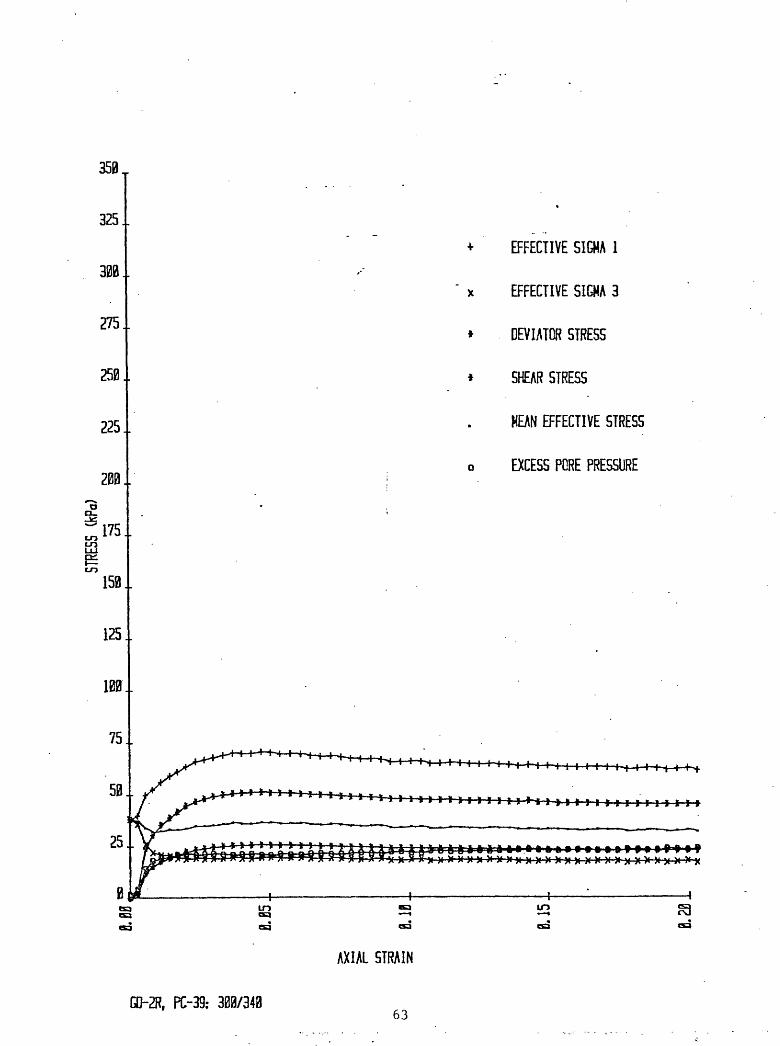
GD-2R, PC-39j 300/3404.61-4.73BALTIMORE-HUDSON CANYON AREAOLIVE-GRAY CLAY1/15/80
INDEX PROPERTIESMOISTURE CONTENT: 0.42
BULK DENSITY Cs/cc)r 1.83VOID RATIO: 1.12
POROSITY: 0.53GRAIN SPEC GRAVITY Cg/cc): 2.73
SAMPLE PARAMETERSHEIGHT Cmm): 100.00
DIAMETER Cmm): 50.00AREA Csq. mm): 1963.50VOLUME Ccc): 196.35WEIGHT C gm) s 351.40
TEST RESULTS
^SATURATION PHASE*
READING CELL PRESSURE DELTA C PORE PRESSURE DELTA PkPa50.00100.00150.00200.00340.00
kPa
50.0050.0050.00140.00
kPa47.8296.40145.87195.27335 . 94
kPa
48.5849.4749.40140.67
0.970.990.991.00
xCONSOLIDflTION PHASE*
CELL PRESSURE CkPa): 340.00BACK PRESSURE CkPa): 300.00
CONSOLIDATION PRESSURE CkPa): 40.00ASSUMED EFFECTIVE
OVERBURDEN PRESSURE CkPa): 36.83
56

CHANGES IN PROPERTIES DUE TO CONSOLIDATION
PROPERTYHEIGHT
AREA CsqVOLUME
HATER COPOR
VOIDBULK DENSITY Cg/cc):
BDUYANT BULK DENSITY Cg/cc): X SAT
MEASURED PROPERTIES
READING
123456789
10111213141516171819202122232425262728293031323334
TIME
04
10203873
1392695271041206841187120101221312416126191282213125133281353113734139371414014343145461434915052152551545815661158641606716270165
INITIAL VALUECtnm)nun)Ccc3TENTfSITYAT 10/cc)/cc)TION
Log
-
3
:
i
:
:
:
TIME
4.0.1.1.1.1.2.2.2.3.3.3.3.4.4.4.4.4.4.4.4.4.4.4.4.4.4.4.4.4.4.4.4.4.
00600030588614437202326185011221283540454953576063666972747679318385
100.001963.50196.35
0.420.531.121.830.80
100.00
CONSOLIDATED VALUE
Sqrt TIME
0.2.3.4.6.8.
11.16.22.32.45.64.84.
ICO.1 14 .126.138.148.158.167.176.184.192.200.207.214.221.228.234.241.247.253.259.264.
00001647165479409626481738615699307653734677723671827037851630301689
981903187
00010
100
.46
.58
.43
.38
.33
.65
.87
.84
.00
DVOL
000001123567888888.8833
. 88888
- 8888888
Ccc).00.12.25.42.66.02.56.38.58.15.74.80.21.36.44.49.53.57.59.62.63.65.67.63.69.70.71.72.73.74.75.75.75-.76
57

35363738394041.424344454647484950515253545556 .575359
731677616973171821738517588177911809418297184100186103188106190109192112194115197118199121201124203127205130207133209136211139214142216145218
4.864.884.904.914.934.954.964.974.995.00
''5.01
5.035.045.055.065.075.085.095.105.115.125.135.145.155.16
270.49275.99281.37286.66291.85296.95301.96306.89311.74316.52321.23325.87330.44334 . 95339.41343.80348.14352.42356.66360.34364 . 98369.07373.11377.12381.07
8.778.788.798.808.818.818.838.838.348.858.858.86 8.368.878.878.888.888.898.898.908.908.908.918.928.92
ALPHA: 0.98Ao Csq. mm): 1903.59
Lo (mm): 98.46
(P - c<
«SHEAR PHASE*
CELL PRESSURE CkPa): 340.00 STRAIN RATE: .015 mm/min .
MEASURED PROPERTIES
READING
12345678
DVOLCccD0.000.01
-0.020.010.01
-0.00O.C10.02
PORPCkPa)
301.76304.14314.11313.05319.36319.78320.76321.18
DLNG(mm}0.000.270.550.801.091.411.681.98
AXFO(N)
0.007.63
45.7358.5267.8674.8030.8086.50
CELPCJcPa)
340.00340.00340.00340.00340.00340.00340.00340.00
TIME(sec)
01322264539675289661179339255
-5S

91011121314151617181920212223242526272329303132333435363738334041424344454647484950515253545556575859
0.010.010.020.010.010.020.020.020.010.030.030.010.020.030.020.020.030.030.030.020.040.050.040.030.050.050.050.040.050.060.050.050.050.070.060.060.05O.OS0.060.080.070.070.060.060.080.080.070.070.090.090.08
320.73321.15321.21320.92320.53321.02321.12-320.59320,50321.05320.73320.63321.18321.34320.92321.08321.51321.60321.28321.28322.03322. OG321.57321.51.322.35322.26321.90321.90322.16322.29321.96322.19322.16322.65322.71322.62322.42322.42322.75322.88322.62322.45322.48322.52323.17322.88322.58322.71323.33322.94322.62
2.322.642.953.233.643.954.294.644.975.305.676.036.376.727.087.447.788.138.508.859.139.549.3010.2510.5810.9311.2911.6411.9812.3312.6813.0313.3813.7114.0714.4114.7615.1115.4515.7916.1516.5016.8517.1917.5217.8918.2318.5813.9219.2819.63
90.8493.7196.1198.1399.56100.41101.33101.89101.691C1.62101.77101.62101.38101.58101.31100.92.100.69100.69100.69100.22 99.35100.38100.45100.. 34100. 28100.76100.88100.69100.61101.07101.27101.19101.03101.27102.97102.00102.08101.73102.16102.78103.09103.13103.24103.28103.67104.10104.60104.68105.10105.69105.88
340.00340.00340.00340.00340.00340.00340.00340.00340.00340. QC340.00340.00340.00340.00340.00340.00340.00340.00340.00340.00340.00340. CO340.00340. CO340.00340.0034C.OO340.00340.00340.00340.00340.00340.00340.00340.00340.00340.00340.00340.00340.00340.00340.00340.00340.00340.00340.00340.00340.00340.00340.00340.00
10577118991322214544158661718818510198322115422476237992512126443
. 277652908730410317323305434376356983702038342396654098742309436314495346275475974892050242515645,2886542085553056852581745949760819621416346364735661076742968752700747139672718740407536276684
59

60 0.09 323.46 19.97 106.03 340.00 73007
DERIVED PROPERTIES
READING STRAINA SIG1CkPa)
. 1234567-89
10111213141516171819202122232425262728293031323334353S37333940414243
0.0.0.0.0.0.0.0.0.0.0.0.0.0.0.0.0.c.0.0.0.0.0.0.0.0.0.0.0.0.0.0.0.0.0.0.0.0.0.0.0.0.0.
0000002700560082011101430171020102360268030003340369040104350472050505390576061206470682072007560790032608630899093309691005104110751110114611821216125212881324135913921429
340.344.363.370.375.378.381.334.386.387.388.389.390.390.390.391.390.390.390.390.389.389.389.389.388.388.388.387.387.387.387-.387.387.387.386.386.386.386.386.386.385.385.386.
00008949257372535991988337639400735138118272390171523392616247220106926442453512867936
SIG3
TOTAL EFFECTIVE STRESS STRESS RATIO EFFSIG1 EFFSIG3 RATIO
CkPaD340.340.'340.340.340.340.340.340.340.340.340,340.340.340.340.340.340..340.340.340.340.340.340.340.340.340.340.340.340.340.340.340.340.340.340.340..340.340.340.340.340.340.340.
00000000000000000000000000000000CO000000000000000000000000CO0000CO00000000000000000000
1.1.1.1.1.1.1.1.1.
- 1.1.1.1.1.1.1.1.1.1.1.1,1.1.1.1.1.1.1.1.1.1.1.1.1.1.1.1.1.1.1.1.1.1.
00010709101112131414141515151515151515151515151414141414141414141414141414141414131314
CkPa)38.2139.8649.7852.4455.9058.9560.9763.3465.8766.7667.7668.9169.8469.6169.8270.4170.2369.4669.6669.4968.6368.3768.4767.9267.2066.9267.0566.6465.5865.5665.8965.7264.6564.8065.0264.7464.2764.1664. 3S63.9363.7063.1563.65
aPa)38.2135.8625.8921.9520.6420.2219.2418.8219.2818.8518.7919.0819.4718.9818.8819.4119.5018.9519.2819.3718.8218.6619.0818.9218.4918.4018.7218.72.17.9717.94 .18.4318.4917.6517.7418.1018.1017.8417.7118.0417.8117.8417.3517.29
1.001.111.922.392.712.923.173.373.423.543.613.613.593.673.703.633.603.673.61-3.593.653.673.593.593.633.643.583.563.653.653.583.553.663.653.593.583.603.623.573.593.573.643.68
60

4445464748495051525354555657585960
0.14640.14990 . 15350.1569.0.16040.16400.16750.17110.17460.17800.18170.18520.18870.19220.19580.13940.2028
385.74385.59385.24385 . 25385 . 33385.27385.10384 . 96384 . 78384.77334 . 75384 . 77384.61384.60384.65384 . 53384.41
340.00340.00340.00340.00340.00340.00340.00340.00340.00340.00340.00340.00340.00340.00340.00340.00340.00
1.131.131.13
. 1.131.131.131.131.131.131.131.131.131.131.131.131.131.13
63.1263.1762.8262.5062.4662.6662.65 .62.4762.2661.6061.8762.1961 ..9061.2761.7161.9260.94
17.39 317.58 317.58 317.26 317.13 ~317.39 317.55 317.52 317.48 316.83 317.13 317.42 317.29 316.67 317.06 317.39 316.54 3
.63
.59
.57
.62
.65
.60
.57
.57
.56
.66
.61
.57
.58
.68
.62
.56
.69
DERIVED PROPERTIES Ccont.}
READING
123456789
10
1112131415
16171819202122232425262728
A
0.590.590.500.600.270.120.330.15
-0.220.320.06
-0.35-0.721.860.32
-8.970.36
-2.512.690.36
-1.86-1.691 . 28
-0.43-1.43-0.521.670. 00
qCkPa)0.002.0011.9415.2517.6319.3720.8622.2623.3023.9524.49
. 24.9125.1825.3225.4725.5025.3625.2525.1925.0624.9124.8624.6924.5024.3624.2624.1623.96
P'
CkPaD38.2137.8637.8337.1938.2739.5940.1041.0842.5742.8143.2843.9944.6644.3044.3544.9144.8744.2044.4744.4343.7343.5243.7743.4242.8542.6642.8942.68
q/p'
0.000.050.320.410.460/490.520.540.550.560.570.570.560.570.570.570.570.570.570.560.570.570.560.560.570.570.560.56
DEVIATORSTRESSCkPa)0.004.00
23.8930.4935 2538.7341.7244.5346.5947.9148.9849.8350.3750.6350.9451.0050.7350.5150.3850.1149.8249.7249.3949.0148.7148.5248.3347.92
MEANEFFECTIVESTRESSCkPa)
38.2137,1933.8532.1132.3933.1333.1533.6834.8134.8235.1135.6936.2635.8635. Q&36.4136.4135.7936.0736.0835.4235.2335.5435.2534.7334.5734.8334.69
61

2930313233343536373839404142434445464748495051525354555657585960
-2.412.083.110.27
-3.97-2.092.610.00
-1.21.. 5.26
3.18-1.020.13
-7.010.110.161.280.00
52.131.504.380.94
-0.22-0.19
-45.0815.41
-11.53-0.80
-81.11-8.612.760.00
23.8023.8123.7323.6123.5023.5323.4623.3223.2123.2223.17 ,23.0622.9322.9023.1822.8722.7922.6222.6222.6722.6422.5522.4822.3922.3822.3722.3922.3122.3022.3222.2722.20
41.7841.7542.1642.1041.1541.2741.5641.4241.0540.9441.2140.8740.774C.2540.4740.2540.3740.2039.8839.7940.0240.1039.9939.3739.2239.5039.8039.5938.9739.3839.6538.74
0.570.570.560.560.570.570.560.560.570,570.560.560.560.570.570.570.56 .560.570.570.570.560.560.560.570.570.560.560.570.570.56.0.57
47.6147.6247.4747.2247.0147.0646.9246.6446.4246.4546.3546.1245.86.^5.73 '46.3645.7445.5945.2445.2545.3345.2745.1044.9644.7844.77 .44.7544.7744.6144.6044.6544.5344.41
33.8433.8134.2534.2333.3233.4333.7433.6533.3233.1333.4933.1833.1332.6232.7432.6332.7832.6632.3432.2432.4832.5832.5032.4131.7532.0432.3432.1631.5431.9432.2331.34
62
350
325.
300.
275.
250.
225.
200o*=
175
150
125
COa
EFFECTIVE SIGMA 1
EFFECTIVE SIGHA 3
DEVIATOR STRESS
SHEAR STRESS
NEAN EFFECTIVE STRESS
EXCESS PORE PRESSURE
AXIAL STRAIN
GD-2R, PC-39; 300/34063

TRI AXIAL TEST RESULTS
GENERAL TEST INFORMATION
SAMPLE INFORMATIONSAMPLE ID:
INTERVAL Cmeters):GENERAL LOCATION:
DESCRIPTION:DATE FINISHED:
GD-2R, PC-39; 300/3804.73-4.85BALTIMORE-HUDSON CANYON AREAOLIVE-GRAY CLAY1/15/80
INDEX PROPERTIESMOISTURE CONTENT: 0.47
BULK DENSITY Cg/cc): 1.78VOID RATIO: 1.25
POROSITY: 0.56GRAIN SPEC GRAVITY Cg/cc): 2.73
LIQUID LIMIT CX): 44.00PLASTIC LIMIT CZ): 23.00
SAMPLE PARAMETERSHEIGHT Cmm): 100.00
DIAMETER Cmm): 50.00AREA Csq. romD:. 1963.50
VOLUME Ccc): 196.35WEIGHT Cgm): 349.60
TEST RESULTS
XSATURATIOU PHASE*
READING CELL PRESSURE DELTA C FORE PRESSURE DELTA PfcPe50.00100.00150.03200.00380.00
kPa
50.0050.00501 00180.00
kPa52.96107.14146.00196.70375 . 69
fcPa
54.1838.8650.70178.99
1.G80.781.010.99
*CONSOLIPATION PHASE*
CELL PRESSURE CkPa): 380.00BACK PRESSURE CfcPaD: 300.00
CONSOLIDATION PRESSURE CkPa): 80.00ASSUMED EFFECTIVE
OVERBURDEN PRESSURE CkPa}: 35.54
64
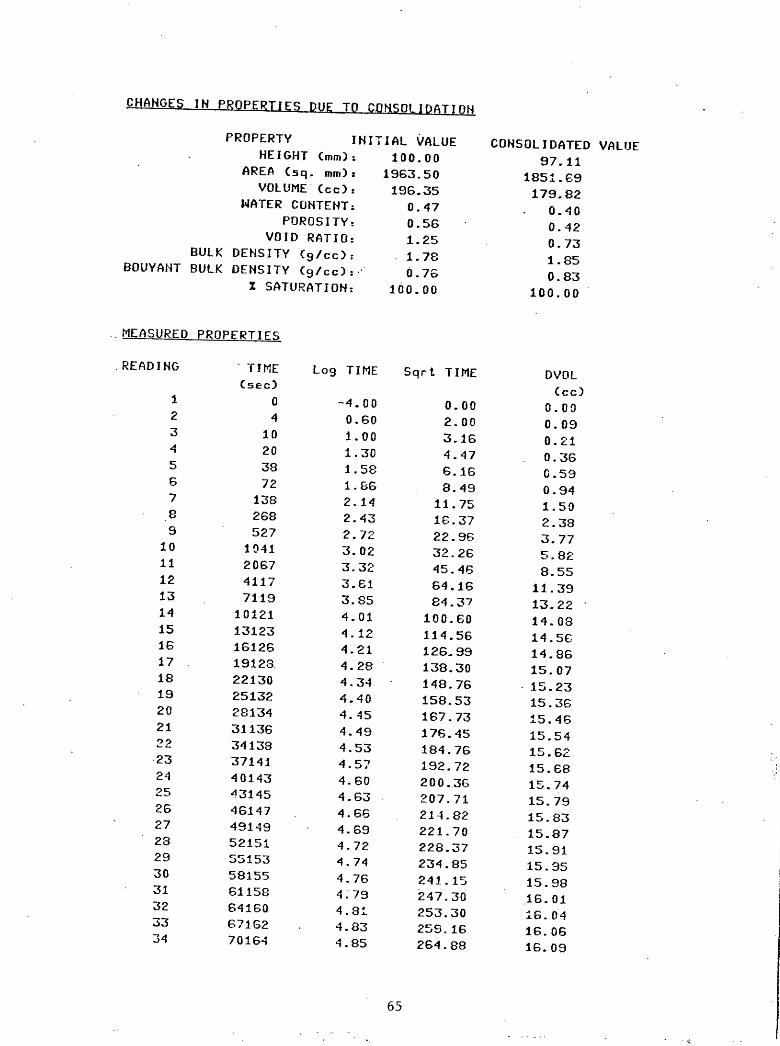
CHANGES IN PROPERTIES DUE TO CONSOLIDATION
PROPERTY INITIAL VALUE
BOUYANT BULK DENSITY Cg/cc)i
MEASURED PROPERTIES
READING
123 A56789
10111213141516171819202122232425262723293031323334
TIMECsec)
04
10 20 38 72
138 268 527
1041 2067 4117 7119
10121 13123 16126 19123 22130 25132 28134 31136 34138 37141 40143 43145 46147 49149 52151 55153 58155 61158 64160 67162 70164
Cmm) :. mm) :Ccc) z
NTENTiOSITY:
RATIO:9/cc) :
3/cc) :
WON:
Log TIME
-4.000.601.001.301.581.862.142.432.723.023.323.613.854.014.124.214.284.344.404.454.494.534.574.604.634.664.694.724.744.764.794.814.834.85
100.001963.50196.35
0.470.561.251.780.76
100.00
Sqrt TIME
0.002.003.164.476.168.49
11.7516.3722.9632.2645.4664.1684.37100.60114.56126.99138.30148.76158.53167.73176.45184.76192.72200.36207.71214.82221.70228.37234.85241.15247.30253.3025S.16264.88
CONSOLIDATED VALUE97.11
1851.69179.82
0.400.420.731.850.83
100.00
DVOLCcc)
0.00 0.09 0.21 0.36 0.59 0.94 1.50 2.38 3.77 5.82 8.55 11.39 13.22 14.03 14.56 14.86 15.07 15.23 15.36 15.46 15.54 15.62 15.68 15.74 15.79 15.83 15.87 15.91 15.95 15.98 16.01 16.04 16.06 16.09

35363738394041424344454647484950515253545556575859
731667G16879170821738517588177911799418197183100185103187106189109191112194115196118198121200124202127204130206133209136211139213142215145217
4.864.884.904.914.934.954.964.974.99
,.5.005.015.035.045.055.065.075.085.095.105.115.125.135.145.155.16
270.49275.99281.37286.66291.85296.95301.96306.89311.74316.52321.23325.37330.44334 . 95339.41343.80348.14352.42356 . 66360 . 84364 . 98369.07373.11377.11381.07
16.1116.1416.1716.2016.2216.2416.2716.2816.3116.3316.3516.3616.3816.3916.4116.4216.4316.4516.4516.4716.4816.4916.5116.5216.53
ALPHA: 0.97Ao Csq. mm): 1851.69
Lo Cmm):- 97.11
*SHEAR PHASE*
CELL PRESSURE CkPa): STRAIN RATE: .015 mm/min
380.00
MEASURED PROPERTIES
READING
12345678
DVOLCcc)0.000.010.000.000.010.000.000.01
PORPCkPa)
301.28306.30321.94330.87336.15339.49341.93344.10
OLHGCmm)0.000.230.60.0.881.191.521.812. 16
AXFOCN)
0.0014.8373.8998.79112.53121.76128.63134.23
CELPCkPa)
380.00380.00
. 380.00380.00380.00380.00380.00380.00
TIME(sec)
11323264«39675289661179339255
66

91011121314151617181920212223242526272829303132333435363738394041424344454647484950515253545556575859
0.00-0.000.000.01
-0.00-0.000.00
-0.00-o;oi0.00
-0.00-0.00-0.000.00
-0.00-0.00-0.010.00
-0.01-0.00-0.000.010.00
-0.00-0.000.000.00
-0.00-0.010.000.00
-0.00-0.01-0.000. 00
-0.00-0.00-0.01-0.010.010.00O.C10.000.000.010.010.010.010.010.020.01
345.27346.51347.59348.42348.77349.47350 . 36350.58350.90351.63351.82352.08352.49352.93353. CO353.12353.51353.89353.92353.86354.30354.65354.62354.55355.03355.19355.19355.06355.35355.70355.54355.67355.54356.14356.14355 . 95355 . 99356.05356.30356.68356.37356.40356.49356.56357. 10357.16357.07357.03357.51357.61357.35
2.522.833.173.533.874.204.544.915.285.605.976.326.667.027.377.738.068.418.779.129.469.8010.1510.5010.8311.1811.5311.8812.2112.5512.9113.2613.6013.9314.2914.6414.9915.3515.6916.0416.4016.7617.1117.4717.8118.1718.5418.8919.2419.6019.96
138.38140.83142.58143.46144.20143.98144.64144.73144.38144.38144.51144.38144.33144.38144.51144.16143.94144.38144.20144.07143.76144.42144.38144.25144.07144.73144.60144.47144.20144.77144.73144.55144.25144.29144.86144.64144.55144.07144.16144.51144.64144.51144.25143.81144.07144.64144.68144.29144.60144.39144.73
380.00380.00380.00380.00380.00380.00380.00380.00380.. 00380.00380.00380.00380.00380.00380.00380.00380.00380.00380.00380.00380 . C 0380.00380.00380.00380.00380.00380.00380 : 00380.00380.00380. CO380.00380.00
. 380.00380. ao380.00380.00380.00380.00380.00380. 00380.00380.00 .380.00380.00380.00380.00380.00380.00380.00380.00
1057311900132221454415866171881851019832211552247723799251212644327765230873040931732
. 330543437635698370203834239664409864230843630449534627547597.48919502415156352885542085553056852581745949660818.6214Q63463
64785661076742968751700737139672713.740407536276684
67

60 0.01 357.67 20.31 144.82 380.00 78006
DERIVED PROPERTIES
READING STRAINA
123456789
10111213141516171819202122232425262728293031323334353637383940414243
0.00000.00300.00620.00910. 01230.01560. 01870.02220.02590.02920.03270.03640.03980.04330.04680.05060.05440.05760.06140.06510 . 06860.07230.07590.07960.08300.08660.09030.09390.09740.10090.10460.10810.11150.11510.11870.12230.12570.12930.13290.13G50.14000.14350.1471
SIG1 CkPa)
380.00387.99419.66432.87440.02444.73448.17450.88452.79453.84454.48454.65454.77454.39454.46454.21453.73453.48453.25452.89452.60452.33452.12451.66451.28451.22450.85450.50450.08450.12449.82449.48449.13449.16448.82448.48448.08448.08447.77447.41446.99446.74446.72
SIG3 . CkPa)
380.00380.00380.00380.00380.00380.00380.00 .380.00380.00380.00380.00380.00380.00380.00380.00380.00380.00380.00380.00380.00380.00330.0038C.OO380.00380.00380.00380.00380.00380.00380.00380.00380.00380.00380.00380.00380.0038C.OO380.00380.00380.00380.00380.00380.00
TOTAL STRESS RATIO
1.001.021.101.141.161.171.181.191.191.191.201.20 .1.201.201.201.201.191.191.191.191.191.191.131.191.191.191.191.191.181.18
. 1.181.181.181.181.181.181.181.181.181.181.181.181.18
EFFECTIVE STRESS
EFFSIG1 -EFFSIG3 RATIO CkPa) CkPa378.7381.6997.72102.00103.87105.24106.23106.78107.52107.33106.89106.24106.01104.92104.10103.63102.83101.85101.43100.82100.1199.4099.1298.5337.7797.3396.9396.6595.7895.4895.2094.92-94-1093.9793.6393.4192.7392.3892.2391.7491.4590.6030.58
78.7373.7058.0649.13.43.8540.5138.0735.9134.7333.4932.4131.5831.2330.5329.6429.4229.1028.3728.1827.9327.5127.0727.0326.8826.5026.1126.0826.1525.7025.3525 . 3825.4524.9724.8124.8124.9424.6524.3024.4624.3324.4623.8623.86
1.001.111.682.082.372.602.792.973.103.203.303.363.393.443.513.523.533.593.603.613.643.673.673.673.693/733.723.703.733.773.753.733.773.793.773.753.763.803.773.773.743.803.80
68

4445464748495051525354555657585960
0.0.0.0.0.0.0.0.0.0.0.0.0.0.0.0.0.
15071544158016151652168917251762179818341871190919451982201920562091
446.34446.01445.51445.28445.15444.92444.58444.17443.70443.53443.50443.22442.76442.62442.49442.09441.85
380.380.
0000
380.00380.380.380.380,380..380.380.380.380.380.380.380.380.380.
0000000000000000000000000000
1.1.1.1.1.1.1.1.1.1.1.1.1.1.1.1.1.
1717171717171717171717171716161616
90.3890.0389.4688.9788.4788.568S.1887.6887.1486.4486.3386.1585.7385.1084 .8984.7484.18
24.24.23.23.23.23.23.23.
0502957032636051
23.4422.22.22.22.22.22.22.22.
3084939749396533
3.763.753.743.753.793.753.743.733.723.773.783.763.733.78"3.793.743.77
DERIVED PROPERTIES Ccoht.)
NG
123456739
101112131415161718192021-22232425262728
A
0.630.630.490.680.740.710.710.800.611.191.674.852.91
-1.8313.32-0.88-0.67-2.86-0.83-0.72-1.41-1.67-0.29-0.£8-1.C1-5.92-0.080.18
qCkPa)0.003.99
19.8326.4330.0132.3634.0835.4436.4036.9237.2437.3337.3937.2037.2337.1036.8736.7436.6238.4536.3036.1736.0635.8335.6435.6135.4235.25
P'
CkPa)78.7377.7077.8975.5673.8672.8872.1571.3471.1370.4169.6568.9168.6267.7366.8766.5265.9765.1164.8064.3763.8163.2363.0662.7062.1361.7261.5061.40
q/p'
0.000.050.250.350.410.440.470.500.510.520.530.540.540.550.560.560.560.560.570.570.570.570.570.570.57.0.580.580.57
DEVIATORSTRESS
CkPa>0.007.99
39.6652.8760.0264.7368.1770.8872.7973.8474.4874.6574.7774.3974.4674.2173.7373.4873.2572.8972.6072.3372.1271.6671.2871.2270.8570.50
MEANEFFECTIVESTRESSCkPa)
78.7376.3771.2866.7563.8662.0960.7959.5358.9958.1057.2456.4756.1655.3354.4654.1653.6852.8652.6052.2251.7151. 1851.0450.7650.2549/8549.7049.65
69

2930313233343536373839404142434445464748495051525354555657585960
-1.067.920.100.19
-1.374.580.000.37
-0.73-56.00
0.52-0.350.30
-2.440.000.50
-0.10-0.13-1.09-3.081.38
-0.09-0.24-0.13T3.31-1.700.340.07
-3.19-0.780.630.00
35.0435.0634.9134.7434.56 .34.5834.4134.2434.0434.0433.89 . 33.70.33.5033.3733.3633.1733.0132.7532.6432.5832.4632.2932.0931.8531.7731.7531.6131.3331.3131.2531.0530.93
60.7460.4160.2960.1859.5359.3959.2259.1858.6958,3458.3558.0457.9657.2357.2257.2257.0256.7156.3355.8956.1055.8955.5955.2954.6754.5954.5454.3553.8053.6453.6953.26
0.580.580.580.580.580.580.580.580.580.580.580.580.580.580.580.580.580.580.580.580.580.580.580.580.580.580.580.580.580.580.580.58
70.0870.1269.8269.4869.1369.1668.8268.4868.0868.0867.7767.4166.9966.7466.7266.3466.0165.5165.2865.1564.9264.5864.1763.7063.5363,5063.2262.7662.6262. .4362.0961. -85
49.0648. 7348.6548.60-
-48.0147 . 8647.7547.7647.3546.9947. C546.8046.7946.1046.1046.1646.0245.7945.4645.0345.2745.1344.9044.6844.0844.0044.0143.8943.3643.2343.3542.95
70

350
325..
300..
275
250
225
200DQ_
toCO
175
150
EFFECTIVE SIGKA 1
EFFECTIVE SIGKA 3
DEVIATOR STRESS
SHEAR STRESS
HEAN EFFECTIVE STRESS
EXCESS PORE PRESSURE
t I » i I i i i i i I i I t i i i
AXIAL STRAIN
GO-2Rr PC-39; 330/380 71

TRI AXIAL TEST RESULTS
GENERAL TEST INFORMATION
SAMPLE INFORMATIONSAMPLE ID: GD-2R, PC-39? 300/460
INTERVAL Cmeters): 4.35-4,93 GENERAL LOCATION: BALTIMORE-HUDSON CANYON AREA
DESCRIPTION: OLIVE-GRAY CLAY DATE FINISHED: 1/15/80
INDEX PROPERTIESMOISTURE CONTENT: 0.46
BULK DENSITY Cg/cc) : 1.79VOID RATIO: 1.23
POROSITY: 0.55GRAIN SPEC GRAVITY Cg/cc): 2.73
SAMPLE PARAMETERSHEIGHT C,i»m3: 100.00
DIAMETER CmnO : 50.00 AREA Csq. mm): 1963.50
VOLUME Ccc3: 196.35WEIGHT Cgro): 348.40
TEST RESULTS
^SATURATION PHASE*
READING CELL PRESSURE DELTA C PORE PRESSURE DELTA PkPa50.00
ICO. CO150.00200.00460.00
kPa
50.0050.0050.00
260.00
kPa44.0091.80142.25192.00^52.70
kPa
47.8050.4549.75
260.70
0.961.011.001.00
^CONSOLIDATION PHASE*
CELL PRESSURE CkPa): 460.00BACK PRESSURE CkPa): 300.00
CONSOLIDATION PRESSURE CkPa): 160.00ASSUMED EFFECTIVE
OVERBURDEN PRESSURE CkPa): 36.94
72

CHANGES IN PROPERTIES DUE TO CONSOLIDATION
PROPERTYHEIGHT
AREA CsqVOLUME
WATER COPOR
VOIDBULK DENSITY 0
BOUYANT BULK DENSITY Cg/cc)s Z SAT
MEASURED PROPERTIES
READING
123456789
10111213141516171819202122232425262728293031323334
TIMECsecD
04
102038731392695271041206741177119
101221312416126191282213025132281343113634139371414014343145461474914952151551545815661158641606716270164
INITIAL VALUECmm) :
. mm) t
Ccc) :
*TENT:
)SITY:
.'ATIO:
j / c c ) ;
j/cc) s
*TION:
Log TIME
-4.000.601.001.301.581.862.142.432.723. 023.323.613.854.014.124.214.284.344.404.454.494.534.574.604.634.664.694.724.744.764.794.814.834.85
100.001963.50196.35
0.460.551.231.790.77
100.00
Sqrt TIME
0.002.003.164.476.168.5411.7916..4022.9632.2645.4664.1684.37100.61114.58126.99138.30148.76158.53167.73176.45184.77192.72200.36207.71214.82221.70228.37234.85241.16247.30253.30259.16264.88
CONSOLIDATED VALUE95.70
1798.42172.12
0.360.380.621.900.87
100.00
DVOLCcc)
0.000.160.360.600.961.522.373.705.748.7312.7117.1420.1621.5422.2622.6922.9823.1523.2923.4023. 4S23.5523.6123.6623.7023.7323.7723.8023.8223.8523.8723.8923.9123.92
73

35363738394041424344454647484950515253545556575859
7316676168791708217385175881779117994181971831001351031871061891091921121941151961181981212001242021272Q4130206133209136211139213142215145217
4.864.884.904.914.934.954.964.974.99,5.005.015.035.045.055.065.075.085. 085.105.115.125.135.145.155.16
270.49275.99281.37286.66291.85296.95301.96306.89311.74316.52321.23325.87330.44334 . 95339.41343.80343.14352.42356.66360.84364 . 98369.07373.11377.11381.07
23.9523.9623.9824.0124.0224.0424.0524.0724.0824.1024.1124.1224.1324.1524.1524.1624.1724.1824.1924.2024.2124.2224.2224.2324.23
ALPHA; 0.96Ao Csq. mm): 1798.42
Lo Cmm): 95.70
*SHEAR PHASEx
CELL PRESSURE CkPa): STRAIN RATE: .015 mm/min
460.00
MEASURED PROPERTIES
READING
12345678
DVOLCcc)0.000.00
-0.00-0.00-0.000.000.00
-o.oo
PORPCkPeD
298.42306.56315.21333 . 36355.92368.89377.67384 . 38
DLNGCirm)0.000.200.450.680.921.211.481.76
AXFOCM)
0.0017.6831.3679.72134.68155.78167.85176.03
CELPCkPa)
460.00460.00460. 00460.00460.00460.00460.00460.00
TIMECsec)
01322264439665289661179339255
74

91011121314151617181920212223242526272829303132333435363738394041424344454647484950515253545556575859
0.000.00
-0.00-0.00-0.00. 0.00-0.000.00
-0. 000.000.000.000,00
-0.00-0.00-0.00-0.000.000.01
. 0.010.000.000.000.000.010. 010.01C.010.000.000.010.000.00
-0.000.000.010.010.010.010.000.010.010.010.000.000.010.010. 01C.010.01C.01
389.08392 . 97396.38398.87401.04402.76404.25405.26406.49407.43408.43409.15409.60410.35410.77411.19411.61411.97412.58412.55412.87413.23413.55413.72413.94414.20414.07414.17414.33414.82414.95414.82415.11415.47415.34415.53415.50415.63415.89 .416.15416.21 .416.18416.34416.37416.70416.80416.80416.83417.25417.51417.35
2.072.382.683.003.343.674.004.354.695.025.385.736.086.436.787.147.437.848.208.558.909.249.609.9510.2910.6410.9911.3411.6812.0212.3612.7013.0513.3813.7214.0714.4114.7515.0815.4215.7716.1116.4616.80 -17.1417.4917.8418.1818.5318.8719.22
182.30186.41190.53193.48195.98 .197.33198.48198.87199.06199.60200.25200.75201.02201.98202.52203.29203.56204.44204.90205.48205.86207.01207.78208.32208.82209.74210.51210.74211.20211.82212.55212.63212.97213.05214.01214.16214.51214.55214.822 15.. 39215.97216.28216.20216.32216.58217.32217.55217.89217.97218.81218.81
460.00460.00460.00460.00460.00460.00460.00460.00460.00460.00460. CO460.00460.00460.00460.00460.00460.00460.00460. CO460.00460.00460.00460.00460.00460.00460. CO460.00460.00460.00460.00460.00460.00460.00460.00460.00460.00460.00460.00460.00460.00460.00460.00460. 00460.00460.00460.00460.00460. 00460.00480.00460.00
105771189913221145431586517187185101983221154224762379825120264422776529087304093173133053343753569737019383413966340985423084363044952462744759648918502405156252884542075552956851581735949560817621396346164783661056742768750700727139472716740387536076682
75
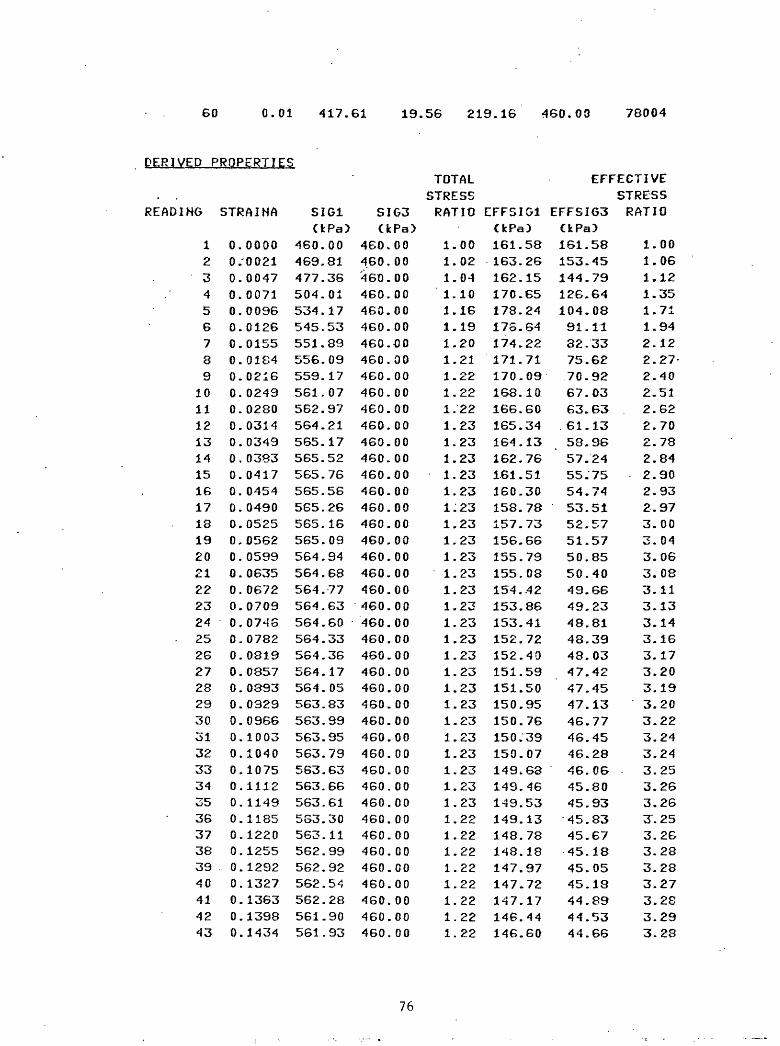
60 0.01 417.61 19.56 219.16 460.00 78004
DERIVED PROPERTIES
READING
123456789
10111213141516171819202122232425262728293031323334353637383940414243
STRAINA
0.00000.-00210.00470.00710.00960.01260.01550.01840.02160.02490.02800.03140.03490. 03830.04170.04540.04900.05250.05620.05990.06350. 06720.07090.07460.07820.08190 . 08570.08930.03290.09660.10030.10400.10750.11120.11490.11850.12200.12550.12920.13270.13630.13980.1434
SIG1CkPa)
460.00469.81477.36504.01534.17545.53551.89556.09559.17561.07562.97564.21565.17565.52565.76565.56565.26565.16565.09564.94564 . 68564.77564.63564.60564 . 33564.36564.17564.05563.83563.99563.95563.79563.63563.66563.61563.30563.11562.99562.92562.54562.28561.90561.93
SIG3CkPa)
460.00460.00460.00460.00460.00460.00460.00460.00460.00460.00460.00460.00460.00460.00460.00460.00460.00460.00460.00460.00460.00460.00460.00460.00460.00460.00460.00460.00460.00460.00460.00460.00460.00460.00460.00460.00460.00460.00460.00460.00460.00460.00460.00
TOTAL STRESS RATIO
1.001.021.041.101.161.191.201.211.221.221.221.231.231.231.231.231.231.231.231.231.231.231.231.231.231.231.231.231.231.231.231.231.231.231.231.221.221.221.221.221.221.221.22
EFFECTIVE STRESS
EFFSIG1 EFFSIG3 RATIOCkPa)161.58163.26162.15170.65178.24176.64174.22171.71170.09168.10.166.60165.34164.13162.76161.51160.30158.78157.73156.66155.79155.08154.. 42153.86153.41152.72152.40151.59151.50150.95150.76150.39150.07149.68149.46149.53149.13148.78148.18147.97147.72147.17146.44146.60
CkPa)161.58153.45144.79126.64104.0891.1182.3375.6270.9267.0363.6361.1358.9657.2455.7554.7453.5152.5751.5750.8550.4049.6649.2348.8148.3948.0347.4247.4547.1346.7746.4546.2846.0645.8045.9345.8345.6745.1845.0545.1344.8944.5344.66
1.001.061.121.351.711.942.122.27-2.402.512.622.702.782.842.902.932.973.003.043.063.083.113.133.143.163.173.203.193.203.223.243.243.253.263.263.253.263.283.283.273.283.293.28
76

4445464748495051525354555657585960
DERIVED
READING
1234567S9
10111213141516171819202122232425
. 262728
0.14700.15060.15410.15760.16110.16480.16840.17200.17560.17910.18280.18640.19000.19360.1972.0.20090.2044
561.58561.32560.91560.62560.47580.30560.01559.54559.16558.86558.75558.42558.14557.74557.68557.23556.95
460.00460.00.460.00460.00460.00 .460.00460.00460.00460.00460.00460.00460. 00.460.00460.00460.00460.00460.00
1.221.221.221.221.221.221.221.221.221.211.211.211.211.211.211.211.21
146.05145.82145.29144.74144.32144.09143.83143.20142.79142.16141.96141.62141.31140.49140.17139.88139.35
44.4744.5044.3744.1143.8543.7943.8243.6643.6343.3043.2043.2043.1742.7542.4942.6542.39
3.283.283.273.283.293.293.283.283.273.283.293.283.273.293.303.283.29
PROPERTIES CcoBt.)
A
0.830.831.150.680.751.141.381.601.522.051.79
- 2.022.264.916.32-4.99-4.21-9.04-14.87-4.70-1.728.30-3.02
-17.02-1.5410.45-3.27C.26
qCkPa)0.004.918.6822.0137.0842.7645.9448.0449.5950.5451.4952.1152.5952.7652.8852.7852.6352.5852.5552.4752.3452.3852.3152.3052.1652.1852.0952.02
P'
CkPa)161.58158.35153.47148.64141.16133.38128.27123.66120.51117.57115.11113.23111.54110.00108.63107.52106.14105.15104.11103.32102.74102.04101.55101.11100.56100.2299.5199.47
q/p'
0.000.030.060.150.260.320.360.390.410.430.450.460.470.480.490.490.500.500.500.510.510.510.520.520.520.520.520.52
DEVIATORSTRESSCkPa)0.009.8117.3644.0174.1785.5391.8996.0999.17101.07102.97104.21105.17105.52105.76105.56105.26105.161C5.09104.94104.68104.77104.63104.60104.33104.36104.17104.05
MEANEFFECTSTRESSCkPa)
161.58156.72150.58141.31128.80119.62112.96107.65103.98100.7297.9595.8794.0292.4191.0089.9388.6087.6386.6035.3385.2984.5884.1183.6883.1782.8282.1482.13
IVE
77

2930313233343536373839404142434445464748495051525354555657585960
-1.492.19
-7.37-1.01-1.427.852.45
-0.32-0.85-4.20-1.710.34
-1.13-0.95-4.36-0.550.13
-0.32-0.89-1.67-0.390.11
-0.35-0.08-1.07-0.920.00
-0.11-1.06-4.310.360.00
51.9152.0051.9751.8951.8151.8351.8051.6551.5551.5051.46 '51.2751.1450.9550.9750.7950.6650.46
.50.3150.2350.1550.0149.7749.5849.4349.3849.2149.0748.8748.8448.6148.48
99.0498.77.98.4298.1897.8797.6397.7397.4897.2296.6896.5196.4596.0395.4995.6395.2695.1694.8394.4294.0993.9493.8393.4393.2192.7392.5892.4192.2491.6291.3391.2790.87
0.520.53
.0 . 530.530.530.530.530.530.530.530.530.530.530.53C.530.530.530.530.530.530.530.530.530.530.530.53
a. 530.530.530.530.530.53
103.83103.99103.95103.791C3.63103.66103.61103.30103.11102.99102.92102.54102.28101.90101.93101.58101.32
"100.91100.62100.47100.30100.0199.5499.1698.8698.7598.4298.1497.7497.6897.2396.95
81.7481.4381.0980.8880.6080.3580.4680.2680.0479.5179.3679.3678.9878.5078.64 78.3378.2778.01.77.6577.3477.2277.1676.8476.6876.2576. 1276.0175.8875.3375.0575.0674.71
78

EFFECTIVE SIGMA 1
EFFECTIVE SIGHA 3
DEVIATOR STRESS
SHEAR STRESS
HEAN EFFECTIVE STRESS
EXCESS PORE PRESSURE
AXIAL STRAIN
GD-2R, PC-39: 300/46B79

1 (kPo)
GD-2R, PC-39; 300/340, 380, 450
80
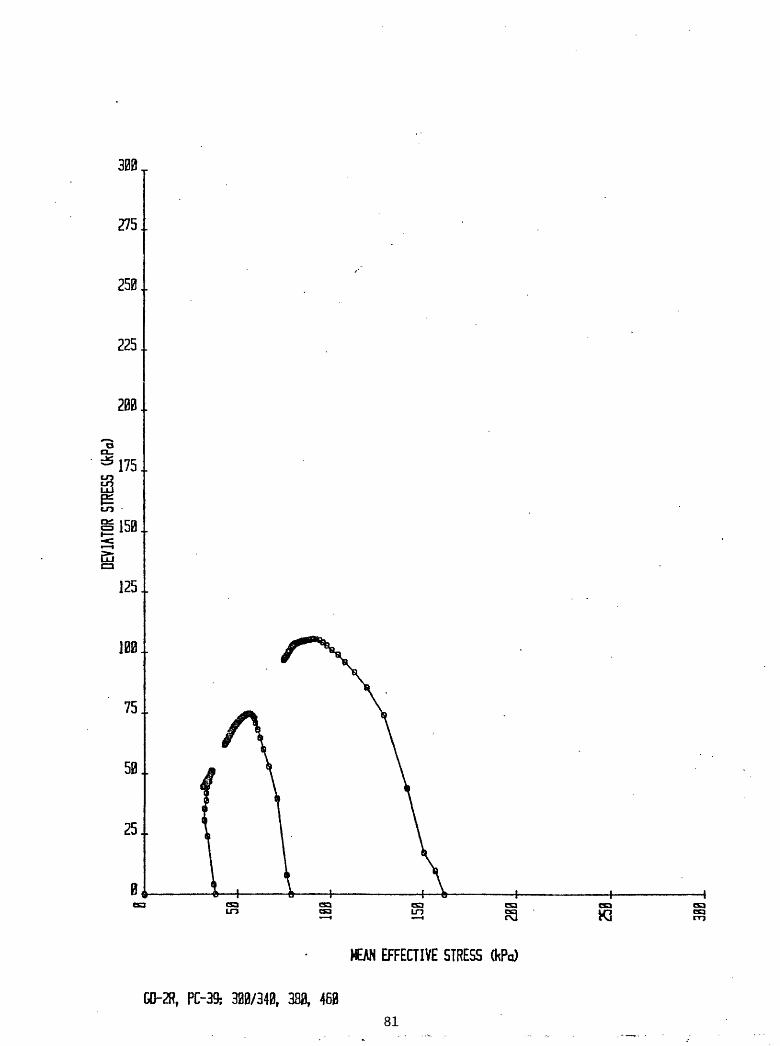
DEY1ATOR S
TRESS
(kPo)
en
CO
-*». tss
180.
.
oo
a i5B
..en £
£80
r\j
enen ta
aen
no
tsa
no en
ts0
1
cu
ta CSB
258.
.
3801

TRI AXIAL TEST RESULTS
GENERAL TEST INFORMATION
SAMPLE INFORMATIONSAMPLE IDi GD-12, PC-40? 300/350
6.38-6.50BALTIMORE-HUDSON CANYON AREA OLIVE-^GRAY CLAY 1/31/80
INTERVAL (meters):GENERAL LOCATION:
DESCRIPTION:DATE FINISHED:
INDEX PROPERTIESMOISTURE CONTENT: 0.48
BULK DENSITY Cg/cc): 1.77VOID RATIO: 1.27
POROSITY* 0.56GRAIN SPEC GRAVITY C 9 /cc): 2.72
SAMPLE PARAMETERSHEIGHT Cmrp): 100.00
DIAMETER Cmm): 50.00AREA Csq. mm): 1963.50
VOLUME Ccc): 196.35WEIGHT CgnO .- 346.90
TEST RESULTS :
^SATURATION PHASE*
READING CELL PRESSURE DELTA C PORE PRESSURE DELTA PkPa50.00100.00150.00250.00350.00
IcPa
50. 0050.00100.00100.00
kPa45.3094.10143.20242.20341.20
kPe
48.8049.1093.0099.00
0.980.980.990.93
^CONSOLIDATION PHASE*
CELL PRESSURE CkPa): 350.00BACK PRESSURE CkPa): 300.OC
CONSOLIDATION PRESSURE CkPa): 50.00ASSUMED EFFECTIVE
OVERBURDEN PRESSURE CkPa): 47.05
82

CHANGES 1.H PROPERTIES DUE TO CONSOLIDATION
PROPERTYHEIGHT
AREA CsqVOLUME
WATER COPOR
VOIDBULK DENSITY Cg/cc):
BOUYAHT BULK DENSITY Cg/cc)i Z SAT
MEASURED PROPERTIES
READING
123456789
101112131415161718192021222324i, «.
262728293031323334
TIMECsec)
05
11224074
14027052910432070387256747476927811081128831468616488132912009321896236982550127303291063090332711345133631638113399214172343526
INITIAL VALUECmmD i
. twrO rCcc)r
rrENTi)SITY:JATIOsJ/CC} :
)/CC>'r
>TION:
Los TIME
-4.000.701.041.341.601.872.152.432.723.023.323.593.753.873.974.044.114.174.224.264.304.344.374.414.444.464.494.514.544.564.584.604.624.64
100.001963.50196.35
0.480.561.271.770.75
100.00
Sqrt TIME
0.002.243.324.696.328.60
11.8316.4323.0032.3045.5062.2375.3386.4696.32
105.27113.50121.19128.41135.24141.75147.97153.94159.69165.24170.60175.81180.86185.78190.57195.24199.80204.26208.63
CONSOLIDATED VALUE98.98
1923.69190.41
0.450.460.861.790.77
100.00
DVOLCcc)
0.00 0.01 0.02 0.04 0.07 0.12 0.22 0.41 0.76 1.36 2.22 3.19 3.77 4.15 4.42 4.62 4.77 4.89
99 07 14 20-
5.25 5.31 5.35 5.39 5.43 5.46 5.50 5.52 5.55 5.57 5.60 5.62
33

3536373839404142434445464748 .49505152
453294713148333507355253854340561435794559748615516335465156669596876270565723677417075972
4.664.674.694.714.724.744.754.764.784.79'4.804.814.834.844.854.864.874.88
212.91217.10221.21225.24229.21233.11236.95240.72244.43248.09251.70255.26258.76262.232S5.64269.01272.34275.63
5.655.675.695.715.725.745.755.765.785.805.825.845.855.875.895.905.925.94
ALPHA: 0.99Ao Csq. mm): 1923.69
Lo Cmro): 98.98
*SHEAR PHASE*
CELL PRESSURE CkPa): STRAIN RATE: .015 mm/min
350.00
MEASURED PROPERTIES
READING
123456789
101112131415
DVOLCcc)0.00
-0.00-0.00-0.00-0.00-0.01-0.01-0.01-0.01-0.01-0.01-0.01-0.02-0.02-0.02
PORPCkPai
. 294.76303.83313.56317.67320.04321.79323.15323.96324.71325.13325.32325.84326.36326.65326.85
DLNGCmm)0.000.160.400.660.931.211.491.792.092.412.733.053.333.724.06
AXFOCM)
0.0034.6463.3275.4983.1088.7092.7795.8597.7798.0096.8596.3895.7395.1694.54
CELPCkPa)
350.00350.00350.00350.00350.00350.00350.00350.00350.00350.00350.00350.00350.00350.00350.00
TIMECsec)
0132226443967528966127935925710579119021322514547158701719218514
84

161718192021222324252627282930313233343536373839404142434445464748495051525354555657
-0.02-0.01-0.01-0.01-0.02-0.01-0.02-0.01-0.02-0.02-0.01-0.02-0.01-0.01-O.C1-0.02-0.01-0.01-0.01-0.01-0.02-0.02-0.02-0.02-0.02-0.02-0.03-0.02-0.02-0.02-0.02-0.02-0.03-0.02-0.02-0.01-0.00-0.01-0.00-0.00-0.01-.0.00
327.07327.43327.75328.01328.05328.37-328.40328.43328.86328.99329.18329.08329.37329.28329.60329.76329.83329.96330.15330.22330.41330.77330.67330.96330.87330.93331 . 03331.06331.13331.25331.35331 . 32331.22331.58331.71.331.90331.94332.16332.03332.26332.29332.29
4.404.755.095.445.79
. 6.156.506.857.217.577.928.288.633.989.339.6910.0310.3910.7311.0811.4211.7712.1112.4512.7913.1313.4813.8214.1614.5014.8515.1915.5317.0417.3917.7318.0818.4218.7719.1219.4719.81
94.0893.2792.8592.3591.8191.3590.8590.4390.0989.7089.3288.9438.4488.1387.5987.3687.0286.7186.2585.8285.2984.9484.6084.2983.9483.5683.4482.9882.8382.45 .32.2981.8381.6079.9179.6079.3379.0778.9578.8078.7678.6878.72
350.00350.00350.00350.00350.00350.00350.00350.00350.00350.00350.00350.00350.00350.00 .350.00350.00350.00350.00350.0035C.OO350.00350.00350.00350. .00350.00350.00350.00350.00350.00350.00350.00350.00350.00350.00350.00350.00350.00350.00350.00350.00350.00350.00
198372-115922482238042512726449277712909430417317393306234385357073702938351396744099742319436424496446237476104393250255515775290054222555455686758190595126083462156679526927570597719207324374565758887721178533
DERIVED PROPERTIESTOTAL EFFECTIVESTRESS
READING
12
STRA1NA
0.00000.0017
SIG1CkPa)
SIG3 RATIO EFFSIG1CkPaD
350.00 350.00 1.367.98 350.00 1.
CkPa)EFFSIG3UPa)
STRESSRATIO
00 55.24 55.24 1.005 64.14 46.17 1.3
85

3456789.
1011121314151617181920212223242526272829303132333435363738394041424344454647484950515253
0.0.0.0.0.0.0.0.0.0.0.0.0.0.0.0.0.0.0.0.0.0.0.0.0.0.0.0.0.0.0.0.0.c.c.0.0.0.0.0.0.0.0.0.0.0.0.0.0.0.0.
004100670093012201510181021202430275030803410375041004450480051505500585062106570693072907640800083608720907094309791014104910841119115411891223125812931327136213S61431146515001535156917221757179218271861
382 . 78388.98392.79395.55397.50398.92399.75399. 70 .398.96398.56398.07397.61397.13396.73396. 16395 . 78395 . 37394 . 93394.54394.13393.75393.42393.07392.72392.37391 . 96391 . 66391.24390.97390.65390.34389.97389.62389.22388.91388.60388.30388.00387.67387.47337.11386.90386.58386.36386.01385 . 76384 . 39384.11383.85383.59383.40
350.350.350.350.350.350.350.350.350.350.350.350.350.350.350.350.350.350.350.350.350.350.350.350.350.350.350.350.350.350.350.350.350.350.350.350.350.350.350.350..350.350.350.350.350.350.350.350.350.350.350.
000000000000000000000000000000000000000000000000000000000000000000000000000000000000000000000000000000
1111111111111111111' 1
11
. 11111111111111111111111111111
.09
.11
.12
.13
.14
.14
.14
.14
.14
.14
.14
.14
.13
.13,13.13.13.13.13.13.13.12.12.12.12.12.12.12.12.12.12.11.11.11.11.11.11.11.11.11.11.11.10.10.10.10.10-10.10.10.10
69.2371.3172.7573.7674.3574.9675.0474.5773.6472.7271.7170 . 9670.2969.6668.7368.0367.3566.8966.1765.7265.3264.5664.0863.5463.2862.5962.3861.6461.2160.8260.3959.8259.4058.8158.1457.9257.3457.1356.7456.4456.0555.7755.3255.0154.6954.5452.8152.4051.9551.6651.24
36.32.29.
443396
23.2126.26.25.24.24.24.23.23.
8504298768166435
23.1522.22.22.21.21.21.21.21.21.21.20.20.20.20.20.20.20.20.19..19.19.19.19.19.19.19.13.18.18.18.18.18.18.18.18.18.13.17.
9357259996636057140282926372402417048578532333041407979488756568784229100734
1.902.212.432.612.772.882.973.002.983.013.033.043.043.043.053.063.063.053. OS3.043.033.053.053.053.03
. 3.033.013.023.023.023.013.013.003.003.023.003.012.992.982.972.962.952.952.952.932.902.872.862.872.862.87
86

54555657
0.18S60.19310.19670.2002
DERIVED PROPERTIES
READING
123456789
1011121314151617131920212223242526272829303132333435363738394041
A
0.500.500.660.660.620.640.700.570.90
-9.42-0.26-1.30-1.05-0.64-0.41-0.57-0.62-0.86-0.62-0.07-0.82-0.08-0.09-1.26-0.37-0.560.28
-0.720.32
-0.78-0.60 ,-0.20-C.43-0.52-0.18-0.49-1.140.31
-l.CO0.32
-0.20
383.19383.03382.86382.73
Ccorit . :
qCkPa)0.008.99
16.3919.4921.4022.7723.7524.4624.8724.8524.4824.2824,0323.8023.5723.3723.0822.8922.6822.4722.2722.0621.8821.7121.5321.3621.1820.9820.8320.6220.4820.3220.1719.9919.8119.6119.4519.3019.1519.0018.84
350.00350.00350.00350.00
P'
CkPa)55.2455.1652.8451.8251.3650.9950.6050.5050.1749.7249.1648.4447.6747.1546.72
. 46.2945.6545.1444.6744.4243.9043.6643,4442.8542.5542.1842.1041.6141.5541.0240.7240.5040.2139.8339.5939.2038.6938.6338.1938.1337.91
1.091.091.091.09
q/p'
0.000.160.310.380.420.450.470.480.500.500.500.500.500.500.500.500.510.510.510.510.510.510.500.510.510.510.50C.500.500.500.500.500.500.500.500.500.500.500.500.500.50
51.1650.7750.5750.44
DEVIATORSTRESS
CkPa}O.OC
17.9832.7838,9842.7945.5547.5048.9249.7549.7043.9648.5648.0747.6147.1346.7346.1645.7845.3744.9344.5444.1343.7543.4243.0742.7242.3741.9641.6641.2440.9740.6540.3439.9739.6239.2238.9138.6038.3038.0037.67
17.97 2.17.74 2.17.71 2.17.71 2.
MEANEFFECTIVESTRESSCkPaD
55.2452*1647.3745.3244.2343.3942.6842.3541.8841.4441.0040.3539.6639.2238.8638.5037 . 9637.5137.1136.9336.4836.3136.1535.6235,3735.0635.0434.6134.6134.1533.89.33.7233.4933.1732.9932.6632.2032.1931.8131.8031.63
85868685
87

42434445464748495051525354555657
-C.48-0.09-0.30-0.40-0.450.090.39
-0.26-0.47-0.75-0.120.000.000.000.000.00
18.7418.5618.4518.2918.1818.0117.8817.1917.0616.93 -16.8016.7016.6016.5216.4316.37
37.7137.5037.3237.0436.8336.6936.6635.6235.3535.0234.8634.5434.5634.2634.1434.07
0.500.490.490.490.490.490.490.480.480.480.480.480.480.480.480.48
37.4737.1136.9036.5836.3636.0135.7634.3934.1133.8533.5933.4033.1933.0332.8632.73
31.4631.3131.1730.9430.7730.6830.7029.8829.6629.3829.2628.9729.0328.7528.6628.62
88

EFFECTIVE SIGHA 1
EFFECTIVE SIGMA 3
DEVIATOR STRESS
SHEAR STRESS
MEAN EFFECTIVE STRESS
EXCESS PORE PRESSURE
GO-12, PC-48; 320/353
AXIAL STRAIN
89

TRIAXIAL TEST RESULTS
GENERAL TEST INFORMATION
SAMPLE INFORMATIONSAMPLE ID:
INTERVAL Cmeters).-GENERAL LOCATION:
DESCRIPTION:DATE FINISHED:
GD-12, PC-40; 300/4006.50-6.62BALTIMORE-HUDSON CANYON AREAOL1VE--GRAY CLAY1/31/80
INDEX PROPERTIESMOISTURE CONTENT: 0.48
BULK DENSITY Cg/cc): 1.77VOID RATIO: 1.27
POROSITY: 0.56GRAIN SPEC GRAVITY Cg/cc) : 2.72
LIQUID LIMIT CZ): 39.00PLASTIC LIMIT C%): 19.00
SAMPLE PARAMETERSHEIGHT Cmm): 100.00
DIAMETER Cmm): 50.00AREA Csq. mm): 1963.50
VOLUME Ccc).- 196.35WEIGHT Cgm): 343.40
TEST RESULTS
^SATURATION PHASEX
READING CELL PRESSURE DELTA C PORE PRESSURE DELTA PkPa50. 00100.00150.00250.00400.00
kPa
50.0050. OC100.00150.00
kPa48.7097.40146.80246.90396.00
kPa
48.7049.40100.10149.10
0.970.991.000.99
^CONSOLIDATION PHASE*
CELL PRESSURE CkPa): 400.00BACK PRESSURE CLPa): 300.00
CONSOLIDATION PRESSURE CkPa): 100.00ASSUMED EFFECTIVE
OVERBURDEN PRESSURE CkPa) s 47.92
90

CHANGES I» PROPERTIES DUE TO CONSOLIDATIOH
PROPERTY
VOLUME WATER CC
POR VOID
BULK DENSITY Cg/cc} : BOUYANT BULK DENSITY Cg/cc) :
X SAT
MEASURED PROPERTIES
READING
123
e739
10111213141516171819202122232425262723293031323334
TIKECsec)
04
11214075
141271529104320703872567474779279
11081128841468616489182912009421896236992550127303291063090932711345143631638119399224172443527
INITIAL VALUECmm) :mm) sCcc):
TENT:SITY:
ATIO:
/cc} :
/CC):
TION:
Log TIME
-4.000.601.041.321.601.882.152.432.723.023.323.593.753.873.974.044.114.174.224.264.304.344.374.414.444.464.494.514.544.564.584.604.624.64
100.001963.50196.35
0.48 .0.561.271.770.75
100.00
Sqrt TIME
0.002.003.324.586.328.6611.8716.4623.0032.3045.5082.2375.3386.4796.33105.27113.51121.1912C.41135.24141.75147.97153.94159.69165.24170.30175.81180.86185.78190.57195.24199.80204.26208.63
CONSOLIDATED VALUE98.01
1886.22184.87
0.430.450.811.820.79
100.00
DVOLCccO
0.00 0.02 0.03 0.06 0.12 0.22 0.41 0.76 1.39 2.44 3.96 5.59 6.55 7.20 7.65 8.00 8.29 8.53 8.74 8.92 9.08 9.23 9.37 9.49 9.61 9.73 9.82 9.93 10.02 10.11 10.19 10.28 10.35 10.43
91

353637383940414243444546474849505152
45329471314893450736525385434156143579465974961551633546515766960687G370565723687417075973
4.664.674.694.71 4.724.744.754.764.784.794.804.814.834.844.854.8S4.874.88
212.91217.10221.21225.25229.21233.11236.95240.72244.44248.09251.70255 . 26258.772G2.23265.64269.01272.34275.63
10.5010.5810.6410.7110.7710.831 0 . 8810.9411.0011.0611.1111.17.11.2211.2811.3311.3811.4311.48
AoALPHA:
Csq. mm):Lo Cmm}:
0.981886.23
98.01
XSHEAR PHASE*
CELL PRESSURE CkPa): STRAIN RATE: .015 mm/min
400.00
MEASURED PROPERTIES
READING
123456789
101112131415
DVOLCcc)0.000.000.00
-0.00-0.000.000.00
-0.00-0.00-0.00-0.00-0.00-0.00-0.00-0.00
PORPCkPa)
302.55324.55342.32350.80356.43360.18363.04365 . 0 1366.57367.91368.92369.91370.70371.47372.01
DLNGCinnO0.000.270.590.921.251.591.932.272.612.973.313.664.014.364.71
AXFOCN)
0.0066.89105.05119.40127.49132.56135.98137.68137.51136.98135.89134.75134.14133.57132.96
CELPCkPa)
400.00400.00400.00400.00400.00400.00400.00400. 00400.00400.00400.00400.00400.00400.00400.00
TIMECsec3
013222645396752906S137935925810580119021322514547158701719213515
92

456789
101112131415161718192021222324252627282930313233343536373839404142434445464748495051525354
0.00940.0128.0.01620.01970.02320.02670.03030 . 03380.03740.04C90.04450.04810.05170.05530.05890.06250.06600.06960.07320.07670.08030.0838.0.08730.09090.09440.09790.10130.10490.10840.11200.11550.11900.12250.12610.12960.13310. 13670.14020.14380.14740.15100.15470.15830.16190.18050.18410. 18780.19140.19490.19860.2021
462.70466.73469. 14470.67471.30470.96470.43469.61468.77468.20467.66467.10466. 65466.09465.68465.19464.86464.31463.89463.48463.08462.65462.30461.89461.55461.1446C.89460.42460.10459.76459.37458.91458.45458.05457.68457.24456.89456.58456.22455.95455.45455.12454.57454.31452.20451.76451.43451.04450.74450.35450.17
400.00400.00400.00400.00400.00400.00400.00400.00400.004CO.OO400.00400.00400.00400.00400.00400.00400.00400.00400.00400.00400.00400.00400.00400.00400.00400.00400.00400.00400.00400.00400.00400.00400.0040C.OO400.00400.00400.00400.00400.0040C.OO400.00400.00400.00 .400.00400.00400.00400.00400.00400. 00400.0040C.OO
1.161.171.171.181.181.181.181.171.171.171.171.171.171.171,161.161.161.161.161.161.161.161.161.151.151.151.151.151.151.151.151.151.151.151.141.141.141.141.141.141.141.141.141.141.131.131.131.131.131.131.. 13
111.90110.30108.96107.63106.29104.39102.52100.6998.8697.5096.1995.0994.1693.2292.2191.2590.4489.7389.0588.2687.5287.0586.3685.7585.1584.6384.0583.3682.9182.3131.6781.1580.5079.9179.3578.8273.3077.7177.2877.0476.3676.0275.5175.1972.4771.9371.4870.9270.5370.0869.77
49.2043.5739.8236.9634.9933.4332.0931.0830.0929.3028.5327.9927.5227.1426.5326.0525.5825.4225.1624.7824.4324.4024.0523.8623.6123.5423.16 '22.9422.8122.5622.3022.2422.0521.8621.6721.5721.4121.1321.0621.1020.9020.9020.9420.8720.2720.1720.0519.8919.7919.7319.60
2.272.532.742.913.043.123.193.2<3.293.333.373.403.423.443.483.503.543.533.543.563.583.573.593.593.613.603.633.633.633.653.663.653.653.663.663.653.663.683.673.653.653.643.613.603.583.573.573.573.563.553.56
93

55 0.2058 449.94 400.00 56. 0.2094 449.82 400.00
DFRIVED PROPERTIES Ccont,)
READING
123456789*-/101112131415.L *-*
16171819 j- * *202122232425£_ /
26272829303130f-33~<4vJT
353637383940 41
4243
A
0.620.620.89 .1.151.401.561.873.13-4.53-2.51-1.25-1.17-1.40-1.41-0.96-1.05-0^68-i.50-0.97-1.43-0.29-0.60-0.92-0.89-0.07-1.02-0.46-0.74-0.15-1.51-0.47-0.40-0.75-0.66-0.14-0.41-0.48-0.51-C.22-0.45-0.93-0.180.12
qCkPa)0.00 .17.6827.6831.3533.3634.5735.3435.6535.4835.2134.8134.3934.1033.8333.5533.3233.0432.8432.6032.4332.1631.9531.7431 . 5431.3231.1530.9430.7730.5730.4430.2130.0529.8829.6929.4629.2329.0328.8428.6228.4428.2928.1127.97
P'
CkPa)97.4593.1485.3680.5576.9374.3972.2970.6468.9167.3165.8864.4863.4062.3661.5460.8460.1859.3758.6558.0157.5757.1156.5255.9755.7255.2054.8154.3354.1153.6053.1552.8652.4351.9951.7051.2850.8850.5150.1949.8649.4249.1749. .07
1.12 69.45 1.12 69.01
DEVIATORq/ P ' STRESS
.CkPa)
0.000.190.320.39C.43C. 46-0.490.500.510.520.530.530.540.540.550.550.550.550.560.560.560.560.560.560.560.560.560.570.560.570.570.570.570.570.570.570.570.570.570.570.570.570.57
0.0035.3755.3662.7066.7369.1470.6771.3070.9670.4369.6168.7768.2067.6667.1066.6566.0965.6865.1964.8664.3163.8963.4863.0862.6562.3061.8961.5561.1460.8960.4260.1059.7659.3758.9158.4558.0557.6857.2456.895S.5856.2255.95
19.51 3.56 19.19 3.60
MEAN EFFECTIVESTRESS CkPa)
97.4587.2476.147C.1065.8162.8760.5258.7557.0855.5754.2853.0152.0351.0950.3649.7349.1648.4347.7947.2046.8646.4645.9445.4645.28.44.8244.4944.1243.9243.4643.0842.8442.4842.0941.8841.5341.2140.8940.6540.3839.9933.8039.74
94

16171819202122232425262728293031323334353637383940-41
424344454647484950515253545556
-0.00-0.01-0.00-0.01-0.01-0.00-0.01-0,00-0.00-0.00-0.000.000.00c.oo0.000.000. 000.000.000.000.000.00
-0.00-0.00-0.00-0.00-0.00-0.00-0.01-0.01-0.01-0.01-0.02-0.02-0.02-0/02-0.02-0.02-0.02-0.02-0.01
372.48372.87373.47373.95374.42374.58374.84375.22375.57375.60375 . 95378.14376.33376.46376.84377.06377.19377.44377.70377.76377.95378.14378.33378.43378.59378.87378.94378.91379.10379.10379.06379.13379.73379.83373.95380.11380.21380.27380.40380.49380.81
5.075.425.776.126.476.827.177.527.878.218.568.919.259.609.93 ,10.2810.6310.9711.3211.6612.0112.3612.7013.0513.4013.7414.1014.4514.8015.1615.5115.8717.6918.0518.4018.7619.1019.4719.8120.1720.52
132.56131.95131.65131.16130.99130.38130.03129.68129.37128.98128.76128.41128.19127.84127.80127.31127.14126.92126.61126.13125.65125.30125.00124.56124.30124.12123.86123.77123.20122.98122.28122.24120.14119.66119.44119.05118.87118.52118.61118.61118.87
400.00400.00400.00400.00400.00400. UO400.00400.00400.00400.00400.00400.00400.00400.00400.00400.00400.00 400.00400.00400.00400.00400.00400.00400.00400.00400.00400.00nG" . 00
400.00400.00400.00400.00400.00400.00400.00400.00400.00400.00400.00400.00400.00
19837211602248223804251272645027772290353041731740330623438535707370303835339676409984232143660.4498246305476284895050273515355291854240555635688558207595306085267.618689407026371586729087i231- "562
7688578207
DERIVED PROPERTIESTOTAL EFFECTIVESTRESS
READING STRAIHA SIG1 SIG3 RATIO EFFSIG1 EFFSIG3CkPa) CkPa:
123
0.00000. 00280. 0060
40C.CO 400.435.37 400.455.36 400.
00 100 100 1
STRESSRATIO
CkPa) . UPa).00 97..09 110..14 113.
45 97.4582 75.4604 57.69
1.001.471.96
95

44454647484950515253545556
-0.390.000.06
-0.25-0.29-0.22-0.39-0.40-0.320.000.000.000.00
27.7327.5627.2927. 1626.1025.8825.7225.5225.3725.1825.09 ,.-'24.9724.91
48.6348.4648.2248. 0346.3746.0545.7645.4045.1644.9144.6944.4844.10
0.570.570.570.570.560.56
. 0.560.560.560.560.560.560.56
55.4555.1254.5754.3152.2051.7651.4351,0450.7450.3550.1749.9449.82
39.39. 39.2839.1338.9837.6737.4337.1936.9036.7036.5136.3236.1535.80
96

an_
350
325
300
275
250.
225.
200.
175.
150.
125.
100.
75.
50.
25'.
B|
EFFECTIVE SIGMA 1
x EFFECTIVE SIGHA 3
DEVIATOR STRESS
SHEAR STRESS
MEAN EFFECTIVE STRESS
EXCESS PORE PRESSURE
un cacsa
GO-12, PC-40: 300/400
AXIAL STRAIN
97

TRIAXIAL TEST RESULTS
GENERAL TEST INFORMATION
SAMPLE INFORMATIONSAMPLE ID:
INTERVAL (meters):GENERAL LOCATION:
DESCRIPTION:DATE FINISHED:
GD-12, PC-40; 300/5006.62-6.74BALTIMORE-HUDSON CANYON AREAOLIVE-GRAY CLAY1/31/80
INDEX PROPERTIESMOISTURE CONTENT: 0.46
BULK DENSITY Cg/cc): 1.79VOID RATIO: 1.22
POROSITY: 0.55GRAIN SPEC GRAVITY C 9 /cc): 2.72
SAMPLE PARAMETERSHEIGHT Cmm): 100.00
DIAMETER Cmm): 50.00AREA Csq. mm): 1963.50VOLUME Ccc): 196.35WEIGHT Cgm): 342.60
TEST RESULTS
^SATURATION PHASE*
READING CELL PRESSURE DELTA C PORE PRESSURE DELTA PkPa50.00100.00150.00250.00500. 00
kPa
50.0050.00100.00250.00
kPa47.5097.40146.90246.90497.20
kPa
49.9049.50100.00250.30
1.000.991.001.00
^CONSOLIDATION PHASE*
CELL PRESSURE CkPa): 500.00BACK PRESSURE CkPa): 300.00
CONSOLIDATION PRESSURE CkPa): 200.00ASSUMED EFFECTIVE
OVERBURDEN PRESSURE CJcPa) : 49. 97
98

CHANGES IN PROPERTIES DUE TO CONSOLIDATION
PROPERTY INITIAL VALUEHEIGHT (mm): 100.00
AREA Csq. mm): 1963.50VOLUME Ccc): 196.35
NATER CONTEHTs 0.46POROSITY: 0.55
VOID RATIO: 1.22BULK DENSITY Cg/cc),- 1.79
BOUYANT BULK DENSITY C9 /cc): 0.76X SATURATION: 100.00
CONSOLIDATED VALUE96.31
1821.36175.42
0.370.400.651.880.35
100.00
MEASURED PROPERTIES
NG
12345678910111213141516171819202122232425262728293031323334
TIMECsec)
04
11224075
141271530
10442070387356757477927911082128841468716489182922009421897£36992550127304291073090932712345143631738119399224172443527
Log TIME
-4.000.601.041.341.601.882.152.432.723.023.323.593.753.873.974.044.11
. 4.174.224.264.304.344.374.414.444.464.494.514.544.564.584.604.624.64
Sqrt TIME
0.002.003.324.696.328.6611.8716.4623.0232.3145.5062.2375.3386.4796.33
10.5.27113.51121.19128.41135.25141.75147.98153.94159.69165.24170.61175.81180.86185.78190.57195.24199.80204.26208.63
DVOLCcc)
0.000.010.040.080.160.290.551.041.933.526.129.4511.8413.6014.9215.9116.6817.2917.7618.1418.4618.7118.9419.1119.2819.4219.5419.8419.7419.8319.9119.9720.0420.11
99

353637383940414243444546474849505152
453304713248934507365253954341561445794659749615526335565157663606876370566723687417175973
4.664.674.694.714.724.744.754.764.784.79'4.804.814.834.844.854.864.874.88
212.91217.10221.21225.25229.21233.11236.95240.72244.44248.10251.70255.26258.77262.23265.64269.01
. 272.34275.63
20.1620.2220.2720.32
- 20.3720.4020.4620.512C .5620.6020.6520.6920.7420.7720.8220.3520.8320.93
ALPHA: 0.96Ao Csq. mm): 1821.37
Lo Cmm}-: 96.31
XSHEAR PHASE*
CELL PRESSURE dcPa): STRAIN RATE.- .015 mm/min
500.00
MEASURED PROPERTIES
READING
123456789
101112131415
DVOLCcc)0.000. 000.000.000.000.00
-0.000.000.00
-0.000.000.00
-0.00c.oo
-0.00
PORPCkPe>
302.77316.88367.35392.33407.04416.85424.22429.33433.24436.34438.94441.16442.63444.35.445.49
DLNGCmm)0.000.270.550.851.151.461.772.112.432.763.103.443.794.134.48
AXFOCN)
0.0021.20139.32171.72 .136.76195.36200.91204.78207.11208.39208.58208.35207.57207.69207.26
CELPCkPa)
500.00500.00500.00500.00500.00500.00500.00500.00500.00500.00500.00500.00500.00500.00500.00
TIMECsec)
01323264539685290661379359258
10580119031322614548158701719318515
100

1617181920212223242526272829303132333435363738394041424344454647484950515253545556
-0.000.00
-0.00-0.000.000.00
-0.000.000.010.000.000.00
-0.000.000. 00G.OO
-0.00-0.000.00
-0.000.00
-D.CO-0.00-0.00-0.000.00
-0.01-0.00-0.00-0.00-0.00-0.01-0.01-0.01-0.01-0.01-0.01-0.02-0.01.-0.01-0.01
446.89447.81448:88449.53450.35451.00451.55452.08452.76453.22453.77'454.00454.32454.84455.30
' 455.56455.95456.21456.47456.51 .456.67457.22457.39457.71458.04458.43458.53458.43458.79458.66458.95458.89460.03460.61460.74461.10461.17
. 461 . 13461.69461.85462.05
4.845.195.545.896.246,596.957.307.658.018.368.719. 079.429.7610.1210.4610.8211.1611.5211.8712.2112.5612.9113.2513.6013.9514.2914.6414.9915.3415.6917.4717.8218.1718.5218.8619.2019.5519.8920.24
206.76. 206.25205.94205.60205.36205.44205.25205.29205.17205.36205.32205.29205.21205.29205.13205.172C5.29205.17205.13204.63204.66204.36204.20204.08203.97203.93203.74203.58203.43203.00202.65202.42200.21199.86199.51199.12199.01198.81198.81199.05199.24
500.00500.00500.00500.00500.00500.00500.00500.00500.00500.00500.00500.00500.00500.00500.00500.00500.00500.00500. CO500.00.500.00500.00500.00SCO. 00500.00500.00500.00500.00500.00500.00500.00500.00500.00500.00500.00500.00500.00.500.00500.00500.00500.00
1983821160224322380525127264502777229095304173174033063343863570837030383533967640999423224364444967462904761248935502575158052902542255554756881582035952560847676206894370265715887291174233755567687978201
DERIVED PROPERTIESTOTAL EFFECTIVESTRESS
READING
12
STRAINA
0.00000.0028
SIG1 S1G3 RATIO EFFSIG1 EFFSIG3CkPa) Ck
500.00 500.511.61 500.
Pa)00 1.00 1.
STRESSRATIO
CkPa) CkPa)00 197.02 194.
23 197.2373 183.12
1.01.01
.3 0.0057 576.06 500.00 1.15 208.71 132.65 1.57
101

456789
101112131415161718192021222324252627282930313233343536373839404142434445464748495051525354
0.00880.01190.01520.01840.02190.02520.02870.03220 . 03580.03940.04290.04660.05020.05390.05750.06120.0648 .0.06840.07210.07580.07950.03320.0368C.09050.09410.09780.10140.10500.10860.11230.11590.11960.12320.12680.13040.13400.13760.14120.14480.14840.15200.15560 . 15930.16290.18140.18500.18870.19230.19580.19940.2030
533.45601.32605.63608.27609.97610.85611.13610.83610.30609.48609.14608.50607.82607.14606.57605.97605.44605.08604.56604.16603.69603.37602.94602.51602.06601.69601.21600.81600.47599.99599.57598.91598.52597.97597.49597.03596.58596.16595.66595.19594.71594.11593.54593. 03589.98589.43588.87588.31587.86587.39587.00
500.00500.00500.00500.00500.00500.00500.00500.00500.00500.00500.00500.00500.00500.00500.00500.00500.00500.00500.00500.00500.00500.00500.00500.00500.00500.00500.00500.00 '500.00500.00500.00500.00500.00500.00500.00500.00500.00500.00500.00500.00500.00500.00500.00500.00500.00500.00500. 00500.00500.00500.00500.00
1.191.201.211.221.221.221.221.221.221.221.221.221.221.211.211.211.211.211.211.211.211.211.211.211.201.201.201.201.201.201.201.201.201.201.191.191.191.191.191.191.191.191.191.191.181.181.181.181.181.171.17
201.07194.28188.78184.06180.64177.60174.79171.89169.14166.85164.78163.00160.92159.33157.68156.44155.10154.08153.01152.09150.94150.16149.18148.51147.74146.84145.91145.25144.51143.78143.10142.40141.85140.75140.11139.32138.54137.73137.13136.76135.92135.45134.59134.15129.95128.81128.13127.21126.70126.26125.31
107.6292.9683.1575.7970.6766.76 .63.6661.0658.8457.3855.6554.5153. 1152.1951.125.0 . 4749.6549.0048.4547.8347.24
. 46.7946.2346.0045.6845.1644.7044.4444.0543.7943.5343.4943.3342.7842.6142.2941.9641.5741.4741.5741.21.41.3441.0541.1239.9839 . 3939.2638.9038.8338.8738.31
1.872.092.272.432.562.662.752.822.872.912.962.993.033.053.083.103.123.143.163.173.203.213.233.233.233.253.263.273.283.283.293.273.273.293.293.293.303.313.313.293.303.283.283.263.253.273.263.273.263.253.27
102

55 0.2065 586.71 500.00 56 0.2102 586.40 500.00
DERIVED PROPERTIES Ccont.)
READING
123456789
10111213141516171819202122232425
. -262728293031323334353637383940414243
A
1.221.220.781.441.862.272.793.014.4810.95-8.83-4.14-1.78-5.06-1.78-2.. 06-1.35-1.87-1.10-1.54-1.76-1.08-1.31-1.46-1.41-1.30-0.53-0.72-I.o9-0.96-0.66
. -1.12-0.55-0.62-0.05-0.42-1.01-0.34-0.71-0.71-0.94-0.200.21
qCkPa)0.005.80
38.0346.7350.66.52.8254.1454.9955.4255.5655.4255.1554.7454.5754.2553.9153.5753.2852.9952.7252.5452.2852.0851.8551.6951.4751.2651.0350.8450.6050.4150.2350.0049.7949.4649.2648.9948.7548.5248.2948.0847.8347.59
P'
CkPa)197.231'88.92170.68154.35143.62.135.97129.92125.66122.13119.23116.47113.93112.11110.22108.76107.01105.76104.40103.45102.37101.54100.73100.0199.0998.4797.7097.2696.7196.0095.3094.8594.2393.7893.3192.9592.5991.7691.3690.8090.2589.6589.3089.17
1.171.17
q/p'
0.000.030.22Q.300.350.390.420.440.450.470.480.480.490.500.500.500.510.510.510.510.520.520.520.520.520.530.530.530.530.530.530.530.530.530.530.530.530.530.530.540.540.540.53
124.86124.35
DEVIATORSTRESSCkPa)0.00
11.6176.0693.45101.32105.63108.27109.97110. .85111.13110.83110.30109.48109.14108.50107.82107.14106.57105.97105.44105.08104.56104.16103.69103.37102.94102.51102.06101.69101.21100.81100.4799.9999.5798.9198.5297.9797.4997.0396.5896.1695.6695.19
38.15 3.2737.95 3.28
MEANEFFECTIVESTRESSCkPa)
197.23186.99158.00138.77126.73118.36111.38107.33103.71100.7193.0095.6193.8792.0390,6789.0487.9186.6485.7984.8084.0383.3082.6581.8181.24-80.5580.1779.7079.0578. <478.0477.5477.1276.7276.4676.1775.4475.1174,6374.1573.6273.3673.30
103

44454647484950515253545556
-0.750.22
-0.520.13
-0.37-1.06-0.24-0.63-0.150.000.00C.OO0.00
47.3647.0546.7746.5244.9944.7144.4444.1543.9343.70 ,43.5043.3643.20
88.5788.4087.8287.6384.9684.1083.6983.0532.7782.5681.8181.5181.15
0.53 .0.530.530.530.530.530.530.530.530.530.530.530.53
94.7194.1193.5493.0389.9889.4388.8788.3137.3687.3987.0086.7186.40
72.7872.7172.2372.1369.9769.2068.8868 .-3368.1268.0067.3167.0566.75
104

EFFECTIVE SIGHA 1
EFFECTIVE SIGHA 3
DEYIATOR STRESS
SHEAR STRESS
MEAN EFFECTIVE STRESS
EXCESS PORE PRESSURE
AXIAL STRAIN
GO-12, PC-40; 300/508105

9 I
o ON

30EL
2751
250
2251
2081
enft E5CO
as
1751
1501
1251
1001
751
>BN EFFECTIVE STRESS (KPa)
GO-12, PC-40; 230/358, 400, 508
107

TEST RESULTS
GENERAL TEST INFORMATION
SAMPLE INFORMATIONSAMPLE ID: GD-15, PC-43* 300/370
9.13-9.25BALTIMORE-HUDSON CANYON AREA OLIVE-GRAY CLAY 3/17/80
INTERVAL (meters)iGENERAL LOCATIONS
DESCRIPTION:DATE FINISHED:
INDEX PROPERTIESMOISTURE CONTENT: 0.28
BULK DENSITY Cg/cc): 1.99VOID RATIO: 0.74
POROSITY: 0.43GRAIN SPEC GRAVITY Cg/cc): 2.71
SAMPLE PARAMETERSHEIGHT Cmm): 100.00
DIAMETER Cmm): 50.00AREA Csq. mm)i 1963-50
VOLUME Ccc): 196.35WEIGHT CgnO: 375.00
TEST RESULTS
^SATURATION PHASE»
READING CELL PRESSURE DELTA C PORE PRESSURE DELTA PkPa50.00100.00200.00300.00370.00
kPa
50.00100.00100.0070.00
kPa47.0097.00196.00295.00366.00
kPa
50.0093.0099.0071.00
1.000.990.991.01
XCONSOLIDATIOH PHASE*
CELL PRESSURE CkPa): 37C.OOBACK PRESSURE CkPa): 300.00
CONSOLIDATION PRESSURE CkPa): 70.00ASSUMED EFFECTIVE
OVERBURDEN PRESSURE CkPa): 87.20
108

CHANGES IN PROPERTIES PUE TQ CONSOLIDATION
PROPERTY IIHEIGHT (mm)«
AREA Csq. mm).*VOLUME Ccc):
WATER CONTENT:POROSITY:
VOID RATIO:BULK DENSITY Cg/cc):
BOUYANT BULK DENSITY Cg/cc-3-.X SATURATION:
IAL VALUE100.00
1963.50196.35
0.280.430.741.990.97
100. CO
CONSOLIDATED VALUE97.11
1851.52179.79
0.220.210.272.08l.OS
100.00
MEASURED
READING
12345678«-vo.
10111213141516
. 1718192021
PROPERTIES
TIMECsec)
15
122341761432735321046
5532157371603746337666378693817238475386783898139184394
Log TIME Sqrt TIME
0.000.701.081.361.611.882.162.442.733.024.744.764.734.804.824.844.864.884.894.914.93
1.002.243.464.806.408.7211.3616.5223.0732.34235.20239.52245.71251.75257.64263.40269.04274.57279.98285.29290.51
DVOLCcc)
0.000.120.270.470.781.221.882.854.236.3216.2216.2816.3216.3416.3816.4016.4216.4416.4716.4916.56
ALPHA: 0.97Ao Csq. mm): 1851.52
Lo Cmm): 97.11
PHASE*
CELL PRESSURE CkPa): STRAIN RATE: .015 mm/min
370.00
109

MEASURED PROPERTIES
READING
123456789
1011121314151617181920212223242526272829303132333435363738394041424344454647
DVOLCcc)
. 0.000.00o.oo-0.010.000.000.010.000.01O.C10.010.010.000.010.010.010.010.010.010.010.010.010.010.010.000.010.010.010.000.010.010.000.010-010.010.000.01C.01O.Oi0.010.010.00G.OO0.010.000.010.00
PORPCkPa)
332.36338.58341.78343.73345.07345.91346.34346.50346.57346.66346.30346.47346.30346.57346.34346.24345.98345.85346.01345.98345.55345.39345.36345.23345.10344.87344.68344.35344.48344.19343.99343.99.343.89343.89343.83343.63343.60343.14343.47343.37343.24343.11343.24343.05343. 08342.98342.88
DLHGCmm)0.000.240.530.831.131.441.752.072.402.733.073.413.754.094.434.775.125.475.826.176.536.887.247.537.953.308.659.019.369.7110.0710.4210.7711.1211.4711.3212.1712.5212.8813.2313.5813.9314.2814.6314.9715.3215. G7
AXFOCH3
0.0045.1571.27
. 82.5589.9996.11100.57104.02105.80108.32110.41112.85114.91117.12119.25121.38123.63125.68127.89129.71131.42132.89134.67136.11137.58139.13140.53142.04143.55144.83146.18147.54148.59149.87150.87152.15153.12154.36155.29156.38157.31158.12159.09159.75160.76161.53162.42
CELPCkPa>
370.00370. CO370.00370.00370.00370.00370.00370.00370.00370.00370.00370.00370.00.370.00370.00370.00370.00370.00370.00370.00370.00370.00370.00370.00370.00370.00370.00370.00370.00370.00370.00370.00370.00370.00370.00370. 00370.00370.00370.00370.00370.00370.00370.00370.00370.00370.00370.00
^IME
(sec)0
1322264539675290 61279349256
1057911902132251454715870171931851519838211612248323806251292645127774290973042031742330653438835711370343835639679410024232543647
. 449704629247614
. 48937502595158252905542275555056872581945951760839
110

48495051525354555657585960
0.000.000.010.000.000.000.010.010.000.00
-0.000.000.00
. 342.342.342.342.342.342.342.342.342.342.342.342.342.
65928872467962392313071710
16.16.16.17.17.17.18.18.18.19.19.19.20.
02377207427612468116518620
162.163.164.164.165.165.166.'167.167.
937413863399450362
167.89168.168.169.
587832
370.00370370370370370370370370370370370370
.00
.00
.00
.00
.00
.00
.00
.00
.00
.00
.00
.00
6216263484648076613067453687757009871420.7274374066753887671078033
DERIVED PROPERTIESTOTAL EFFECTIVE
STRESSREADING
A
23456789
10111213141516171819202122
. 232425262728293031
STRAINA
0.0.0.0.0.0.0.0.0.0.0.0.0.0.0.0.0.0.0.0.0.0.0.0.0.0.0.0.0.0.
0.
0000002500550085011601480130021302470281031603510386042104560491052705630599063606720709074507820818085508910927096410001037
SIG1CkPa)
370.00394.32408.28414.20418.04421.14423.34424.99425.73426.86427.75428.81429.67430.59431.47432.34433.25434.06434.94435.60436.21436.69437.32437.76438.23438.72439.13439.60440.06440.40440.77
SIG3 RATIO EFCkPa>
37037037037037037037037037037037037037037037 C370370370370370370370370370370370370370370370370
.00
.00
.00
.00
.00
.00
.00
.00
.00
.00
.00
.00
.00
.00
.CO
.00
.00
.00
.00
.00
.00
.00
.00
.00
.00
.00
.00
.00
.00
.00
.00
1.1.1.1.1.1.1.1.1.1.1.4
1.1.1.1.1.1.1.1.i.1.1.1.1.1.1.1.1.1.1.
r
00071012131414151515161616161717171718181818181818191919191919
FSIG1 EFFSIG3STRESS.RATIO
kPa) CkPa)37.55.66.70.72.75.77.78.79.80.81.82.83.84.85.86.87.88.88.89.90.91.91.92.93.93.94.95.95.96.
647451479723004917204534360313102821926365309654138546255821
96.78
37.6431.4228.2326.2724.9324. C923.6623.5023.4423.3423.7023.5323.7023.4423.6623.7624.0224.1523.9924.0224.4524.6124.642-4.7724.9025.1325.3325.6525.5225.8126.01
1.001.772.362.682.933.123.253.343.383.443.443.503.523.593.603.623.633.653.713.733.713.713.733.743.743.733.733.713.753.733.72
111

32333435363738334041424344454647484950515253545556575859eo
000000.00000000Q00000000000000
.1073
.1109
.1145
.1181
.1217
.1253
.1289
.1326
.1362
.1398
.1434
.1471
.1506
.1542
.1578
.1614
.1650
.1686
.1722
.1758
.1794
.1829
.1865
.1901
.1937
.1973
.2009
.2045
.2080
441.13441.35441.67441.86442.17442.34442.62442.75442.95443.08443.15443.29443.28443.44443.48443.57443.48443.53443.38443.39443.284.43.25443.13443.06442.99442.79442.76442.52442.42
DERIVED PROPERTIES Cco-nt.
370.370.370.370.370.370.370.370.370.370.370.370.370.370.370.370.370.370.370.370.370.370.370.370.370.370.370.370.370.
3
0000000000000000000000000000000000000000000000000000000000
1.1.1.1.1.1.1.1.1.1.1.1.1.1.1.1.1.1.1.1.1.1.1.1.1.1.t.1.1.
1919191920202020202020202020202020202020202020202020202020
97.97.97.98.98.98.99.99.99.99.
100.100.100.100.100.100.100.100.100.100.ICO.100.100.100.100.10C.100.100.100.
1445780354744828588404052436506882615067824751-677665693532
DEVIATORREADING
123456789
10111213141516
A
0.260.260.230.330.350.270. 190.100.090.09
-0.400.15
-0.190.28-0.26-0.11
qCkPa)0.00
12.1619.1422.1024.0225.5726.6727.4927.8728.4328.8729.4129.8330.3030.7331.17
Pq/p'
CkPa)37.43.47.48.48.49.50.50.51.51.52.52.53.53.54.54.
64583737956633993077579453734093
0.0.0.0.0.0.0.0.0.0.0.0.0.0.0.0.
00284046495153545455555656565657
STRESSCkPa)0.
24.38.44.48.51.53.54.55.56.57.58.59.60.61.62.
00322820041434997386758167594734
26.0126.1126:1126.1726.3726.4026.8626.5326.6326.7626.8326.7626.9626.9227.0227.1227.3527.0927.1227.2827.5427.2227.3827.61 .27.7727.8727.9327.8327.90
MEAN
3.733.733.753.753.743.743.703.743.743.733.723.743.72
. 3.733.723.713.693.713.713.693.663.693.673.653.633.613.603.613.60
EFFECTIVESTRESS(kPa)
37.6439.5340.9941.0040.9541.1341.4441.8342.0142.2942.9543.1443.5843.6344.1544.54
112

17 18 19 20 21 22 23 24 25 26 27 28 29 30 31-zpw£.
33 34 35 36 37 38 39 4041 42 43 44 45 46 47 48 49 5051 52 53 54 55 56 57 58 59 60
0.28 31-63 55.65 . 0 .16 32.03 56.18 0.19 32.47 .56.46 0.05 32.80 . 56.32
-0.70 33.10 57".55 0.00 33.34 57.95 0.00 33.66 58.30 0..00 33.88 58.65 0.00 34.11 59.02 0.00 34.36 59.49 0.00 34.57 59.89 0.00 34.80 60.45 0.00 35.03 60.55 0.00 35.20 61.01 0.00 35.38 61.39
o.co0.00 0.00 0.00 0.00 0.00 0.00 0.00 0.000.00 0.00 0.00o.oo0.00 0.00 0.00 0.00 0.00o.oo0.00 0.00 0.00o.oo0.00 0.00 0.00o.co0.00 0.00
35.5735.67 35.34 35.93 36. 09 36.17 36.31 36.38 36.4836.54 36.58 36.64 36.64 36.72 36.74 36.78 36.74 36.76 36.6936.69 36.64 36.63 .36 . 56 36.53 36.50 36.39 36.38 36.26 36.21
61.5861.78 61.94 62.10 62.45 62.57 63.17 62.91
. 63.1163.30 63.46 63.40 63.60 63.64 63.76 63.90 64.09 63.85 63.8163.98 64.13 63.84 63.94 64.14 64.27 64.26 64.31 64.09 64.11
0.57 63.25 45.11 0.57 64.06 45.50- 0.58 64:94 45'.63 0.58 65.60 45.89 0.58 66.21 46.51 0.58 66.69 46.84 0.58 87.32 47.08 0.58 67.76 47.36 0.58 68.23 47.64 0.58 63.72 43.04 0.58 69.13 48.37 0.58 63.60 43.85 0.58 70.06 48.87 0.58 70.40 49.28 0.58 70.77 49.60
0.580.58 0.58 0.58 0.58 0.58 0.57 0.58 0.580.58 0.58 0.58 0.58 0.53 0.58 0.58 0.57 0.58 0.580.57 0.57 0.57 0.57 0.57 0.57 0.57 0.57 0.57
. 0.56
71.1371.35 71.67 71.86 72.17 72.34 72.62 72.75 72.9573.08 73.15 73.29 73.28 73.44 73.48 73.57 73.43 73.53 73.3873.39 73.28 73.25 73.13 73.06 72.99 72.79 72.76 72.52 72.42
49. rd.49.89 50-00 50.13 50-43 50.51 51.06 50.78 50.9551.12 51.27 51.19
. 51.38 51.40 51.51 51.64 51.84 51.59 51.5851.74 51.97 51.63 51.75 51.96 52.10 52.13 52.19 52.01 52.04
113

350
325
300
275..
250..
225..
EFFECTIVE SIGMA 1
x EFFECTIVE SIGHA 3
*- DEVIATOR STRESS
* SHEAR STRESS
MEAN EFFECTIVE STRESS
o EXCESS PORE PRESSURE
OOOOOOODOO Oft-OOOO 08 0 0 O 6-O 0 0 0 0 00 G OOO 0
AXIAL STRAIN
GD-15, PC-43: 380/373 114

TRIAX1AL TEST RESULTS
GENERAL TEST INFORMATION
SAMPLE INFORMATIONSAMPLE ID:
INTERVAL Cme'.ers)*GENERAL LOCATION:
DESCRIPTION:DATE FINISHED:
GD-15, PC-43; 300/4409.01-9.13BALTIMORE-HUDSON CANYON AREAOLIVE'-GRAY CLAY3/17/80
INDEX PROPERTIESMOISTURE CONTENT: 0.29
BULK DENSITY Cg/cc): 1.98VOID RATIO: 0.77
POROSITY-. 0.43GRAIN SPEC GRAVITY Cg/ccD: 2.71
LIQUID LIMIT CX): 27.00PLASTIC LIMIT CX): 15.00
SAMPLE PARAMETERSHEIGHT C«nm): 100.00
DIAMETER CmrrO : 50.00AREA Csq. mm): 1963.50VOLUME Ccc): 196.35WEIGHT Cgm): 379.20
TEST RESULTS
^SATURATION PHASE*
READING CELL PRESSURE DELTA C PORE PRESSURE DELTA PkPa50.00100.00200.00300.00440.00
kPa
50.00100.00100.00140.00
kPa SO.00 100.00ieg.oo300.00440.00
50.00 1.0093.00 0.99101.00 1.01140.00 1.00
^CONSOLIDATION PHASE*
CELL PRESSURE CkPa): 440.00BACK PRESSURE CkPaD: 3CO.OO
CONSOLIDATION PRESSURE CkPa): 140.00ASSUMED EFFECTIVE
OVERBURDEN PRESSURE CkPa)i 84.77
115

CHANGES TN PROPERTIES DU£ TO CONSOLIDATION
PROPERTY
VOLUME WATER CO
POR VOID
BULK DENSITY Cg/cc) : BOUYANT BULK DENSITY Cg/cc>
X SAT
MEASURED PROPERTIES
READING
12345e789
101112131415161713192021
TIME
1G
12234176
142273532104G
5532057370603736337566377693807238375385783888139184333
INITIAL VALUECmm)trim)Ccc)TENTSITYATIO/cc)/cc>TION
Log
: 100.00CONSOLIDATED VALUE
: 1963.50
:
r : "
TIME
0.0.1.1.1.1.2.2.2.3.4 m
4.4.4.4.4.4.4.4.4.4.
007808366188154473027*
76788032848688899193
196.350.290.43C.771.980.95
100.00
Sqrt TIHE
1.2.3.4.6.8.
11.16.23.32.
235.239.245.251.257.263.269.274.279.285.290.
004546804072925207342052717464-40
0456982950
961837177
00021
100
.75
.86
.81
.23
.22
.28
.08
.05
.00
DVOL
000012357
101818181818181818181818
Ccc).00.24.52.91.50.36.58.31.73.90.35.38.43.42.46.48.50.51.52.51.54
ALPHA.- 0.97Ao Csq. mm): 1837.87
Lo CmnO : 96.75
3KSHEAR PHASE*
CELL PRESSURE CkPa) : STRAIN RATE: .015 mm/min
440.00
116
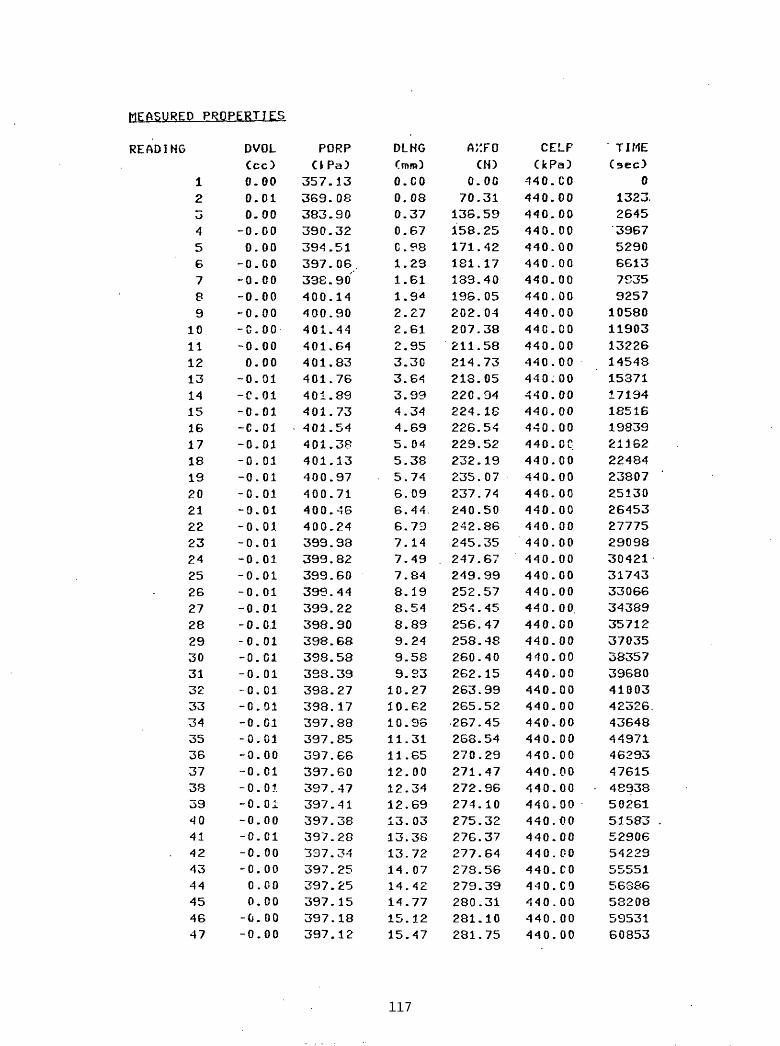
MEASURED PROPERTIES
READING
123A56789
1011121314151617181920212223242526272829303132333435363733394041424344454647
DVOLCcc)0.000.010.00-0.000.00
-0.00-0.00-0.00-0.00-C.OQ-0.000.00
-0.01-C.01-0.01-C.01-0.01-0.01-0.01-0.01-0.01-0.01-0.01-0.01-0.01-0.01-0.01- 0 . 0.1-0.01-0.01-0.01-0.01-0.01-0.01-0.01-0.00-0.01-0.01
-O.Oi-0.00-O.C1-0.00-0.000.000.00
-0.00-0.00
PORPOPa)
357.13369.08383.90390.32394.51397.06.398.90400.14400.90401.44401.64401.83401.76401.89401.73401.54401.38401.13400.97400.71400.46400.24399.93399.82399.60399.44399.22398.90398.68398.58328.39393.27398. 17397.88397 . 85397.66397.60397.47397 . 4 1397.38397.28337.34397.25397.25397.15397.18397.12
DLNGCmtiO0.000.080.370.67C.981.231.611.94
2.272.612.953.303.643.994.344.695.045.385.746.096.44.6.737.147.497.848.198.548.899.249.589.9310.2710.6210.9811.3111.6512.0012.3412.6913.0313.3813.7214.0714.4214.7715.1215.47
AXFOCN)
0.0070.31136.59158.25171.42181.17133.40196.05202.04207.38211.58214.73213.05220.34224.18226.54229.52232.19235.07237.74240.50242.86245.35247.67249.99252.57254.45256.47258.48260.40262.15263.39265.52267.45263.54270.29271.47272.96274.10275.32276.37277.64278.56279.39280.31231.10281.75
CELPCkPaD
440. CO440.00440.00440.00440.00440.00440.00440.00440.00440.00440.00440.00440:00440.00440.00440.00440. OG440.00440.00440.00440.00440. 00440. 00440.00440.00440.00440.00.440.00440.00440.00440.00440.00440.00440.00440.00440.00440.00440.00440.00440.00440.00440. 00440. CO440. CO440.00440.00440.00
TIME(sec>
01323.26453367529066137S35925710580119031322614548153711719418516198392116222484238072513026453277752909830421317433306634389357123703538357336804100342326.4364844971462934761548338502615158352906542235555156386532085953160853
117

*8
495051525354
. 5556575859GO
-0.00-0.00-0.01-0.01-0.01-0.01-0.01-0.01-0.01-0.01-0.01-O.C1-0.01
397.397.397.397.397.397.397.397.397.397.397.397.397.
1822222825413147383453.5053
15.16.16.16.17.17.17.IP.18.
. 19.19.19.20.
82185388235995306602377309
282282283284284284284285285286286286286
.41
.98
.33
.03
.07
.64
.64
.30
.34
.09
.04
.74
.61
440440440440
.00
.00
.00
.06440,00440440440440440440440440
.00
.00
.00
.00.
.00
.00
.CO
.00
S2176634996482166144674676873970112714347275774080754027672478047
DERIVED PROPERTIES ;TOTAL EFFECTIVE
STRESSREADING
1234.56789
10111213141516171819202122232425262728293031
STPAINA
0.0.0.0.0.0.0.0.0.0.0.0.0.0.0.0.0.0.0.0.0.0.0.0.0.0.0.0.0.0.0.
00000008003800690101013301670201023502700305034103760412044S0484052105560593062906660702073807740811084708830919095509911026
SIG1CkPa)
440.00478.22514.04525.51532.33537.26541.33544.53547.35549.79551.61552.85554.18555.26556.51557.29558.38559.30560.32561.22562.15562.87563.64564.33565.00565.79566.23566.72567.21567.65568.00
SIG3 RATIO EFFSIG1 EFFSIG3CfcPa)
440.440.440.440.440.440.440.440.440.440.440.440.440.440.440.440.440.440.440.
. 440.440.440.440.440.440.440.440.440.440.440.440.
000000000000000000000000000000000000000000CO000000000000000000
1111111111111111111111111111111
.00
.09
.17
.19
.21
.22
.23
.24
.24
.25
.25
.26
.26
.26
.26
.27
.27
.27
.27
.28
.28
.28
.28
.28
.28
.29
.29
.29
.29
.29
.29
STRESS. RATIO
CkPa) CkPa382.
109.130.135.137.140.142.144.146.148.149.151.152.153.154.155.157.158.159.160.161.162.163.164.165.166.167.167.168.169.169.
871414198121433945359703 .42377875001835516963665040350182.530761
82.8770.9256.1049.6845.4942.9441.1039.8639.1038.5638.3738.1838.2438.1138.2738.4638.6238.8739.0339.2939.5439.7640.0240.1840.4040.5640.7841.10<1.3241.4241.61
1.001.542.322.723.033.263.473.623.753.853.913.963.994.024.044.054.074.074.084.094.094.094.094.094.094.104.104.084.084.084.08
118

3233 .343536373839404142.434445464748495051525354555657585960
0.0.0.0.0.0.0.0.0.0.0.0.0.0.0.0.0.0.0.0.0.0.0.0.0.0.0.0.0.
10621097113311691204124012761311134713831418145514901527156315991635167217081745178118191855189219291966200320392076
-558.39568.62569.03569.04569.36569.39569.57569.58569.63569.59569.65569.52569.36569.24569.04568.79568.54568.23567.83567.58567.035 66-. 71566.15565.87565.31565.065S4.47564.20563.57
440.440.440.440.440.440.440.440.440.440.'440.440.440.440.440.440.440.440.440.440.440.440.440.440.440.440.440.440.440.
0000 .000000 *
00000000000000000000000000 .0000000000000000000000
1.291.291.291.291.291.291.291.291.291.291.291.291.291.291.291.291.291.291.291.291.291.291.291.291.281.281.281.281.28
170.170.171.171.171.171.172.172.172.172.172.172.172.172.171.171.171.171.170.170.169.169.168.168.167.167.166.166.166.
12451519698010172631302711oe866735016130783084409472947003
4141424242424242424242424242424242424242424242424242424242
.74
.83
.12
.15
.34
.40
.53
.59
.63
.72
.66
.75
.75
.85
.82
.88
.82
.78
.78
.72
.75
.59
.69
.53
.63
.66
.47
.50
.47
4.084.074.064.064.064.054.054.044.044.034.044.034.034.024.014.004.004.003.993.993.973.973.963.963.943.933.933.923.91
DERIVED PROPERTIES Ccont.)
NG
123456789
10111213141516
A
0.310.310.410.560.620.520.450.390.270.220.110.15
-0.050.12
-0.13-0.24
qCkPa)0.00
19.1137.0242.7646.1648.6350.6752.2753.6754.9055.8056.4357.0957.6358.2658.65
P'
CkPa382.8790.0393.12.92.4491.6591.5791.7792.1392.7793.4594.1794.6095.3395.7496.5397.11
q/p'
0.000.210.400.460.500.530.550.570.530.590.590.800.60C.600.600.60
DEVIATOPSTRESSCkPa)0.00
38.2274.0435.5192.3397.26101.33104.53107.35109.79111.61112.85114.18115.26116.51117.29
MEANEFFECTIVESTRESSCkPa>
82.8783.6680.7878.1976.2675.3674.8874.7074.8875.1575.5775.7976.3076.53 .77.1177. 58
119

350
325
300
275
250
225
200
EFFECTIVE SIGMA I
x EFFECTIVE SIGMA 3
* DEVIATOR STRESS
* SHEAR STRESS
MEAN EFFECTIVE STRESS
o EXCESS PORE PRESSURE
OOOOOOOOO.OOQ.00 o O-O 0 O O 0 O
X X X X X X X X X X X X X X )( X X X X X X X'X 3
AXIAL STRAIN
GO-15, PC-43; 300/440 120

TRIAXIAL TEST RESULTS
GENERAL TEST INFORMATION
SAMPLE INFORMATIONSAMPLE ID:
INTERVAL (meters):GENERAL LOCATION:
DESCRIPTION:DATE FINISHED:
INDEX PROPERTIES
GD-15, PC-43? 300/5808.89-9.01BALTIMORE-HUDSON CANYON AREAOLIVE-GRAY CLAY3/17/80
MOISTURE CONTENT: 0.28BULK DENSITY Cg/cc): 1.99
VOID RATIO: 0.74POROSITY: 0.43
GRAIN SPEC GRAVITY Cg/cc): 2.71
SAMPLE PARAMETERSHEIGHT CmnO: 100.00
DIAMETER Cmm): 50.00AREA Csq. mm): 1963.50
VOLUME CccD: 196.35WEIGHT Cgm} : 382.00
TEST RESULTS
^SATURATION PHASE*
READING CELL PRESSURE DELTA C PORE PRESSURE DELTA PkPa50.00100.00200. 00300.00580. 00
JcPa
50.00100.00100.00280.00
kPa42.0091.CO189.00287.00567.00
49.00 0.9898.00 0.9898.00 0.98
280.00 1.00
SCONSOLIDATIGN PHASE*
CELL PRESSURE CkPa): 580.00BACK PRESSURE CkPa): 300.00
CONSOLIDATION PRESSURE CkPa): 280.00ASSUMED EFFECTIVE
OVERBURDEN PRESSURE CkPa): 84.92
121

CHANGES IN PROPERTIES DUE TO CONSOLIDATION
PROPERTYHEIGHT
AREA CsqVOLUME
WATER COPDR
VOIDBULK DENSITY Cg/cc)
BOUYANT BULK DENSITY (3/00)r
MEASURED PROPERTIES
READING
123 4
56789
1011121314151617 IS192021
TIMECsec)
16
132351891552865441053
52988570866008S6309166094690967209875101781038110684108
INITIAL VALUE(n»m) imm) *(cc) jiTENTsSITYjATIO:/cc):
/cc) :TIONr
Log TIME
0.000.781.111.361.711.952.192.462.743.024.7?4.764.784.804.8£4.844.864.884.894.914.92
100.001963.50196.35
0.280.430.741.990.97
100.00
Sqrt TIME
1.002.453.614.807.149.4312.4516.9123.3232.54
230.19238.93245.13251.13257.09262.86268.51274.05279.47284.79290.01
COHSOLIDATED VALUE96.97
1846.37179.05
0.220.210.272.091.06
. 100.00
DVOL Ccc)
0.00 0.18 0.39 0.68 1.24 1.882.784.206.409.5118.7218.5518.3518.1618.0217.8617.7317.5817.4417.3517.30
ALPHA: 0.97Ao Csq. mm): 1846.37
Lo Cmm): 96.97
*SHEAR PHflSE*
CELL PRESSURE CJcPa): STRAIN RATE: .015 rom/min
580.00
122

MEASURED PROPERTIES
READING
123456789
101JL12131415IS17181920212223242526272829303132333435363738394041424344454647
DVOLCcc>0.000.00
-0.010.010.010.010.050.040.070.080.100.110.130.130.150.140.150.150.180.170.180.1S0.190.160.160.160.130.180.170.190.190.200.200.180.210.220.210.190.200.220.250.240.160.200.180.130. 13
PORPCkPa)
307.66310.33310.88311.41311.54311.21311.24 ' '
310.92310.62310.59310.14310. 073C9.71309.48309.42308.73308.57308.15307.95307.66307.20306.94306.65305.83305.41304.89304.63304.47303.75303.91303.29303.13302.97302.48302.31302.15301.63301.43301.43301.14301.21300.91300.26300.00299.90299.58299.68
DLNG(mm)0.003.363.724.104.474.855.235.616.006.396.777.157.547.928.318.689.069.459.8310.2110.5910.9611.3511.7312.1112.4912.8713.2513.6314.0014.3814.7615.1415.5115.8916.2716.6517.0217.4017.7818.1718.5518.9419.3219.7020.0720.46
AXFOCN)
0.0014.1120.4226.0031.1235.1537.3240.2743.6446.6649.1851.3554.1056.8159.8062.7165.2667.8670.5373.1375.6178.0580.2682.4384.3486.5888.4490.1191.6693.1394.4195.6996.8597.9398.8399.79100.69101.46102.62103.48104.21104.95105.30105.69105.88106.19106.38
CELPUPa)
580.00580.00580.00580.00580.00580. 00530.00580.00580.00580. 00580.00580.00580.00580.00580.00580. 00580.00580.00580.00580.00580.00580.00580.00580.00580.00580.00580.00580.00580.00580.00580.00580.00580.00580.00580.00580.00580.00580.00580.00580.00580.00580.00580.00580.00580.00580.00580.00
TIMECsec3
1144428864328577172138656100981154112996144391583217324187672020921651230932453625979274212886430307317493319134634360773751938962404054184843290
. 447324617547618490605050351946.53388548385627357715591586060162043634866492866371
123

43 0.0' 299. 49 0.05 299. 50 0.01 299. 51 -0.04 299. 52 -0.09 299. 53 -0.15 298. 54 -0.19 298.
DERIVED PROPERTIES
READING STRAINA SIG1
123456789
10111213141516171819202122232425262728293031323334353637
. 0.0.0.0.0.0.0.0.0.
. 0.0.0.0.0.C.0.0.0.0.0.0.0.0.0.0.0.0.0.0.0.0.0.0.0.0.0.0.
0000034703340423046105000540057906190659069807380777081608570895093409741014105310921131117012101249128813281367140514441483152215611600163916781717
CkPa)530.00587.38590.64593.49596.08593.09599.12600.55602.17603.61604.78605.76607.02608.26609.61610.92612.04613.17614.33615.44616.48617.49618.38619.24620.12620.85621.54622.13,622.67623.16623.55623.94624.27624.56624.75624.98625.17
54 20.33 106.61 530.00 67314 32 21.21 106.73 580.00 69256 35 21.60 106.73 .580. .00 70699 25 21.98 107.04 580.00 72142 35 22.35 107.27 580.00 73584 83 22,74 107.24 580.00 75026 96 23.11 107.31 580.00 764S9
TOTAL EFFECTIVE STRESS STRESS
SIG3 RATIO EFFSIG1 EFFSIG3 RATIOCkPa) C*Pa)
580.580.580.580.580.580.580.580.580.580.580.580.530.580.580.580.580.580.580.580.580.580.580.580.580.580.580.580.580.580.580.580.580.580.530.580.580.
0000ao00000000000000000000000000000000000000000000000000000000000000000000
1.001.011.021.021.031.031.031.041.041.041.041.041.051.051.051.051.061.061.061.061.061.061.071.071.071.071.071.071.071.071.081.081.081.081. 081.081.08
272277279232284286287289291293
. 294295297298300302303305306307309310311313314315316317318319320320321322322322323
.34
.05
.75
.08
.54
.88
.88
.63
.55
.02
.64
.69
.31
.78
.19
.19
.47
.03
.38
.78
.28
.55
.73
.41
.71
.93
.91
.67
.92
.24
.26
.81
.30
.08
.44
.33
.54
CkPa)272.269.269.263.268.268.263.269.269.269.269.269.270.270.270.271.271.271.272.272.272.273.273.274.274.275.275.275.276.276.276.276.277.277.277.277.278.
346712604679760838418793295258274335053480063517r-9113754250971870352698537
1.001.03'1.041.051.061.071.071.081.081.091.091.101.101.101.111.111.121.121.131.131.131.141.141.141.151..151.151.151.151.161.161.161.161.161.161.161.16
124

3339404142434445464748495051525354
0.17560.1794.0.13340.18730.19130.19530.19920.20310.20700.21100.21480.21880.22270.22660.23050.23450 . 2383
DERIVED PROPERTIES
READING
123456789
10111213141516171819202122232425262728
A
0.360.360.170.180.05
-0.160,03-0.23-0.18-0.02-0.39-0.07-0.28-0.18-0.05-0.52-0.15-0.37-0.17-0.26-0.440.000.000.000.000,000.000.00
625.30625.61625.77625.87625.97625.89625.84625.70625.61625.46625.34625.16624.93624 . 83624.71624.46624.27
Ccont .
qCkPaD0.003.695.326.748.049.049.5610.2711.0911.8012.3912.8813.5114.1314.8115.4616.0216.5917.1617.7218.2418.7519.1919.6220.0620.4220.7721.07
530.00580.00530.00580.00580.00580.00580.00580.00580.00580.00580.00580.00580.00580.00580.00580.00580.00
>
P'
CkPa)272.34273.36274.43275.34276.50277.83278.32279.36280.46281.21282.25282.81283.80284.65285.39236.73237.45288.44289.21290.06291.04291.81292.54293.79294 . 65295.54296.14296.60
. 1.081.031.081.081.081.081.081.081.081.081.081.081.081.081.081.081. 08
q/p'
0.000.010.020.020.030.030.030.040.040.040.040.050.050.050.050.05o.oeo.oe0.06c.oe0.06o.oe0.070. 070.070.070.070.07
323.87324.17324.62324.66325,05325.63.325.84325.7932G.03325.79325.79325.84325.58325.58325.36325 . 63325.31
DEVIATORSTRESSCkPa)0.007.38
10.6413.4916.0818.0319.1220.5522.1723.6124.7825.7627.0228.2629.6130.9232.0433.1734.3335.4436.48 .37.4338.3839.2440.1240.8541.5442.13
278.57 1.278.57 1.278.86 1.278.79 1.279.09 .1.279.74. 1.280.00 1.280.10 1.280.42 1.280.33 1.280.46 1.280.68 1.280.65 1.260.75 1.280.65 1.281.17 1.281.04 1.
MEAHEFFECTIVE-STRESSCkPa)
272.34272.13272.66273.09273.82.274.32275.13275.93276.77277.28278,12278.52279.30279.94280.45281.57282.11282.91283.43284.15284 . 96285.56286.15237.25237 . 93288.73289.22289.58
1616161616161616161616161£16161616
125

293031323334353G373339404142434445464748495051525354
0.0.0.0.0.0.0.0.0.0.0.0.0.Q.0.0.0.0.0.0.0.0.0.0.0.0.
0000000000000000000000000000000000000000000000000000
21.21.21.21.22.22.22.22.22.22.22.22.22.22.22.22.22.22.22.22.22.22.22.22.22.22.
3358779713283849596530889398959285807367584742352313
297.297.293.298:299.299.300.300.300.301.301.301.301.302.302.302.302.303.303.303.303.303.303.303.303.303.
5867438417800634962237747307699294230612261217004018
0.0.o:0.0.0.0.0.0.0.0.0.0.0.0.0.0.0.0.0.0.0.0.0.0.0.
0707070707070707080808080803080308080807C70707070707
42.43.43.
671655
43.94.44.44.
. 44.44.45.45.45.4545.45.45.45.45.45.45.45.45.44.44.44.44.44.
27567598173061778797898470614634169383714627
290.47290.47291.22291.52291.79292.37292.60292.84293.43293.67293.77294.11294.08294.41295.04295.28295 . 33295.63295.48295.57295.74295.63295.69295.55295.99295.80
126

ED-15, PC-43: 380/378, 448, 588127

300,
275..
250..
225.,
200..
a a_
175..CO
J2ct: en ac 150..
125..
100..
75..
50..
25
MEAN EFFECTIVE STRESS (kPa)
GO-15, PC-43: 300/370, 440, 580128

TRIAXIAL TEST RESULTS
GENERAL TEST INFORMATION
SAMPLE INFORMATIONSAMPLE ID:
INTERVAL Cmeters}*GENERAL LOCATION:
DESCRIPTION:DATE FINISHED:
GD-23, PC-44j 300/3304.00-4.12BALTIMORE-HUDSON CANYON AREAOLIVE-GRAY CLAY2/8/80
INDEX PROPERTIESMOISTURE CONTENT: 0.43
BULK DENSITY Cg/cc): 1.31VOID RATIO: 1.14
POROSITY: 0.53GRAIN SPEC GRAVITY Cg/cc): .2.71
SAMPLE PARAMETERSHEIGHT .CmmD : 100.00
DIAMETER Cmm): 50.00AREA Csq. mm): 1963.50
VOLUME Ccc): 196.35
WEIGHT CgnO : 360.20
TEST RESULTS
^SATURATION PHASE*
READING CELL PRESSURE DELTA C PORE PRESSURE DELTA PkPa50.00100.00200. 00250. 00300.00
kPa
50.00100.0050.0050.00
kPa44.9294.22192.14241.18283.19
kPa
49.30
97.92 4S.04 48.01
0.99 0.38 C.98 0.96
XCCNSOLIDATIOH PHASE*
CELL PRESSURE CkFaD: 330.00BACK PRESSURE CkPaD: 300.00
CONSOLIDATION PRESSURE CkPaD: 30.00ASSUMED EFFECTIVE
OVERBURDEN PRESSURE CkPa): 31.37
129

CHANGES IN PROPERTIES DUE TO CONSOLIDATION
PROPERTY INITIAL VALUEHEIGHT Cmm>i 100.00
AREA Csq. mm) » 1963.50VOLUME Ccc)s 196.35
WATER CONTENT: 0.43POROSITY: 0.53
VOID RATIO S 1.14BULK DENSITY Cg/cc): 1.81
BOUYANT BULK DENSITY Cg/cc?: 0.79X SATURATION: 100.00
CONSOLIDATED VALUE97.62
1871.17182.67
0.370.39C.S31.870.85
100.00
MEASURED PROPERTIES
)IMG
123456789
1011121314
15. 16171819202122232425262728293031323334
TIME(sec)
1619296499
165295553106720943896569975029304
11106129081471116513183162011821921237232552527328291303093232735345373633338142399444174743549
Los TIME
0.000.781.231.461.812.002.222.472.743.033.323.593.763.883.974.054.114.174.224.264.304.344.384.414.444.464.494.524.544.564.584.604.624.64
Sqrt TIME
1.002.454.365.398.009.9512.8517.1823.5232.6645.7662.4275.4986.6196.46105.39113.61121.29128.50135.34141.84148. OS154.02159.77165.31170.68175.87180.93135.84190.63195.30199.86204.32208.68
DVOLCcc)
0.0013.2113.2013.2213.2613.1613.1713.1813.1513.2314.6814.7313.7614.0014.0314.2213.4213.9413.3313.2913.5013.6013.6414.8513.4213.42 .13.8113.6213.4713.3313.6013.5513.0613 07
130

353637383940414243444546474849505152
453524715548957507605256354366531685797159773615766337965181669846878670588723907413275995
4.664.67 4.694.714.724.744.754.764.78
,.-4 . 794.804.814.834.844.854.864.874.88
212.96217.15221.26225.30229.27233.17237.00240.77244.49248.15251.75255.31258.81262.27265.68269.05272.38275.67
13.1013.0713.0813.0913.1113.1113.1213.1313.1513.1813.2113.2513.2313.2913.3213.4713.6313.68
ALPHA: 0.98Ao Csq. mm): 1871.18
Lo (irm>: 97.62
XSHEAR PHASE*
CELL PRESSURE CkPa): STRAIN RATE: .015 mm/min
330.00
MEASURED -PROPERTIES
READING
123456789
101112131415
DVOLCcc)0.00
-1.22-1.12-1.45-1.43-1.39-1.37-1.37-1.35-1.34-1.34-1.33-1.31-1.31-1.27
PORPCkPa)
296.47301.24305.32307.40308.69309.25309.54309.67309.70309.96310.15310.22310.22310.28310.41
DLNGGnm)0.000.15.0.390.670.961.271.591.922.262.622.983.353.744.124.51
AXFOCM)
0.0027.2642.2443.3453.8056.4158.6458.3760.2161.4462.9864.0165.6667.4768.93
CELPCkFa)
330.00 .330.00330.00330.00330.00330.00330.00330.00330.00330.00330.00330.00330.00330.00330.00
TIMECbec)
01503300645086011751330161051912022135241502716529180311953321035
131

161718192021222324252627282330313233343536373833404142434445464748
. 49. 505152
0.-1._ 4
_ A
-1.
_ 4
-0."~ 1 .
-1._ 4
-1.
'I.
-1.
-1.
-1.
-1.
-1.
-1.
-1.
-1.
-1.
-1.
-1.
~ 1-.
-1.
-1.
-1.
-1.
-1.
-1.
-1.
-1.
-1.
-1.
-1.
-1.
-1.
17605866532689241711025665656571717171717071757469S86967666665676667
310.310.310.310.310.310.309.309.309.309.309.309.309.309.309.308.308.308.308.308.308.308.308.308.308.308.308.308.303.308. 308.308.308.307.
73 308.6766
307.307.
255422121902868976733434211531929973829263G9635656443453376979470159148872
4.5.5.6.6.6.7.7.8.8.8.9.9.
10.10.10.11.11.12.12.12.13.13.13.14.14.15.15.15.16.16.17.17.17.18.18.19.
89296803488823680849882863C8438727660544822160993877155393317010493927
707173747677
.50
.92
.54
.38
.26
.5778.8780818283848586878788899091919232939393949494959798999999
67 10006 100
.18
.10
.18
.14
.17
.21
.17
.13
.94
.82
.66
.32
.09
.74
.43
.85
.20
.50
.89
.27
.62
.77
.73
.58
.80
.15
.23
.53
.22
.49
330330330330330330330330330330330330 330
330330330330330330330330330330330330330330330330330330330330330330330330
.00
.00
.CO
.00
.00
.00
.00
.CO
.00
.00
.00
.00
.00
.00
.00
.00
.00
.00
.00
.00
.00
.00
.00
.00
.00
.00
.00
.00
.00
.00
.00
.00
.00
.00
.00
.00
.00
2253724040255422704428546300493155133053345563605837560390634056542C684357045073465754807849581510835258654089555915709358596 .6003861601631046460666117676196912170624 .7212773629.7513276635
DERIVED PROPERTIES
READING
1234567
STPAIHA
0.00000.00150.00400. 00690.00990.01300.0163
SIG1(kPa)
330.00344.55352.48356.19358.47359.75360.83
SIG3Ck
330.330.330.330.33C.330.330.
Pa)00CO0030000000
TOTALSTRESSRATIO
1.001.041.071.081.091.091.09
EFFECTIVE
EFFSIG1 EFFSIG3CkPo33.43.47.48.49.50.51.
STRESSRATIO
} CkPa)53311673775129
33.5328.7624.6822.6021.3120.7620.46
1.001.511.912.162.342.432.51
132

e9
1011121314151617181920212223 .2425262728293031323334353637383940414243444546474849505152
0.0.0.0.0.0.0.C.0.0.0.0.0.0.0.0.0.0.0.0.0.0.0.0.0.0.0.0.0.0.0.0.0.0.0.0.0.0.0.0.0.0.0.0.0.
01970232026803050343038304220462050105420582062206630705074607870828086909100951D992103310731114115411941234127413141354139314331473153315521591163216701710175217921832187119121953
360.58361.43361.96362.63363.04363.75364.54365. 14365.79366.36367.01367 . 53368.05368.53369.01369.48369.75370.10370.39370.71371.02371.29371.57371.76371.99372.20372.31372.48372.59372.71372.71372.67372.61372.59372.56372.52372.38372.61373.23373.55373.49373.31373.24373.32373.22
330.330.330.330.330,330.330.330.330.330.330.330.330.330.330.330..330.33C.330.330.330.330.330.330.330.330.330..330.330.33 0-.330.330.330.330.330.330.33C.330.330.330.330.330.330.330.330.
00000000000000000000000000 .0000.0000000000000000000000000000 .000000000000000000000000 _00CO.0000
1.091.101,101.101.101.101.101.111.111.111.111.111.121.121.121.121.121.121.121.121.121.13.1.131.131.131.131.131.131.131.131.131.131.131.131.131.131.131.131.131.131.131.131.131.131.13
505152525253545455
. 555657575859595960616161626262636363636364646464646463646364656565656565
.91
.73
.00
.48
.32
.53
.25
.72
.54
.81
.80
.41
.87
.51
.15
.58
.99
.37
.04
.36
.81
.15
.26
.84
.00
.47
.49
.56
.89
.02
.08
.11
.05
.15
.23
.99
.01
.92
.44
.09
.48
.72
.10
.44
.50
20.20.20.19.19.19.19.19.19.19.19.19.19.19.20.20.20.20.20.20.20.20.20.21.21.21.21.21.21.21.21.21.21.21.21.21.21.21.21.21.21.22.21.22.22.
333004857878725975467888829814112427666679856908012718083131374444576647633121539941861228
2.502.55
. 2.592.642.67.2.712.752.792.812.872.872.892.922.932.942.962.962.982.96
. 2.972.972.983.012.933.002.983.003.023.003.003.002.992.992.972.962.982.963.003.043.022.982.932.. 982.962.94
133
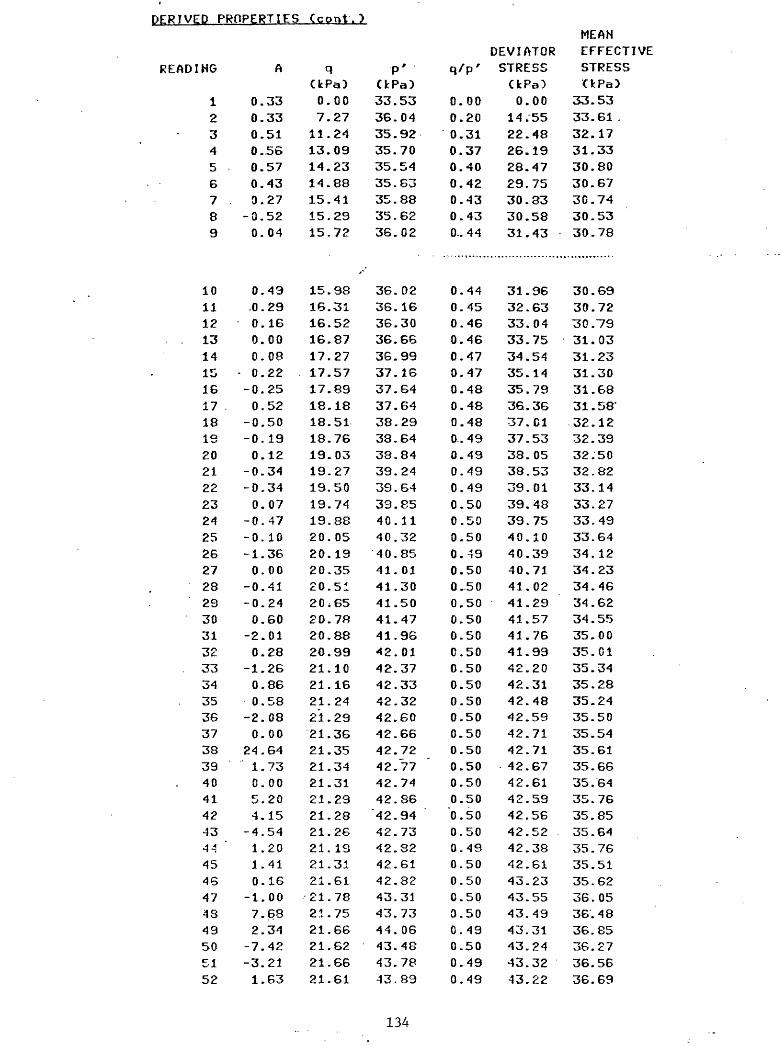
DERIVED PROPERTIES Ccont. >
HG
123456789
101112131415161718192021222324252627282330313233343536373839404142 43
444546473849505152
A
0.330.330.510.560.570.430.27
-0.520.04
0.43.0.290.160.000.08
- 0.22-0.250.52
-0.50-0.190.12
-0.34-D.340.07
-0.47-0.10-1.360.00
-0.41-0.240.60
-2.010.28
-1.260.860.58
-2.080.00
24.641.730.005.204.15
-4.541.201.410.16
-1.007.682.34
-7.42-3.211.63
qCkPa)0.007.27
11.2413.0914.2314.8815.4115.2915.72
15.9816.3116.5216.8717.2717.5717.8918.1818.5118.7619.0319.2719.5019.7419.8820.0520.1920.3520.5120,6520.7820.8820.9921.1021.1621.2421 . 2921.3621.3521.3421.3121.2921.2821.2621. 1921.3121.6121.7821.7521.6621.6221.6621.61
P'
CkPa)33.5336.0435.9235.7035.5435.6335.8835.6236.02
36.0236.1636.3036.6636.9937.1637.6437.6438.2933.6438.8439.2439.6433.8540.1140.3240.8541.0141.3041.5041.4741.9642.0142.3742.3342.3242.6042.6642.7242.7742.7442.86
"42.9442.7342.8242.6142.8243.3143.7344.0643.4843.7843.83
q/p'
0.000.200.310.370.400.420.430.430.. 44
0.440.450.460.460.470.470.480.480.480.. 490.490.490.490.500.500.500.490.500..500,500.500.50C.500.500.500.500.500.500.500.500.500.50"0.500.500.490.500.500.500.500.490.500.490.49
DEVIATORSTRESS
CkPa)0.00
14.5522.4826.1928.4729.7530.8330.5831.43
31.9632.6333.0433.7534.5435.1435.7936.3637. Cl37.5338.0538.5339.0139.4839.7540.1040.3940.7141.0241.2941.5741.7641.9942.2042.3142.4842.5942.7142.7142.6742.6142.5942.5642.5242.3842.6143.2343.5543.4943.3143.2443.3243.22
MEANEFFECTIVESTRESS<* Pa)
33.5333.61 .32.1731.3330.8030.6730.7430.5330.78
30.6930.7230.7931*0331.2331.3031.6831.58'32.1232.3332.5032.8233.1433.2733.4933.6434.1234.2334.4634.6234.5535.0035.0135.3435.2835.2435.5035.5435.6135.6635.6435.7635.8535 . 6435.7635.5135.6236.0536.4836.8536.2736.5636.69
134

t-o£3
358^
325
300
275
258
225
200i
1751
150
125
1801
EFFECTIVE SIGHA 1
x EFFECTIVE SIGMA 3
DEVIATOR STRESS
SHEAR STRESS
MEAN EFFECTIVE STRESS
EXCESS PORE PRESSURE
i i i i i » * i i i i i
AXIAL STRAIN
GD-23, PC-44: 388/338 135

TRIAXIAL TEST RESULTS
GENERAL TEST INFORMATION
SAMPLE INFORMATIONSAMPLE ID: GD-23, PC-44; 300/360
4.12-4.24BALTIMORE-HUDSON CANYON AREA OLIVE-GRAY CLAY 2/8/80
INTERVAL Cmeters):GENERAL LOCATION:
DESCRIPTION:DATE FINISHED:
INDEX PROPERTIESMGI^URE CONTENT C.45
BULK DENSITY C9 /cc3 1.79VOID RATIO 1.19
POROSITY 0.54GRAIN SPEC GRAVITY Co/cc) 2.71
LIQUID LIMIT CX) 41.00PLASTIC LIMIT C%) 21.00
SAMPLE PARAMETERSHEIGHT Cmm)-. 100.00
DIAMETER Cmm): 50.00AREA Csq. mm)-. 1963.50
VOLUME Ccc): 196.35WEIGHT Cgm): 353.60
TEST RESULTS
^SATURATION PHASE*
READING CELL PRESSURE DELTA C PORE PRESSURE DELTA PkPa50.00100.00200.00250.00300.00
kPa
50.00100.0050.0050.00
kPa47.9897.41196.75246.66296.09
kPa
49.4399.3449.9149. 43
0.990.991.000.99
XCONSOLIDATIOM PHASE*
CELL "^ESSURE CkPa): 360.00BACK PRESSURE CkPa): 300.00
CONSOLIDATION PRESSURE CkPa): 60.00ASSUMED EFFECTIVE
OVERBURDEN PRESSURE CkPa): 31.52
136
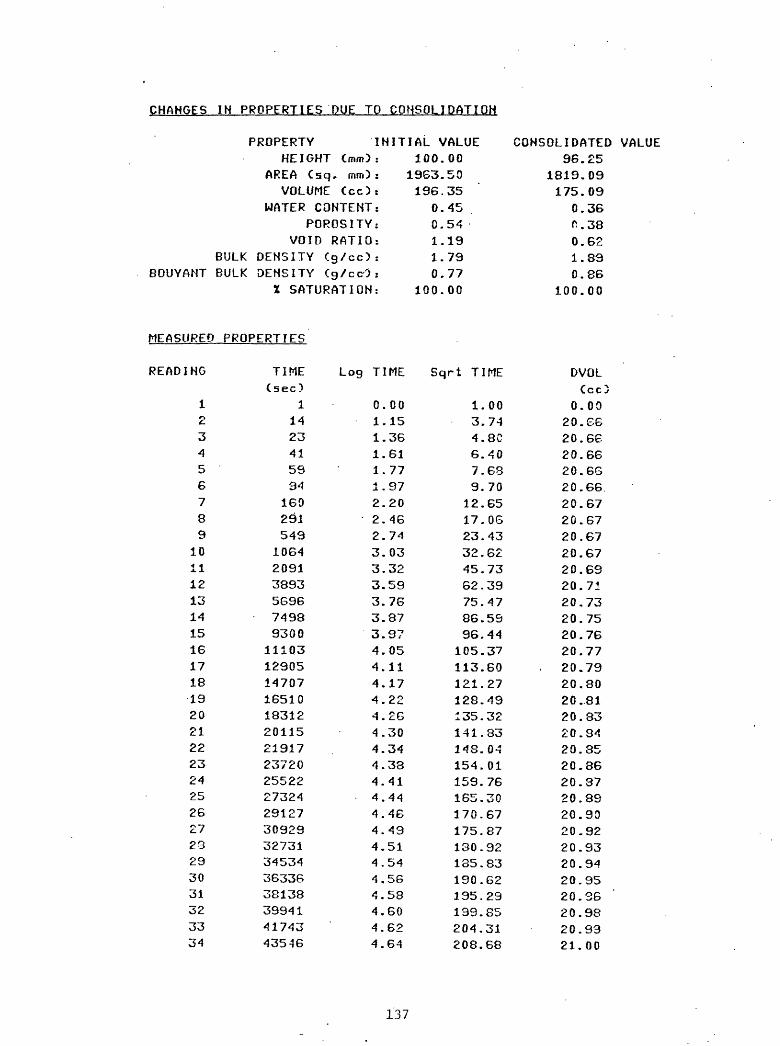
CHANGES IN PROPERTIES DUE TO CONSOLIDATION
PROPERTYHEIGHT
AREA Csq.VOLUME
WATER CON PORO
VOID RBULK DENSITY Cg
BOUYANT BULK DENSITY CgX SATURA
MEASURED PROPERTIES
READING
3456789
101112131415161718192021222324252627232930313233
TIME(sec?
1142341599416029154910642091389356967498930011103129051470716510183122011521917237202552227324291273092932731345343633638138399414174343546
INITIAL VALUECmm) :
, mm) :Ccc) :
JTENT:)SITY:
JATIO:
)/CC) :
)/CcO> :
nrioN:
Log TIME
0.001.151.361.611.771.972.202.462.743.033.323.593.763.873.974.054.114.174.224.264.304.344.334.414.444.464.494.514.544.564.584.604.624.64
100.001963.50196.35
0.450.541.191.790.77
100.00
Sqrt TIME
1.003.744.8G6.407.689.70
12.6517.0623.4332.6245.7362.3975.4786.5996.44
105.37113.60121.27128.49135.32141.83148.04154.01159.76165.30170.67175.87130.92135.83190.62195.29199.85204.31208.68
CONSOLIDATED VALUE96.25
1819.09175.09
0.36fi.380.621.390.86
100.00
DVOL Ccc}
0.00 20.66 20.66 20.66 20. 6G 20.66. 20.67 20.67 20.67 20.67 20.69 20.71 20.7320.7520.7620.7720.7920.3020.8120.8320.3420.3520.8620.3720.8920.9020.9220.9320.9420.9520.3620.9820.9921. 00
137

353637383940414243444546474849505152
4534847151489545075752560543&2561655796759770615736337665178669806878370585723877418975992
4.664.674.694.714.724.744.754.764.78 4.79
' "4 . 80
4.814.834.844.854.864.874.88
212.95217.14221.26
. 225.29229.26233.16£36.99240.76244.48248.14251.75255.30258.80262.27265.68269.05272.38275.67
21.0221.0321.0421.0621.0721.0821.0921.1021.12
. 21.1421.1521.1721.1321.2021.2221.2321.2421.26
ALPHA: 0.96Ao Csq. mm)i 1319.09
Lo ,Cmm) -. 96. 25
XSHEAR PHASE*
CELL PRESSURE CkPa): STRAIN RATE: .015 mm/min
360.00
MEASURED PROPERTIES
READING
123456789
101112131415
DVOLCcc)0.000.00C.010.010.010.010.020.020. 020.020.020.020.02O.C20. C2
PORPCkPa)
303.50319.94326.61330.43332.75334.15335.00335.89336. 68337.45337.83338.15338.50338.85339. 01
DLNGCmm)0.000.310.671.031.401.772.152.542.933.323.724.124.524.315.31
AXFOCM)
0. 0057.0970.7078.5383.3386.9886.6387.4688.7790.3031.8893.5095.2596.6598.09
CELPCkPa)
360.00360.00360.00360.00360.00360.00360.00360.00360 . C 0360.00360.00360.00360.00360.00360.00
TIMECsec)
01502300445076009751290151051812021135231502616528180301953221034
138

16171819202122232425262728293031323334353637383940414243444546474849505152
0.0.0.0.0.
. o.0.0,0.0.0.0.0.0.0.0.0.0.0.0.0.0.0.0.0.0.0.0.0.0.c.0.0.0.0.0.0.
02010101020101010202020202020202030302020203020202020201010204040303030302
339.339.339.339.339.339.339.339.-339.339.339.339.339.339.339.339.339.339.339.339.339..339.339.339.339.339.338.339.339.339.339.339.338.338.339.339.338.
2642426168616877716568 . , -
615861656842394545454233333020S801147193368860010472
5.6.6.6.7.7.8.8.8.9.9.
10.10.10.11.11.12.12.12.13.13.13.14.14.15.15.15.16.16.17.17.17.18.18.19.19.20.
71115190306909488827670645842362014079195897377717579837781757973879185900
99101102104105107108109
. Ill112113114115lie118119120121121123123124125125126126126127127128132133133133133134134
.80
.33
.90
.30
.75
.23
.55
.86
.21
.35
.75
.76
.93
.90
.17
.13
.23
.06
.89
.11
.86
.60
.13
.61
.05
.57
.79
.23
.40
.98
.00
.57
.70
.83
.92
.66
.66
36036036036036036036036036036036036036036036036036036036036036036036036036036036036036036036036036036036C360360
.00
.00
.00
.00
.00
.00
.00
.00
.00
.00
.00
.00
.00
.00
.00
.00
.00
.00
.00 .
.00
.00
.00
.00
.00
.00
.00
.00
.00
.00
.00
.00
.00
.00
.00
.00
.00
.00
225362403925541
. 270432854530047315503305234554 .36057375593906240564420664356945071465744807749579510825258554087555905709258595600976160063102646056610767609691127061572117736207512376625
.DERIVED PROPERTIESTOTAL EFFECTIVESTRESS
READING
1234567
STRAINA
0. 0000O.CC330.00700.01070.01460.01840.0224
SIG1CkPa)
360.00391.28398.59402.71405.41406.93406.56
SIG3 RATIO EFFSIG1 EFFSIG3CkPa)
360.360.360.360.360.360.360.
00000000000000
1.1.1.1.1.1.4 J. .
00091112131313
STRESSRATIO
CkPa) CkPa)56.71.71.72.72.72.71.
50359828667955
56.5040.0733.3923.5727.2525.8625. CO
1.001.782.162.442.672.822.86
139

89
10111213141516171819202122232425262728293031323334353637383940414243444546474849505152
0.0.0.0.0.0.0.0.0.0.0.0.0.0.0.0.0.0.0.0.0.0.0.0.0.0.0.0.0.0.0.0.0.0.0.0.0.0.0.0.0.0.0.0.0.
02640304034503860428046905100552059306350676071707590.799084008820923096410041045108611261166120812481289132913701411145214931535157616181660170117431784182518671910.1952199320352077
406.81407.31407.93408.56409.20.409.90410.42410.95411.61412.17412.74413.22413.72414.24414.66415. 07415.50415.81416.25416.49416.84417.03417.38417.58417.84417.97418.10418.41418.48418.55418.51418.45418.37418.32418.13418.04417.83418.25419.32419.72419.46419.21418.95418.96418.65
360.360.360.360.360.360.360.360.360.360.360.360.360.360,360.360.-360.360.360.360.360.360.360.360.360.360.360.360.360.360.360.360.360.360.360.360.360..360.360.360.360.350.360.360.360.
0000000000000000000000000000000000000000 .000000000000000000000000000000000000000000000000.00
1111111111111111111111111111111111111111
-11111
.13
.13
.13
.13
.14
.14
.14
.14
.14,14.15.15.15.15.15.15.15.16.16.16.16 ..16.16.16.16.16.16.16.16.16.16.16.16.16.16.16.16.16.16.17.17.16.16..16 ..16
70.9270.6670.4870.7271.0571.4071.5771.9472.3472.7473.3273.6174.0474.6274.9875.3075.7976.1776.5876.8877.2677.4177.7477.9078.4278.5878.6578.9579.0379.1379.1979.1379.0779.1279.1579.0378.6378.5579.3980.3680.5880.6179.9479.9273.93
24 .1123,3422222121212020202020202020202020202020202020202020202020202020202120202020202121202021
.55
.17
.85
.50
.15
.99
.74
.58
.58
.39
.32
.39
.32
.23
.29
.36 .
.32
.39
.42
.39
.36
.32
.58
.61
.55
.55
.55
.58
.67
.67
.71
.80
.02
.99
.86
.29
.07
.64
.12
.40
.99
.96
.28
2.943.033.133.193.25.3.323.383.433.493.543.563.613.643.663.693.723.733.743.773.773.783.803.823.833.813.813.833.843.853.853.833.833.823.803.773.773.773.873.963.893.823.773.813.813.76
140

DERIVED PROPERTIES Ccont.>
READING
10111213141516171819202122232425262728293031323334353637383940414243444546474849505152
A
0.530.530.910.930.86C.922.273.511.51
1.290.610.500.500.680.300.390.280.000.400.130.120.150.230.150.200,070.270.090.170.090.160.970.250.490.000.000.452.410.000.381.981.180.370.591.340.211.431.881.1.21.572.351.02
qCkPa>0.00
15.6419.30
. 21.35.22.7123.4723.2823.4023.66
23.9624.2824.60
24.9525.2125.4725.8026.0826.3726.6126.8627.1227.3327.5327.7527.9128.1328.2528.4228.5128,6928.7928.9228.9929.0529.2029.2429.2829.2629.2329.1829.1629.0729.0228.9129.1329.6629.8629.7329.6129.4729.4829.32
P'
(kPa)56.5055.7152.6950.9349.9649.3248.2747.5147.00
46.5146.4446.4546.4546.3646.4646.5446.6646.9547.0047.1847.5147.6547.7648.0448.2648.4548.6348.8448.9049.0549.1149.5049.6049.6049.7549.7949.8549.9349.9049.8949.9650,09"50.0149.7849.4249.7350.5050.8551.0150.4650.4450.60
q/p'
0.00
0.28
0.37
0.420.45
0.480.48
0.49
0.50
0.520.520.530.540.54
0.550.55
0.56
0.56
0.570.570.57
0.570.58
0.58
C.580.58
0 . 5S '
0.58
0.58
0.580.59
0.580.58
0.590.590.59
0.59
0.530.590.58
0.580.58
0.58
0.580.59
0.60
0.590.58
0.580.580.580.58
DEVIATOR
STRESSClcPa)0.00
31.2838.59
42.7145.41
46.93
46.56
46.81
47.31
47.9348.5649.2049.9050.42
50.95
51.6152.17
52.74
53.2253.7254.24
54.6655.07
55.50. 55.81
56.2556.49
56.84
57.03
57.3857.5857.84
57.9758.10
58.4158.48
58.5558.51
58.4558.37
58.3258.1358.04
57.8358.25
59.3259.7259.4659.21
58.9558.9658.65
MEANEFFECTIVESTRESSCkPa)
56.50
50.49
46.2543.8142.39
41.5040.51
39.71
39.11
38.5338.35
38.2538.1337.96
37.97
37.94
37.97
33.16
38.1338.2338.47
38.5438.58
38.79-38.96
39.0739.22
39.36
39.40
39.4839.52
39186
39.9339.91
40.0240.04
40.10
40.1840.1640.16
40.2440.40
40.34
40.1439.71
39.8440.5540.94
41.144C.6440.6140.83
141

350,
325
300..
275.
250.
225.
200.
175.
to
EFFECTIVE Sim 1
EFFECTIVE SIGMA 3
DEVIATOR STRESS
SHEAR STRESS
MEAN EFFECTIVE STRESS
EXCESS PORE PRESSURE
i i i i i i i i > + *-' ' ' ' ' '
i » » i i i >
GO-23, PC-44: 300/360
AXIAL STRAIN
142

TRI AXIAL TEST RESULTS
GENERAL TEST INFORMATION
SAMPLE INFORMATIONSAMPLE ID:
INTERVAL Cmeters)*GENERAL LOCATION:
DESCRIPTION:DATE FINISHED:
GD-23, PC-44j 300/4204.24-4.36BALTIMORE-HUDSON CANYON AREAOLIVE-GRAY CLAY2/8/SO
INDEX PROPERTIESMOISTURE CONTENT: 0.43
BULK DENSITY Cg/cc) : 1.81VOID RATIO: 1.14
POROSITY: 0.53GRAIN SPEC GRAVITY Cg/ccD: 2.71
SAMPLE PARAMETERSHEIGHT CnmOB 100.00
DIAMETER Cmm) -. 50.00
AREA Csq. mm): 1963.50VOLUME Ccc): 196.35WEIGHT Cgm): 353.00
TEST RESULTS
^SATURATION PHASE*
READING CELL PRESSURE DELTA C PORE PRESSURE DELTA PkPa50.00100.00200.00250.00300.00
kPa
50.00100.0050.0050.00
kPa47.9998.36196.2824G.43296.22
kPa
50.3797.9250.1849.76
1.010.981.001.00
^CONSOLIDATION PHASE*
CELL PRESSURE CkPa): 420.00BACK PRESSURE CkPa): 300.00
CONSOLIDATION PRESSURE CkPa): 120.00ASSUMED EFFECTIVE
OVERBURDEN PRESSURE CkPa): 33.23
143

CHANGES IN PROPERTIES DUE TO CONSOLIDATION
PROPERTY
VOLUME WATER CO
POR VOID
BULK DENSITY C9 /cc): BOUYANT BULK DENSITY Cg/cc)*
Z SAT
MEASURED PROPERTIES
READING
123456789
10111213141516171819202122232425262723293031323334
TIMECsec)
13
1929478214827953710512078388056837485928711090128921469416497182992010221904237072550927311291143091632718345213632338125399284173043533
INITIAL VALUECmm)mm)Ccc)ITENTISITY:ATIOl/cc)i/cc)IT I ON
Log
s
s
X
:
:t
TIME
0.0.1.1.1.1.2.2.2.3.3.3.3.3.3.4.4.4.4.4.4.4.4.4.4.4.4.4.4.4.4.4.4.4.
00902846679117457302325975879704111722263034374144464951545658606264
100.001963.50196.35
a. 430.531.141.810.79
100.00
Sqrt TIME
1.2.4.5.6.9.
12.16.23.32.45.62.75.86.96.
105.113.121.128.135.141.148.153.159.165.170.175.180.185.190.195.199.204.208.
00833639860617701742592939523731542244277800977226638388805926822865
CONSOLIDATED VALUE95.41
1787.51170.55
0.320.340.521.930.91
100.00
DVOL CccD
0.00 25.55 25.54 25.5425.5425.5525.5325.5425.5525.5525.5525.5725.5725.5725.5725.5725.5825.5825.5825.5925.5825.5825.5925.5925.5925.5925.6025.6025.6025.6025.6125.6125.62 2!T. 62
144
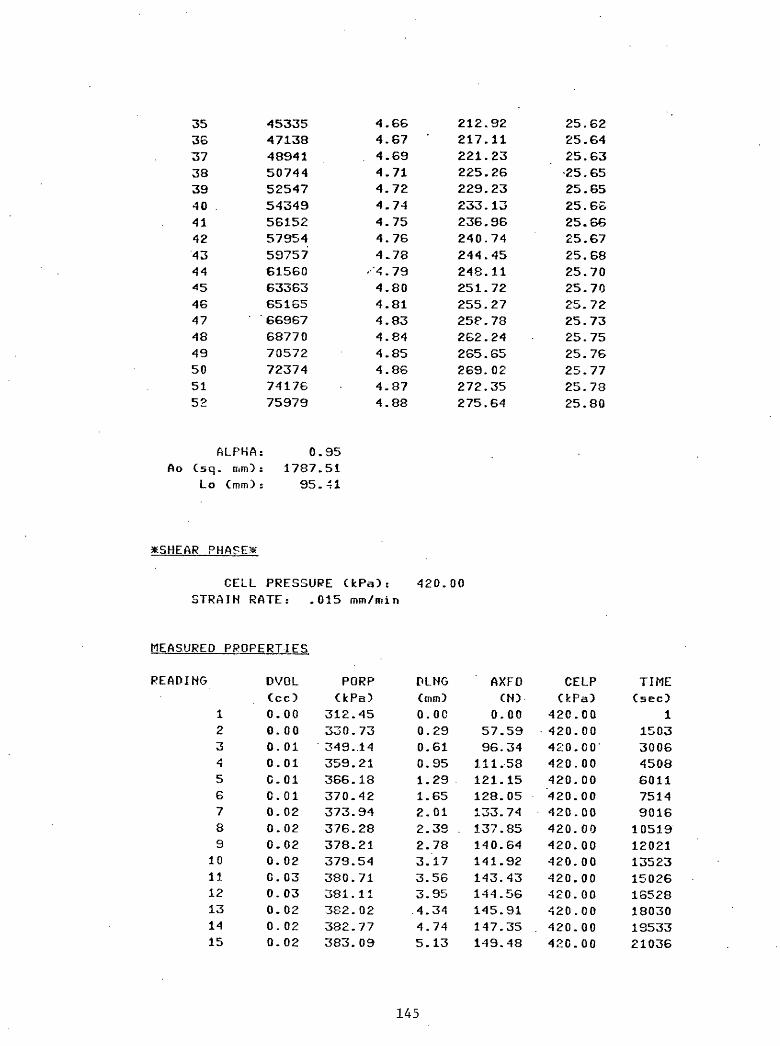
353637383940 .414243444546474849505152
453354713848941507445254754349561525795459757615606336365165669676877070572723747417675979
4.664.674.694.714.724.744.754.764.78
- 4.79
4.804.814.834.844.854.864.874.88
212.92217.11221.23225.26229.23233.13236.96240.74244.45248.11251.72255.2725P.78262.24265.65269.02272.35275.64
25.6225.6425.6325.6525.6525.6825.6625.6725.6825.7025.7025.7225.7325.7525.7625.7725.7825.80
ALPHA: 0.95Ao Csq. mnOs 1787.51
Lo CmnOs 95.41
*SHEAR PHASES
CELL PRESSURE CkPa):
STRAIN RATE: .015 mm/min420.00
MEASURED PROPERTIES
READING
123456789
101112131415
DVOLCcc)0.000.000.010.01C.010.010.020.020.020.020.030.030.020. 020.02
PORP(kPa)
312.45330.73349. .14359.21366.13370.42373.94376.28378.21379.54380.71381.11382.02382.77383.09
PLNG(mm)O.OC0.290.610.951.291.652.012.39 .2.783.173.563.954.344.745.13
AXFOCN)
0.0057.5996.34111.58121.15128.05133.74137.85140.64141.92143.43144.56145.91147.35149.48
CELPCkPa)
420.00420.00420.00420.00420.00420.00420.00420.00420.00420.00420.00420.00420.00420.00420.00
TIMECsec)
1150330064508601175149016105191202113523150261S528180301953321036
145

16171819202122232425262728293031323334353637383940414243444546
. 474849505152
0.0.0,0.0.
. 0.0.0.0.0.0.0.0.0.0.0.0.0.0.0.0.0.0.0.0.o.0.0.0.0.0.0.0.0.0.0.0.
03020303030204020403030404030304040403040404040404040402030505050404040505
383.383.383.384.384.381.384.384.384.384.384.384.384.384.384.384.384.384.384.331.384.384.384.383.384.383.3S3.383.384.384.384.383.383.383.383.383.383.
5287781740624062697&595353432330363010272020109704748187100746813916976571
5.5.6.6.7.7.7.8.8.9.9.9.
10.10.11.11.11.
5393337314539434741454943474135493
12.3312.13.13.13.14.14.15.15.15.16.16.17.17..17.18.18.19.19.19.
73125291317110509029680545862666054584
151152154155157159161162164165166168169170172173174175176177178179179180180181
.18
.85 .
.36
.95
.73
.36
.07
.69
.28
.56
.88
.16
.75
.79
.07
.35
.36
.56
.57
.50
.47
.09
.94
.52
.75
.30181.. 45181182183186188188
.92
.15
.70
.57
.04
.66188.39188189139
.97
.67
.74
420420420
.00
.CO
..00420.. 00420420420420420420420420420420420420420420420420420420420420420420420420420420420420420420420420420
.00
.00
.00
.00
.00
.00
.00
.00
.00
.00
.00
.00
.00;00
.00
.00
.00
.00
.00 .
.00
.00
.00
.00
.00
.00
.00
.00;00.00.00.00.00.00
2253824040255422704428547.3004931551330543455636058375613906340566420684357045073465764307849581510845258654089555915709458596600986160163104-646066610967611691147061672119736227512476627
DERIVED PROPERTIESTOTAL EFFECTIVESTRESS
READING
1234567
STRAIHA
0.00000,00300.00640.01000.01350.01720. 0211
SIG1CkPa)
420.00452.12 473.55481.80486.86490.40493.25
S IG3 RATIO EFFSIG1CkPa)
420420420420420420420
.00
.00
.00
.00
.00
.00
.00
1.1.1.1.1.1.1.
00081315161717
CkPa)107.55121.39124.42122.59120.68119.98119.31
EFFSIG3STRESSRATIO
CkPa)107.5589.2770.8660.7953.8249.5846.06
1.001.361.762.022.242.422.59
146

89
1011121314151617181920212223242526272829303132333435363738394041424344454647^849505152
0.0.0.0.0.0.0.0.0.0.0.0.0.0.0.0.0.0.0.0.0.0.0..0.0.0.0.0.0.0.0.0.0.0.0.0.0.0.0.0.0.0.0.c.0.
025002910332037304140455049605380580062206640706074807890832087409160958100010421083112511671209125112921334137514171458150015421583162f16661707174817871829187219141956199620382079
495. 19496.39496.497.497.497.498.499.499.500.500.501.501.502.502.503.503.503.504.504.504.504.505.505.505.505.505.505.505.505.505.505.505.504.504.504.504.504.505.505.505.504.504.504.504.
76255292341267196209641161064975022767800325345260647058574211946039084028503478614808
420.420.420.420.420.420.420.420.420.420.420.420.420;420.420.420.420.420.420.420.420.420.420.420.420.420.420.420.420.420.420.420.420.420.420.420.420.420.420.420.420.420.420.420. *20.
00000000CO00000000ob00DO00000000000000000000000000000000000000000000000000.000000000000oo 00
1.181.181.181;181.181.191.191.191.191.191.191.191.191.201.201.201.201.201.201.201.201.201.201.201.201.201.201.201.201.201.201.201.201.201.201.201.201.201.201.201".201.201.201.201.20
118.118.117.116.116.115.115.116.116.116.116.116.117.
91182254429057031632859225
117.49118.118.
2244
118.80118.119.119.120.120.120.120.120.121.121.121,121.121.121.121.121.121.120.120.119.120.120.121.121.121.120.120.120.
96437515378095982250385038464508 .207952983382699562648337
43.7241.8040.4639.2938.9037.9837.2336.9136.4836.1336.22.35.8335.6035.3835.6035.3835.3135.2135.4135.4735.4735.5735.7735.7035.6435 .'7035.9035.7435.8035.80 .35.9036.0335.9636.2636.1936; 1335.9035.9335.5436.1936.6136.8436. 0336.3536.29
2.722.832.902.972.993.053.103.143.183.223.233.263.293.323.323.353.363.383.373.333.393.383.383.393.393.403.383.403.393.393.383.373.373.343.343.34
- 3.343.353.403.363,333.303.353.323.32
147

DERIVED PROPERTIES Ccont.
- DEVIATORNG
123456789
.10111213141516171819202122232425262728293031323334353637383940414243444546474849505152
A
D.570.570.861.221.381.201.241.211.60
3.612.391.442.321.77G.420.770.69
-0.230.840.410.4S
-0.460.51
. 0.150.38
-0.71-0.260.00
-0.80-0.830.300.73
-0.36-2.394.30
-1.180.00
. 9.380.90
-0.211.74
-0.19-0.32-0.74-0.100.44
-2.952.580.41
-5.062.41
-0.16
qCkPa)0.00
16.0626.7830.9033.4335.2036.6237.6038.13
38.3838.6238.7638.9639.1739.5639.8440.1040.3140.5440.8241.0641.3141.5341.7441.8742.0142.1442.3442.4042.5242.6342.6742.7642.8042.8242.8542.7942.7842.7142.5642.4742.3042.2042.0442.2042.6442.7542.6742.3942.3142.2442.04
P'
CkPa)107.55105.3397.6491.6987.2584.7882.69'81.3179.99
78.8477.9177.6676.9476.4076.4776.3276.2276.5376.3876.4376.4376.9176.9177.0577.0977.4277.6177.8177.9778.2878.3378.3173.4678.7078.5678.6578.5978.6878.7478.5278.7378.4978.3277.9478.1378.1378.9479.2879.2378.3378.5978.33
q/p'
0.000.150.270.340.38.0.420.440.460.48
0.490.500.500.510.510.520.520.530.530.530.530.540.540.540.540.540.540.540.540.540.540.540.540.540.54'0.550.540.540.540.540.54
. 0.540.540.540.540.540.550.540.540.530.540.540.54
STRESSCkPa)0.00
32.1253.5561.8066.8670.4073.2575.1976.39
76.7677.2577.5277.9278.34
' 79.1279.6730.1980.6281.0981.64.82.1182.6183.0633.4933.7584.0284.2784.6784.8085.0385.2585 . 3485.5285.6085.6485.7085.5885.5785.4285.1184.9484.6084.3984.0884:4085.2885.50
. 85.3484.7884.6184.4384.08
MEANEFFECTIVESTRESSCkPa!>
107.5599.38.88.7181.3976.1073.0570.4863.7367.26
66.0565.0464.7463.9563.3563.2363.0462.8663.1062.8662.8262.7563.1463.0663.1463.1363.4263.5663.7063.8464.1164.12.64.0864.2164.4364.2864.3764.3364.4264.5064.3364.5764.3964.2663.9364.0663.9764.6965.0665.1064.2364.5164.31
148

350,
325
300..
275..
250
225
2001
EFFECTIVE SIGMA 1
EFFECTIVE SIGHA 3
DEVIATOR STRESS
SHEAR STRESS
MEAN EFFECTIVE STRESS
EXCESS PORE PRESSURE
I I I I I I I- I I + I *-*- *-'*-+-+-+
I II I |-| I >-i »-l I I » I »
AXIAL STRAIN
GO-23, PC-44: 300/420149

100.
75..
501
25..
4-4
1X7(53
GOrn
GD-23, PC-44: 380/330, 368, 420150

DEVI
ATOR
STRESS
(kPo)
no
unen C
O
9en
H
rvj
en H
rvj
enen
CJLJ
C
S)
CD
-o
c~»
to CSJ
5B..
JBB.
.
3J5
B..
CO
70 m
2BB.
.
25B.
.
3BB1

TRIAXIAL TEST RESULTS
GENERAL TEST INFORMATION
SAMPLE INFORMATIONSAMPLE ID.- GD-19, PC-45? 30C/350
6.42-6.54BALTIMORE-HUDSON CANYON AREA OLIVE-GRAY CLAY 2/5/80
INTERVAL (meters)-.GENERAL LOCATION:
DESCRIPTION:DATE FINISHED:
INDEX PROPERTIESMOISTURE CONTENT: 0.51
BULK DENSITY Cg/cc): 1.74VOID RATIO: 1.35
POROSITY: 0.57GRAIN SPEC GRAVITY Cg/ccD : 2.71
SAMPLE PARAMETERSHEIGHT (mm): 100.00
DIAMETER (mm) : 50.00AREA Csq. ram): 1963.50VOLUME Ccc): 196.35WEIGHT CgfiOs 340.00
TEST RESULTS
^SATURATION PHASE*
READING CELL PRESSURE DELTA C PORE PRESSURE DELTA PkPa50.00
100. 00200. 00250.00350.00
kPa
50.00100.0050.00100.00
f-Pa
46.1893.86
191.46241.41342.18
fcPa
47.6897.6049.95
100.77
0.95Q.981.001.01
^CONSOLIDATION PHASE*
CELL PRESSURE CkPa): 350.00BACK PRESSURE CkPa): 300.00
CONSOLIDATION PRESSURE CJcPa): 50.00ASSUMED EFFECTIVE
OVERBURDEN PRESSURE (IcPa).- 45.56
152

CHANGES IN PROPERTIES DUE TO CONSOLIDATIOH
PROPERTYHEIGHT
AREA CsqVOLUME
WATER COPOR
VOIDBULK DENSITY C9 /cc)r
BOUYANT BULK DENSITY Cg/cc)
MEASURED PROPERTIES
READING
123456789
101112131415 IS171819202122232425262728293031323334
TIMECsec)
16
1323571231903215791034212041717773113761497818581221832578529388329903G59340195437974740051002546055820761810654126901472616762197982183423
INITIAL VALUECram) tmm) :Ccc):
ITENT:iSITY:IATIO.-/ccj's
/Cc3 :
TION:
Log TIME
O.CO0.781.111.361.762.092.282.512.763.043.333.623.894.064.184.274.354.414.474.524.564.604.644.684.714.744.764.794.824.844.864.884.904.92
100.001963.50196.35
0.510.571.351.740.72
100.00
Sqrt TIME
1.002.453.614.807.55
11.0913.7817.9224.0633.0846.0464.5888.16106.66122.38136.31148.94160.58171.43181.63191.29200.49209. 28217.72225.84233 . 63241.26248.62255.76262.71269.47276.08282.53288.83
CONSOLIDATED VALUE96.42
1825.51176.02
0.420.450.'831.830.80
100.00
DVOL Ccc)
0.00 18.99 18.99 18.99 18.99 13.99 18.99 18.99 18.99 19.01 19.03 19.06 19.12 19.21 19.29 19.38 19.45 19.53
. 19.60 19.66 19.70 19.76 19.80 19.85 19.90 19.85 19.99 20.02 20.06 20.09 20.13 20.16 20.18 20.21
153

3536373839404142434445464748495051525354555657585960
870269062894231978341C143610503810364111224311584511944812305012665213025513385713745914106214466514-3268151870155473159075162678166280169882173484177086
4.944.964.974.995.015.025.045.055.06
,5 . 085.095.105.115.135.145.155.165.175.185.195.205.215.2£5.235.245.25
295.00301.04306.97312.78318.49324.10329.61335.03340.36345.61350.78355 . 88360.91365.86370.75375.58330.35385.06389.71394.30398.84403.33407.77412.17416.51420.82
20.2420.2520.2820.3020.3120.3320.3520.3520.3620.3720.3920.3920.4120.4020.3820.3720.3720.3620.3620.3620.342C.3420.332C.3320.3320.33
ALPHAs 0.96Ao Csq. mm) s 1825.51
Lo Cmm)s 96.42
X5HEAR PHASE*
CELL PRESSURE CkPa): STRAIN RATE: . OJ5 mra/min
350.00
MEASURED PROPERTIE!
READING
1234567
DVOLCcc)0.00
-0.01-0.01-0.01-0.01-0.01-0.00
PORPCfcPa)
302.02311.71315.83318.81320.43321.63322.50
DLNGCmm)0.000.210.450.700.951.231.51
AXFOCN)
0.0041.4052.8059.5264.1765.5365.32
CELPCkPa)
350.00350.00350. 00350. 00350.00350.00350.00
TIMECsec)
1132326453368529066137935
154

89
10111213141516171819202122232425262728293031323334353637383940414243444546474849505152535455565758
-0.010.000.000.000.000.01C.020.021.682.172.172.292.072.212.171.942.251.841.841.982.202.322.572.312.302.442.51.2.612.152.612.021.942.112.211.872.261.972.262.052.071.212.261.302.412.341.932.051.881.912.012.28
323.31324.12324.67325.06325.32325.58325.91326.00326.10326.10326.43326.36326.39326.52326.63326.75326.68326.81326.88326.75326.88326.81326.98326.94326.85326.85326.88326.88326.81326.88326.78327.01326.68326.98326.91326.94326.85323.85326.81326.62326.91327.01326.91327.07326.94326.94327.07327.01327.07327,01327.24
1.812.112^422.743.073.413.744.084.434.775.115.465.816.166.516.867.217.577.928.278.628.389.32S..G810.0310.3710.7211.0711.4211.7612.1112.4512.7913.1313.4713.8114.1514.4914.8315.1715.5115.8616.2016.5416.8917.2317.5817.9218.2718.6218.96
66.5967.0568.6269.8970.3171.6572.3173.1173.58
' 74.4275.1176.0376.6577.4978.1879.2680.1480.9531.7982.7583.6784.5285.2986.0936.9087.5983.4088.8289.6390.1330.8291.3291.9392.4393.0193.4794.0394.5495.12
- 95.6996.1596.73S7.0897.6398.1198.6993.0399.6599.99100.53100.95
350.00350.00350.00350.00350.00
. 350.00350.00350.00350.00350.00350.00350.00350.00350.00350.00350.00350.00350.00.350.00350.00350,00350. 00350.00350.00350.00350. 00350.00350.00350.00350.00350.00350.00350.00350.00350.00350.00350.00350.00350.00350.00350.00350.00350.00350.00350.00350.00350.00350.00350.00350.00350.00
92581053111903132261454815870171931851519838211612248323806251282645127773290963041831741330643438635708370313835339675409984232043643449774629947622489455026751589529125423455556568795820159523608466216863491648136613667459687817010471427727497407275394
155

59 2.17 327. 60 2.16 327.
DERIVED PROPERTIES.
READING STRAINA SIG1
24 19. 20 19.
SIG3
31 101.49 350.00 76717 65 101.95 350.00 78039
TOTAL EFFECTIVE STRESS STRESS RATIO EFFSIG1 EFFSIG3 RATIO
CkPa> CkPaD123456789
1011121314151617181920212223242526272829303132333435
, 36373839404142
0.0.0.0.0.0.0.0.0.0.0.0.0.0.0.0.0.0.0.0.0.0.0.0.0.0.0.0.0.0.0.0.0.0.0.0.0.0.0.0.0.0.
000000210046007200990128015701870219025102840319035303880423045904950530056606020639067507120748078508210858089409310967100410401076111211481184122012561291132613621397
350.00372.63378.79382 . 37384.80385 . 66385 . 22385 . 79385 . 92386.65387.20387.55387v 87388. 07388.36388.45388.75388.97389.29389.46 389.74389.94390 . 33390.62390.86391.13391.44391.74391.99392.20392.43392.65332.82393.04393.07393.28393.35393.50393.56393.68393.74393.83
350.350.350.350.
. 350.350.350.350.350.350.350.350.350.350.350.350.350.350.350.350.350.350.350.350.350.350.350.350.350.350.350.350.350.350.350.350.350.350.350.350.350.350.
000000000000000000000000000000000000000000CO00000000-00000000000000000000000000000000
1.1.1.1.1.1.1.1.1.1.1.1.1.1.1.1.1.1.1.1.1.1.1.1.1.1.1.1.1.1.1.1_1.1.1.1.1.1.4
1.
1.
1.
000608091010101010101111111111111111111111 .111212121212121212121212121212121212121213
CkPa)47.60.62.63.64.64.62.62.61.61.62.62.62.62.62.62.62.62.62.63.63.63.63.63.64.64.64.64.65.65.65.65.65.66,66.66.66.66.66.67.66.66.
93929756370372,4880971323281735356554930722255893052569861723488197161947477256007692
CkPa)4719838.2934.1831.1929.5723.3727.5026.6925.8825.3324.9424.6824,4224.0924.0023.9023.9023.5823.6423.6123.4823.3223.2523.3223. IS23.1223.2523.1223.1923.0223.0623.1523.1523.1223.1223.1923.1223.2222.9923.3223.0223.09
1.001.591.842.042.18
, 2.262.282.342.392.452.492.522.552.582.602.612.622.652.662.672.692.712.732.742.762.782.732.812.812.832.84
. 2.842.852.862.862.872.872.872.892.872.902.90
156

434445464748495051525354555657585960
0.14320.14670.15030.15380.15730.16090.16440.16800.17150.17520.17870.18230.18590.18950.19310.19670.20030.2038
DERIVED PROPERTIES
READING
123456783
101112131415161718192021222324252627
A
0.430.430.670.830.671.40
-2.011.426.140.760.710.730.831.570.340.980.001.50
-0.200. 190.460.820.17
-0.220.530.24
-0.41
393 . 87393.97394.01394.09394.17394.20394.27394.24394 . 33394.33394.40394 . 36394.44394.40394.43394.43394.46394.47
Ccont .-
q(kPa)0.00
11.3114.4016.1817.4017 . 8317.6117.9017.9618.3218.6018.78 .18.9319.0419.1819.2319.3819.4819.65.19.7319.8719.9720.1620.3120.4320. 56'20.72
350.00350.00 .350.00350.00350.00350.00350.00350.00350.00350.00350.00350.00350.00350.00350.. 00350.00350.00350.00
,
P'
CkPa)47.9849.6148.5747.3846.9745.2045.1144.5843.8443.6543.5443.4543.3543.1343.1743.1343.2843.0643.2943.3443.3543.2843.4143.6243.6243.6843.97
1.131.131.131.131.131.131.131.131.131.131.131.131.131.131.131.131.131.13
q/p'
c.oo0.230.300.340.370.390.390.40
. 0.410.420.430.430.440.440.440.450.450.450.450.460.460.460.460.47C.470.470.47
66.92'67.1367.1667.28 -67.5567.2967.2767.3367.2667.3967.4667.2967.4367.3267.4367.1967.2367.26
DEVIATORSTRESSCkPa)0,00
22.6328.7932,3734.8035.6635.2235 . 7935.9236.6537.2037.5537.8738.0738.3638.4538.7538.9739.2939.4639.7439.9440.3340.624 0 . 8641.1341.44
23.0623.1523.1523.1923.3823.0922.9923.0922.9323.0623.0622.9322.9922.9322.9922.7722.7722.80
MEAN
2.902.902.902.902.892.912.932.922.932.922.932.932.932.942.932.952.952.95
EFFECTIVESTRESSOPa)
47.9845.8343.7741.9841.1740.2639.2438.6237.8537.5437.3437.2037.0436.7836.7836.7236.8236.5636.7436.7636.7236.6336.6936.8636.8136.8337.07
157

28.2930313233343536373839404142434445464748435051525354555657585960
0.44-0.250.76
-0.15-0.430.00
- 0.150.. 00
-0.300.99
-0.633.64
-2.824.99
-0.630.94
-0.900.00
-0.39-2.3911.011.283.161.79
54.310.00
-3.19-0.80-1.47-1.67
-24.000.00
-6.97
20.8720.9921.1021.2121.3321.4121.5221.5321.6421.6721.7521.7821.8421.8721.9221.9321.9922.0022.0522.0922.1022.1422.1222.1722.1722.2022.1822.2222.2022.2222.2122.2322.23
43.9944.1844.1244.2744.4844.5644.6444.6644.8344.8044.9744.7745.1644.8945.0144.9945.1445.1645.2345.4745.1945.1345.2145.0945.2245.2645.1145.2145.1245.2144.9845.0045.03
0.470.480.480.480.480.480.480.480.480.480.480.490.480.490.490.490.490.490.490.490.490.490.490.490.490.490.490.490.490.490.490.490.49
41.7441.9942.2042.4342.6542.8243.0443.0743.2843.3543.5043.5643.6843.7443.8343.8743.9744.0144.0944.1744.2044.2744.2444.3344.3344.4044.3644.4444.4044.4344.4344.4644.47
37.0337.1837.0837.2037.3737.4337.4737.4837.6137.5737.7237.5137.8837.6037.7037 . 6837.8137.8237.8838.1037.8237.7537.8437.7137.8337.8637.7137.8137.7337.8037.5737.5937.62
158

a a_
ffl ct;
350
325
300
275
250
225
200
175
150
125
100
75
50
25
0
EFFECTIVE SIGHA 1
x EFFECTIVE SIGHA 3
DEVIATOR STRESS
SHEAR STRESS
MEAN EFFECTIVE STRESS
EXCESS PORE PRESSURE
+-4-+-4-1 I I I I I M t I > ! I I »-l I 111
I I I 1 I I I I I * I I M'» 1111
0 O-O-O OOOOOOOOO 0-Q O 0 OOOOG-OOOOOOOQOO O O'O
AXIAL STRAIN
GO-19, PC-45: 300/350159

TRIAXIAL TEST RESULTS
GENERAL TEST INFORMATION
SAMPLE INFORMATIONSAMPLE ID:
INTERVAL CmetersDiGENERAL LOCATION:
DESCRIPTION:DATE FINISHED:
GD-19, PC-45; 300/400G.54-G.66BALTIMORE-HUDSON CANYON AREAOLIVE-GRAY CLAY2/5/80
INDEX PROPERTIESMOISTURE CONTENT: 0.55
BULK DENSITY Cg/cc): 1.71VOID RATIO: 1.45
POROSITY: 0.59GRAIN SPEC GRAVITY Cg/cc): 2.71
LIQUID LIMIT C2): 58.00PLASTIC LIMIT CX5 : 27.00
SAMPLE PARAMETERSHEIGHT CmmD: 100.00
DIAMETER CmroD : 50.00AREA Csq. mm): 1963.50
VOLUME (cc): 196.35WEIGHT CmD: 340.00
TEST RESULTS
^SATURATION PHASE*
READING CELL PRESSURE DELTA C PORE PRESSURE DELTA PkPa
48.9650.4150.2749.33
kPa50.00100.00150.00200.00250.00
kPa
50.0050.0050.0050.00
kPa48.9997.95148.36198.63247.98
0.931.011.010.99
^CONSOLIDATION PHASE*
CELL PRESSURE CkPa): 400.003flCK PRESSURE CkPa): 300.00
CONSOLIDATION PRESSURE CicPa): 100.00ASSUMED EFFECTIVE
OVERBURDEN PRESSURE CJcPa): 44.41
160

CHANGES IN PRDPEPTIES DUE TO CONSOLIDATION
PROPERTY INITIAL VALUEHEIGHT Cram): 100.00
AREA Csq. mm): 1963.50VOLUME Ccc): 196.35
WATER CONTENT: 0.55POROSITY: 0.59
VOID RATIO: 1.45BULK DENSITY Cg/ccXr 1.71
BOUYANT BULK DENSITY Cg/cc): 0.69Z SATURATION: 100.00
CONSOLIDATED VALUE90.80
1618.85146.99
0.320.400.661.940.92
100.00
MEASURED PROPERTIES
NG
123456789
10111213±^1516171819202122232425262728293031323334
TIMECsec)
16
1323579215928954710G2208941407742113451-^94813550221522575529358329603656240165437674736950972545755817761779653816898472586761887979083393
Log TIME
0.000.781.111.361.761.962.202.462.743.033.323.623.894.054.174.274.354.414.474.524.564.604.644.684.714.744.764.794.824.844.864.884.904.92
Sqrt TIME
1.002.453.614.807.559.59
12.6117.0023.3932.5945.7164.3487.99
106.51122.26136.20148.84160.48171.34181.55191.21200.41209.21217.64225.77233.61241.20248.55255.70262.65269.42276.02282.47283.78
DVOLCccD
0.0045.4545.4645.4645.4645.4645.4745.4845.5045.5445.6245.7646.0046.2346.4546.6446.8447.0147.1747.3147.4447.5747.6847.7947.8947.9948.0848.1648.2448.3148.3848.4348.4948.56
161

35363738394041424344454647484950515253545556575853GO
869959059894201978031014051050071C3610112212115815119417123019126622130224133826137429141031144634148237151840155442159045162647166249169851173453177056
4.944 . 964.974.995.015.025.045.055.06,5.08
' 5.095.105.115.135.145.155.165.175.185.195.205.215.225.235.245.25
294.95301.00306.92312.73318.44324.05329.56334.98 .340.32345.57350.74355 . 84360.87365.82370.71375.54380.31385.02389.67394.26398.80403.30407.74412.13416.48420.78
48.6048.6548.7048.7448.7948.8348.3748.9048.3448.9649.0049.0249.0649.0349.1149.1449.1649.1849.2149.2349.2549.2749.2949.3149.3449.36
ALPHA: 0.91Ao Csq. mm): 1618.85
Lo CmnO: 90.80
*SHEAR PHASE*
CELL PRESSURE CkPa): 400.00 STRAIN RATE: .015 mm/min
MEASURED PROPERTIES
READING
1234567
DVOLCcc)0.000.00
-0.00-0. 000.00
-0.000.00
PCRPCkPa)
320.13330.93340.92347.43352.01355.48358.12
DLHGCmoO0.000.240.550.8?1.181.511.84
AXFOCN3
0.0049.5380.4194.59103.08109.33112.70
CELPCkPa)
400.00400.00400.00400.00400.00400.00400.00
TIMECsec)
1132426463939529166147936
162
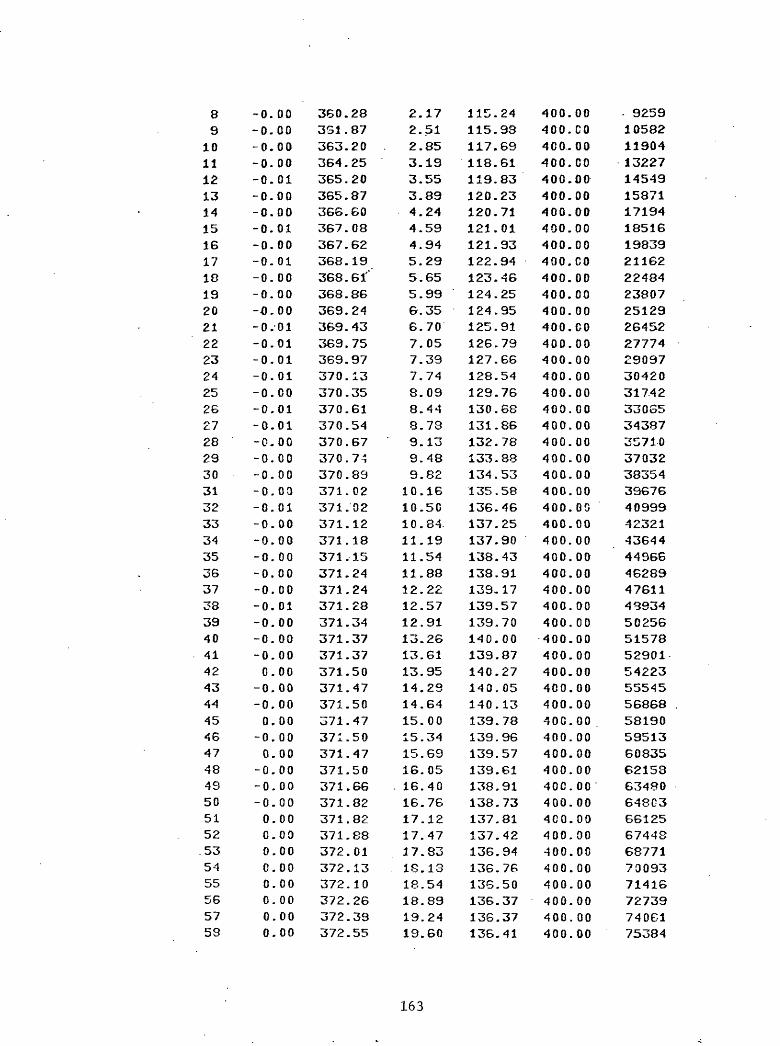
89
10111213141516171819202122232425262728293031323334353637383940414243444546474849505152535455565753
-0.00-0.00-0.00-0.00-0.01-0.00-0.00-0.01-0.00-0.01-0.00-0.00-fl.OO-0.01-0.01-0.01-0.01-0.00-0.01-0.01-0.00-0.00-0.00-0.00-0.01-0.00-0.00-0.00-0.00-0.00-0.01-0.00-0.00-0.000.00
-0.00-0.000.00
-o.oo0.00
-o.oo-0.00-o.oo0.000.000.000.000.000.000.000.00
360.283S1.87363.20 .364.25365.20365.87366.60367.08367.62368.19368.61'368.86369.24369.43369.75369.97370.13370.35370.61370.54370.67370.7^370.89371.02371.02371.12371.18371.15371.24371.24371.28371.34371.37371.37371.50371.47371.50371.47371.50371.47371.50371.66371.82371.82371.88372.01372.13372.10372.26372.39372.55
2.172.512.853.193.553.894.244.594.945.295.655.996.356.707.057.397.748.098.448.789.139.489.8210.1610.5010.84.11.1911.5411.8812.2212.5712.9113.2613.6113.9514.2914.6415.0015.3415.6916.05
. 16.4016.7617.1217.4717.8318.1318.5418.8919.2419.60
115.24115.93117.69118.61119.83120.23120.71121.01121.93122.94123.46124.25124.95125.91126.79127.66128.54129.76130.68131.86132.78133.88134.53135.58136.46137.25137.90138.43138.91139,17139.57139.70140.00139.87140.27140.05140.13139.78139.96139.57139.61138.91138.73137.81137.42136.94136.76136.50136.37136.37136.41
400.00400. CO400.00400.00400.00400.00400.00400.00400.00400. CO400.00400.00400.00400. CO400.00400.00400.00400.00400.00400.00400.00400.00400.00400.00400.00400.00400.00400.00400.00400.00400.00400.00400.00400.00400.00400.00400.00400.00 .400.00400.00400.00400. 00400. 00400.00400.00400.00400.00400.00400.00400.00400.00
- 92591058211904132271454915871171941851619839211622248423807251292645227774£90973042031742330G53438735710370323835439676409994232143644449664628947611489345025651578529015422355545568685819059513608356215363480648C3661256744868771700937141672739740G175384
163

59 0.00 372. GO 0.00 372.
DERIVED PROPERTIES
READING STRAINA SIG1
123456789
1011121314151617181920212223242526
27
282930313233343536373839404142
0.00000.00270.00610.00960.01300.01660.02030.02390.02760.03140.03520.03910.04280.04670.05060.05440.05830.06220.06600 . 06990.07380.07760.08140.08520.0391
. 0.09290.09670.10050.10440.10810.11190.11570.11940.12320.12710.13030.13460.13840.14220.14600.14980.1536
CkPa)400.00430.51449.37457.87462.85466.42468.21469.48469.67470.41470.69471.13471.03471.08 .470.97471.22471.52471.52471.69471.79472.04472.24472.44472.63473.02473.23473.58473.78474.07474.12474.38474.54474.65474.69474.64474.58474.40474.28474.02473.85473.45473.33
71 19. 77 20.
SIG3CkPaD
'400.00400.00400.00400.00400.00400.00400. 00400. CO400.00400.00400.00400.00400.00400. 00400.00400.00400.00400.00400.00400.00400.00400.00400.00400.00400.00400..00400.00400.00400. .00400.00400.00400.00.400.00400.00400.00400.00400.00400. 00400.00400.00400.00400.00
95 136.33 400.00 76707 31 .136.28 400.00 78030
TOTAL EFFECTIVE STRESS STRESS RATIO EFFSIG1 EFFSIG3 RATIO
1.001.081.121.14
1.161.171.171.171.171.181.181.181.181.181.181.181.181.181.181.181.181.181.181.181.181.181.181.181.191.191.191.191.191.191.191.191.191.191.191.181.181.18
CkPa}79.8799.58108.46110.44110.84110.94110.09109.21107.30107.21106.44105.93105.21104.. 48103.89'103.60103.32102.92102.83102.55102.61102.49102.47102.50102.66102.62103.03103.11103.33103.22103.36103.52103.54103.51103.49103.34103.15103.00102.68102.48102.08101.84
CkPa379.8769.0759.0852.5747.9944.5241.8939.7238.1336.8035.7534.8034.1333.4032.9232.3831.8131.4031.143C.7630.5730:2530.0329.8729.6529.3929.4629.3329.2729.1128.9828.9828.8823.8228.8528.7628.7628.7328.6628.6328.6328.50
1.001.441.842.102.312.492.632.752.832.912.983.043.083.13 3.163.203.253.233.303.333.363.393.413. 433.463.493.503.523.533.553.573.573.583.593.593.593.593.5S3.583.583.573.57
164

434445464748495051525354555657585960
0.15740.16130.16510.16890.17290.17670.18060.18450.18850.19240.19640.20020.20420.20800.21190.21580.21980.2237
DERIVED PPOPERTIE
READING
123456789
10111213141516
- 1718192021222324252627
A
0.350.350.530.770.920.971.471.698.691.793.812.15
-14.00-260.53
-4.272.161.94
50.561.563.730.761.591.110.820.581.21
-0.18
472.89472\ 61472.09471.85471.31471.00470.31469.88469.08468.56467.98467.57467.11466.71466.39466.03465.71465.36
S (cent.
qCkPa)0.00
15.2624.6928.9431.4233.2134.1034.7434.8335.2135.3435.5735.5435.5435.4935.6135.7635.7635.8435.8936.0236.1236.2236.3236.5136.6136.79
400.00400.00400.00400.00400.00400. CO400.00400.00400.00400.00400.00400.00400.00400.00400.00.400.00400.00400.00
D
P'
CkPa)79.87S4.3283.7781.5079.4177.7375.99.74.4772.9772.0171.0970.3669. G768.9468.4167.9967.5767.1666.9866.6566.5966.3766.2566.1966.1566.0166.24
1.181.181.181.181.181.181.181.171.171.171.171.171.171.171.171.171.161.16
q/P '
0.00C.180.290.360.400.430.450.470.480.490.500.510.51C.520.520.520.530.530.540.540.540.540,550.550.550.550.56
101.43101.11100.62100.3599.8499.5098.6598.0797.2696.6895.97S5.4495.0094.4594.0093.5393.0092.59
DEVIATORSTRESSCkPa)0.00
30.5149.3757.8762.8566.4268.2169.4869.6770.4170.6971.1371.0871.0870.9771.2271.5271.5271.6971.7972.0472.2472.4472.6373.0273.2373.58
28.5328.5028.5328.5028.5328.5028.3428.1828.1828.1227.9927.8727. SO27.7427.6127.4527.2927.23
MEAN
3.553.553.533.523.503.493.433.483.453.443.433.423.413.413.403.413.413.40
EFFECTIVESTRESSCkPa)
79.8779.2475.5471.8668.9466.6664.6262.8961.3660.2759.3158.5157.8257.0956.58.56.1255.6555.2455.0454.6954.58-54.3354.1754.0853.9853.8053.98
165

282930313233343536373839404142434445464748495051525354555657585960
0.630.223.110.490.000.881.840.7C
-1.55C.OO
-0.26-0.25-0.190.00 .
-1.050.07
-o.il0.06
-0.130.06
-0.10-0.23-0.370.00
-0.12-0.22-0.310.07
-0.41-0.39-0.52-0.42-0.18
38.8937.0337.0637.1937.2737.3337.3437.3237.2937.2037.14 ,37.0136.9338.7336.6736.4536.3036.0435.9235.6635.5035.1534.9434.5434.2833.9933.7833.5533.3633.1933.0432.8532.68
66.2266.3066.1666.1766.2566.2166.1666.1766.0565.9665.8665.6765.5665.3665.1764.98£4.8064.5864.4364. .1964.0063.5063.1362.7262.4061.9861.6561.4561.1060.8160.4960.1559. SI
0.560.560.560.560.560.560.560.560.560.560.560.560.560.560.560.560.560.560.560.560.550.550.550.550.550.550.550.550.550.550.550.550.55
73.7874.0774.1274.3874.5474. G574.6974.6474.5874.4074.2874.0273.8573.4573.3372.8972.6172.09 .71.8571.3171.0070.3169.8869.0868.5667.98 .67.5767.1166.7166.3966.0865.7165.36
53.9253.9553.8153.7753.8353.7753.7253.7353.6253.5653.4853.3453,2553.1152.9552.8352.7052.5652.4552.3052.1751.7851.4851.2150.9750.6550.3950.2749.9849.7449.4849.2049.02
166

aQ_
350
325
300
275
250
225
200
1751a
EFFECTIVE SIGMA 1
x EFFECTIVE SIGMA 3
* DEVIATOR STRESS
SHEAR STRESS
MEAN EFFECTIVE STRESS
EXCESS PORE PRESSURE
M I I I I I I I I I I I t I I I I
I I I I I I I I t I I I 1 I I I I 1 |
GO-19, PC-45: 300/400
AXIAL STRAIN
167

TRIAXIAL TEST RESULTS
GENERAL TEST INFORMATION
SAMPLE INFORMATIONSAMPLE ID: GD-19, PC-45? 300/500
INTERVAL Croeters): 6.68-6.78 GENERAL LOCATION: BALTIMORE-HUDSON CANYON AREA
DESCRIPTION: OLIVE-GRAY CLAY DATE FINISHED: 2/5/80
INDEX PROPERTIESMOISTURE CONTENT: 0.66
BULK DENSITY Cg/cc): 1.64VOID RATIO: 1.74
POROSITY: 0.64GRAIN SPEC GRAVITY Cg/cc): 2.71
SAMPLE PARAMETERSHEIGHT CmmD: 100.00
DIAMETER Cmm): 50.00AREA Csq. mm): 1963.50
VOLUME CccD.- 196.35WEIGHT CgnO: 344.70
TEST RESULTS
^SATURATION PHASE*
READING CELL PRESSURE DELTA C PORE PRESSURE DELTA PkPa50.00100.00200. 00250. 00500.00
kPa
50.00100.0050.00250.00
kPa48.0597.52196.28246.85497.30
kPa
49.4798.7650.57250.45
0.990.991.011.00
XCONSOLIDATION PHASE*
CELL PRESSURE CkPa): 500.00BACK PRESSURE CkPa)r 300.00
CONSOLIDATION PRESSURE UPa) : 200.00ASSUMED EFFECTIVE
OVERBURDEN PRESSURE CkPa): 40.43
168

CHANGES IN PROPERTIES DUE TO CONSOLIDATION
PROPERTYHEIGHT
AREA CsqVOLUME
WATER COPOR
VOIDBULK DENSITY C
BOUYANT BULK DENSITY C 3 /cc>i X SAT
MEASURED PROPERTIES
READING
1
2345e789
10111213141516171319202122232425262723293031323334
TIME(sec)
1612234276
143273531104620734124772611329149311853322136257332934132943365464014S4375047352509555455853160617626536568S6?72569761717977483376
INITIAL VALUECmnOmm)Ccc>ITEMT(S I TV:ATIO/cc}/cc}moN
Log
:
:
:
r m
!
:
i
:
TIME
100.001963.50196.35
0.660.641.741.640.61
100.00
CONSOLIDATED VALUE94.
1743.2496
164.36
Sqrt TIME
0.0.1.1.0.
100.
495946767300
DVOLCcc>
0.0.1.1.1.1.2.2.2.3.3.3.3.4.4.4.4.4.4.4.4.4.4.4.4.4.4.4.4.4.4.4.4.4.
00780836628816447302326289051727354147525660646871747679828486889092
1.2.3.4.6.8.
11.16.23.32.45.64.87.
106.122.136.148.160.171.181.191.200.209.217.225.233.241.248.255.262.269.275.282.283.
00454680487296520434532290441914784329-
501737176173531652676239994475
0.31.31.31.31.31.31.31.31.31.31.31.31.31.31.31.31.31.31.31.31.31.31.31.31.31.31.31.31.31.31.31.31.31.
0009C9090909091010101112141618192123-24262729303133353733404144454850
169

3536373839404142434445464748495051525354555657585960
869789058194184977861013891049911085931121961157981194001230031266051302071338101374121410151446181482ZO151823155425159028162630166233169835173437177039
4.944.964.974.995.015.025.045.055.06-5.085.095.105.115.135.145.155.165.175.185.195.205.215.225.23T-.24 .5.25
294.92300.97306.89312.71318.42324.02329. .53334 . 96340.29345.54350.72355.82360.84365.80370.69375.52380.29384 . 99389.64394.24398.78403.27407.72412.11416.46 .420.76
31.5131.5331.5631.5831.6031.6231.6431.6831.6931.7031.7331.7431.7731.7831.8031.8231.8531.8631.8831.9031.9131.9331.9431.9531.9831.99
ALPHA.- 0.94
Ao Csq. mm): 1743.97Lo CmnOr 94.24
XSHEAR PHASE*
CELL PRESSURE CJcPa): STRAIN RATE: .015 mn»/min
500.00
MEASURED PROPERTIES
READING
1234567
DVOLCcc)0.000.000.00
-0.000.00c.oo
-o.oo
PORPCkPa)
329.16361.46379.74392.31402.06408.87414.77
DLNGCmm)0.000.290.590.911.221.551.88
AXFOCM)
0.00105.57133.20149.56160.91170.02177.38
CELPCkPa)
500.00500.00500.00500.00500.00500.00500.00
TIMECsec)
0132326453967529066137935
170

891011121314151G1718192021222324252G2728293031323334353637383940414243444546474849505152535455565758
-0.00-0.000.000.00
-0.00-0.01-0.01-0.01-0.01-0.01-0.01-0.01-0.02-0.01-0.01-0.02-0.01-C.01-0.01-0.01-0.00-0.01-0.00-0.01-0.0.0-0.00-0.00-c.oo0.00
-0.010.000.01c.oo
-0.00-0. 000.010,000.000.01c.oo0.000.010.010.010.010.010.010.010.010.010.01
419.33423.04426.04428.19430.08431.55432.98434.02435.10435.88436.92"437.15437.87438.32438.88439.30439.63439.53439.69439.79440.12439.79440.05439.89439.79439.69439.27439.43438.98439.07439.01438.75438.58438.42438.32438.29433.13437.77437.90437.74437.84437.74437.77437.74437.54437.51437,54437.22437.31
. 437.51437.57
2.232.582.923.273.623.964.324.675.025.375.726.086.436.787.137.477.828.178.538.889.239.539.9310.2810.6310.9711.3211.6712.0212.3712.7213.0613.4113.7514.1014.4414.7915.1415.4915.84.16.1916.5316.8817.2317.5717.9218.2718.6218.9619.3119.66
183.70188.78193.27196.99199.94202.15203.93205.52206.95208.73210.40212.07213.89215.71217.69219.78221.76224.04226.33228.65230.71232.69234.82237.03239.16241.02242.96244.66246.40247.80249.35250.63252.0?253.07254.16255.59256.91258.15258.81259.37260.88261.83262.76263.88265.01266.17267.18268.03269.15269.81271.05
500.00500.00500.00500.00500.00500.00500.00500.00500.00500.00500.00500.00500.00500.00500.00500.00500.00500.00500.00500.00500.00500.00500.00500.00500.00500.00500.00500.00500.00so a. oo500.00500.00500.00500.00500. CO500.00500.00500.00500.00500.00500.00500. 00500.00500.00500.00500.00500.00500.00500.00500.00500.00
92581058011903132251454815870171931851519838211602248323806251282645127773290963041831741330643438635703370303835339675409984232043G424496546287 4761048932502555157752899542225554456866581895951160834G215663479648016612467447687697009271415727377406075383
171

59. 60
0.010.01
437.437.
5125
20.20.
Cl35
271.71272.72
500.00500.00
7670678029
DERIVED PROPERTIESTOTAL EFFECTIVE
STRESSREADING
123456789
101112131415161718192021222324252627282930313233343536373839404142
STRAINA
0.0.0.0.0.0.0.0.0.0.0.0.0.0.0.0.0.0.0.0.0.0.0.0.0.0.0.0.0.0.0.0.0.0.0.0.0.0.0.0.0.0.
000000300063009601300165020002360273031003470384042104580495053205700607064506820719075607920830086709050942097910171054109011281164 .1201 ,12381275131213491386142314591496
SIG1CkPa)
500.00560.35575.90584.93591.07595.88599.68602.84605.29607.39609.04610.24611.04611.58612.01612.35612.87613.32613.76614.28614.79615.38616.04616.60617.32618.03618.76619.33619.86620.45621.09621.67622.11622.58622.92623.27623.45623.68623.79623.95623.94623.94
SIG3 RATIOCkPa)
500.500.500.500.500.500.500.500.500.500.500.500.500.500.500.500.500.500.500.500.500.500.500.500.500.500.500.500.500.500.500.500.500.500.500.500.500.500.500.50C.500.500.
000000000000000000000000000000000000000000000000000000000000000000000000000000000000
111111111111111111111111111111111i11111111
.00
.12
.15
.17
..18
.19
.20
.21
.21
.21
.22
.22
.22
.22
.22
.22
.23
.23
.23
.23
.23
.23
.23
.23
.23
.24
.24
.24
.24
.24
.24
.24
.24
.25
.25
.25
.25
.25
.25
.25
.25
.25
EFFSIG1CkPa)170.84198.89196.16192.61189.01187.02184.92183.52182.24181.35180.85180.16179.49178.60177.99177.25176.99176.39176.61176.41176.47176.51176.74176.98177.80178.34178.97179.22180.07180.40181.21181.88182.42183.31183.49184.30184.37184.68185.05185.37135.52185.61
EFFSIG3STRESSRATIO
CkPa)170.138.120.107.97.91.85.80.76.73.
. 71.69.68.67.65.64.64.63.62.62.61.61.60.60.60.60.-
60.59.60.59.60.60.60.60.60.61.60.60..61.61.61.61.
845426699413246796968192450298901208851368127037473121882195112131735702939925425868
1.001.441.631.791.932.052.172.272.372.452.522.582.622.66
' 2.702.732.762.802.812.842.8S2.892.912.932.942.962.972. ,992.993.013.013.023.023.023. 033. 023.033.033.023.023.013.01
172

43 0.1532 624.10 500.00 1.25 185.81 61.71 3.01 44 0.1569 624.19 500.00 1.25 186.07 61.87 3.01 45 0.1606 624.25 500.00 1.25 186.48 62.23 3.00 46 0.1643 624.01 500.00 1.25 186.11 62.10 3.00 47 . 0.1680 624.02 500.00 .1.25 186.28 62.26 2.99 48 0.1717 623.89 500.00 1.25 186.06 62.17 2.96 49 0.1754 623.80 500.00 1.25 186.06 62.26 2.99 50 0.1791 623.68 500.00 1.25 185.91 62.23 2.99 51 0.1828 623.66 500.00 1.25 185.92 62.26 2.99 52 0.1864 623.63 500.00 1.25 186.09 62.46 2.98 53 0.1901 623.60 500.00 1.25 186.10 62.49 2.98 54 0.1938 623.51 500.00 1.25 185.97 62.46 2.98 55 0.1975 623.33 500.00 1.25 186.12 62.78 .2.96. 56 0.2012 623.28 500.00 1.25 .185.97 62.69 2.97 57 0.2049 623.00 500.00 1.25 185.50 62.49 2.97 58 0.2086 622.99 500.00 1.25 185.42 62. .43 2.97 59 0.2123 622.73 500,00 1.25 185.22 62.49 2.96 60 0.2160.622.61 500.00 1.25 185.36 62.75 2.95
DERIVED PROPERTIES <cont.3
READING
1 2 3 4 5 6 7 8 9
10 11 12 13 14 15 16 17 18 19 20 21 22 23 24 2526 27
0.54 0.54 1.18 1.39 1.59 1.42 1.55 1.44 1.52 1.43 1.30 1.57 1.85 2.64 2.42 3.18 1.49 2.35 0.52 1.38 0.89 0.94 O.G5 0.58n Jt A-0 . j.~t 0.23 0.14
qCliPa) 0.00
30.17 37.95 42.46 45.54 47.94 49.84 51.42 52.64
. 53.69 54.52 55.12 55.52 55.79 56.01 56.17 56.44 56.66 56.83 57.14 57.40 57.69 58.02 58.3058.66 59.02 53.33
P'
CkPa) 170.84 168.72 158.21 150.15 143.48 139.07 135.08 132.10 129.60 127.65 126.33 125.04 123.97 122.81 121.98 121.08 120.56 119.74 119.73 119.27 113,07 113.81 118.72 118.67119.13 119.33 119.59
MEANDEVIATOR EFFECTIVEq/p'
0.00 0.18 0.24 0.28 0.32 0.34 0.37 0,39 0.41 0.42 0.43 0.44 0.45 0.45 0.46 0.46 0.47 0.47 0.48 0.48 0.48 0.49 0.49 0.490.49 0.49 0.50
STRESS CkPa> 0.00
60.35 75.90 84.93 91.07 95.88 99.68
102.84 105.29 107.39 109.04 110.24 111.04 111.58 112.01 112.35 112.87 113.32 113.76 114.23 114.79 115.38 116,04 116.60117.32 118.03 118.76
STRESS CkPai
170.84 158.66 145.56 136.00 128.30 123.09 118.46 114.95 112.05 109.76 108.16 106.67 105.47 104.21 103.31 102.35 . 101.74 100.85 100.77 100.22 93.94 99.58 99.38 99 ~4v^ w/ » «.
99.53 99.65 99.80
173

2829303132333435363738394041424344 .45464748495051525354555657585960
0.57- 0 .620.44
-0.25-0.17-0.22-0.900.48
-1.280.56
-0.27-2.38-1.0316.9921.87-0.20-1.74-6.85-0.56
-39.25-0.771.03
-0.301.216.681.48
-0.34.1.86-1.98-0.70-6.37C.242.22
59.6759.9360.2360.5560.8461.0561.2961.4661.6461.7261.8461.9061.9861.9761 . 9762.0562.1062.1262.0162.0161.9561.9061.8461.8361.8161.8061.7561.6761.6461.5061.5061.3661.30
119.55120.14120.18120.66121.05121.36122.02122.03122.66122.65'122.83123.15123.39123.55123.64123.76123.97124.35124.11124.27124.11124.16124.07124.09124.27124.29124.21124.45124.33123.99123.92123.85124. D6
0.500.500.500.500.500.500.500.500.500.500.500.500.500.500.500.500.500.500.500.500.500.500.500.500.500.500.500.500.500.500.500.500.49
119.33119.86120.45121.09121.67122.11122.58122.92123.27123.45123.68123.79123.95123.94123.94124.10124.19124.25124.01124.02123.89123.80123.68 123.66123.63123.60123.51123.33123.28123.00122.99122.73122.61
99.66100.16100.10100.48100.77101.01101.59101.54102.12102.08102.22102.52102.73102.83102.99103.08103.27103.65103.44103.60103.46103.53103.46103.48103.67103.69103.63103.89103.78103.49103.42103.40103.62
174

350
325
300
275
250
225
200
+ EFFECTIVE SIGHA 1
x EFFECTIVE SIGHA 3
* DEVIATOR STRESS
* SHEAR STRESS
MEAN EFFECTIVE STRESS
EXCESS PORE PRESSURE
M I I M I I ' It ' ' ' I I 1 I t-l
0 O 0 O Q-0-0 0 0 0 0 0-0 C
GO-19, PC-45; 3B0/500
AXIAL STRAIN
175

75..
-3501
25.,
CS3 10
ecjto H3
p' (Wo)
GD-19, PC-45; 303/353, 403,.76

DEVIA
TOR
STRE
SS (
kPa)
rvj
enno
C9
H
rvj
enrv
j en C
53
PO
-*4
en
50 it
-_ en CO
CD
C
O en CO
h-1
--J
<3
S
8
m..
250.
.
3B0I

TRIAXIAl. TEST RESULTS
GENERAL TEST INFORMATION
SAMPLE INFORMATIONSAMPLE ID*
INTERVAL (meters):GENERAL LOCATION*
DESCRIPTION:DATE FINISHED:
GD-7, PC-52j 30-0/3506.19-6.31BALTIMORE-HUDSON CANYON AREAOLIVE-GRAY CLAY1/22/80
INDEX PROPERTIESMOISTURE CONTENT: 0.53
BULK DENSITY Cg/cc): 1.73VOID RATIO: 1.41
POROSITY: C.59GRAIH SPEC GRAVITY Cg/ccD: 2.73
SAMPLE PARAMETERSHEIGHT Cmm).- 100.00
DIAMETER dimO : 50.00AREA Csq. mnO : 1963.50
VOLUME Ccc): 196.35HEIGHT Cg.-n): 342.30
TEST RESULTS
^SATURATION PHASER
READING CELL PRESSURE DELTA C PORE PRESSURE DELTA PLPa50.00100.00200.00300. 00350.00
kPa
50.00100.00100. OC50.00
kPa49.0098.00197.00293.00349.00
kPa
49.0099.00101.0050.00
B
0.98 C.99 1.01 1.00
^CONSOLIDATION PHASE*
CELL PRESSURE ClcPa} : 350. COBACK PRESSURE CkPaD: 300.00
CONSOLIDATION PRESSURE CkPa): 50.00ASSUMED EFFECTIVE
OVERBURDEN PRESSURE CkPa}-. 43.30
178

.CHANGES 1H PROPERTIES DUE TO CONSOLIDATION
PROPERTY INITIAL VALUEHEIGHT CramD: 100.00
AREA Csq. mm): 1963.50VOLUME Ccc): 196.35
WATER CONTENT: 0.53POROSITY: 0.59
VOID RATIO: 1.41BULK DENSITY (g/cc>: 1.73
BOUYANT BULK DENSITY Cg/cc): 0.71X SATURATION: 100.00
CONSOLIDATED VALUE98.00
1885.74134.80
0.530.531.131.730.71
100.00
MEASURED PROPERTIES
[NG
123456789
10111213141516171819202122232425262728293031323334
TIME(sec)
013232645396852906613793692581058111904132261454915871171931851519838211602248223805251282645027773290953041831740330623438435707370293835133673409964231843640
Log TIME
-4.003.123.423.603.723.823.903.974.024.084.124.164.204.244.274.304.334.354.384.404.424.444.464.484.504.524.544.554.574.584.604.614.634.64
Sqrt TIME
0.0036.3751.4362.9972.7331.3289.0896.22102.86109.11115.00120.62125.93131.12136.07140.85145.46149.94154.29158.52162.63166.65170.57174.41178.16181.83185.43188.96192.43195.83193.18202.47205.71208.90
DVOLCcc)
0.000.010.01.0.000.010.010.010.010.010.01C.020.020.010.020.010.010.020.020.020.010.010.010.010.020.010.02O.C10.020.020.020.020.020.020.02
179

35363738394041424344454647484950515253545556575859
44963462854760848930502535157652899542215554456867581905951260835621586348064803661266744968772700957141872740740627538476707
4.654.674.684.694.704.714.724.734.744.754.78 .4.774.784.794.804.814.824.834.844.854.854.864.874.884.88
212.04215.14218.19221.20224.17227.10230.00232.85235.68238.47241.23243.95246.65249.32251.95254.56257.15259.71262.24264.75267.24269.70272.14274.56276.96
0.020.020.020.030.020.020.030.03C.030.030.030.030.030.020.030.020.030.030.030. 030.030.030.030.040.04
ALPHA: 0.98Ao (sq. mm): 1885.75
Lo (mm): 98.00
XSHEAR PHASE*
CELL PRESSURE CtPa): 350.00 STRAIN RATE: .015 mm/rain
MEASURED PROPERTIES
READING
12345678
DVOLCcc)0.000.010.010.00O.D10.010.010.01
PORPC k Pa )
301.34302.25303.81315.22320.56323.76326.13327.41
DLNG(mm)0.000.270.550.851.161.491.822.14
AXFOCN)
0.000.003.80
42.2453.3360.2364.9168.56
CELPCkPa)
350.00350.00350.00350.00350.00350.00350.00350.00
TIME(sec)
01323264539685290661379369258

91011121314151617181920212223242526272829303132333435363738394041424344454647484950515253545556575859
. C.010.010.020.020.010.02C.010.010.020.020.020.010.010.010.010.020.010.020.010.020.020.020.020.020.020.020.020.020.020.030.020.020.030.030.030.030.030.030.030.020.030.020.030.03
. 0.030.030.030.030.030.040.04
328.64329.26330.04330.73331.15331.64331.71331.97332.20332.52,,332.68332.68332.94332.91332.98332.81332.75332.. 78332.94332 . 68332.72332.78332.75332.78332.68332.59332.65332.49332.46332.62332.59332.42332.29332 . 39332 . 65332.42332.23332.26332.49332 . 65332 . 62332.52332.62332.55332.49332.52332.42332.52332.46332 . 68332.10
2.462.803.153.493.834.184.524.875.215.575.916.276.626.967.327.678.018.368.729.079.419.7710.1210.4610.8211.1611.5011.8512.2012.5512.9013.2513.6013.9414.2914.6414.9915.3415.6916.0316.3816.7217.0717.4217.7618.1018.4518.8019.1419.4319.83
70.61 .70.8170.6171.7773.0174.6075.8877.2078.0579.2980.3081.3182.3583.2584.2585.4586.4287.5588.4889.4190.3091.2392.0893.0133.6394.4595.4196.1596.8597.6298.1798.9099.45
.100.22100.80101.42102.04102.35102.78.103.44104.10104.64105.06105.53106.07106.30106.96107.62107.86109.10109.79
350.00350.00350.00350. CO350.00350.00350.00350.00350.00350. oa350.00350.00350.00350.00350.00350.00350.00350.00350.00350.00350.00350.00350.00350.. 00350.00350.00350.00350.00350.00350.00350.00350.00350.00350.00350.00350.00350.00350.00350.00350.00350.00350.00350.00350.00350.00350.00350.00350.00350.00350.00350. 00
10581119041322614549158711719318515198382116022482.23805251232645027773290S5304183174033062343843570737029383513967340396423184364044963462854760348930502535157652899542215554456867581905951260835621586348064803661266744968772700957141872740740627538476707
dl

DERIVED PROPERTIES
READING STRAIHA SIG1 SIG3
TOTAL EFFECTIVE STRESS STRESS RATIO EFFSIG1 EFFSIG3 RATIO
CkPa) ClcPa)123456789
1011121314151617131920212223242526272829303132333435363738394041424344
0.0.0.0.0.0.0.0.0.0.0.0.0.0.0.0.0.0.0.0.0.0.0.0.0.0.
. 0.0.0.0.0.0.0.0.0.0.0.0.0.0.0.0.0.0.
000000270056008601180152018502180251028503210356039104260461049705320568C6030640067507110747078208170853089009280960099710321068110411391174120912451281131713521383142314581494
350.00350.00352.00372.21377.95381.45383.79385.56386.51.386.48386.24386.71387.21387 . 87388.39388.90389.19389.66390.01390 . 36390.72391.^01391.34391.77392.08392.46392.74393.02393.29393.58393.79394. 06394.17394 . 38394.66394 . 83394.96395.14395.20395.36395.42395.58395 . 66395.75
350.350.350.350.350.35Q.350.350.350.350.350.350.350.350.350.350.350.350.350.350.350..350.350.350.350.350.350.350.350.350.350.350.350.350.350.350.350.350.350.350.350.350.350.350.
0000000000000000000000000000000000000000000000000000000000000000 .00000000CO00000000000000
1.1.1.1.1.1.1.1.1.1.1.1.1.1.1.1.1.1.1.1.1.1.1.1.1.1.1.1.1.1.1.1.1.1.1.
. 1.1.1.1.1.1.1.1.1.
0000010608091010101010101111111111111112121212121212121212121313131313131313131313131313
CkPa)48.6647.7548.1956.99.57.3857.7057.6558.1657.8657.2156.2055.9856.0556.2356.6856.9456.9957.1457.3357.6857.7858.1058.3758.9659.3459.6859.8060.3460.5760.7761.0461.28-61.4961.8062.0182.3462.5162.5262.6262.9363.1263.1963.0163.33
CkPa)48.6647.46.34.23.26.
7519784425
23.8722.21.20.19.19.18.18.18.18.17.17.17.17.17.17.17.17.17.17.17.17.17.17.17.17.17.17.17.17.17.17.17.17.17.17.17.17.
603674962785 .
36290381483232 .060902192522063228222522324135515538415871613558
1.001.001.041.641.S52.202.422.572.712.762.822.902.973.06
" 3.103.163.203.273.313.333.393.403.433.433.443.473.513.483.503.533.543.563.553.553.573.563.563.603.603.583.563.593.633.60
182

454647484950515253545556575859
0.15300.15650.16010 . 16350.16710.17060.17420.17780.18120.18470.18830.19180.19530.19870.2024
395.84395.78395.78395.88395.98396. 02396.01396.01396.06395 . 96396.04396.13396.02396.36396.44
350.00350.00350.00350.00350.00350.00350.00350.00350.00350.00350.00350.00350.00350.00350.00
1.131.131.131.131.131.131.131.131.131.131.131.131.131.131.13
63.6163.5263.2963.2363.3663.5063.3963.4663.57 63.44.63.6263.6163.5763.6764.34
17.7717.7417.5117.3517.3817.4817.3817.4517.5117.4817.5817.4817.5517.3217.90
3.583.583.613.643.653.633.653.643.633.633.623.643.623.683.59
DERIVED PROPERTIES Ccont . 3
READING
123456789
101112131415161718192021222324252627282930
A
0.000.000.780.560.930.911.020.711.31
-20.55-3.351.430.850.730.130.500.800.690.460.000.72
-0. 120.20
-0.33-0.210.090.58
-0.930.130.24
qUPa)C.OO0.001.00
11.1013.9715.7316.8917.7818.2518.2418.1218.3518.6018.9419.1919.4519.5919.8320.0120.1820.3620.5020.6720.3921.0421.2321.3721.5121.6421.78
P'
CkPa}48.6647.7547.1945.8943.4141.9740.7640.3839.6138.9838.0837.6337.4537.3037.4937.4937:4037.3137.3237.5037.4237.5937.6938.0733.2938.4538.4338.8338.9339. 00
q/p'
0.000.000.020.240.320 . 370.410.440.460.470.480.490.500.510.510.520.520.530.540.540.540.550.550.550.550.550.560.550.560.56
DEVIATORSTRESSCkPa)0.00.0.002.00
22.2127.9531.4533.7935.5636.5136.4836.2436.7137.2137.8738.3938.9039.1939.6640.0140.3640.7241.0141.3441.7742.0842.4642.7443.0243.2943.53
MEANEFFECTIVESTRESS-ClcPa}
48.6647.7546.85 -42.1833.75 .36.7335.1334.4533.5332.9032.0431.5131.2530.9831.0931.0030.8730.7030.6630.7730.6330.7630.8031.1131.2831.3731.3031.6631.7131.74
183

3132333435363738394041424344454647484950515253545556575859
-0.140.12
-0.85-0.460.23
-0.98-0.240.93
-0.51-1.05-2.210.583.42
-2.58-2.27-0.59
-195.351.59
-0.35-2.17-8.82
-22.87-1.54-0.33-1.151.190.640.69
-6.91
21.9022.0322.0922.1922.3322.4122.4822.5722.6022.6822.7122.7922.8322.8722.9222.8922.8922.9422.9923.0123.0123.0123.0322.9823.0223.0623.0123.1823.22
39.1539.2539.4039.6039.6839.9240.0339.9540.0240.2640.4240.4040.1840.4540.6940.6340.4040.2940.3740.4940.3940.4540.5440.4640.6040.5440.5640.4941.12
0.560.560.560.560.560.560.560.560.560.560.560.560.570.570.560.560.570.570.570.570.570.570.570.570.570.570.570.570.56
43.7944.0644.1744.3844.6644.8344.9645.1445.2045.3645.4245.5845.6645.7545.8445.7845.7845.8845.9846.0246.0146.0146.0645.3646.04 46.1346.0246.3646.44
31.8531.9032.0432.2132.2432.4532.5332.43
. 32.4832.7032.8532.8032.5732.8333.0533.0032.7732.6432,7132.8232.7232.7832.8632.8032.9232.8632.3932.7733.38
184

350
325.
300..
275
250..
225..
200..
;i75..t I
'l50 .
125..
100..
75..
50
251
0
EFFECTIVE SIGMA 1
EFFECTIVE SIGMA 3
DEVIATOR STRESS
SHEAR STRESS
MEAN EFFECTIVE STRESS
EXCESS PORE PRESSURE
GD-7, PC-52: 300/350
AXIAL STRAIN
185

TRI AXIAL TEST RESULTS
GENERAL TEST INFORMATION
SAMPLE INFORMATIONSAMPLE ID:
INTERVAL Cmeters):GENERAL LOCATION:
DESCRIPTION-.DATE FINISHED:
GD-7, PC-52; 300/4006.31-6.43BALTIMORE-HUDSON CANYON AREAOLIVE-GRAY CLAYi/22/80
INDEX PROPERTIESMOISTURE CONTENTS 0.51
BULK DENSITY C9 /cc): 1.75VOID RATIO: 1.36
POROSITY: 0.58GRAIN SPEC GRAVITY Cg/cc): 2,73
LIQUID LIMIT CX): 48.00PLASTIC LIMIT CX): 25.00
SAMPLE PARAMETERSHEIGHT (ma,): 100.00
DIAMETER (mrr,) : 50.00AREA Csq. mm): 1383.50VOLUME Ccc): 196.35WEIGHT Cgm) : 340.10
TEST RESULTS
^SATURATION PHASE*
READING CELL PRESSURE DELTA C PORE PRESSURE DELTA PkPa50.00100.00200. 00300.00400. 00
kPa
50.00100.00100.00100. 00
JPa50.0098.00199.00298.00398.00
kPa
48.00101.0039.00100.00
0.961.010.991.00
^CONSOLIDATION PHASE*
CELL PRESSURE CkPa): 400.00BACK PRESSURE CkPa): 300.00
CONSOLIDATION PRESSURE CkPa).- 100.00ASSUMED EFFECTIVE
OVERBURDEN PRESSURE CkPa); 45.13
186

CHANGES IH PROPERTIES DUE TO CONSOLIDATION
PROPERTYHEIGHT Cmm):
AREA Csq. mm)*VOLUME Ccc):
WATER CONTENT:POROSITY:
VOID RATIO:BULK DENSITV Cg/cc) :
BOUYANT BULK DENSITY Cg/cc>2 SATURATION:
INITIAL VALUE:
t
t':
r :
1 :
:' :
| :
100.001963.50196.35
0.510.581.361.750.72
100.00
CONSOLIDATED VALUE97.00
1847.45179.20
0.510.511.041.750.72
100.00
MEASURED PROPERTIES
NG
123456789
10111213141516171819202122232425262728293031323334
TIMECsec)
0132326453968529166137936925910581119041322714550158721719518517198392116122434238062512926451277742909630419317413306434386357083703038352.39675409974231943642
Log TIME
-4.003.123.423.603.723.823.903.974.024.084.124.164.204.244.274.304.334.354.384.404.424.444.464.484.504.524.544.554.574.584.604.614.634.64
Sqrt TIME
0.0036.3751.4362.9972.7481.3289.0896.22102.86109.11115.01120.62125.98131.13136.08140.85145.47149.95154.29158.52162.64166.66170.58174.41178.16131.84185.43188.97192.43195.84199.19202.48205.72208.91
DVDLCcc)
0.00-0.03-0.03-0.03-0.02-0.02-0.02-0.02-0.02-0.02-0.02-0.02-0.02-0.02-0.02-0.02-0.02-0.01-0.02-0.02-0.02-0.02-0.02-0.03-0.02-0.02-0.02-0.02.-0; 02-0.02-0.02-0.02-0.02-0.02
187

35363738394041424344454647484950515253545556575859
44964462864760948932502545157752900542235554556868581915951360836621596348264804661276745068773700967141972741740637538676708
4.654.674.684.694.704.714.724.734.744.75'4.764.774.784.794.804.814.824.834.844.854.854.864.874.884.38
212.05215.14218.1922.1.21224.17227.11230.00232.86235 . 68238.47241.23243.95246.6524S.32251.96254.57257.15259.71262.25264 . 76267.24269.71272.15274.57 276.96
-0.02-0.02-0.01-0.01-0.01-0.01-0.01-0.01-0.01-0.01-0.01-0.01-0.01-0.00-0.01-0.01-0.00-0.00-0.00-0.00-0.00-0.00-0.010.010.01
ALPHA: 0.97Ao Csq. mm): 1847.46
Lo (mm): 97.00
XSHEAR PHASE*
CELL PRESSURE CkPa) : STRAIN RATE; .015 mm/mir,
400.00
MEASURED PROPERTIES
READING
1234nr o
678
DVOLCcc)0.00
-C.03-0.03-0. 03-0.02-C.02-0.02-0.02
PORPCkPa)
317.49332.40340.50346.16350.29353.44356.11357.89
DLNGCmm)0.000.270.580.891.211.541.882.21
AXFOCN)
0.0058.5474.6484.6692.3138.26103.30106.27
CELPCkPa)
400.00400.00400.00400. 00400.00400.00400.00400. 00
TIME(sec)
01323264539685291661379369259
188

910111213141516171319202122232425262728293031323334353637383940414243444546474849505152535455565758 .59
-0.02-0.02-0.02-0.02-0.02-0.02-0.02-0.02-0.02-0.01-0.02-0.02-0.02-0.02-0.02 .-0.03-0.02-0.02-0.02-0.02-0.02-0.02-0.02-0.02-0.02-0.02-0. 02-0.02-0.01-0.01-0.01-0.01-0.01-0.01-0.01-0. 01-0.01-0.01-0.01-0.00-0.01-0.01-0.00-0.00-o.co-0.00-o.oo-0.00-0.010.010.01
359.51360.59361.55362.47363.23364.00364.60364.98365.30365 . 78366.1 3366.32366.60366.76366 . 95367.08367.05367.14367.37367.30367.43367.40367.40367.30367.24367.24367.30367.30367.24367.24367.21367.27367.21367.18367.30367.24367.18367.18367.27367.37367.37367.40367.27367.43367.46367.46367.40367.30367.46387.78367.72
2.462.803.153.503.854.204.554.905.255.605.956.306.657.0C7.357.708.048.398.749.089.439.7710.1210.4610.8011.1511.4911.8312-1812.52IE. 8713.2213.5613.9114.2614.6114.9615.3115.6616.0116.3716.7217.0817.4417.7918.1518.5018.8519.2219.5519.92
107.54110.16111.52112.79114.32115.76117.51118.78120.14121.67122.94124.60125.96127.45.128.76130.42131.78133.31134 . SG138.33137.46138.78139.87141.40142.32143.72144.68146.04147.00148.05149.19150.15150.98151.95152.95153.57154.40154.92155.53
156.15157.15157. 72.158.60159.12160.00160.52161.27161.92162.53163.98165.07
400.00400.00 -400.00400.00400.00400.00400.00 400.00400.00400.00400.00400.00400.00400.00400.00400.00400.00400. OQ400.00.400.00400.00400.00400.00400.00400.00400.00400.00400.00400.00400.00400.00400.00400.00400.00400.00400.00400.00400.00400.00400.00400.00400.00400.00400.00400.00400.00400.00400.00400.00400.00400. GO
1058111904132271455D15872171951851719839211612248423806251292645127774290963041931741330643438635708370303S35239675409974231943642449644628647609489325025451577529005422355545568685819159513608366215963482648046G1276745068773700967141972741740637533676708
189

DERIVED PROPERTIES
READING STRAINA
123456789
1011121314151617181920212223242526272829303132333435363738394041424344
0.00000.00280.00590.00920.01250.01590.01930.02280.02540.02890.03250.03610.03970.04330.0469C.05050.05410.05780.06140.06500.06860. 07220.07580.07940.08290.08650. 09010.09360.09720.1007 .0.10430.10780,11140.11490. 11850.12200.12550.12910. 13270. 13620.13980.14340.14700.1506
SIG1CkPa)
400.00431.60440.16445.40449.34452.34454.83456.21456.73457.91458.40458.85459.42459.95460.63461.05461.51462.05462.46463.06463.50464.01464.41464.99465.41465.92466.33-466.88467.18467.55467.81468.28468.46468.86469.04469.41469.58469.79470.04470.20470.30470.45470.62470.60
SIG3CkPa>
400.00400.00400.00400.00400.00400.00400.00400.00400.00400.00400.0040C.OO400.00400.00400.00400.00400.00400.00400.00400.00400,00400.00400.00400. .CO400.00.400.00400.00400.00400.00400.00400.00400.00400.00400.00400.0040G.OO400.00400.00400.00400.00400.00400.00400. 00400.00
TOTAL EFFECTIVE STRESS STRESS RATIO EFFSIG1 EFFSIG3 RATIO
1.001.081.101.111.121.131.141.141.141.141.151.151.151.151.151.151.151.161.161.161.161.161.161.161.161.161.171.171.171.17.1.171.171.171.171.171.171.171.171*181.181.181.181.181.18
CkPa)82.5199.2099.6699.2499.0598.9098.7298.3297.2297.3196.8596.3896.1995.9596.0396.0796.2196.2896.3496.7596.9097.2497.4697.9198.3798.7798.9699.5899.75100.15100.421-0 0 . 98101.22101.62101.73102.10102.34102.55102.84102.93103.09103.28103.32103.37
CkPa)82.5167.6059.5053.3449.7146.5643.8942.1140.4939.4138.4537.5336.7736.0035.4035.0234.7034.2233.8733.6833.4033.2433.0532.9232 . 9532.8632.6432.7032.5732.6032.6032.7032.7632.7632.7032.7032.7632.7632.7932.7332.7932 . 8332.7032.76
1.001.471.681.841.992.12
. 2.252.332.402.472.522.572.622.672.712.742.772.812.842.872.902.932.952.972.993.013.033.053.063.073.083.093.093.103.113.123.123.133.143.143.143.153.163.16
190

454647484950515253545556575859
0.15420.15780.16140.1651C : 3 387fl. 17240.17610.17970. 18340.18710.19070.1943.0.19810.20160.2053
DERIVED PROPERTIES
READING
j.23456789
1011121314
. 15161718192021222324252627232930.
A
0.000.000.951.081.051.051.071.293.120.921.922.071.321.45
0.890.900.690.880.860.310.650.320,470.22
-0.080. 190.54
-0.110.43
-0.09
470.. 69470.62470.60470.57470.71470.65470.73470.65470.72470.63470.64470.61470.55470.87471.00
Ccont . !
qCkPa)0.00
15.8020.0822.7024.6726.1727.4228.1128.3728.9529.2029.4229.7129.9730.3130.5230.7631. 0331.2331.5331.7532.0032.2132.5032.7132.9633.1633.4433.5933. .78
400.00400.00400.00400.00400.00400.00400.00400.-00400.00400.00400.00400.00400.00400.00400.00
P'
CkPa)32.5183.4079.5876.5474.3872.7371.3070.2168.3568.3667.6566.9566.4865.9865.7165.5465.4665.2565.1065.2285.1565.2465.2565.4265.6665.8265.8066.1466.1666.38
q/p'
0. 000.190.250.300.330.360.380.400.410.420.430.440.450.450.460.470.470.480.480.480.490.490.490.500.500.500.500.510.510.51
DEVIATOR STRESS ClrPa) 0.00
31.60 40.16 45.40 49.34 52.34 54.83 56.21 56.73 57.91 58.40 58.85 59.42 59.95 60.63 61.05 61.51 62.05 62.46 63.06 63.50 64.01 64.41 64.99 65.41 65.92 66.33 66.88 67.18 67.55
MEANEFFECTIVESTRESSCkPa)
82.51 78.14 72.88
. 68.97 66.15 64.01 62.17 60.85 59.40 58.71 57.92 57.15 56.58 55.99 55.61 55.37 55.20 54.91 54.69 54.71 54.57 54.57 54.52 54.58 54.76 54.83 54.74 54.99 54.96 55.12
191

3132333435363738394041424344454647434950515253545556575859
0.00-0.20-0.37.0.000.350.00
-0;360.00
-0.130.40
-0.68-0.200.753.61
-0.760.00
-4.14-3.320.00
-0.58-1.70-1.970.420.00
-8.733.43
-2.531.00
-0.47
33.9134.1434.2334.4334.5234.7034.7934.9035.0235.1035.1535.2335.3135.3035.3435.3135.3035.2835.3535.3335.3635.3235.3635.3235.3235.3135.2735.4335.50
66.5166.8466.9967.1967.2267.4067.5567.6667.81
,.67.8367.9468.0568.0168.0668.1768.1468.0367.9267.9967.9368.0967.9067.9067.8667.9268.0067.8167.6567.79
0.510.510.510.510.510.510.520.520.520.520.520.520.520.520.520.520.52D.520.520.520.520.520.52
. 0.520.520.520.520.520.52 .
67.8168.2868.4668.8669.0469.4169.5869.7970.0470.2070.3070.4570.6270.6070.6970.6270.6070.5770.7170.6570.7370.657C.7270.6370.6470.6170.5570.8771.00
55.2155.4655.5855.7155.7155.8355.9656.0356.1456.1356.2356.3156.2456.3056.3956.3756.2656.1656.2056.1556.3156.1256.1156.0858.1556.2456.0655.8455.95
192

on_
toa
350
325..
300. f
275.
250..
225..
200 .
175..
150..
125 .
100
75
50
25
00=3
EFFECTIVE SIGHA 1
EFFECTIVE Sim 3
DEVIATQR STRESS
SHEAR STRESS
MEAN EFFECTIVE STRESS
EXCESS PORE PRESSURE
! I I 1 I » I M I I M I I
mmmm&t
AXIAL STRAIN
GO-7, PC-52; 300/480193

TRI AXIAL TEST RESULTS
GENERAL TEST INFORMATION
SAMPLE INFORMATIONSAMPLE ID:
INTERVAL Cmeters):GENERAL LOCATION:
DESCRIPTION:DATE FINISHED:
GD-7, PC-52* 300/500G.43-6.55BALTIMORE-HUDSON CANYON AREAOLIVE-GRAY CLAY1/22/80
INDEX PROPERTIESMOISTURE CONTENT: 0.51
BULK DENSITY Cg/cc.) : 1.75VOID RATIO: 1.36
POROSITY: 0.58GRAIN SPEC GRAVITY Cg/cc) : 2.73
SAMPLE PARAMETERSHEIGHT Cmm): 100.00
DIAMETER Cmm) : 50.00AREA Csq. mm) t 1963.50
VOLUME Ccc): 196.35WEIGHT Cgm): 335.10
TEST RESULTS
^SATURATION PHASE*
READING CELL PRESSURE DELTA C PORE PRESSURE DELTA PkPa50.00100.00200.00300.00500.00
kPa
50.00100.00100.00200.00
kPa47.0097.00194.00292.00492.00
kPa
50.0097.0098.00
200.00
1.000.970.981.00
^CONSOLIDATION PHASE*
CELL PRESSURE CkPaD: 500.00BACK PRESSURE CkPa): 300.00
CONSOLIDATION PRESSURE CkPa): 200.00ASSUMED EFFECTIVE
OVERBURDEN PRESSURE CkPa): 45.98
194

CHANGES IN PROPERTIES DUE TO CONSOLIDATION
PROPERTY INITIAL VALUE CONSOLIDATED VALUEHEIGHT Cmm):
AREA Csq. mm):VOLUME Ccc):
WATER CONTENT:POROSITY:
VOID RATIO:BULK DENSITY CS/GC>:
BOUYANT BULK DENSITY Cg/cc):Z SATURATION:
100.001963.50196.35
0.510.581.361.750.72
100.00
96.001809.56173.72
0.510.511.041.750.72
100.00
MEASURED PROPERTIES
NG
1O
3A56789
10111213141516171819202122232425262728293031323334
TIMECsec)
01322264539675290661379359253
10581119031322514548158701719318515198372116022482238052512826-45027772290953041731739330613433335705370273835039672409944231743639
Log TIME
-4.003.123.423.603.723.823.903.974. 024.084.124.164.204.244.274.304.334.354.384.404.424.444.464.484.504.52.4.544.554.574.584.604.614.634.64
Sqrt TIME
0.0036.3651.4362 . 9872.7381.3289.0896.22102.36109.10115.00120.62125.98131.12136.07140.84145.46149.94154.29158.52162.63166.65170.57174.40178.15181.83185.43188.96192.42195.83199.18202.47205.71208.90
DVOLCcc)
0.00-0.00-0.00-0.01C.OO
-0.01-0.00-0.00-0.00-0.00-0.01-0.000.00
-0.01-0.00-0.00-0.01-0.01-0.000.00
-0.000.000.000.000.00
-O.QO0.01
-0.000.000.000.00
-o.coC.OOC.OO
195

35363738394041424344454647434950515253545556575859
4496146284476064892950260515835290654228555515687458196595196084262164634876481066133B745668779701027142572747740697539176714
4.654.674.684.694.704.714.724.734.744.754-. 764.774.784.794.804.814.824.834.844.854.354.864.374.884.88
212.04215.14218.19221.20224.19227.12230.01232.87235.69233.48241.24243.97246.66249.33251.97254.58257.16259.72262.26264.77267.25269.72272.16274.57276.97
-0.000.000.010.010.010.010.010.010.010.010.01
-0.000.000.010.010.010.010.010.010.000.010.010.010.020.02
ALPHA: 0.96Ao (sq. mm): 1809.56
Lo (mm): 38.00
%SHEAR PHASE*
CELL PRESSURE (kPa): 500.00 STRAIN RATE: .015 mm/min
MEASURED PROPERTIES
READING
12345678
DVOL(cc)0.00
-o.co-0.00-0.010.00
-0.01-0.00-0.00
PORP(JcPa)
294.46295.79296.47304.45343.93364.64378.26388.17
DLNGCmm)0.000.230.470.720.991.261.551.85
AXFOCN)
0.00-0.08-0.0427.26141.81172.72190.39203.79
CELP(kPa)
500.00500.00500.00500.00500.00500.00500.00500.00
TIME(sec)
. 01322264539675290661379359258
196

COT
rr^o
fO(jO
<T
i<M
mr**<
D<
Hv
co
co
i-ifOL
nr^
ocM
'q-c
Dcn
'Hto o* CM
LO co
^ to oo
*H ^j* co
^
^f* r*s o
^3* p^ o
po f*N
o
ro CQ en ro CD en CM CD CD
CM LO en ou to co ^
to GO ^
o. v^ f^ XT*
irt r**» o^ en *H
cvj ro to co r^
en o
TH ro
^t* to r**
co c^ o
c\j ro ^f co r*» co
o ^H CM
v* i/^i CD
co en o
c-» i ^ ^
-^^ .
-*>^ ^^
^ -
« w / -«r
ooooooooooooooooooooooooooooooooooooooooooooooooooo
ooooooooooooooooooooooooooooooooooooooooooooooooooo
ooooooooooooooooooooooooooooooooooooooooooooooooooo
ooooooooooooooooooooooooooooooooooooooooooooooooooo
LO LO
Irt Irt
LO U^
U") tf^
UO U^
U*) I/}
l/^ lO
U^) IO
trt IO
Lrt IO
U*) Lrt
IT^ IO
tf^ l/^
U") trt
l/^ I/)
I/1) \D
\D U1^
U^ IO
I/} I/1)
IO tO
tO UO
l/^ IO
IO U"^
LO lA
IO U')
IO
co co co "f
co o cvj i/^ CD r*** r^* ^?*
ou P*» ^r T^ co CD
o co *~*
^ to ^j* r*** ro CD o
^j TI* CD co ' H oj v cvj ^H CD to ^^ fo o
o CD uo oj o
co u^ en o
ro *^ co ''j* 01 ^r co *H *^ co oo o cvj r*o LO r** oo o
CM ro i/") r** co o ^ ro ^j* CD r** co en o
CM ro T* u*^ CD co r**» co en o TH TH csj ro v
^j* LO CD coO
JC
VJ
C\IC
MC
UC
MC
MC
MC
vJ
CM
CM
C\IC
MC
MC
MC
sJ
Cs
JC
MC
JC
MC
MC
MC
MC
MC
MC
MC
MC
^
cyw
cM
^ro
roT
rvvi/^
LO
u^cococo^r^
i^coooo^cnijjo
oo^T
HrH
CM
CM
CM
roro
r^vT
r^u";!^
ro en en oj CD w
en ^ CD M
"s CD co CM o
oj co o
P^ en irt
in ^ CM
co r^ v
P^ r^ ^ o
TS TH co ^ i^
co ^ en
cc co irt 10
^coro
cMro
ocN
jeD
vr^coLO
CM
Cnro
cofO
CM
iftcor^cn
rNoojcM
CvJC
MC
M ro ^
Ho
en
^H
^H
ocM
ior^
r^-o
oco
co
co
co
inco
co
co
oo
LO
^H
CO O
rO
C
OG
OC
n^
CM
r^
VlftL
OC
OC
Dr^
r^
I^f^
^^
f^C
OO
DW
CO
CO
CO
CO
WC
O^
WC
OC
OC
OC
OC
OC
OC
OC
OC
OC
QO
OC
OC
OO
C
OO
OT
^T
^T
^T
^^
^C
MC
MC
OC
MO
JC
MC
MC
MC
MC
MC
MC
MC
MC
MC
MO
JC
\JC
MC
MC
MC
MC
^J
CM
CM
CM
CM
CM
ooooooooooooooooooooooooooooooooooooooooooooooooooo
ooooooooooooooooooooooooooooooooooooooooooooooooooo
I I
I I
I I
I I
I I
I II
I I
I

DERIVED PROPERTIES
READING
123456789
1011121314151617181920212223242526272829303132333435363738394041424344
STRAINA
0.00000.00240. 00490.00750.0103C.01320.01620.01920.02240.02570.02900.03240.03580.03930.04280.04640.0500C.05360.05720.06080.06450.06810.07180.07550.07920. 08290.08660.09020.09390.09750.10120.10480.10840.11200.11560.1192C.12230.12640.12990.13350.13700.14060.14420.1477
SIG1CkPa)
500.00499.96499.98514.95577.56594.19603.78610.45615.51619.42622.81625.38627.77629.56631.33632.55633 . 68634.26634.79635.16635.58635.82636.15636.47636.82637.15637.34637.67637.80G38.20638.35638.74638.82639.07639.12639.21639.24639.25639.28639.27639.31639.28639.25639.07
SIG3CkPa)
500.00500.00500.00500.00500.00500.00500.00500.00500.00500.00500.00500.00500.00500.00500.00500,00500.00500.00500.00500.00500.00500.00500.00500.00500.00500.00500.00500.00500.00500.00500.00500.00500.00500.00500.00500. 0500.00500.00
. 500.00500.00500.00500.00500.00500.00
TOTALSTRESSRATIO
1.001.001.001.031.161.191.211.221.231.241.251.251.261.261.261.271.271.271.271.271.271.271.271.271.271.271.271.281.281.281.281.281.281.281.281.281.281.281.281.281.281.281.281.28
EFFECTIVE
EFFSIG1CkPa)205.54204.16203.50210.51233.63229.55225.53222.28219.78217.73216.42215.16214.41213.54213.04212.61212.22211.53210.93210.59210.35209.91209.79209.59209.53209.88203.75209.82210.04210.28210.63210.66210.55210.83210.85210.94211.04210.94211.17211.26211.33211.17211.07211.00
EFFSIG3.CkPa)205.54204.21203.53195.55156.07135.36121.75111.83104.2798.3193.6189.7886.6483.9881.7180.0678.5477.2776.1475.4374.7874.1073.6473.1272.7072.7472.4172.1572.2572.0972.2871.9271.7371.7671.7371.7371.80
. 71.7071.8971.9972.0271.8971.8371.92
STRESSRATIO
1.001.001.001.081.501.701.851.992.112.212.312.402.472.542.612.662.702.742.772.732.812.832.852.872.882.892.902.912.912.922.912.932.94.2.942.942.942.942.942.942.932.932.942.942.93
198

454647484950515253545556575859
DERIVED
. READING
123456739
101112131415161718192021222324252627282930
C.15130.15470.15820.16170.16530.16890.17240.17600.17960.18320.18680.19040. 19400.19750.2012
PROPERTIES
A
0.000.00
32.090.530.631.251.421.491.491.521.391.491.311.491.291.351.342.202.141.901.572.831.371.621.18
-0.101.730.77
-0.790.40
638.92638 . 56638.41638.11638.09637.80637.66637.35.637. 18636.90636.64636.38636.08636.11635 . 98
Ccont . ;
qCkPa>0.00
-0.02-0.017.48
38.7847.1051.8955.2357.7559.7161.4062.6963.8964.7865.6666.2866.8467.1367.3967.5867.7967.9168.0768.2368.4168.5768.6768.8468.9069. 10
50C.OO500.00500.00500.00500.0050-0.00500.00500.00500.00500.00500.00500.00500.00500.00500.00
)
P'
CkPa)205.54204.19203.52203.03194.85182.46173.64167.05162.03158.02155.01152.47150.53148.76147.38146.34145.38144.40143.53143.01142.56142.00141.72141.36141.11141.31141. P8140.99141.15141.18
1.281.281.281.281.281.281.281.271.271.271.271.271.271.271.27
q/p'
0.00-0.00-0.000.040.200.260.300.330.360.380.400.410.420.440.450.450.460.460.470.470.480.480.480.480.480.490.490.490.490.49
210.71209.96209.65209.36209.23208.95208.84208.50
. 208.49208.33207.82207.56207.20207.10206.93
DEVIATORSTRESSCkPa)0.00
-0.04-0.0214.9577.56S4.19103.78110.45115.51119.42122.81125.38127.77129.56131.33132.55133.68134.26134.79135.16135.58135.82136.15136.47136.82137.15137.34137.67137.80138.20
71.8071.4171.2471.2471.1571.1571.1871.1571.3171.4471.1871.1871.1170.9870.95
MEAN
2.932.942.942.942.942.942.932.932.922.922.922.922.912.922.92
EFFECTIVESTRESSCkPe)
205.54204.19203.52200.54181.93166.76156.34148.64142.78138.12134.54131.58129.23127.17125.49124.24123.10122.03121.07120.48119.97119.37119.02118. Gl113.31118.45118.19118.04118.18118.15
199

3132333435363738394041424344454647484950515253545556575859
-1.310.91
2.39-0.130.580.00
-2.2119.14-7.0625.12-0.95.-5. 06-1.930.56
-0.83-1.08-1.110.00
-3.650.000.24
-0.100.980.45
-1.010.00
-0.224.25
-0.24
69.1769.3769.4169.5369.5669.61S9.6269.6269.6469.6469.6569.6469.6269.5469.4669.2869.2069.0669.04
. 68.9068.8368.6768.5968.4568.3268.1968.0468. C667.99
141.45141.29141.14141.30141.29141.34141.42141.32141.5314.1.62141.67141.53141.45141.46141.25140.68140.45140.30140.19140.05140.01139.82139.90139.89139.50139.37139.15139.04138.94
0.490.490.490.490.490.490.490.490.490.490.490.49'0.490.490.490.490.490.490.490.490.49.0.490.490.490.490.490.490.490.49
138.35138.74138. 82139.07139.12139.21139.24139.25139.28139.27139.31139.28139.25138.07138.92138.56138.41138.11138.09137.80137.66137.35137.18136.90136.64136.38136.08136.11135.98
118.40118.17118.00118.12118.10113.13118.21118.11118.32118.41118.46118.32118.24118.28118.10117.59117.38117.28117.17117.08117.07116.93117.04117.07116.73116.64116.47116.35116.28
200

EFFECTIVE SIGMA 1
EFFECTIVE SIGMA 3
DEVIATOR STRESS
SHEAR STRESS
MEAN EFFECTIVE STRESS
EXCESS PORE PRESSURE
1 I I 1 I 1 1 I I M » I I I < < I I II
iiiIi>i i i i i i
O t> Q D 0 O O Q-O O-O OOP O'Q Q Q Q Q n .Q Q Q'Q Q Q n-f
GO-7, PC-52: 380/509
AXIAL STRAIN
2D1

100
75.
50..
25,.
eaCCJ
en 0=3CT)
G)-7f PC-52; 382/350, 400, 500202

DEY1ATOR S
TRES
SCO
tn
CO
eg CO
CO
CO
en
ts?
CD
300

TRIAXIAL TEST RESULTS
GENERAL TEST INFORMATION
SAMPLE INFORMATIONSAMPLE ID:
INTERVAL (meters):GENERAL LOCATION:
DESCRIPTION:DATE FINISHED:
GD-9, PC-53; 300/370 9.48-9.60BALTIMORE-HUDSON CANYON AREA OLIVE-GRAY CLAY .1/25/80
INDEX PROPERTIESMOISTURE CONTENT: 0.48
BULK DENSITY Cg/cc): 1.77VOID RATIO: 1.27
POROSITY: 0.56GRAIN SPEC GRAVITY Cg/cc): 2.72
SAMPLE PARAMETERSHEIGHT Cmm): 100.00
DIAMETER Cmm): 50.00AREA Csq. mm): 1963.50
VOLUME Ccc): 196.35WEIGHT Cgm): 344.90
TEST RESULTS
^SATURATION PHASE*
READING CELL PRESSURE DELTA C PORE PRESSURE DELTA PkPa50.00100.00150.00200.00300.00
kPa
50.0050.0050.00100.00
kPa49.5598.56147.80137.16297.95
kPa
49.0149.2449.36100.79
0.980.980.991.01
^CONSOLIDATION PHASE*
CELL PRESSURE CkPe): 37C.OOBACK PRESSURE CkPa): 300.00
CONSOLIDATION PRESSURE CkPa): 70.00ASSUMED EFFECTIVE
OVERBURDEN PRESSURE CkPa): 69.69
204 -
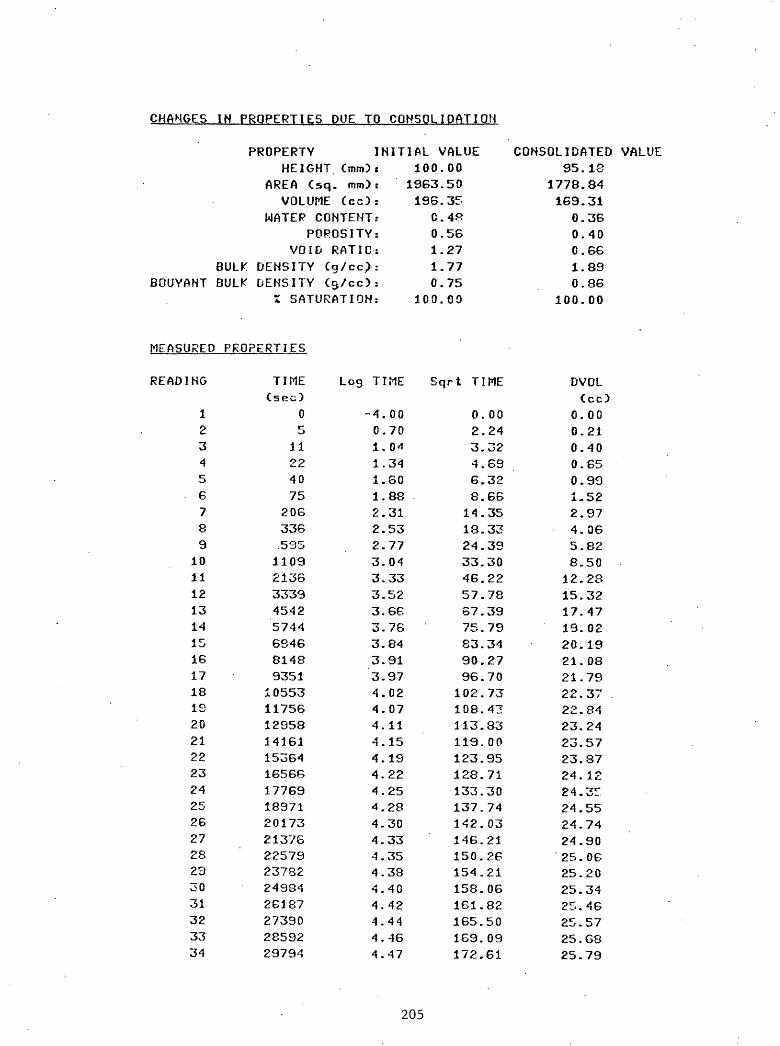
CHANGES IN PROPERTIES DUE TO CONSOLIDATION
PROPERTYHEIGHT
AREA Csq. mm)VOLUME Ccc):
MATEP CONTENT:POROSITY:
VOID RATIO:BULK DENSITY Cg/cc>:
BOUYANT BULK DENSITY C^/cc):Z SATURATION:
INITIAL VALUEs:
:
:
:
:
:
;
100.001963.50196.35
C.4P0.561.271.770.75
100.00
CONSOLIDATED VALUE95.18
1778.84169.31
0.360.400.661.890.86
100.00
MEASURED PROPERTIES
KG
123456789
10111213141516171819202122232425262728233031323334
TIME(sec)
05
11224075
206336535110921363339454257446S46814893511055311756129581416115364165661776918971201732137622579237822498426187273902859229794
Lo9 TIME
-4.000.701.041.341.601.882.312.532.773.043.333.523.663.763.843.913.974.024.074.114.154.194.224.254.284.304.334.354.384.404.424.444.464.47
Sqrt TIME
0.002.243.324.696.328.6614.3518.3324.3933.3046.2257.7857.3975 . 7983.3490.2796.70102.73108.43113.83119. 00123.95128.71133.30137.74142.03146.21150.26154.21158.06161.82165.50169.09172.61
DVOLCcc)
0.000.210.400.650.991-522.974.065.828.5012.2815.3217.4719.0220.1921.0821.7922.37 .22.8423.2423.5723.8724. 1224. 3^24.5524.7424.9025.0625.2025.3425.4625.5725.6825.79
205
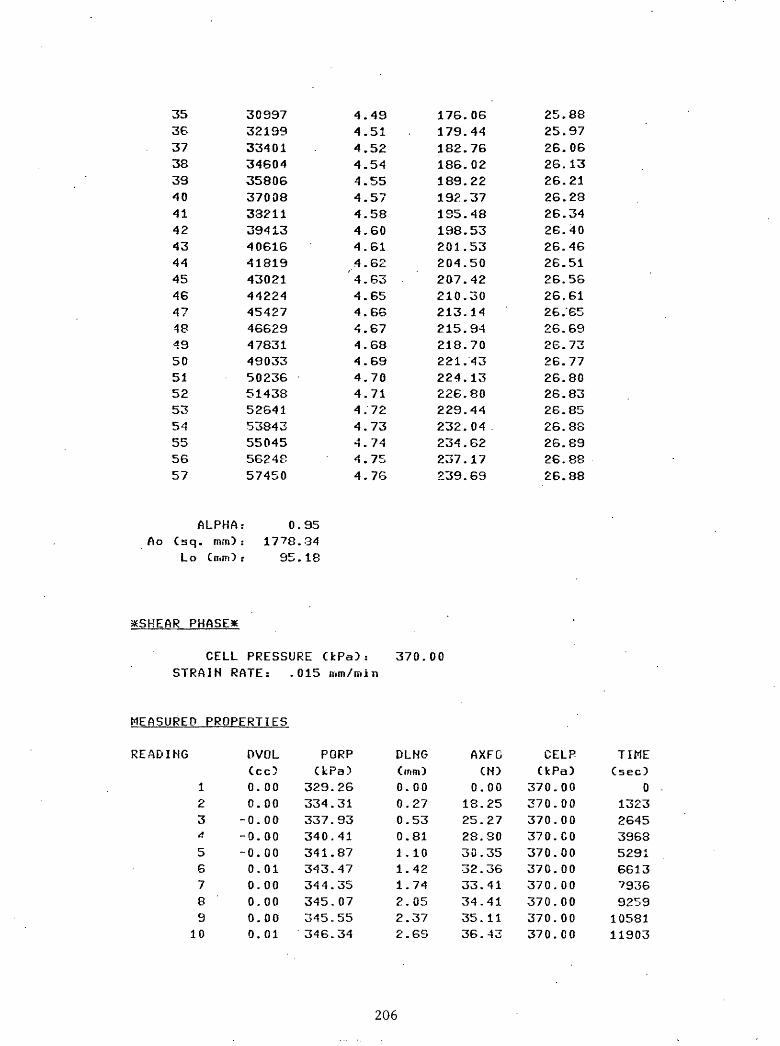
3536373833404142434445464748495051525354555657
3099732199334013460435806370083321139413406164181943021442244542746629478314903350236514385264153843550455624857450
4.494.514.524.544.554.574.584.604.614.62
' 4 . 634.654.664.674.684.694.704.714.724.734.744.754.76
176.06179.44182.76186.02189.22192.37195.48198.53201.53204.50207.42210.30213.14215.94218.70221.43224.13226.80229.44232.04234 . 62237.17239.69
25.8825.9726.0626.1326.2126.2326.3426.4026.4626.5126.5626.6126.6526.6926.7326.7726.8026.8326.8526.8826.8926.8826.88
ALPHA: 0.95Ao Csq. mm): 1778.34
Lo Cmm) -. 95.18
&SHEAR PHASE*
CELL PRESSURE CkPa): STRAIN RATE: .015 mm/min
370.00
MEASURED PROPERTIES
READING
123£
56789
10
DVOLCcc}0.000.00
-0.00-0.00-0.000.010.000.000.000.01
PORPCkPa}
329.26334.31337.93340.41341.87343.47344.35345.07345.55346.34
DLNGCmm)0.000.270.530.811.101.421.742.052.372.69
AXFCCM)
0.0018.2525.2728.3030.3532.3633.4134.4135.1136.43
CELPCkPa)
370.00370.00370.00370. CO370.00370.00370.00370.00370.00370.00
TIMECsec)
013232645396352916613793692591058111903
206

fO v
ID r^
co en
«H CM
^
10 CD
r** cnor^
i^vi/^
r^cocn*H
Cvjrvo
v"C
ors"C
oo«~
<cvj'|j"in
cDC
C|cnoc
>jr9'i''"C
DfNi
Coo»H
cvj^j" *H
«H TH
<H rH
THC
MC
MC
MC
MC
MC
MC
sj rO fO
f*3 f?
fO fO
fO ro
v'T
V'|j"T
r^rTru
OLO
uotr)i/^i/)if)iO
CjO
CD
CD
CD
cO
CD
cD
r>»/>s>
p>
r^
OO
OO
OO
OO
OO
OO
OO
OO
OO
OO
OO
OO
OO
C3
OO
OO
OO
OO
OO
OO
OO
OO
OO
OO
ooooooooooooooooooooooooooooooooooooooooooooooo
ooooooooooooooooooooooooooooooooooooooooooooooo
\f) £j"i
if) VH
CM O
P3
o
O
TH ^H
fO
P"* O
CD
CD v
Lrt CD
CD CC*
^" o
fO
CVJ
CM o
CO
00 O
J CJ
CD ID
tO
CO
^J" CD
CO CD
CO U*)
f^
if) fO
*^
UO f*Q
lO
CD TH
y*) CO
*H
^^ Cvj
^J" xy*
*r CM
c\J CJ
CO o
CO
CO l**)
o
CO CD
*""* o
^j*
TH f*>
cxj CD
U*) CvJ
^
^TH LD
CO o
T*I
o
*H
f^O CD
o
CD o
TH
*H o
r^ CO
o
^^ ^|
XT* u^
CO ^*
00 CD
C3 TH
CM CVJ
^" Tf*
u^ CD
r^» r^
00 CD
O o
*H
TH
CVJ Cvj
fO
1"
^/* IO
LO
LO CD
CO CO
CD l/^
^T" IO
XT
if) LO
IO
tD
(^^T
j-^T
t*T
r^rT
rVT
rVL
^L
nb
^t/^
U^L
^U
^lO
l/^l/^
bO
ulC
OC
O(jO
CO
CD
CD
CJ3
CO
CD
CD
CD
CO
C^
ro CD o 10 CD ^f* o
ij*) o1 u*) o
if) TH CD CM p** ro co ro oo ro OD ro co ro co ro co ro r^* CM r** cj r^ CM r** CM r^ CM r*> T^ ^* CM r^ c^j CD TH
ro ro ro xr v v 10 u*) 10 co co CD ^^ r^ P** co co co CD CD o
o o TH TH TH CM CM CM fo f^ ro ^i* ^f
xj* uo uo u^ CD co ^* r^ r^ co co co en
ro CM
TT
or^
cM
cD
^O
D^T
HO
jvco
vu
^cM
vO
DO
To
jTH
Oic
ocM
CM
CD
oo
i/^o
cD
CD
CT
iLO
CD
roro
cD
o
ro ID
en tn
CD CM
r** r^-
cd r-'
rx rs
r^' cd
cd cd
cd en
cd cd
cd cd
en cd
cd en
cd cd
cd cd
cd cd
cd cd
cd cd
cd co
cd cd
cd cd
cd cd
cd cd
r^ cd
cd cd
cd cd
cd r-.'
r^'
ooooooooooooooooooooooooooooooooooooooooooooooo
ooooooooooooooooooooooooooooooooooooooooooooooo
I I
I I
I 1
I I
o<N
TH (M

DERIVED PROPERTIES
READING
123456789
101112131415ie171819202122232425262728293031323334353637383940414243444546
STRAINA
0.00000.00280.00580.00850.01160.01500.01830.02150.02490.02830.03180.03530.03890.04250.04620.04990.05350.05720.06090.06460.06830.07200.07570.07950. 08320.08690.09060.09430.09800.10170.10540. 10910.11270.11640.12010.12380. 12750. 13110.13480.13840.14210.14570.14940. 15310.15680.1604
SIG1CkPa)
370.00380.23384.13386.05386 . 86387.92388.44388.93389.25389.90390.44391.14391.69392.34392.96393.56394.06394.48395.02395.45395.88396.20396.64397.01397.25397.75398.03338.43398 . 59398.83399.10399.37339.48399.82399.89400.10400.26400.42400.63400.77400.97401.10401.15401.20401.23401.17
SIG3CkPa)
370.00370.00370.00370.00370.00 .370.00370.00370.00370.00370.00370.00370.00370.00370.00370.00370.00370.00370.00370. 00370.00370.00370.00370.00370.00370.00370.00370.00370.00370.00370.00370.00370.00370.00370.00370.00370.00370.00370.00370.00370.00370. CO370.00370.00370. 00370.00370.00
TOTAL EFFECTIVE STRESS STRESS RATIO EFFSIG1 EFFSIG3 RATIO
1.001.031.041.041.051.051.051.051.05 .1.051.061.061.061.061.061.061.071.071.071.071.071.071.071.071.071.031.081.081.081.031.081.081.081.081.C81.081.081.081.081.081.081.081.081.081.081.08
CkPa340.7445.9246.2045.6444.9944.4544-0943.8643.6943.56
. 43.7144.1244.2544.5445. 0945.2345.8045.8346.2446.4146.9747.3247.7048.3348.2049.1049.3249.3349.7150.1550.4850.5650.8951.1451.4651.3951.7851.7152.1852.2852.3952.6152.5752.7552.8752.94
CkPa)40.7435.6932.0729.5928.1326.5325.6524.9324.4523.6623.2722.98
. 22.5622.2022.1321.68 .21.7421.3521.2220.9621.0921.1221.. 0621.3220.9621.3521.2920.9621.1221.3221.3821.1921.4221.3221.5821.2321.5121.2921.5521.5121.4221.5121.4221.5521.6421.77
1.001.291.441.541.601.681.721.761.791.841.S81.921.962.012.042.092.112.152.182.212.232.242.272.272.302.302.322.362.352.352.362.332.382.402.392.412.412.432.422.432.452.452.452.452.442.43
208

47 , 48
49 50 51 52 53 54 55 5657
DERIVED
READING
123456789
10111213141516171819202122232425262728293031323334
0.1641 401.11 0.1677 400.91 0.1715 400.83 0.1752 400.32 0.1787 399.39 0.1825 399.90
. 0.1862 399.72 0.1899 399.62 0.1935 399.52 0.1971 399.400.2007 399.22
PROPERTIES
A
0.490.490.931.291.811.511.701.451.531.200.720.420.770.550.100.77
-C.13-0.930.240.60
-0.30-0.100.15
-0.701.55
-0.770.230.82
-1.C2-0.83-0.240.73
-2.060.29
Ccont . }
qCkPa)0.005.127.068.038.438.969.229.469.629.9510.2210.5710.8511.1711.4811.7812.0312.2412.5112.7312.3413. 1013.3213.5113.6213.8314.0214.2214.3014.4114.5514.6814.7414.91
370.00 370. 00 370.00 370.00 370.00 370.00 370.00 370.00 370.00 3.70.00370.00
P'
C k Pa )40.7440.8039.1337.6236.5635.4934.8734.4034.0733.6133.4333.5533.4033.3733.6133.4533.7733.5933.7333.6934.0334.2234.3834.8234.5835.2335.3035.1835.4235.7335.9335.8736.1536.23
11111111111
.08
.08
.08
.08
.08
.08
.08
.08
.08
.08
.08
52.52.52.52.51.51.51.51.51.51.51.
8862932953322642204435
21.21.22.21.21.21.21.21.21.22.22.
7771103755425581680313
2.2.2.2.2.2.2.2.2.2.2.
4342403839403836363332
MEANDEVIATOR
q/p' STRESSCkPa)
000000000000000C0000C0000000000000
.00
.13
.13
.21
.23
.25
.26
.28
.28
.30
.31
.32
.32
.33
.34
.35
.36
.36
.37
.38
.38
.38
.39
.39
.39
.39
.40
.40
.40
.40
.40
.41
.41
.41
0.10.14.16.16.17.18.18.13.19.20.21.21.22.22.23.24.24.25.25.25.26.26.27.27.27.28.28.28.28.29.29.29.29.
002313053692449325904414693496560648 .02453820640125750343598310374882
EFFECTIVESTRESSCkPa)
40.33.36.34.33.32.31.31.30.30.30.30.29.29.29.29.29.29.29.29.29.29.-29.3a.30.30.30.30.30.30.31.30.31.31.
7410789475508024863009037964795376515644728694 -3204606344659308982426
209

3536373839404142434445464748495051525354555657
-3.861,34
-1.431.44
-1.240.240.48
-0.761.92
-2.63-3.302.140.00
-0.354.65
-0.25-1.29-1.560.702.63
-1.333.100.53
14.9415.0515.1315.2115.3215.3815.4915.5515.5815. GO15.6215.5815.5515.4615;4215.1614.9914.9514.8614.8114.7614.7014.61
36.5236.3436.6436.5036.8636.9036.9037.0636.99'37.1537.2637.3637.3337.1737.5237.1336.5436.3736.4036.6136.4436.7436.74
0.410.410.410.420.420.420.420.420.420.420.420.420.420.420.410.41'0.410.410.410.400.410.400.40
29.8930.1030.2630.4230.6330.7730.9731.1031.1531.2031.2331 . 1731.11.30.9130.3330.3229.9929.9029.7229.6229.5229.4029.22
31.5431.3231.6031.4331.7631.7731.7431.8831.8031.9532.0532.1632.1432.0132.3832.0731.5431.3831.4531.6331.5231.8431.87
210

EFFECTIVE SIGMA 1
x EFFECTIVE SIGMA 3
DEVIATOR STRESS
SHEAR STRESS
MEAN EFFECTIVE STRESS
i i I 1 i i » » * < < I I I a I I I I i t I I i I I i i I I I I l
EXCESS PORE PRESSURE
AXIAL STRAIN
GO-9, PC-53: 300/370
211

TRIAXIAL TEST RESULTS
GENERAL TEST INFORMATION
SAMPLE INFORMATIONSAMPLE ID: GD-9, PC-53; 300/440
9.60-9.72BALTIMORE-HUDSON CANYON AREA OLIVE-GRAY CLAY 1/25/80
INTERVAL Cmeters)*GENERAL LOCATION:
DESCRIPTION:DATE FINISHED:
INDEX PROPERTIESMOISTURE CONTENT: 0.50
BULK DENSITY Cg/cc): 1.75VOID RATIO: 1.33
POROSITY: 0.57GRAIN SPEC GRAVITY Cg/cc) .- 2.7?
LIQUID LIMIT C%): 44.00PLASTIC LIMIT C%) : 20.00
SAMPLE PARAMETERSHEIGHT Cmm): 100.00
DIAMETER Crnm) : 50. OC
AREA Csq. mm): 1963.50VOLUME Ccc): 19S.35WEIGHT Cgm): 347.50
TEST RESULTS
^SATURATION PHASE*
READING CELL PRESSURE DELTA C PORE PRESSURE DELTA PkPa50.00100.00150.00200.00300.00
kPa
50.0050.0050.00
100. 00
LPa49.2599.35148.59198.59298.54
kPa
50.1049.2450.0099.95
1.000.981.001. 00
^CONSOLIDATION PHASE*
CELL PRESSURE CkPa): 440.00BACK PRESSURE (kPa)r 300.00
CONSOLIDATION PRESSURE CkPa) : 140.00ASSUMED EFFECTIVE
OVERBURDEN PRESSURE CkPa): 68.96
212

CHANGES IN PROPERTIES DUE TO CONSOLIDATION
PROPERTY I!HEIGHT Cmm>i
AREA Csq. mm) :VOLUME Ccc):
WATER CONTENT:POROSITY:
VOID RATIO:BULK DENSITY Cg/cc):
BOUYANT BULK DENSITY Cg/cc) :Z SATURATION:
IAL VALUE100.001963.50196.35
0.50.0.571.331.750.73
100.00
CONSOLIDATED VALUE94.03
1736.15163.26
0.350.400.661.900.88
100.00
MEASURED PROPERTIES
HG
123A5878o
10111213141516171819202122232425262728293031323334
TIMECsec)
05
11224074
141
27153010442071 .32744476567968318083928610488 '11691128931409615299165011770418906201082131122514237162491926122273252852729729
Log TIME
-4.000.701.041.341.601.872.152.432.723.023.323.523.653.753.843.913.974.024.074.114.154.184.22 .4.254.284.304.334.354.334.404.424.444.464.47
Sqrt TIMc
0.002.243.324.696.328.6011.8716.4623.0232.3145.5157.2266.9075.3682.9589.9196.36102.41108.12113.55118.73123.69128.46133.06137.50141.80145.98150.05154. CO157.86161.62165.30168.90172.42
DVOLCccD
0.000.220.460.771.241.973.114.907.6611.7517.43£1.8124.7026.6527.9928.9329.6030.1030.4730.7731.0031.1931.3531.4931.6131.7131.8031.8831.9632.0332.0932.1532.2132.26
213

3536373839404142434445464748495051525354555657
3Q?1232134333363453835741369433814639348405514175442956441594536246564477664896850171513735257653778549805618357385
4.494.514.524.544.554.574.584.594.61
, 4 . 624.634.654.664.674.684.694.704.714.724.734.744.754.76
175.87179.26182.58185.84189.05192.21195.31198.36201.37204.34207.26210.14212.98215.79218.55221.29223.99226.66229.29231.90234.48237.03239.55
32.3132.3632.4032.4432.4832.5232.5632.6032.6332.6632.6932.7232.7532.7832.8132.8432.8732.8932.9.132.9432.9632.9632.97
ALPHA: 0.94Ao Csq. mm): 1736.16
Lo Cmm): 94.03
SSHEAR PHASE*
CELL PRESSURE CkPa): STRAIN RATE: .015 mm/min
440.00
MEASURED PROPERTIES
READING
123456789
10
DVOLCcc)0.000.000.00
-0.00O.CO0. 010.010.010.010.01
PORPUPo)
349.44363.81372.99379.48384.18387.65390.45392.48394.10395 . 56
DLNGCfnirO0.000.290.580.891.201.521.852.182.512.85
AXFOCN:
0.0024.1137.4946.5553.2058.3262.3065.1066.3767.90
CELPCkPa)
440.00440.00440.00440. 00440. 00440. 00440.00440. 00440. 00440. 00
TIMECsec)
013232645396852916G1379369258
1058111903
214

1112131415161718192021222324252627282930313233343536373839404142434445464748495051525354555657
0.020.020.020.020.020.020.020.020.020.020.020.020.02O.C20.020.020.02O.C20.020.02-0.020.030.030.020.030.030.030.030.030.030.030.030.030.030.030.030.020.020.020.020.010.010.010.010.010.010.00
396.55397.60398.23399.09399.57399.98400.46400.81401.09401.44401.64401.83401.92402.11402.14402.18402.21402.33402.49402.46402.43402.46402.33402.43402.62402.46402.49402.^9402.62402.65402.62402.72402-84402.78402.87402.94403.10403.03402.91402.72403.07403.07403.26403.29403.19403.26403.16
3.203.543.894.244.584.945.285.64 -5.996.346.707.047.397.748.098.448.799.149.489.8310.1710.5210.8611.2011.5511. 9C12.2412.5912.9313.2713.6213.9714.3214.6615.0115.3715.7216.0816.4416.8017.1517.5017.8618.2118.5718.9419.29
69.2170.5771.8873.4174.9076.6178.0579.4580.9482.3083.6584.7086.0687.3388.4289.5690.6191.7592.6293.6794.5495.5196.3097.1798.2698.8399.58100.32101.02101.59102.29102.73103.34103.60103.91103.69104.00103.65103.47102.03101.41101.02101.02100.93100.98100.93100.71
4^0.00440.00440.00440.00440.00440.00440.00440.00440.00440.00440.00440.00440.00440.00440.00440.00440.00440.00440.00440.00440.00440.00440.00440.00440.00440.00440.00440.00
. 440.00440.00440.00440.00440.00440.00440.00440.00440.00440.00440.00440.00440.00440.00440.00440.00440.00440.00440.00
132261454815871171931851619839211612248423807251302645227775290983042131744330673438935712370343835639678410004232343645449674629047612489355025751580529035422555548568705819359515608376215963482G480466126674496877170094714167273974061
215

DERIVED PROPERTIES
READING STRAINA SIG1 SIG3
. TOTAL EFFECTIVE STRESS STRESS RATIO EFFSIG1 EFFS7G3 RATIO
CJcPa) CkPa)123456789
10111213141516171C192021222324252627
. 28293031323334353637383940414243444546
0.0.0.0.0.0.0.0.0.0.o..0.0.0.0.0.0.0.0.0.0.0.0.0.0.0.0.0.0.0.0.0.0.0.0.0.0.0.0.0.0.0.0.0.0.0.
0000003100620094012801610196023202670303034003770413045004870525056206000637067407120749078608230861089809350972100910451082111811551191122812651302133913751412144914851523156015971634
440.00453.84461.46466.56470.25473.05475.18476.63477.21477.92478.51479.12479.69480.38481.04481.81482.43483.02483.65484.21484.75485.13485.67486.16486.55486.95487.31487.71487.97488.31488.57488.86489.06489.30489.65489.73489.89490.05490.18^90.25490.38490.38490.46490.37490.29489.96
440.440.440.440.440.4'40.440.440.440.440.440..440.440.440.440.440.440.440.440. 440.440.440.440.440.440.440.440.440.440.440.440.440.440.440.440.440.440.440.440.440.440.440.440.440.440.440.
00000000QO0000000000000000000000000000000000000000000000000000000000000000000000000000000000
1.1.1.1.1.1.1.1.1.1.1.-1.1.1.1.1.1.1.1.1.1.1.1.1.1.1.1.1.1.1.1.1.1.1.1.1.1.1.1.1.1.1.1.1.1.1.
00030506070808080809090909090910101010101010101011111111111111111111111111111111111111111111
CkPa)90.5690.0488.4787.0886.0785.4084.7384.1533.1182.3681. £681.5281.4681.29
. 81.4781.8381.9782.2182 . 5582.7683.1283.3183.7584.0584.4084.7385.1035.3885.4785.8586.1486.4086.7386.8787.03.87.2687.4087.5687.5687.6087.7687.6787.6287.5987.4287.02
CkPa)90766760555249474544434241404040393938383838383737373737373737373737373737373737373737373737
.56
.20
.01
.52
.32
.35
.56
.52
.90
.44
.45
.40
.77
.91
.43
.02
.54
.19
.91
.56
.37
.18
.08
.89
.86
.83
.79
.67
.51
.54
.57
.54
.67
.57
.38
.54
.51
.51
.38
.35
.38
.29
.16
.22
.13
.06
1.001.181.321.441.541.631.711.771.811.851.891.921.951.992.022.042.C72.102.122.152.172.182.202.222.232.242.252.272.282.292.292.302.302.312.332.322.332.332.342.352.352.352.362.352.352.35
216

47 48495051525354555657
DERIVED
READING
123456789
10111213141516171819202122232425262728293C31323334
0.1672 0.17100.17480.17860.18230.18620.18990 . 19370.19750.20140.2051
PROPERTIES
A
1.041.041.211.271.271.241.311.402.312.041.681.731.101.250.720.540.770.590.450.630.350.500.180.390.080.080. 090.320.62-0.09-0.130.11-0.630.40
489.88 489.49489.18438.27487.76487.35487.14486.87486.67486.43486.11
Ccont . !
CkPa50.006.9210.7313.2815.1316.5217.5918.3118.6018.9619.2619.5619.8520.1920.5220.9021.2221.5121.8222.1022.3822.5722.3423.0823.2723.4823.6623.8523.9824.1624.2824.4324.5324.65
440.00 440.00440.00440.00440.00440.00440.00440.00440.00440.004,40.00
P'
CkPa)90.5683.1277.7473.8070.9468. 8867.1465.8464.5063.4062.7161.9661.6161.1060.9560.9260.7660.7060.7360.6660.7460.7460.9160.9761.1361.3061.4561.5261.4991.7061.8561.9762.2062.22
1.111.111.111.111.111.111.111.111.111.111.10
q/p'
0.000.080.140.180.210.240.260.280.230.300.310.320.320.330.340.34.0.350.350.360.360.370.370.370.380.380.380.380.39Q.390.390.390.390.390.40
86, 7986.4686.2785.5584.7084.2983.8883.5983.4883.1732 . 95
PEVIATORSTRESS
CkPa)0.00
13.8421.4626.5630.2533.0535.1836.6337.2137.9238.5139.1239.6940.3841.0441.8142.4343.0243.6544.2144.7545,13 45.6746.1646.5546.9547.3147.7147.9748.3148.57 48.8649.0649.30
36.90 23S.97 237.09 237.29 236.94 236.94 . 236.74 236.71 236.01 236.74 236.34 2
MEANEFFECTIVESTRESSCkPa)
80.5680.8174.1669.3865 . 9063.3761.2859.7358.3057.0856.2955.44
.55.0054.3754.1153.9653.6953.5353.4653.2953.2853.2253.3053.2753.3753.4853.5653.5753.50.53.6453.7653.8354.0254.00
.35
.34
.33
.29
.29
.28
.28
.28
.27
.26
.25
217

35363738394041.42434445464748435051525354555657
0.55-2. 020.200,000.94-.0.46
-0.25-81.05
1.650.7C
-1.30-0.19-2.010.160.400.21
-0.690.00
-0.87-0.120.48
-0.260.30
24.8224.8624.9425.0225.0925.1325.1925.1925.2325.1825.1524.9824.9424.7524.5924.1323.8823.6823.5723.4423.3423.2123.05
62.2062.4062.4562.5362.4762.4862.5762.4862.39
,.62.4062.2762.0461:8461.7161.6861.4260.8260.6160.3160.1560.1459.9659.89
0.400.400.400.400.400.400.400.400.400.400.400.400.400.400.400.390.390.390.390.390.390.390.38
49.6543.7349.8950.0550.1850.2550.3850.3850.4650.3750.2949.9649.8849.4949.1848.2747. 7S47.3547.1446.8746.6746.4346.11
53.9354.1154.1454.1954.1154.1054.1754.0853.9854.0153.8953.7253.5353.4653.4953.3752.8652.7252.4652.3452.3752.2252.21
218

* EFFECTIVE SIGHA 1
* EFFECTIVE SIGMA 3
* DEVIATOR STRESS
SHEAR STRESS
MEAN EFFECTIVE STRESS
° EXCESS PORE PRESSURE
B.OOOOOOOOOO o-o o o o o o-
AXIAL STRAIN
GO-9, PC-53; 300/440
219

TRIAXIAL TEST RESULTS
GENERAL TEST INFORMATION
SAMPLE INFORMATIONSAMPLE ID:
INTERVAL (meters)rGENERAL.LOCATION:
DESCRIPTION:DATE FINISHED:
GD-9, PC-53; 300/5809.72-9.84BALTIMORE-HUDSON CANYON AREAOLIVE-GRAY CLAY1/25/80
INDEX PROPERTIESMOISTURE CONTENT: 0.51
BULK DENSITY Cg/cc): 1.75VOID RATIO: 1.35
POROSITY: 0.58GRAIN SPEC GRAVITY Cg/cc): 2.72
SAMPLE PARAMETERSHEIGHT Cmm): 100.00
DIAMETER Cmm): 50.00AREA Csq. mm): 1963.50VOLUME Ccc3: 196.35WEIGHT CgnO: 340.00
TEST RESULTS
^SATURATION PHASE*
READING CELL PRESSURE DELTA C PORE PRESSURE DELTA PkPa50.00100.00150.00200. 00300.00
LPa
50.0050.0050.00100.00
kPa47.6496.68145.27194.57292.98
kPa
49.0448.5949.3098.41
0.980.970.990.98
^CONSOLIDATION PHASE*
CELL PRESSURE CkPa): 580.00BACK PRESSURE CkPa): 300.00
CONSOLIDATION PRESSURE CkPa): 280.00ASSUMED EFFECTIVE
OVERBURDEN PRESSURE Cl-Pa): 69.03
220

CHANGES IN PROPERTIES DUE TO CONSOLIDATION
PROPERTY
VOLUME WATER CO
POR VOID
BULK DENSITY Cg/cc): BOUYANT BULK DENSITY Cg/cc>:
X SAT
MEASURED PROPERTIES
READING
123456789
10111213141516171819202122232425262728293031323334
TIMECsec)
05
12224175
142272531104520723275447756806882808492871048911692128941409715300165021770518907201102131322516237182492126124273272852929731
INITIAL VALUE(mm)mm)Ccc)ITENTiSITYAT 10/cc)/cc>TION
Log
s
:
:
l :
: i
1:
T I ME
100.001963.50196.35
0.510.581.351.750.72
100.00
CONSOLIDATED VALUE
Sqrt TIME
92.1673.154.
0.0.0.1.0.
100.
323448323861949100
DVOLCcc)
- 4011112223333333344444444444444444
.00
.70
.08
.34
.61
.88
.15
.43
.73
.02
.32
. 5°
.65
.75
.84
.91
.97
.02
.07
.11
.15
.18
.22
.25
.28
.30
.33
.35
.38
.40
.42
.44
.46
.47
0.2.3.4.6.8.
11.16.23.32.45.57.66.75.82.89.96.
102.108.113.118.123.128.133.137.141.145.150.154.157.161.165.168.172.
002446694066.92490433522391379691374213557369460650819905018663319143
0.0.0.0.1.2.3.5.9.
13.20.26.30.33.34.36.36.37.33.38.38.39.39.39.39.39.39.40.40.40.40.40.40.40.
002858975339738306969964430179049563155487123554708497.09203040485664
221

3536373839404142434445464748495051525354555657
30934-32136333383454035743369453814839350405534175642958441614536446566477684897050173513755257353780549825618557387
4.494.514.524.544.554.574.584.594.614.62
'4.634.654.664.674.684.694.704.714.724.734.744.754.76
175.88179.27182.59185.85189.06192.21195.32198.37
. 201.38204.34207.26210.15212.99215.79218.56221.29223.99226.66229.30231.91234.48237.03239.56
4C.7140.7840.8440.9040.9641.0241.0841.1341.1341.2341.2741.3341.3741.4141.4541.4941.5341.5741.6141.6441.6841.6941.71
ALPHA: 0.92Ao Csq. mm): 1673.34
Lo Cir.m): 92.32
*SHEAR PHASE*
CELL PRESSURE CkPa): STRAIN RATE: .015 mm/min
580.00
MEASURED PROPERTIES
READING DVOLCccD
123456789
10
0.0.0.0.0.0.0.0.0.0.
CO000101010101010101
PORPCkPaD
366.405.428.444.456.464.471.476.481.485.
980072~7~> .
089367895016
DLNGCmmD0.o.0.0.«
1.
1.
1.
2.2.
00255178073S67983062
AXFOCN)
0.66.96.112.124.132.133.144.148.152.
00820836111705197218
CELPCkPa)
580.530.580.580.580.580.580.580.580.580.
0000000000000000CO00
TIMECsec)
113232645396852916613793692591058111903
222

1112131415161718192021222324252627282930313233343536373839404142434445464743495051525354555657
0.010.010.020.010.010.020.020.020.020.020.020.020.020.020.020.020.020.020.020.020.020.020.020.030.030.020.020.02O.C20.020.020.020.020.030.020.030.020.020.020.010.020.010.010.010.010.010.01
488.04490.47492.48494.14495.63496.99498.06499.19499.81500.65501.46501.85502.34502.89503.25503.73504. 06504.22504.61504,83505.09505.22505.35505.68505.74505.77506.19506.13506.36506.68506.71506.91507.30507.36507.72507.91508.33508.59508.66509.01509.53509.83509.89510.25510.47510.51510.89
2.953.28
3.623.964.314.665.015.365.716.066.426.777.127. 487.838.188.548.899.249.599.9410.2910.6410.9811.3211.6612.0112.3512.7013.0313, 3o ..13.7114.0614.4014.7415.0815.4315.7716.1116.4716.8117.1517.5017.8518.1918.5418.89
155.41157.52159.25160.67161.86163.05164.24165.70166.43167.81168.77170.08170.96172.30173.07174.22175.14176.07176.37177.64178.64179.18180.14180.56181.33181.63182.59182.82183.52183.90184.44184.74185.20185.24185.24185.13184.67184.32183.63182.32181.10180.71180.02130.14179.52179.41179.02
580.00580.00580.00580. 0580.00580.00580.00580.00580.00580.00580.00580. 00580. 00580. 00580. 00580.00580.00580.00580.00 '580. 00580.00580. 00580.00580.00580.00580.00580.00580.00580.00580.00580.0058C.OO580.00580.00530.00580.00580.00580. 00580.00580.00580. 00580.00580.00580.00580.00580.00580.00
13226145481587117193185161983921161224842380725130264532777529098304213174433066343883571137033383553967740999423224364444966462894761148934502575157952902.54224555475686958192595146083662159634816480466126674486877070093714157273874061
223

DERIVED PROPERTIES
READING
123456789
1011
. 1213141516171819202122232425262728293031323334353637383940414243444546
STRAINA
0. 00000.0027O.OC550.00850.01160.01480.01810.02140. 02490.02840.03200 . 0356O.C3920.04290. 04670.05040. 05420.05800.06180.06570.06950.07330.07710. 08100.08480. 08860.09250.09630.10010.10390.10770.11140.11520. 11890.12260.12630.13010.13380.13750.14120.14490.14860. 15230.15600. 15970.1634
SIG1CkPa)
580.00619.82637.10646.58653.31657.82661.59664 . 32666.67668.36669.90670.79671.43671.89672.21672.52672.83673.27673.31673.70673.85674.19674.28674.63674.66674.89674.99675.08675.12675.13675.26675.15675.25675.07675.07674.83674.93674.64674.59674.38674.25674.00673.83673.44673. 03672.56
SIG3CkPa)
580.00580.00580.00580.00580.00580.00580.00580. CO580.00580.00580.00580.0058C.OO580.00580.00580.00580.00580.00580.00530.00580.00580.00580.00580.00580.00580.00580.00580.00580.00580.00580.00580.00580.00580. 00580.00530.00580.00580. 00580.00580.00580.00580. 00580.00580.00580.00580.00
. TOTALSTRESSRATIO
1.001.071.101.111.131.131.141.151.151.151.161.161.161.161.161. 161.161.161.161.161.161.161.161.161.161.161.161.161.161.161..161.161.161.161.161.161.161.161.161.161.161.161.161.161.161.16
EFFECTIVE
EFFSIG1CkPa)213.03214.82208.37201.81197.23192.89189.92187.43185.17183.21181.86180.31178.95177.76176.58175.54174.77174.08173.50173.05172.39172.33171.95171.74171.41171.16170.93170.87170.52170.29170.17169.92169.90169.39169.33169.06168.73168.51168.23167.70167.54167.10166.53166.08165.31164.65
EFFSIG3CkPaD213.03175.00151.28135.23123.92115.07108.33103.1198.5194.8491.9689.5387.5285.8684.3783.0181.9480.8180.1979.3578.54 .78.1577.6677.1176.7676.2775.9575.7875.3975.1774.9174.78
-74.6574.3274.2874.2373.8173.8773.6473.3273.2973.0972.7072.6472.2872.09
STRESSRATIO
1:001- 23
.1.381.491.591.681.751.821.881.931.982. 012.042.072.092.112.132.15
. 2.162.182.192.212.212.232.232.242.252.252.262.272.272.272.282.282.282.282.292.282.282.292.292.292.292.292.292.28
224
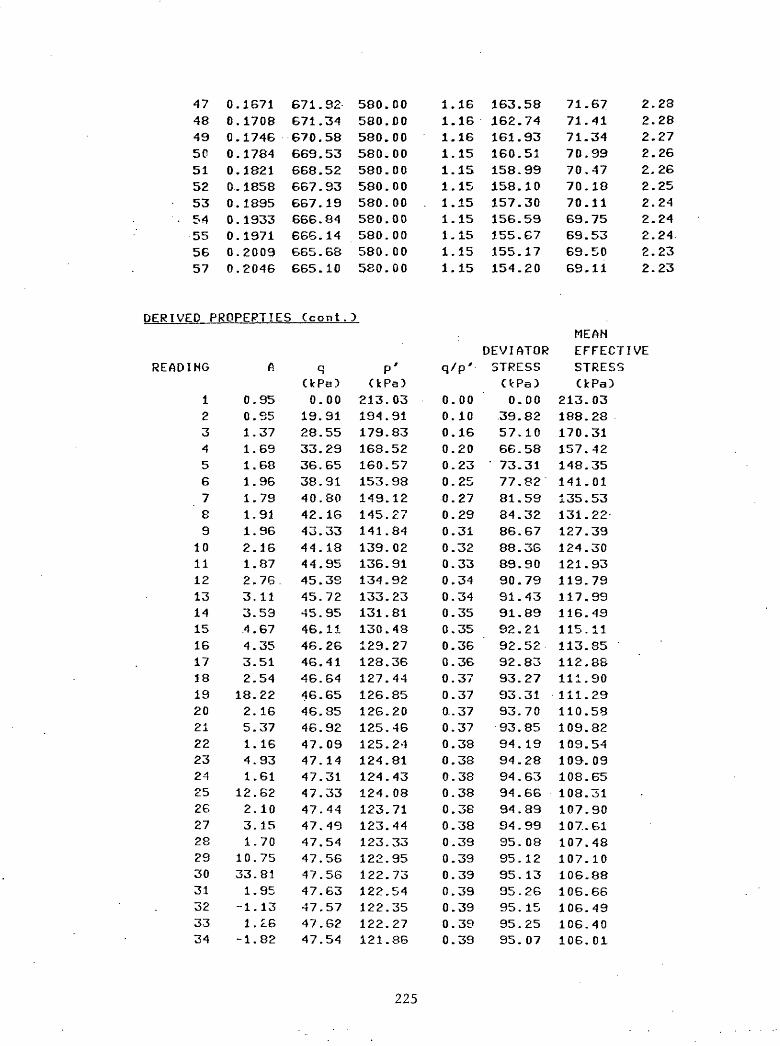
47 48 49 5C 51 52 53 54 55 5657
DERIVED
READING
123456789
10111213141516171819202122232425262728293031323334
0.1671 671.92 0.1708 671.34 0.1746 670.58 0.1784 669.53 0.1821 668.52 0.1858 667.93 0.1895 667.19 0.1933 666.84 0.1971 66S.14 0.2009 665.680.2046 665.10
PROPERTIES
ft
0.95O.S51.371.691.681.961.791.911.962.161.872.76.3.113.59.4.674.353.512.5418.222.165.371.164.931.61
12.622.103.151.70
10.7533.811.95
-1.131.16
-1.82
Ccont . !
CkPa!)0.00
19.9128.5533.2936.6538.9140.8042. IS43.3344.1844.9545.3945.7245.9546.1146.2646.4146.6446.6546.8546.9247.0947.1447.3147.3347.4447.4947.5447.5647.5647.6347.5747.6247.54
580.00 580. DO 580.00 580.00 580.00 580.00 580.00 580.00 580.00 580.00580.00
)
P'
CkPa)213.03194.91179.83168.52160.57153.98149.12145.27141.84139.02136.91134.92133.23131.81130.48129.27128.36127.44126.85126.20125.46125.24124.81124.43124.08123.71123.44123.33122.95122.73122.54122.35122.27121.86
1.1.1.1.1.1.1.1.1.1.1.
1616161515151515151515
163162161160158158157156155155154
.58
.74
.93
.51
.99
.10
.30
.59
.67
.17
.20
71.71.71.70.70,70.70.69.69.69.69.
6741349947181175535011
2.2.2.2.2.2.2.2.2.2.2.
2828272626252424242323
MEANDEVIATOR
q/p' STRESSEFFECTIVESTRESS
CtPe) CkPa}0.0.0.0.0.0.0.0.0.0.0.0.0.0.0.0.0.0.0.0..0.0.0.0.0.0.0.0.0.0.0.0.0.0.
00101620232527293132333434353536363737373738383838383839393939393939
0395766737781848688899091919292929393939394949494949495959595959595
.00
.82
.10
.58
.31
.82
.59
.32
.67
.36
.90
.79
.43
.89
.21
.52
.83
.27
.31
.70
.85
.19
.28
.63
.66
.89
.99
.08
.12
.13
.26
.15
.25
.07
213.188.170.157.148.141.135.131.127.124.121.119.117.116.115.113.112.111.111.110.109.109.109-.108.108.107.107..107.107.106.106.106.106.106.
0328314235015322-
3930937999491185889029588254096531906148108866494001
225

3536373839404142434445464748495051525354555657
19.00-0.134.480.22
-4.28-1.59-0.24-0.79-2.22-0.17-0.87-0.42-0.66-0.45-0.09-0.34-0.52-0.49-0.09-1.01-0.32-0.07-0.67
47.5447.4247.4647.3247.2947.1947.1247.0046.9146.7246.5146.2845.9645.6745.2944.7644.2643.9643.6043.4243.0742.8442.55
121.80121.64121.27121.19120.94120.51120.41120.09119.62119.36lie. 79118.37117.62-117.08116.63115.75114.73114.14113.71113.17112.60112.33111.65
0.390.390.390.390.390.390.390.390.390.390.390.390.390.390.390.390,390.390.380.380.380.380.38
95.0794.8394.9394.6494.5994.3894.2594.0093.8393.4493.0392.5691.9291.3490.5889.5388.5287.9387.1986.8486.1485.6885.10
105.95105.84105.45105.42105.17104.78104.70104.43103.98103.78103:29102.94102.31101.85101.54100.8399.9799.4899.1798.7098.2498.0597.47
226

350
325
300
275
250
225
200
EFFECTIVE SIGHA 1
x EFFECTIVE SIGMA 3
DEVIATOR STRESS
SHEAR STRESS
MEAN EFFECTIVE STRESS
o EXCESS PORE PRESSURE
I 1 I 1 1 I I I I I i 1 I 1 1 I 1
GO-9, PC-53: 320/580
AXIAL STRAIN
227

00
CM
CM
00
L
O
esaFS1n
o
of
LO
esaL
OLO
r\i
PlP
O

300
275
250
225
200
175
150
125
MEAN EFFECTIVE STRESS (kPo)
GO-9, PC-53; 300/378, 440, 580 229

TRIAXIAL TEST RESULTS
GENERAL TEST INFORMATION
SAMPLE INFORMATIONSAMPLE ID:
INTERVAL Crneters):GENERAL LOCATION:
DESCRIPTION:DATE FINISHED:
GD-1R, PC-54j 300/3608.08-8.21BALTIMORE-HUDSON CANYON AREAOLIVE-GRAY CLAY2/17/80
INDEX PROPERTIESMOISTURE CONTENT: 0.63
BULK DENSITY Cg/cc): 1.66VOID RATIO: 1.67
POROSITY: 0.62GRAIN SPEC GRAVITY Cg/cc): 2.71
SAMPLE PARAMETERSHEIGHT CmnO: 100.00
DIAMETER Cmm): 50.00
AREA (sq. mm): 1963.50
VOLUME Ccc): 196.35WEIGHT <nO: 374.10
TEST RESULTS
^SATURATION PHASER
READING CELL PRESSURE DELTA C PORE PRESSURE DELTA PkPa60.00120.00180.00300.00360.00
kPa
60. OC60.00120.0060.00
kPa55. 09 114.54 172.79 291.72 351.52
kFa
59.4558.25118.9359.80
0.990.970.991.00
^.CONSOLIDATION PHASE*
CELL PRESSURE CkPa): 360.00BACK PRESSURE CkPa): 3CO.OO
CONSOLIDATION PRESSURE CkPa): 60.00ASSUMED EFFECTIVE
OVERBURDEN PRESSURE CkPa): 50.42
230

CHANGES IK PROPERTIES DUE TO CONSOLIDATION
PROPERTY IHEIGHT (mm):
AREA <sc\. mm):VOLUME Ccc):
WATER CONTENT:POROSITY:
VOID RATIO:BULK DENSITY Cg/cc):
BOUYANT BULK DENSITY Cg/cc?:% SATURATION:
IAL VALUE100.00
1963.50196.35. 0.630.621.671.660.63
100.00
CONSOLIDATED VALUE97.31
1859.15180.91
0.550.601.491.710.69
100.00
MEASURED PROPERTIES
!NG
1234567B9
10111213141516171819202122232425262728293031323334
TIME(sec)
05
11224075
1412725311045207241226404868710970132521553517817201002238224665269472923031512337943607733359406424292-44520747489497725205454336
Log TIME
-4.000.701.041.341.601.882.152.432.733. 023.323.623.813.944.044.124.19-4.254.304.354.394.434.474.504.534.564.584.614. S34.664.68 4.704.724.74
Sqrt TIME
O.OC2.243.324.696.328.6611.8716.4923.0432.3345.5264.2080. 0293.20
104.74115.12124.64133.48141.77149.61157.05164.16170.97177.52183.83189.94195.85201.60207.18212.62217.92223.10228.15233.10
DVOLCcc)
0.000.330.711.061.532.153.0!4.245.907.819.4310.5411.0811.4311.7111.9312.1212.2912.4412.6512.7812.8913.0314.1515.4214.3413.9513.8313. 6C14.5414.7714.5814.5915.71
231

3536373839404142434445464748495051525354555657585960
566195890161184634666574968031703147259674879771G1794448172S8400986291885739085693139954219770399985102268104551106833J09115111398113681
4.754.774.794.804.824.834.854.864.874.89'4.904.914.924.944.954.964.974.984.995.005. 015. 025.035.045.055.06
237.95242.70247.35251.92256.42260 . 83265.17269.44273.64277.78281.86285.88289.84293.75297.61301.42305.19308.90312.57316.20319.79323.34326.85330 . 33333.76337.17
13.7313.7913.8513.9113.9914.1014.1414.1614.3214.4714.4914.5114.5914.6314.6514.7414.8414.8814.9715.0415.2515.2115.3515.3515.3915.44
ALPHA: 0.97Ao Csq. mm): 1859.16
Lo Cmm): 97.31
*SHEAR PHASE*
CELL PRESSURE CtcPa) : STRAIN RATE: .015 mm/min
360.00
MEASURED PROPERTIES
READING
1234567
DVOLCcc)0.00
-1.40-0.78-0.99-0.75-1.49-C.93
PORPClcPa)
330.67.334.76335.08334.95334.43334.27334.14
DLNGCmm)0.000.250.520.811.121.431.76
AXFOCN)
0.0034.9452.2664.7473.0078.5382.71
CELP ,CkPa)
360.00360.00360. 00360. 00360. CO360. CO360.00
TIMECaec)
1144328864329577172138656
232

cnencnencnenenoio
i4>
.4k.e
k4u4k
CO
xJ
CO
O1
4k
04
rOM
>o
CD
CO
xJ
CO
OI
4^4
k4k4^0
40JO
JO
JO
JO
JO
JO
JO
JO
Jro
roN
'iroro
roro
roro
ro>
-kM
»-f
chkH
k
OJ^H
>ocD
WxjQ
en4kU
roM
.or£
coxje
noi4
iOJro
H>
ocD
CO
xjc
ooi
H*
H*
»-»
M>
04
ro
M.
o
CD
CO
eo
eo
I I
III
III
I I
I I
I I
I I
I I
I I
I I
H>
Hk
Hk
^H
'H>
H*k
k^
k^
^H
kH
'Hk
Hk
H'H
'H*^
OH
'H*h
*O
>^
H^
H*O
OO
OH
'M>
>-
k>
-*O
OO
OO
OO
OO
OO
OO
OO
I-
fc
oie
ncn
cflA
4kcn
oio
i4x0
40
JO
Jro
H>
oirv5
roo
44
*en
4i,co
4vcn
ojo
i4x4
k<
Ti0
40
J4
\en
co
xj
M
|-o rO
oxjx
Jw
wro
CO
^H
-CO
Cn
cD
Crto
CD
OO
CO
^e00o
rs5C
O^
O1C
DC
004a>
CO
CD
xjo
oC
O^
04
04
0J
OJ
WW
CJ
CJ
01
04
0J
OJ
OJ
OJ
OJ
OJ
WO
JC
JW
04
0J
W0
40
4C
40
4U
OJ
OJ
OJ
04
04
0J
OJ
WO
IUO
J
OJ
OJ
OJ
CJ
WO
JO
J0
4C
40
J0
40
J0
40
40
JC
J0
40
40
JO
JO
JW
OJ
OJ
OJ
CJ
04
0:i
WU
04
0J
OJ
OJ
OJ
UO
JO
JO
JU
OJ
OJ
OJ
WcooD
oora
cococococococooocoxjx
ixjx
jxjx
j^xjc
ococncnco^cooic
noio
ieneneneneno^
CO
xjv
j(^xj<
j^xjc
^xjH
JkrN
jKkrx
3cO
xje
no
i4k4
k^o
co
cD
OD
cn
ojO
JO
JC
Drs
5xjx
jxjQ
r^4
xo
i^co
xjc
o
4xxjM
.o4
kM
'4ke
nH
'eo
r^co
co
co
4kh
>k^tn
co
cD
CO
cD
OJC
04
k4
kC
04
kcD
OO
oO
Jo
co
^^H
^H
^cn
r^r^
rN
5ro
rO
H*H
kM
Hk
^M
^H
kM
'hk
Kk
Hk
>-*»
-k
>-k
M'f
-*l-
k|-
fcH
kH
kl-
k|-
*>
-kk-*H
k
ooocD
CD
CD
OO
OO
xjx
jxjc
ocnoic
nen4\4
^4kW
OJO
Jr\
5ro
^^^oocD
CD
CD
»cocX
)xjx
jcncom
O
Den^xjo
jocoro
co4kH
*xjc
wcocnro
co4^H
'xjo
jocni^
cocn^xjo
jcD
CO
i\;a
)4koc^
CO
H*O
JC
nx
joro
4k
CO
C0
^0
4O
10
0o
04
CO
CD
H-4
kx
joro
Cn
cO
o0
4C
nx
JC
Di^
OJ
O1
CO
CO
CD
^rO
OJ
co
co
co
oo
co
co
co
co
oo
co
co
co
oo
co
co
co
co
co
co
co
co
co
co
oo
osco
co
co
co
oja
co
oo
oo
co
a
roro
roo
JO
J0
40
JO
J4
v4
ke
ne
no
icfio
ioic
oco
co
co
0co
co
cD
CO
Co
cn
co
co
c^
QO
?j\
&
jw
-t*
xj o
o
*^j
H*
OJ
cn
r*i?
OJ
^D
^o
co
CD
r^
o^
^
j*
CD o
&
&
co
k*
^~*
H*-
^
c/j
c/i
ro
tj\
co
co
^J
^**
ro
co
t^
c^
c?
oo
*^
c^
CD
A
co
NJ
OJO
JO
J04040JO
JO
JW
OJO
JO
JO
JO
JO
J040JW
04U
0404040J040JW
OJO
JU
WO
JO
JO
JC
^04U
UO
JO
OC
OC
OC
DC
OQ
CO
CO
CO
QC
OC
DC
DC
OO
^O
CO
CO
CO
Ol^
CO
CD
CD
CO
CD
CO
CD
Cn
'DC
OC
^ooooooooooooooooooooooooooooooooooooooooooooooooooo
OOOOOOOOOOOOOOOOOOOOOOOOOOOOOOOOOOOOOQOOOOOOOOOOOOO
ooooooooooooooooooooooooooooooooooooooooooooooooooo
CO
OT
xjx
Jx
jxjv
jxjx
JC
OC
OC
OC
OC
DC
OC
nO
10
10
10
1O
10
10
14
%4
k4
^4
k4
x4
k4
kC
AJ
04
0J
U
|xjo
CD
x.j
(j)e
nO
Jro
oc
Dx
JC
04
kW
ro
oC
Dx
JC
04
iOJ
^O
CO
xJ
Cn
4v
04
»^
oC
Ox
JC
04
\WH
'ora
xjO
14
k0
4^
oT
O^xju
co
4io
cn
^co
roco
o4
co
4ko
en
^xjro
co
04
co
^o
co
^xjro
co
ucD
en
oco
»^xji^co
4ve
oc^
roc04keooiH
kxjr3coj^
ocnH
'xjo
4C
04kocD
M.x
jcw
cxi4
ko0M
.sg^Q
j^ocoro
xjo
Jc
co
04
oco
co
o4
oxJe
nro
oxJe
no
Jo
co
o^ro
oxJ4
x^v>
cD
xJ4
^^)C
DxJ4
k^^co
cn
4kM
>cD
cD
O4
H>
oD
Co
oJM

59 1.51 338.84 21.27 GO 1.52 338. 3C 21.65
DERIVED PPOPFPTir^
TOTAL STRESS
READING STRAINA SIG1 . SIG3 RATIO
12345 67 8 9
10 11 12 13 14 151617 18 19 20 21 22 23 24 25 26 27 28 29 30 31 32 33 34 35 36 37 33 33 40 41 42
o.oooo0.00260. 00540. 00840. 0115 0.0147 C. 0180 0.0215 0.0250 0. 0286 0.0323 0. 0361 0. 0399 0. 0437 0.0475C- 05140.0553 0.0593 0.0632 0.0672 0.0711 0.0751 0.0791 0. 0830 0.0870 0. 0909 0. 0949 0. 0988 0. 1027 0.1066 0. 1105 0. 1144 0. 1132 0.1221 0. 1259 0.1237 0.1336 0.1374 0.1412 0. 1450 0.1489 0.1527
CkPa) aPa)360. 00 378.75387.96394.53398.81 401.62 403.69 405.09 4C5.94 406.11 406.27 406.25 406.09 405.9? 405.70405.43405.13 404.83 404.50 404.16 403.80 403.52 403.24 402.94 402.64 402.42 402.18 402.01 401.85 401.67 401 . 48 401.25 401. 00 400.82 400.62 40C.39 400. 28 400. O.S 399.89 399.70 399.41 399.24
360 . 0 0 360. 00360. 00360. 00360. 00 360. 00 360. 00 360. 00 360.00 360. 00 360. 00 360. OG 360. 00 360. 00 360. 00360.00360. CO 360. 00 360.00 360. 00 360. 00 360.00 360. CO 360, 00 360. 00 360. 00 360. 00 360. 00 360.00 360. 00 360.00 360.00 360. 00 360. 00 360. 00 360.00 360. 00 360. 00 360. 00 360. 00 360. 00 360. 00
1.00 1.051.081.101.11 1.12 1.12 1.13 1.13 1.13 1.13 1.13 1.13 1.13 1.131.131.13 1-12 1.12 1.12 1.12 1.12 1.12 1.12 1.12 1.12 1.12 1.12 1.12 1.12 1.12 1.11 1.11 1.11 1.11 1.11 1.11 1.11 1.11 1.11 1.11 1.11
82.64 82.52
EFF3IG1CkPa)29.33 43.9952.8859.5864.38 67.35 69.55 71.18 71.67 72.13 72.32 72.30 71.95 71.33 71.1470.7170.31 70.01 69.78 69.21 68.69 68.50 67.80 67.73 66.98 66.72 66.45 66.32 65.57 65.68 65.14 64.87 64.65 64.28 63.76 63.46 63.29 63.00 62.71 62.22 61.97 61.73
360.00 83669 360.00 85112
EFFECTIVE STRESS
EFFSIG3 RATIOCkPaD23.33 25.2524 9?* *-/ C_
25.0525.57 25 . 73 25.86 26.09 25.73 26.02 26.06 26.06 25.86 25.41 25.4425.2825.18 25.18 25.28 25.05 24.89 24.99 24.56 24.79 24.34 24.31 24.27 24.31 23.72 24.01 23.66 23.62 23.66 23.46 23.14 23.07 23.01 22.94 22.81 22.52 22.56 22.49
1.00 1.742.122.382.52 2.62 2.69 2.73 2.79 2.77 2.78 2.73 2.782.812 on. ou 2 on. ou
2.79 2.78 2.76 2.76 2.76 2.74 2.76 2.73 2.75 2.75 2.74 2.73 2.76 2.74 2.75 2.75 2.73 2.74
.2.76 2.75 2.75 2.75 2.75 2.76 2.75 2.74
234

43444546474849505152535455565758
- 5960
0.15650.16040. 16420.16810.17200.17580.17970.18360.18740.19130.19520.19910.20300.20680.21080.21460.21850.2225
DERIVED PROPERTIES
READING
12345o
73o
101112131415161718192021222324252627
A
0.220.220.04
-0.02-0.12-0.06-0. 06-0.16
0.. 42-1.71-0.200.00
-1.20-2.780.14
-0.61-0.32 ,0. 000.30
-0.67-0.450.35
-1.510.76
-1.52-0. 14-0. 13
398.95398.74398.50398.27398.02397.74397.38397.05396.67396.36396.09395.82395 . 64395 . 39395. 13394.92394.73394.51
Ccont . !
qCkPa)0.009.3713.9817.2719.4120.8121.8422.5522.9723.0523.1323.1223.0422.9622.8522.7222.5722.41£2.2522. 0821.9021.7621.6221.4721.3221.2121.09
360.00360.00360.00360.00360.00360.00360.00360.00360.00360.00360.00360.00360.00360.00360.00360.00360.00360.00
)
P'
CkPa}29.3334.6238.9042.3244.9846.5447.7048.6343.7049.0849.1949.1848.9048.3748.2947.9947.7547.5947.5347.1346.7946.7446.1846.2645.6645.5145.36
1.111.111.111.111.111.101.101.101.101.101.101.101.101.101.101.101.101. 10
q/r'
0.000.270.360.410.430.450.460.460.470.470.470.470.470.470.470.470.470.470.470.470.470.470.470.460.470.470.46
61.4461.0160.5360.0159.8659.5259.18
. 58.3458.1357.6257.4857.0756.7456.6856.3656.0955.9055.61
DEVIATORSTRESSCkPa)0.00
18.7527.9634.5338.8141.6243.6945.0945.9446.11-46.2746.2546.0945.9245.70 .45.4345.1344.8344.5044.1643.8043.5243.2442.9442.6442.4242. 18
22.4922.2622.0421.7421.8421.78 .21.8121.2921.4521.2621.3921.2621.1021.2921.2321.1621.1621.10
MEAN
2.732.742.752.762.742.732.712.742-712.712.692.682.692.662.662.652.642.64
EFFECTIVESTRESSCkPa}
29.3331.4934.2436.5638.5139.6040.4241.1241. 0441.3941.4841.4741.2240.7240.6740.4240.2240.1240.113.9.7739.4939.4938.9839.1038.5538.4438.33
235

282330313233343536373839404142434445464748495051525354555657585960
0.19-3.55
1.61-1.96-0.140.13
-1.09-1.64-0.28-0.61-0.28-0.81-1.490.12
-0.370.00
-1.08-0.92
. -1.270.39
-0.230.09
-1.590.43
-0.630.47
-0.48-0.930.76
-0.25-0.320.00
-0.29
21.01.20.9220.8320.7420.6220.5020.4120.3120.2020.1420.0319.9519.8519.7119.6219.4819.3719.2519.1319.0118.8718.6918.5218.3418. 1818.0417.9117.8217.6917.5617.4617.3717.26
45.3144.6444.8544.4044.2544.1643.8743.4543.27
'43.1542.9742.7642.3742.2642.1141.9741.6341.2840.8840.8540.6540.5039.8139.7939.4439.4339.1738.9238.9838.7938.6238.5338.35
0.460.470.460.470.470.460.470.470.470.470.470.470.470.470.470.460.470.470.47C.470.460.460.470.460.460.460.460.460.450.450.450.450.45
42.0141.8541.6741.4841.2541.0040.8240.6240.3940.2840.0539.8939.7039.4139.2438.9538.7438.5038.2738.0237.7437.3837.0536.6738.3636.0935.8235.6435.3935.1334.9234.7334.51
38.3137.6737.9037.4937.3737.3237.0736.6836.5436.4436.3036.11.35.7535.6935.5735.4735.1834.8734.5034.5134.3634.2733.6433.6833.3833.4233.2032.9833.0932.9432.8032.7432.60
236

350
325..
300..
275..
250
225
2001aa_
1751
EFFECTIVE SIGMA 1
EFFECTIVE SIGHA 3
DEVIATOR STRESS
SHEAR STRESS
HEAN EFFECTIVE STRESS
EXCESS PORE PRESSURE
AXIAL STRAIN
r.n-ip

TRIAXIAL TEST RESULTS
GENERAL TEST INFORMATION
. SAMPLE INFORMATIONSAMPLE ID.
INTERVAL (meters)iGENERAL LOCATION:
DESCRIPTION:DATE FINISHED:
GD-1R, PC-54j 300/4208.21-8.34BALTIMORE-HUDSON CANYON AREAOLIVE-GRAY CLAY2/17/80
INDEX PROPERTIESMOISTURE CONTENT:
BULK DENSITY Cg/cc):VOID RATIO:
POROSITY:GRAIN SPEC GRAVITY Cg/cc):
LIQUID LIMIT C2?:PLASTIC LIMIT CX):
0.60
1.681.590.612.71
62. 0030.00
SAMPLE PARAMETERSHEIGHT CmmD: 100.00
DIAMETER CrrmO : 50.00AREA Csq. mm): 1963.50
VOLUME Ccc): 1S6.35WEIGHT Cgm): 320.48
TEST RESULTS
^SATURATION PHASE*
READING CELL PRESSURE DELTA C PORE PRESSURE DELTA PkPa60.00120.00240.00300.00420. 00
kPa
60.00120.0060.00120.00
LPa58.12 117.34 237.31 296.47 417.05
kPa
59.22119.9759.16120.58
0.991.000.991.00
*COHSOLIDATIOH PHASE*
CELL PRESSURE CkPa!) : 420.00BACK PRESSURE CkPa): 300.00
CONSOLIDATION PRESSURE CkPa): 120.00ASSUMED EFFECTIVE
OVERBURDEN PRESSURE CkPa)r 52.80
238

CHANGES IN PROPERTIES DUE TO CONSOLIDATION
PROPERTYHEIGHT Cmm):
AREA Csq. mm)VOLUME Ccc)*
WATER CONTENT:POROSITY:
VOID RATIO:BULK DENSITY Cg/cc3:
BOUYANT BULK DENSITY Cg/cc) -.X SATURATION
INITIAL VALUE100.00
1963.50196.35
0.600.611.591.680.65
100. 00
CONSOLIDATED VALUES5.14
1777.28169.09
0.460.541.151.780.76
100.00
MEASURED PROPERTIES
DING
12345e789
1C1112131415161718192021 22232425262728OQ C.^3
3031~\">\J £-.
3334
TIMECsec)
0CT w>
12224175
142272530
1044207141216404863610969132511553417816200992238124663 2694629229315113379436076383594064142923 4520647488497715205354336
Lo3 TIME
-4.000.701.081.341.611.882.152.432.723.023.323.623.813.944.044.124.194.254.304.354.39 4.434.474.504.534.564.584.614.63 4.664.684.704.724.74
Sqrt TIME
0.002.243.464.696.403.66
11.9216.4923.0232.3145.5164.2080. 0293.20
104.73115.11124.64133.48141.77149. 6C157.04 164.15170.96177.51183.83189.94195.85201.60207.18 212.62217.92223.09228.15233.10
DVOLCcc)
0.00C.440.761.131.642.363.435.007. 23
10.1113.3916.6918.5919.7420.5321.1121 57t- JL » vJ /
21 SS*- J» %-J ̂ J
22.27.22.5522.81 23.0423.25J>~^ 4"^ £-\-> . *»;>
23.6423.8123.9824.1324.2824.4224.5624. 6924.8224.93
239

3536373839404142434445464748495051525354555657585960
56613589006118363465657486803070313 -7259674878771617944481726840098629188573908569313995421977049998G102268104551106834109116111399113682
4.754.774.79
. 4.804.824.834.854.864.874.894.90
. 4.91..4 . 92'4.944.954.964.974.984.995.005.015.025.035.045.055.06
237.95242.69247.35251.92256.41260.83265.17269.44273.64277.78281.86285.88289.84293.75297.61301.42305.19308.90312.58316. 21319. 7S323.34326.85330.33333.76337.17
25.0525.1625.2725.3725.4825.5825.6325.7925.8925.9926.0826.1826.2726.3626.4526.5326.6126.6926.7726.8526.9226.9927.0627.1327.1927. 2G
ALPHA: 0.95Ao Csq. mm): 1777.28
Lo (mm): 95.14
*SHEAR PHASE*
CELL PRESSURE CkPa): STRAIN RATEr .015 mm/min
420.00
MEASURED PROPERTIES
READING
1234567
DVOLCcc)0.00
-0.00-0.000.00
-o.oo0. 000.00
PORPClcPa)
366 . 83 '368.89369.34370.39377.67379.22380.30
DLNGCn>m)0.000.010.340.681.031.381.74
AXFOCND
0.008.66
22.4432.7789.95US. 77132.78
CELPCkPa>
420.00420.00420.00420.00420.00420.00420.00
TIMECsec)
1144328SG4329577172138656
240

89
10111213141516171819202122232425262728293031323334353637383940414243444546474849505152535455565758
0,000.000.010.010.010.010.010.010.010.010.010.010.010.000.010.000.010.010.010.010.010.010.010.01O.C10.010.010.010.010.010.010.010.010.010.010.020.020.020.020.020.020.020.010.020.020.010.020.020.020.020.02
381.29382.05383.04383.80384.60385. 3G386.28386.98387.62388.22388.89389.52390.16390.64390.92391.49391.72392.45392.64392 . 83393.12393.47393.62393.91394.26394.53394.80394 . 93395.15395.47395 . 66395.79395 . 98396.26396.39396.68396.87397.03397.41397.60397.63397.69398.01398.20398.33398.33398.30393.36398.39398.52398.74
2.112.482.863.243.613.994.374.765.145.535.616.296.677.067.447.S28.198.578.959.339.7010.0810.4610.8311.2111.5811.9612.3312.7113.0913.4713.8514.2314.6115.0015.3915.7716.1616.5416.9317.3217.7118.0918.4818.8719.2619.6420.0320.4120.8021.18
143.15149.36153.52154.53153.65153.43152.51151.47149.80148.18146.61145.60144.86144.20143.06142.50141.62140.83139.96138.95137.95137.16136.37135.28134.18133.57132.61131.43130.46129.37128.41127.40126.44125.30124.25123.33122.46121.67120.93120.05119.26118.43117.82117.16116.73116.11115.90115.63115.50115.24115.2-1
420.00420.00420.00420.00^20.00420.00420.00420. OC420. CO420.00420.00420.00420.00420.00420.00420.00420.00420.00420.00420.00420.00420.00420.00420.00420.00420.00 :420.00420.00420.00420.0042C.OO420.00 -420.00420.00420.00420.00420.00420.00420.00420,00420.00420.00420.00420.00420.00420.00420.00420.00420.00420.00420. 00
100981154112933144251586817310187532019621633230812452325966274082885130293317363317934621360643750638948403914183443276447194616247604490475048951932533835482656269577115915460597620396348264924663666780969251706947213673579750227646577907793508073282235
241

59 0.02 398.93 21.56 115.28 420.00 83678 60 0.01 398.84 21.95 115.06 420.00 85121
DERIVED PROPERTIES TOTAL EFFECTIVE STRESS STRESS
READING STRAINA SIG1 SIG3 RATIO EFFSIG1 EFFSIG3 RATIO
123456789
101112131415161718192021222324252627282330313233343536373839404142
0.0.0.C.0.0.0.0.0.0.0.0.0.0.0.0.0.0.0.0.C.0.0.0.0.0.0.0.0.0.0.0.0.0.0.0.0.0.0..0.0.0.
ooao00010035007101080145018302220261030003400379041904600500054005810621066107020742078208210861090109410981102010601099113811781217125712971336137614161456149615361577
CkPa)420.00424.87432.58438.31470.07484.75493.34498.76501.85503.79503.99503.17502.71501.87.500.96499.73498.53497.37496.51495.79495.12494.20493.59492.82492.12491.34490.52489.70488.99488.30487.45486.61486.01485.23484.36483.60482.77482.02481.25430.50479.67478.89
CkPa)420.420.420.420.420.420.420.420.420.420.420.420.420.420.420.420.420.420.420.420.420.420.420.420.420.420.420.420.420.420.420.420.420.420.420.420.
- 420.420.420.420.420.420.
00o-o00000000000000000000000000000000000000000000000000 .000000000000000000000000000000
1.001.011.031.041.121.151.171.191.191.201.201.201.201.191.19 .1.191.191.181.181.181.181.181.181.171.171.17.1.171.171.161.161.161.161.161.161.151.151.151.151.151.141.141.14
CkPB)53.55.63.67.92.
105.113.117.119.120.120.118.117.115.113.112.110.108.106,105.104.103.102.101.99.98.97,96.95.94.93.92.91.90.89.83.87.86.85.84.83.82.
139825924052044780751958355998123248986348281011687069595367543543434345313646524150
CkPa)53.51.50.49.42.40.39.38.37.36.36.35.34.33.33.32.31.31.30.29.29.29.28.28.27.27..27.26.26.26.26.25.25.25.25.24.24.24.24.24.23.23.
181166623478707195962041647202397811488437085128553617895438097442200785533422027461
1.001.101.251.372.18.2.592.853.033.163.273.323.353.393.433.453.463.473.493.513.543.563.553.583.573.623.613.603.593.603.593.593.593.603.593.573.563.563.553.533.523.513.49
242

434445464748495051525354555657585960
0.16170.16580.16930.17390.17790.18200.18620.19020.19430. 19840.20240.20640.21050.21450.21860.22270.22660.2307
478.17477.48476.83476.21475.53474.89474.23473.69473.12472.65472.11471.75471.37471.05470.66470.40470.17469.80
4CO.OO420.00420.00420.00420.00420.00420.00420.00420.00420.00420.00420.0042C.OO420.00420.00420.00420.00420.00
1.141.141.141.131.131.131.131.131.131.131.121.121.121.121.121.121.121.12
81.5080.6179.8178.8077.9377.2676.5475.6874.9174.3273.7873.4573.0172.6572,1571.6671.2370.97
23.3323.1322.9822.5922.4022.3722.3121.9921.8021.6721.6721.7021.6421.6121.4821.2621.0721.16
3.493.483.473.493.483.453.433.443.443.433.403.383.373.363.363.373.383.35
DERIVED PROPERTIES Ccont.3
NG
12345&789
101112131415161718192021222324252627
A
0.<20.420.060.180.230.110.130.180,250.513.76-0.98-1.64-1.10-0.77-0.52-0.50-0.57-G.74- c . ee-0.71-0.31-0.94-0.29-1.05-0.24-0.23
qCkPa}0.002.446.299.1525.0332.3736.6739.3840.9241.8941.9941.5941.3540.9340.4839.8739.2738.6838.2537.8937.5637.1036.8036.4136.0635.6735.26
P'
CkPa)53.1853.5556.9658.7767.3773.1576.3778.0978.8778.8678.1976.9976.0074.6573.5072.2571.0569.8068.7367.7466.9286.1865.3064.6963.6263.0362.43
q/p'
0.000.050.110.160.370.440.480.500.520.530.540.540.540.550.550.550.550.550.560.5G0.560.560.560.56C.570.570.56
DEVIATORSTRESSCkF'a)0.004.87
12.5813.3150.0764.7573.3478.7681.3583.7983.9983.1782.7181.8780.9679.7378.5377.3776.5175.7975.1274.2073.5972.8272.1271.3470.52
MEANEFFECTIVESTRESSCkPa)
53.1852.7354.8655.7259. 0262.3664.1464.3665.2364.8964.2063.1362.2161.0160.0158.9657.9656.9055.9855. 1054.4053.8153. 0452.56.51.5951.1450.68
243

282930313233343536373839404142434445464748495051525354555657535960
-0.35-0.50-0.23-0.34-0.41-0.53-0.29-0.15-0.29-0.39-0.25-0.16-0.26-0.35-0.16-0.40-0.28-0.24-0.62-0.28-0.05-0.10-0.58-C.33-0.27
0. 000.09
-0.16-0.10-0.33-0.85-0.800.26
34.8534.5034.1533.7333.3033,0032.6232.1331.8031.3931.0130.6230.2529.8429.44.29.0928.7428.4228.1127.7627.4427.1226.8426.5626.3226.0525.8725.6825.5225.3325.2025.0824.90
61.7461.0360.5259.8259.0458.4357.8257.2556.6555.9255.3554.8454.27-53.5753.0652.4151.8751.3950.7050.1749.8249.4248.8348.3648.0047.7347.5847.3247.1346.8146.4646.1546.07
0.560.570.560.560.560.560.560.560.560.560.560.560.560.560.550.550.550.550.550.550.550.550.550.550.550.550.540.540.540.540.540.540.54
69.7068.9968.3067.4566.6166.0165.2364.3663.6062.7762.0261.2560.5059.6758.8958.1757.4856.8356.21
- 55.5354.8954.2353.6953.1252.6552.1151.7551.3751.0550.6650.4050.1749.80
50.1249.5349.1448.5747.9447.4346.9446.5346.0545.4645.0144J6344.1943.6343.2442.7242.2941.9241.3340.9140.6740.38
. 39.8839.5039.2239.0433.9538.7638.6238.3738.0637.7937.76
244

EFFECTIVE SIGHA 1
EFFECTIVE SIGHA 3
DEVIATOR STRESS
SHEAR STRESS
MEAN EFFECTIVE STRESS
EXCESS PORE PRESSURE -
AXIAL STRAIN
GHR, PC-54: 320/420245

TRIAX1AL TEST RESULTS
GENERAL TEST INFORMATION
SAMPLE INFORMATIONSAMPLE ID: GD-1R, PC-54* 300/540
8.34-8.48BALTIMORE-HUDSON CANYON AREA OLIVE-GRAY CLAY 2/17/80
INTERVAL (meters)iGENERAL LOCATION:
DESCRIPTION:DATE FINISHED:
INDEX PROPERTIESMOISTURE CONTENT: 0.58
BULK DENSITY Cg/cc): 1.69VOID RATIO: 1.53
POROSITY: 0.61GRAIN SPEC -GRAVITY Cg/cc): 2.71
SAMPLE PARAMETERSHEIGHT Cmm): .100.00
DIAMETER Cmm): 50.00AREA Csq. mm): 1963.50VOLUME Ccc): 196.35WEIGHT C 3m): 324.00
TEST RESULTS
^SATURATION PHASE*
READING CELL PRESSURE DELTA C PORE PRESSURE DELTA PkPa60.00120.00240.00360.00540.00
kPa
60.00120.00120.00180.00
kPs57.57 117.26 236.82 356.47 537.12
IcPa
59.69119.56119.65180.65
0.991. 001.001.00
^CONSOLIDATION PHASE*
CELL PRESSURE CkPa); 540.00BACK PRESSURE CkPa): 300.CO
CONSOLIDATION PRESSURE CkPa): 240.00ASSUMED EFFECTIVE
OVERBURDEN PRESSURE CkPa): 54.75
246

CHANGES IN PROPERTIES DUE TO CONSOLIDATION
PROPERTY INITIAL VALUEHEIGHT (mnO: 100.00
AREA (sq. mm) s 1963.50VOLUME (cc3: 196.35
WATER CONTENT: 0.58POROSITY: 0.61
VOID RATIO: 1.53BULK DENSITY Cg/cc): 1.69
BOUYANT BULK DENSITY Cg/ccD: 0.67X SATURATION: 100.00
CONSOLIDATED VALUE93.72
1724.73161.65
0.410.490.961.830.81
100.00
MEASURED PROPERTIES
NG
1234c:
6789
10111213141516171819202122232425262728293031323334
TIME(sec)
05
12224175
1422725311C4520714122640486S7109701325315535178172010022382246642694629229315113379436076383594064142924452CG47483497715205354336
Log TIME
-4.000.701.081.341.611.882.152.432.733.023.323.623.813.944.044.124.194.254.304.354.394.434.474.504.534.564.584.614.634.664.684.704.724.74
Sqrt TIME
0.002.243.464.696.408.6611.3216.4923.0432.3345.5164.2080.0293.20104.7«115.12124.64133.48141.77149.61 .157.05164.15170.96177.51183.83189.94195.85201.60207.18212.62217.92223.09228.15233.10
DVOLCoc)
0.000.520.981.512.243.284.837.1310.4715.0520.9027.6531.7734.1935.6936.6837.3537.8338.1838.4438.6338.7638.8533.9138 . 9338.9238.8938.8238.7333.6138.4738.3138.1437.96
247
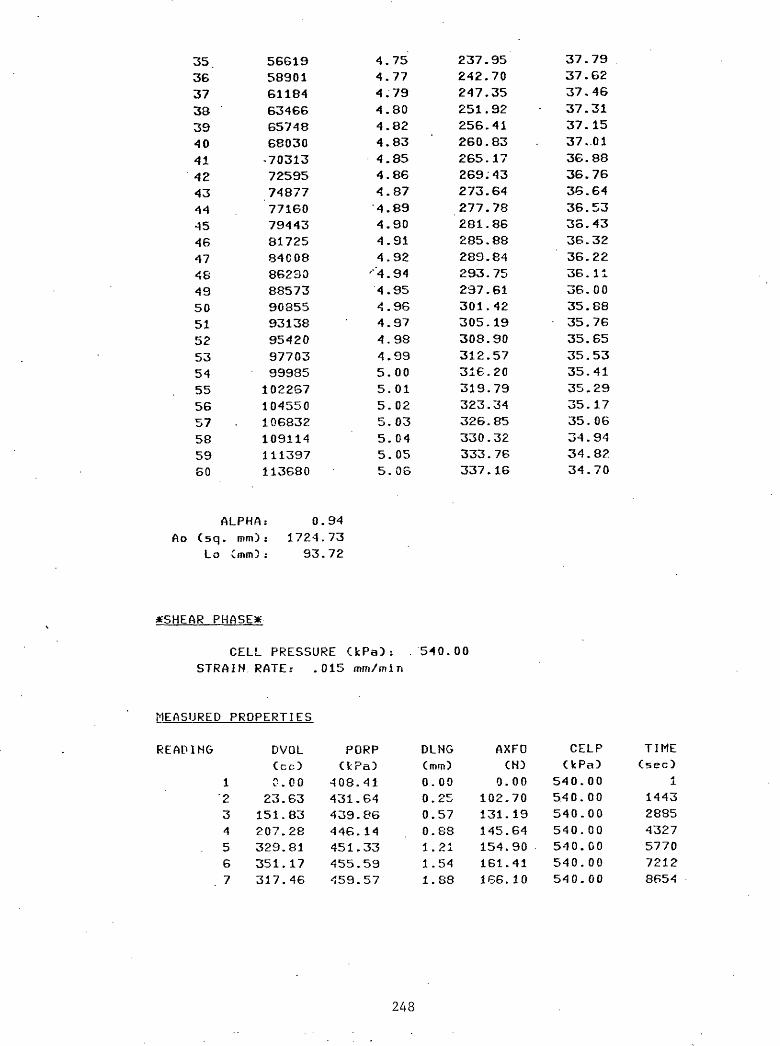
3536373339404142434445464748495051525354555657585960
568195890161184634666574868030-70313725957487777160794438172584C0886230885739035593138954209770399985102267104550106832109114111397113680
4.754.774.794.804.824.834.854.864.874.894.904.914.92
' "4.94
4.954.964.974.984.995.005.015.025.035.045.055.06
237.95242.70247.35251 . 92256.41260.83265.17269.43273.64277.78281.86285 . 88289.84293.75237 . 61301.42305.19308.90312.57316.20319.79323.34326.85330.32333.76337.16
37.7937.6237.4637.3137.1537. .0136.8836.7636.6436.533S.4336.3236.2236.1136.0035.8835.7635.6535.5335.4135.2935.1735. 0634.9434.8234.70
ALPHA:Ao Csq. mm):
Lo Cmm!) :
0.941724.7393.72
*SHEAR PHASE*
CELL PRESSURE CkPa): 540.00 STRAIN RATE: .015 mm/min
MEASURED PROPERTIES
READING
1234567
DVOLCccDC.OO
23.63151.83207.28329.81351.17317.46
PORPCkPaD
408.41431.64439.86446. 14451.33455.59459.57
DLNGCmm)0.000.250.570.881.211.541.88
AXFOCN3
0.00102.70131.19145.64154.90161.411S6.10
CELPCkPaD
540.00540.00540.00540. 00540.00540.00540. 00
TIMECsec)
1144328854327577072128B54
243

89
10111213141516171819202122232425262728293031323334353637383940414243444546474849505152535455565758
378.53339.57226.86360.19204.79177.68241.12169.79271.30331.48197.40212.34206.07197.02138.33108.60124.08213.33151.50160.75129.53155.31159.77152.17104.051 1 1 . 6857.29217.6858.98118. 5G262.21173.09305.26162.22194.72203.49208.37177.17279.73159.32182.63313.58338.72393.04248.58266.86265.59337.11306.75391.48240.89
462.67465.40467.78469.74471.66473.03474.43475.73476.97477.98478.76480.00480.75-481.47482.22482.87483.29483.85484.30484.79485.25485.77486. 06486.62486.91487.30487.69487.89488.34488.54488.90488.96489.19489.55489.71439.91490.07490.62490.53490.49490.79490.95491.01491.11491.41491.70491.76491. 78491.89492.12492.06
2.232.592.953.323.704l084.464.835.225.605.996.386.767.157.547.938.318.709.089.469.8410.2310.6110.9911.3711.7412.1212.5112.8913.2713.6514.0314.4014.7815.1615.5315.9116.2916.6717.0517.4317.8118.1318.5718.9519.3219.7020.0820.4620.8421.21
169.36171.84173.31174.05174.28174.32174.40174.32174.32174.51174.20174.78175.13175.68175.56175.79176.30176.53176.61176.96177.27177. -12177.89178.00178.12178.54178.93179.16179.51179.71 .179.98180.06180.40180.71180.99181.30181.80182.38182.50182.85183.20183.31183.51133.58184.01184.28184.63184.86184.98185. 17185.52
540.00540.00540.00540.00540.00540.00540.00540.00540.00540. CO540.00540.00540.00540.00540.00540.00540.00540.00540.00540.00540.00540.00540.00540.00540.00540.00540. 00540.00540.00540.00540.00540.00540.00.540.00540.00540.00540.00540.00540.00540.00540.00540.00540.00540.00540.00540.00540.00540.00540.00540.00540.00
1009611539129811442415866173091875120194216362307824521259632740628848302903173233175346173605937502389444038741829432714471346156.47598490415C4S3519265336854810562535769559137805796202263464649076635067792692357067772120735 &2750057644777890793338077582218.
249

59 414.58 492. 60 434.22 492.
DERIVED PROPERTIES
READING STRAIN/* SIG1
123456789
101112131415161718192021222324252627282930313233343536373839404142
0.0.0.0.0.0.0.0.0.0.0.0.0.0.0.0.0.0.0.0.0.0.0.0.0.0.0.0.0.0.0,0.0.0.0.0.0.0.0.0.0.0.
000000270060009401290165020002380276031403540395043504760516055705980639068007220763080508460886092809691009105010911133117312131253129413351375141514561497153615771617
CkPa)540.00599.39615.60623.65628.65632.05634 . 38635 . 86636.88637 . 33637.34637.06636.67636.30635 . 86635.44635.13634 . 55634.45634.22634.08633.60633.30633.16632 . 86632.48632 . 25631 . 99631.64631.46631.10630.74630.55630.32630.01629.77629.45629.15628.77628.53628.26627.97
63 21. 81 21.
SIG3
59 185.68 540.00 83660 98 185.64 540.00 85103
TOTAL EFFECTIVE STRESS STRESS RATIO EFFSIG1 EFFSIG3 RATIO
UPa)540.540.540.540.540.540.540.540.540.540.540.540.540.540.540.540.540.540.540;540.540.540.540.540.540.540.540.540.540.540.540.540.540.540.540.540.540.54-0.540.540.540.540.
00000000OC0000000000000000000000000000OP0000OC00000000000000.000000000000000000000000
1.001.111.141.151.161.171.171.181.181.181.181.181.181.181 . 181.181.181.181.171.171.171.171.171.171.171.171.171.171.171.171.171.171.171.171.171.171.171.171.161.161.161.16
CkPa}131.167.175.177.177.176.174.173.171.169.167.165.163.161.160.158.157.155.154.153.i52.151.150.149.149.148.147.146.145.145.144.143.143.142.142.141.140.140.139.139.138.138.
597475513345811948556040658713471579454762384487011846748740488325631343912681347126
CkPa)131.108.100.93.83.84.80.77.74.72.70.68.66.65.64.63.62.61.60.59.53.57.57.
5936158668414334602226349757270302240025537813
56.7156.55.55.54.
. 54.53.53.53.52.52.52.51.51.51.51.50.50.50.
1670£1 .752394390970311166461004814529
1.001.551.751.892.002.092.172.242.302.352.392.422.442.472.492.512.532.542.572.592.612.622.632.642.652.662.672.682.692.702.712.712.722.732.732.742.742.742.742.742.752.75
250

434445464748495051525354555657585960
DERIVED
READING?
123456783
101112131415161718192021£22324252627
0.16570 . 16980.17380.17790.18200.18600.19000.19400.19810.20220.20620.21020.21430.21840.22230.22630.23030.2345
PROPERTIES
A
0.390.390.510.781.041.261.712.092.675.37
168.96-6.87-3.57-3.77-2.92-2.98-3.27-1.34
-11.94-3.27-5.38-1.55-2.21-2.85-1.85-1.21-2.10
627.69627.51627.37626.99626.72626.46626.09625.75625.35625.12624.82624.55624.22623.83623.49623.22622.86622.39
Ccont . !
qCkPa)0.00
29.6937.8041.83 .44.3346.0247. 1347.9348.4448.6648.6748.5348.3448.1547.9347.7247.5747.2747.2247.1147. 0446.8046.6546.5846.4346.2446.12
540.00540.00540.00540.00540.00540:00540.00540.00540.00540.00540.00540.00540.005'40_00540.00540.00540.00540.00
)
P'
CkPa)131.59138.05137.95135.68133.00130.43127.62125.26123.04120.88118.93116.87115.31113.72112.20110.75109.59108.51107.22106.36105.58104.58103.79103.29102.58101.941 0 1 . 33
1.161.161.161.16
. 1.161.161.161.161.161.161.161.161.161.161.151.151.151.15
q/p'
0.000.220.270.310.330.350.370.380.390.400.410.420.420.420.430.430.430.440.440.440.450.450.450.450.450.450.46
137.79137.44136.74136.46136.23135.67135.14134.74134.24133.72133.12132.79132.46131.94131.37131.16130.18129.59
DEVIATORSTRESSCkPa)0.00
59.3975.6083.6588.6592.0594.3895.8696.8837.3337.3497.0696.6796.3095.8695.4495.1394.5594.4594.2294.0893.6093.3093.1692.8692.4892.25
50.0949.9349.3849.4849.5149.2149.0548.9948.8948.6043.3048.2448.2448.1147.88 .47.9447.3247.19
MEAN
2.752.752.772.762.752.762.762.752.752.752.762.752.752.742.742.742.752.75
EFFECTIVESTRESSCkPa)
131.59128.15125.35121.74.118.23115.03111.89109.29106.89104.66102.71100.6999.2097.6796.2294.8493.7392.7591.4890.6689.8988.9888.2387.7687.1186.5385.96
251

282930313233343536373339404142434445 .464748495051525354555657585960
-1.75-1.52-1.59
. -1.55-0.82-2.02-1.74-0.63-1.88-0.60-1.23-0.17-0.94-1.30-0.56-0.72-0.88-3.850.260.13
-1.12-0.43-0.20-0.24-1.27-0.9G-0.240.00
-0.34-0.670.24
-1.71-0.28
45.9945.8245.7345.5545.3745.2745.1645.0144.8844.7244.5844.3944.2744.1343.9843.8543.7543.6843.4943.3643.2343.0442.8842.6842.5642.4142.2742.1141.9241.7541.6141.4341.20
100.75100.0599.6798.93
98.4697.9897.4797.1296.5496.1995.6835.4395.08
- 94.5894.2793.9493.69S3. 0692.9792.8792.4492.0991.8691.5791.1690.7190.51SM3.3590.0289.6289.5583.7588.39
0.460.460.460.460.460:460.460.460.460.460.470.470.470.470.470.470.470.470.470.470.470.470.470.470.470.470.470.470.470.470.460.470.47
91.9991 . 6491.4691.1090.7490.5590.3290.0189.7789.4589.1588.77
.88.5388.26
. 87,9787.6937.5187.3786.9986.7286.4686.0985.7585.3585.12
. 84.8284.5584.2283.8383.4983. 2282 . 8682.39
85.4284.7884 . 4283.7583.3482.8882.4282.1281.5881.2880.8280.6380.3279.8779.6179.3379.1078.5078.4778.4278.0377.7577.5777.3476.9776.5776.42-76.3176.0575.7175.6874.9474.66
252

EFFECTIVE SIGHA 1
EFFECTIVE SIGMA 3
DEYIATOR STRESS
SHEAR STRESS
MEAN EFFECTIVE STRESS
AXIAL STRAIN
GD-1R, PC-54; 320/54B 253

p 1 (Wo)
GD-1R, PC-54: 300/359, 420, 540254

300 ^
275..
250..
225..
200..
a a_
175..
.§150
125,.
100..
75..
50..
25..
aato K3
esnCd
MEAN EFFECTIVE STRESS
GD-1R, PC-54; 300/3S0, 420, 540255