geotechnical evaluation of alternative configurations …
TRANSCRIPT

1
GEOTECHNICAL EVALUATION OF ALTERNATIVE CONFIGURATIONS OF INTEGRAL ABUTMENT BRIDGE APPROACH SLABS FOR MITIGATION OF ASPHALT DISTRESS
JuanCarlos Carvajal, Ph.D., P.Eng. Geotechnical Engineer, Thurber Engineering
Paul Wilson, P.Eng.
Principal, Thurber Engineering
Denny Ma, P.Eng. Associate, Thurber Engineering
Tony Sangiuliano, P.Eng.
Senior Foundations Engineer, Ministry of Transportation Ontario
Kris Mermigas, P.Eng. Head, Bridge Design, Ministry of Transportation Ontario
P.K.Chatterji, Ph.D., P.Eng.
Principal, Thurber Engineering
Paper prepared for presentation at the Testing and Modeling of Road and Embankment Materials Session
at the 2020 TAC Conference & Exhibition

2
1. INTRODUCTION
Integral Abutment Bridges (IABs) consist of a continuous concrete deck integrated with abutments
supported on flexible foundations. Seasonal temperature changes create longitudinal movements in the
deck and the abutment walls. The bridge contracts as the temperature drops and results in settlement of
the backfill in proximity to the abutments. Approach slabs are commonly included in IABs to provide a
smooth transition from the approach embankments to the bridge.
The Ministry of Transportation (MTO) is responsible for the highway infrastructure in Ontario. The
infrastructure is comprised of approximately 17,000 km of highway and approximately 3,000 bridges,
nearly 10% of which are IABs.
MTO uses a standard approach slab on all bridges that comprises a 6 mlong, 250 mmthick, reinforced
concrete (RC) slab set near road grade and surfaced with 90 mm of asphalt. On IABs, this configuration
has performed satisfactorily for up to 10 mm of abutment displacement. However, asphalt cracking and
settlements have been observed at the far end of the approach slabs for displacements greater than 10
mm (Figure 1). Sleeper slabs are used at the end of the approach slab for anticipated displacements
exceeding 10 mm, and a strip seal expansion joint is installed between the sleeper slab, which is fixed
relative to the approach fill, and the approach slab, which moves with the bridge. The sleeper slabs and
joint hardware have a high initial cost and add to the duration of initial construction. As well, if the backfill
settles in new bridges with builtup embankements, the maintenance and repair of sleeper slabs is
challenging and disruptive to traffic if they need to be rebuilt.
Figure 1. Typical pavement cracking and settlement at the end of an approach slab (MTO)
MTO is considering alternative approach slab configurations to reduce the frequency and severity of
pavement surface distress and the maintenance cost of IABs in Ontario. An inclined or buried approach
slab is used in some other jurisdictions and appeared to provide a solution to mitigate asphalt
deterioration. In order to evaluate the potential of a buried approach slab in a Canadian climate, MTO
initiated a project to model the soilstructure and asphalt behaviour of such a detail and engineer an

3
arrangement for up to 25 mm of movement at the end of an IABs. The solution should allow the highway to be repaved in case of global settlement of the embankment. This paper presents the results of a numerical study of buried approach slabs in the Canadian climate using finite element analysis. The first part of the project involved modeling the asphalt behaviour to identify the failure mechanism that causes asphalt cracking at the far end of the approach slab and understand why deterioration happens with movements greater than 10 mm. The second part of the projects involved a parametric study used to understand the effects of approach slab depth, inclination, and detailing on the performance of the asphalt. The final goal was to develop an alternative approach slab configuration that can accommodate up to 25 mm of abutment/slab displacement in an IAB. 2. BACKGROUND REVIEW The team reviewed relevant approach slab details from several transportation agencies as well as research studies, some of which are summarized as follows: Transportation Agency Details
� Ministry of Transportation of Quebec. The approach slab is sloping under the pavement structure and pin connected at the abutment. Asphalt is either supported on the road base or thickened and supported at the near end of the approach slab. Asphalt includes a 6 mm x 20 mm notch at the deck end for crack control. In semiintegral bridges, the approach slab does not move with the bridge, but a joint is introduced between the approach slab and the end of the deck.
� Ministry of Transportation Ontario. The approach slab is horizontal, set near road grade and topped with 90 mm of asphalt and pin connected at the abutment. The far end of the approach slab has two possible arrangements to to accommodate movements. For movements up to 10 mm, a 20 mm x 40 mm groove is cut into the asphalt and filled with bitumen. For movements greater than 10 mm, a sleeper slab is cast on the soil behind the approach slab and supports the approach slab. A strip seal expansion joint is installed between the sleeper slab and the approach slab to accommodate movements.
� Alberta Transportation. The approach slab is horizontal and set near road grade with 50 mm of asphalt and pin connected at the abutment. Depending on the situation, one of four types of joint are provided at the far end of the approach slab to accommodate movements.
� Swiss Federal Roads Office. The approach slab is 300 mmthick and sloped at 10% with a moment connection at the deck in a semiintegral or intergral bridge.
� South African National Roads Agency. The approach slab is sloped at 10% covered with 3 layers of plastic (PVC) sheeting and 400 mm embedment at the abutment. Asphalt is 200 mm thick reinforced with one glasgrid layer and supported on a 300 mmthick base course improved with 1.5% bitumen and 1% cement. The above details are provided for a maximum horizontal slab movement of 10 mm.
Observations from Research Studies
� New Brunswick Bridge (Canada). Twospan, 76 m long, 17.6 m wide, integral abutment bridge supported by Hpiles with a 300 mthick, horizontal approach slab pin connected at the abutment. The bridge was constructed with instrumentation including tilts meters, deformation meters and

4
pressure cells. The abutment displacement was observed to consist mainly of translation (Huntley and Valsangkar, 2013, 2014).
� Hunan University (China). Fullscale test of an 8 mlong approach slab, 7% slope with cement base course reinforced with glass fiber geogrids. The test displacement is not reported. The study concluded that the cement base course cracks at very low levels of displacement (<1.5 mm) and the geogrid is not suitable as a reinforcing material due to its high flexibility. Reinforcing steel mesh is recommended for large deformations (Jin and Shao, 2006).
� École Polytechnique Fédérale De Lausanne (Switzerland). Experimental test of a semiintegral abutment with a 4.1 mlong, 2.2 mwide, 250 mmthick slab, 10% and 20% slope, 140 mmthick asphalt and 350 mm thick base course. Traffic loading was simulated with a 20ton pneumatic
roller at 6 km/h operating speed. Asphalt temperature varied from 15�C to 25�C. The tests concluded that increasing the buried depth at the far end of the slab is beneficial for redistribution of settlements in the base course and reduction of tensile strains in the asphalt. Smooth surfaces in the slab using plastic sheeting are unfavorable for the behavior of the pavement and should be avoided. The top surface of the slab should be made rough. The cracking strain of the asphalt was
�cracking � 0.026. The study notes that �cracking is a fundamental parameter to avoid cracking, especially in case of low temperatures as it is the most critical design situation, although the tests were not completed at low temperatures. Pavement mixes with a high content of polymer modified bitumen are recommended (Muttoni et al., 2013).
According to some of the transportation agencies and the research study by Muttoni et. al (2013), a buried slab sloped at 10% to 20% and pin connected to the abutment seem to be the preferred option for reducing the asphalt distress at the far end of the approach slab. This configuration differs from the current MTO design approach where the slab is horizontal and set near road grade with the asphalt supported directly on it. 3. FINITE ELEMENT MODEL The authors used finite element (FE) modeling to better understand and quantify the soil and asphalt behaviour of an integral abutment bridge with various approach slab arrangements. Firstly, this section describes the model of the overall abutment configuration which reproduced results from a known field monitoring application. Secondly, it describes the model of the approach slab, connection with the deck end, and asphalt. 3.1 PileAbutmentSlab Model A global finite element (FE) model was developed and calibrated for the New Brunswick Bridge case history (Huntley and Valsangkar, 2013) using the program Plaxis2D. The model included the Hpiles, the RC abutment, the RC slab and the granular backfill (Figure 2). The primary purpose of the global model was to validate the modelling technique to be used in the MTO approach slab study.
5
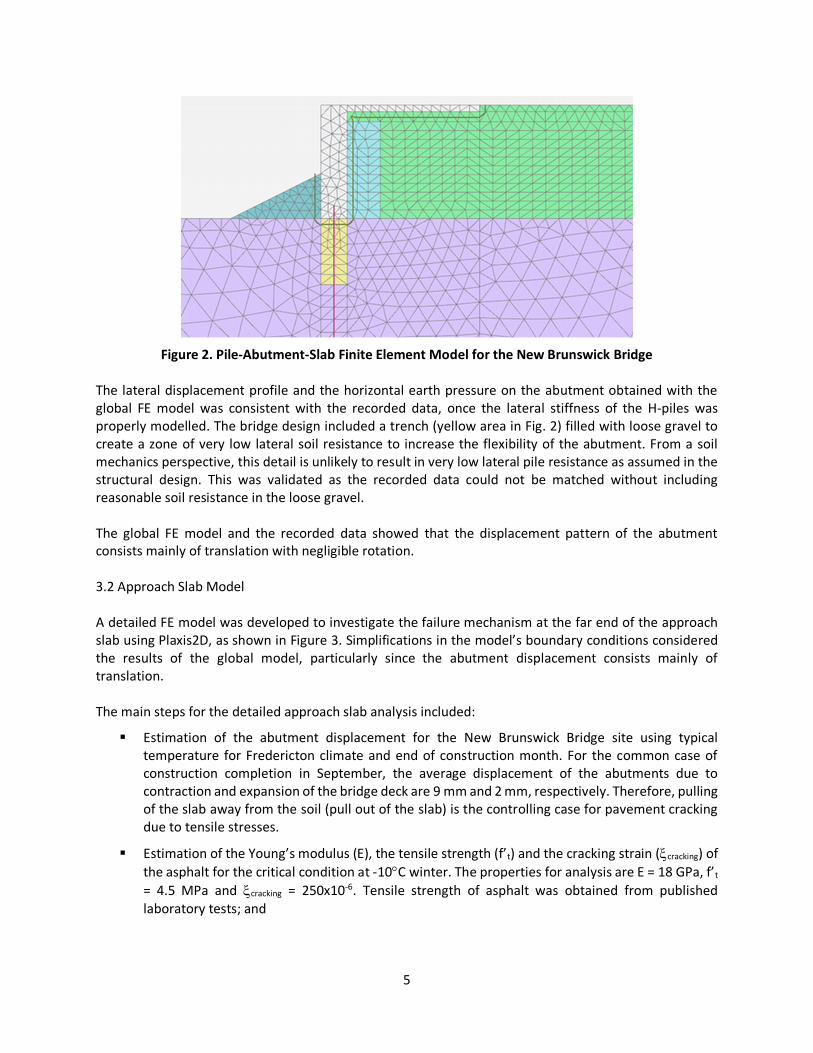
Figure 2. PileAbutmentSlab Finite Element Model for the New Brunswick Bridge The lateral displacement profile and the horizontal earth pressure on the abutment obtained with the global FE model was consistent with the recorded data, once the lateral stiffness of the Hpiles was properly modelled. The bridge design included a trench (yellow area in Fig. 2) filled with loose gravel to create a zone of very low lateral soil resistance to increase the flexibility of the abutment. From a soil mechanics perspective, this detail is unlikely to result in very low lateral pile resistance as assumed in the structural design. This was validated as the recorded data could not be matched without including reasonable soil resistance in the loose gravel. The global FE model and the recorded data showed that the displacement pattern of the abutment consists mainly of translation with negligible rotation. 3.2 Approach Slab Model A detailed FE model was developed to investigate the failure mechanism at the far end of the approach slab using Plaxis2D, as shown in Figure 3. Simplifications in the model’s boundary conditions considered the results of the global model, particularly since the abutment displacement consists mainly of translation. The main steps for the detailed approach slab analysis included:
� Estimation of the abutment displacement for the New Brunswick Bridge site using typical temperature for Fredericton climate and end of construction month. For the common case of construction completion in September, the average displacement of the abutments due to contraction and expansion of the bridge deck are 9 mm and 2 mm, respectively. Therefore, pulling of the slab away from the soil (pull out of the slab) is the controlling case for pavement cracking due to tensile stresses.
� Estimation of the Young’s modulus (E), the tensile strength (f’t) and the cracking strain (�cracking) of
the asphalt for the critical condition at 10�C winter. The properties for analysis are E = 18 GPa, f’t
= 4.5 MPa and �cracking = 250x106. Tensile strength of asphalt was obtained from published laboratory tests; and

6
� Calculation of equivalent traffic loads for plane strain analysis using the CL625ONT Truck design loads (CSA S614).
The finite element model included the asphalt (90 mmthick), base and subbase pavement layers (450 mmthick), concrete approach slab (250 mmthick) and the granular backfill (5.3 mthick). The asphalt and the approach slab were modeled as elastic materials while the base, subbase and backfill were modeled as elasticperfectly plastic materials using the MohrCoulomb model. Interaction of the asphalt, the approach slab and the abutment with the granular materials was modeled with frictional interfaces. For the case of asphalt supported directly on the approach slab, the interaction was modeled with a cohesive interface. A pinned connection was assumed between the slab and the abutment; therefore, the slab is free to rotate and translate with the abutment. The simulation considered 10 mm and 25 mm pullout displacement analyses of the slab and the abutment. Figure 3 shows the detailed model developed for the approach slab. The analysis included three stages: 1. gravity load, 2. abutment and approach slab displacement and 3. traffic load. Maximum tensile strain was tracked at the base of the asphalt to identify the potential for cracking. Asphalt cracking is commonly observed at the bridge deck end of IAB due to a) incompatibility of temperatureinduced contraction between the bridge deck and the asphalt, b) rotation of the approach slab, and c) shear and tensile stress in the asphalt induced by traffic loading and deflection of the approach slab. Asphalt cracking was modeled by disconnecting the vertical face of the asphalt from the pullout displacement as shown in Figure 4b.
Figure 3. Detailed finite element model for the approach slab

7
a) Lateral displacement applied to the asphalt b) No lateral displacement applied to the at the bridge end (no gap/no crack) asphalt at the bridge end (gap/crack)
Figure 4. Modeling considerations for including asphalt cracking at the bridge end 4. FAILURE MECHANISM The success of the transition between the asphalt of the approach roadway and the asphalt on the bridge deck, without resorting to an expansion joint, is a function of cracking in the asphalt. The identification of the failure mechanism of the asphalt included three cases:
� Semiintegral abutment with horizontal slab (standard MTO approach slab) � pull out of the slab only;
� Integral abutment with horizontal slab (standard MTO approach slab) � pull out of both the slab and the abutment; and
� Integral abutment with slab sloped at 6H:1V (�17% inclination) and 200 mm minimum
embedment (alternative approach slab configuration) � pull out of the slab and the abutment. The third case is described in detail to explain the failure mechanism but the same phenomenon was observed for the first two cases, albeit on a much smaller scale. The FE model showed that the pullout displacement of the slab (due to contraction of the bridge deck) initiates an active failure mechanism in the backfill at the far end of the approach slab, which creates settlements and a gap between the asphalt and the base course due to the high stiffness and strength of the asphalt (the asphalt stiffness and strength are high at the time of year when the bridge contracts). Then the strength of the asphalt is exceeded when the unsupported section of the asphalt is loaded with traffic (Figure 5).
a) displacement and void b) active failure wedge c) gap under asphalt

8
d) axial strain in asphalt due to traffic loading
Figure 5. Failure mechanism at the far end of the approach slab for 25 mm movement, after traffic
loading
The identification of the failure mechanism with the FE model is consistent with the observations of the
fullscale test performed by Muttoni et al. (2013). For example, very minor settlements were observed in
the 140 mmthick asphalt at the far end of the approach slab for lateral slab displacements before cracking
(60 mm). After cracking, the settlements increased abruptly to about 10 mm, suggesting that a gap had
been previously developed under the asphalt.
5. MODELING TO SIMULATE MTO’s FIELD OBSERVATIONS
The standard MTO approach slab, a horizontal slab set near road grade with 90 mm of asphalt supported
directly on it, creates a cohesive interface between the asphalt and the slab, which induces high axial
strains in the asphalt at the far end of the slab.
The displacements induced in the asphalt occur gradually with time. The stiffness Edyn used in the FE model
represents the dynamic modulus due to traffic loading, which is applied relatively fast. In order to account
for the ratedependency of E, stress relaxation analyses were carried out to determine the equivalent axial
displacement in the asphalt for the same dynamic modulus Edyn.
The stress relaxation analysis consisted mainly in the determination of the lowrate stiffness for a period
of four months and one year. Extrapolation was carried out using available data of E vs Temperature vs
Cyclic loading period. A displacementbased weighted temperature of 4.2�C was estimated using the
climate data for the New Brunswick Bridge case history, located close to the city of Fredericton, Canada.
The estimated lowrate stiffness for four months and one year are Edyn = 2.6 MPa and 2.2 MPa,
respectively, which represents approximately an 85% relaxation of Edyn (Figure 6).

9
Figure 6. Estimation of lowrate stiffness of asphalt for Fredericton and Ontario climate conditions
Displacementbased weighted temperatures were also estimated for six cities in Ontario: Ottawa (2.6
�C), Toronto (0.7 �C), Kitchener (0.1 �C), London (0.6 �C), Hamilton (1.4 �C) and Windsor (2.7 �C). The
average relaxation of Edyn for these cities varied from 86% to 90%, which is very similar to that of
Fredericton. Figure 6 includes the E vs P curves for Toronto and Windsor.
Using equal stress principle and the lowrate stiffness modulus, an equivalent axial displacement in the
asphalt of about 1 mm and 3 mm was calculated for 10 mm and 25 mm of abutment displacement,
respectively, for the New Brunswick Bridge case history. The interface between the asphalt and the slab
was modeled as frictional and no cracking was assumed at the deck end in the validation (Figure 7).
Figure 7. Modeling consideration for including stress relaxation in the asphalt before traffic loading
The FE model indicated that no cracking occurs in the asphalt for 10 mm of abutment displacement (Figure
8) while cracking occurs for 25 mm of abutment displacement (Figure 9). Therefore, the results of the FE
model were able to reproduce MTO’s field observations of the performance of this joint.
0
4
8
12
16
20
1.E02 1.E+00 1.E+02 1.E+04 1.E+06 1.E+08
E (
GPa
)
Cyclic Loading: Period P (seconds)
Fredericton: 4.2 °C
Toronto: 0.7 °C
Windsor: 2.7 °C
4 months 1 year

10
Figure 8. Axial strain in asphalt for 10 mm abutment displacement: no cracking
Figure 9. Axial strain in asphalt for 25 mm abutment displacement: cracking
6. PARAMETRIC ANALYSIS AND PROPOSED SOLUTION
Based on the identification of the failure mechanism, a solution was sought to: a) reduce the maximum
tensile strain in the asphalt at the far end of the approach slab and b) reduce the length and thickness of
the gap of the unsupported section of asphalt.
The proposed solution is shown in Figure 10 and consists of:
� 250 mm of asphalt reinforced with one or three layers of GlasGrid; plus
� a sloping slab with minimum 200 mm of embedment below the bottom of asphalt at the
abutment; and
� a sleeper (disconnected slab) at the far end with a seal to avoid soil migration and a bond breaker
to provide a smooth surface for the slab displacement.
Verification of the proposed solution for preventing asphalt cracking was carried out with a parametric
study using finite element analysis.
The parametric study focused on integral abutments as they represent a more severe mobilization of
stresses and displacements in the backfill and the asphalt compared to semiintegral abutments. The cases
considered in the parametric analysis are summarized in Figure 11.
300
200
100
0
100
200
300
400
0 1 2 3 4 5 6 7 8 9 10 11 12
Asp
ha
lt S
tra
in (
mic
ro)
Distance from Abutment (m)
Maximum Strain for Tensile Cracking
Strain at Bottom of Asphalt
300
200
100
0
100
200
300
400
0 1 2 3 4 5 6 7 8 9 10 11 12
Asp
ha
lt S
tra
in (
mic
ro)
Distance from Abutment (m)
Maximum Strain for Tensile Cracking
Strain at Bottom of Asphalt

11
Figure 10. Proposed solution for approach slabs of integral abutment bridges
Figure 11. Parametric analysis for 10 mm and 25 mm pullout displacement
The results of the parametric study included vertical displacement profiles in the asphalt and in the base
course, length and thickness of the gap under the asphalt (i.e. Figure 12), maximum tensile strain in the
asphalt (i.e. Figure 13), deformed mesh plots (i.e. Figure 14), vertical displacement contour plots and
plastic points plots (i.e. Figure 15). Table 1 summarizes the main results of the parametric analysis.
Figure 12. Gap under the asphalt for 25 mm pullout displacement
Parametric Study for Integral Abutments
Approach Slab Asphalt
Depth
200 mm400 mm600 mm
Slope
1V:20H1V:10H1V:6H
Modification
None
+Buried sleeper
Thickness
90 mm250 mm
GlasGrid
1 layer3 layers
8
6
4
2
0
0 1 2 3 4 5 6 7 8 9 10 11 12
Ve
rtic
al
Ga
p (
mm
)
Asphalt Base: Interface

12
Figure 13. Axial strain in the asphalt for 25 mm pullout displacement
Figure 14. Deformed shape for 25 mm pullout displacement
Figure 15. Plastic points for 25 mm pullout displacement
200
100
0
100
200
300
400
0 1 2 3 4 5 6 7 8 9 10 11 12
Asp
ha
lt S
tra
in (
mic
ro)
Distance from Abutment (m)
Maximum Strain for Tensile Cracking
Strain at Bottom of Asphalt

13
Table 1. Summary of parametric analysis for slabs of integral abutments
�max: maximum tensile strain in asphalt, �max / �cracking < 1 means no cracking, �max / �cracking � 1 means cracking is likely
Effect of Embedment Depth
The first set of analyses considered 90 mm of asphalt supported on the base course and a 1V:10H slope
slab installed at 200 mm, 400 mm and 600 mm depth below the asphalt.
The 25 mm pullout displacement analyses indicated that the gap thickness increases slightly with depth,
the gap length increases with depth, and the cracking ratio �max / �crack also increases with depth. the effect
of the embedment depth of the slab on the main parameters that control asphalt cracking is:
Effect of Slab Inclination
The second set of analyses considered 90 mm of asphalt supported on the base course and a 1V:20H to
1V:6H slope slab installed at 200 mm depth below the asphalt.
The 25 mm pullout displacement analyses indicated that the gap thickness increases with depth, the gap
length increases with depth, and the crack ratio increases with depth.
The above analysis indicates that increasing the final depth of the far end of the approach slab, as a result
of increasing the inclination and/or the embedment depth, increases the length of the gap under the
asphalt as shown in Figure 16. This in turn increases the maximum axial strain in the unsupported section
of the asphalt when loaded with traffic, causing cracking if the tensile strength is exceeded. Nevertheless,
the inclination of the slab gradually transitions the vertical stiffness of the asphalt from the deck to the
soil, and avoids the potential for a pronounced bump between the deck end and approach slab.
There is a discrepancy between the FE analysis carried out in this study and the observations of the full
scale test performed by Muttoni et al. (2013), which concluded that increasing the inclination of the slab
reduces the tensile strain in the asphalt. Table 2 summarizes the conditions considered in the FE analysis
in this study versus those in the fullscale test.
Slope Depth Disp. Gap thick. Gap leng. �max/�crack Crack Gap thick. Gap leng. �max/�crack Crack �max/�crack Crack
mm mm mm m mm m
200 10 1 - 1.5 1 - 1.4 1 - 1.4 Yes ~0 0.2 - 0.7 0.4 - 0.8 No 0.3 - 0.4 No
to 25 6 - 7 1.2 - 1.6 1.1 - 1.6 Yes 1 - 3 0.5 - 1.1 0.7 - 1.1 No/Yes 0.4 - 0.6 No
600 �max
1V:20H 10 1 - 2 0.7 - 1.3 0.8 - 1.3 No/Yes ~0 0.5 - 1.1 0.6 - 1.2 No/Yes 0.2 - 0.4 No
to 25 6 - 8 0.8 - 1.5 0.8 - 1.4 No/Yes 2 - 3 0.7 - 1.1 0.8 - 1.2 No/Yes 0.3 - 0.5 No
1V:6H �max
+ buried sleeper
60% to 80% reduction
Approach Slab
increases with slope 10% to 20% reduction
200
~70% reduction
250 mm-thick asphalt90 mm-thick asphalt
increases with depth 20% to 45% reduction
1V:10H
90 mm-thick asphalt
+ buried sleeper

14
a) 1V:20H slab inclination b) 1V:10H slab inclination c) 1V:6H slab inclination
Figure 16. Vertical displacement contour plots for 25 mm pullout displacement of the slab
Table 2. Comparison of conditions in the FE analysis and the Fullscale test
The main difference is the lateral displacement of the abutment in the FE analysis, which causes
settlement of the backfill and the approach slab and contributes to the development of the gap under the
asphalt (Figure 14). On the other hand, the fixed condition of the abutment in the fullscale test causes
upward displacement of the slab, which tends to reduce the gap under the asphalt.
Another important difference is the traffic load, which is 3.2 times in the FE model in comparison to that
of the fullscale test. The asphalt in the FE model is about 35% thinner in comparison to that of the full
scale test, which has a very important impact in the maximum tensile strain at the bottom of the asphalt.
Finally, the tensile strain capacity of the asphalt in the FE model is just 1% of that reported in the fullscale
test. This is the result of the temperature conditions of 10�C in the FE model versus 15�C to 25�C in the
fullscale test. As indicated by Muttoni et al. (2013), low temperatures are the most critical design
situation for asphalt cracking.
Therefore, it is concluded that the conditions simulated for integral abutments with the FE model in this
study are not only different but also more demanding for the asphalt than those considered in fullscale
test for semiintegral abutments (Muttoni et al., 2013).
Effect of Buried Sleeper
The 25 mm pullout displacement analyses indicated that a buried sleeper reduces gap thickness up to
70%, reduces gap length, and reduces the crack ratio by 20 to 40%.
FEA (this study) Fullscale Test (Muttoni et al. 2013)
Abutment Integral SemiIntegral
Hor. Displacement Translates with the slab Fixed
Approach Slab Downward displacement Upward displacement
Traffic Load 64 ton (CL625ONT Truck) 20 ton
Asphalt Thickness 90 mm 140 mm
Temperature 10�C 15°C to 25�C
cracking (x106
) 250 26,000

15
The analyses indicate that the installation of the buried sleeper at the end of the approach slab reduces
the gap under the asphalt and therefore the maximum tensile strain. However, due to the low strain
capacity estimated for the asphalt in winter (�cracking = 250x106), cracking may still occur (�max/�crack � 1)
for the design truck.
One of the main advantages of the buried sleeper is the reduction of the gap thickness (�70%) under the
asphalt. For the case of flexible pavements, these could deform and bear on the base course due to the
small gap and reduce the strain demands in the asphalt. The reduction in the gap will also benefit the
transition at the end of the slab in the case of cracking.
Effect of Thicker Asphalt
The installation of the buried sleeper reduces the strain demands but not enough to accommodate the
design traffic load. Therefore, a thicker asphalt is required to prevent cracking.
The 25 mm pullout displacement analyses indicated that increasing the asphalt thickness to 250 mm
thick reduces the crack ratio �max / �crack to 20 to 40% of the value of a 90 mm layer thickness.
The main contribution of the increase of the asphalt thickness is the reduction of the maximum tensile
strain, which is inversely proportional to the square of the thickness.
Figure 17 summarizes the tensile strain demand ratio �max / �crack for different inclinations of the approach
slab. Figure 17a represents the case of only the approach slab and Figure 17b represents the proposed
solution, which includes the buried sleeper and the 250 mmthick asphalt.
a) approach slab + 90 mm asphalt b) + buried sleeper + 250 mm asphalt
Figure 17. Maximum strain demand ratio in the asphalt for 200 mm embedment depth
Effect of GlasGrid
The addition of the GlasGrid layers to the asphalt showed a very minor reduction in the tensile strains.
This is the result of the high stiffness of the asphalt in winter in comparison to that of the GlasGrid.
However, the addition of a GlasGrid layer at the lower part of the asphalt (25 mm min. cover) is beneficial
for:
� Redistribution of tensile stresses, especially in summer when the asphalt is softer; and
� Reduction of crack propagation in case of fatigue or thermal cracking.
0.81
1.3
0.8
1.1
1.4
0
0.5
1
1.5
1V:20H 1V:10H 1V:6H
max
/ cr
ack
ing
Approach Slab Slope
10 mm Disp. 25 mm Disp.
0.2 0.3 0.40.3 0.4 0.5
0
0.5
1
1.5
1V:20H 1V:10H 1V:6H
max
/ cr
acki
ng
Approach Slab Slope
10 mm Disp. 25 mm Disp.

16
7. EVALUATION OF BACKFILL REINFORCEMENT
Backfill reinforcement was also considered in this study to evaluate the reduction of the maximum axial
tensile strain in the asphalt.
Geogrid
The evaluation of the performance of geogrid as backfill reinforcement indicated that the reduction in the
tensile strain in the asphalt is very minor. This is due to the high flexibility of the geogrid relative to the
soil and the asphalt stiffness (Figure 18).
Figure 18. Deformed mesh for backfill reinforced with geogrid
Geocell
The effect of a very stiff geocell component was modeled assuming a 100 mmthick reinforced concrete
slab as an upper bound condition. The FE model showed that the stiff component spans the gap developed
by the active failure zone at the end of the approach slab and prevents loss of support of the asphalt
(Figure 19). However, the friction of the slab with the backfill creates a new gap under the asphalt at the
near end of the “stiff geocell”. The strain demand ratio in the asphalt at this location with traffic load is
�max/�cracking � 0.8, which is very close to the limit for cracking (Figure 20).
Based on the assumption of “slablike” stiffness and thickness considered for the geocell in the FE model
and the calculated high strain demand ratio, it is unlikely that a commercially available geocell will prevent
cracking in the asphalt for the design traffic load.

17
Figure 19. Deformed mesh for backfill reinforced with a very stiff geocell
Figure 20. Strain demand in asphalt for backfill reinforced with a very stiff geocell
8. ASSESSMENT OF CREEP EFFECTS IN ASPHALT DEFLECTION
The identification of the failure mechanism showed that the active failure of the backfill produces a gap
under the asphalt. This gap is developed gradually as the slab is displaced from the month of construction
completion to the coldest month. For the case of Ontario, this time period is typically about four months:
October to January.
The stiffness of asphalt is rate and temperature dependent. The stiffness reduces as the load frequency
reduces. Therefore, it is possible that the asphalt may bear on the base course and close the gap due to
the reduction of the stiffness in the fourmonth deformation period (October to January). In this case, the
axial strain demands in the asphalt due to traffic loading will be lower than those for the unsupported
case.
Figure 21 plots the dynamic modulus versus loading frequency for twentyone different typical Ontario
asphalt mixes tested by Shaheen et al. (2016) for a reference temperature of 21�C. The reduction of Edyn
with loading frequency F is due to the creep effects in the asphalt.
According to Figure 21, the dynamic modulus for a loading frequency of four months (F � 1x10⁷ Hz) and
T = 21�C is Edyn � 200 MPa.
The dynamic modulus of asphalt is also temperature dependent. As discussed previously, the
displacementbased weighted temperature in the fourmonth period of maximum contraction for
200
100
0
100
200
300
400
0 1 2 3 4 5 6 7 8 9 10 11 12
Asp
ha
lt S
tra
in (
mic
ro)
Distance from Abutment (m)
Maximum Strain for Tensile Cracking
Strain at Bottom of Asphalt

18
Fredericton and Ontario climate conditions varies from 4.2�C to 2.7�C, approximately. The estimated low
rate dynamic modulus for this temperature interval varies from Edyn � 1,100 MPa to 2,500 MPa (see Figure
6).
The creep analysis consisted of comparing the required E to close the gap under the asphalt due to the
induced deflection by its own weight with the estimated lowrate Edyn for Fredericton and Ontario climate
conditions.
Figure 21. Master curve of dynamic modulus of asphalt mixes for T = 21 C
(Shaheen et al., 2016)
Figure 22 illustrates the calculation of the deflection of the unsupported section of asphalt, which results
in:
E =� L�
32h� ����
where � is the unit weight of asphalt (22 kN/m3), L is the unsupported length, h is the asphalt thickness
and �max is the gap thickness.
Figure 22. Maximum deflection in a beam with uniformly distributed load
According to the FE analysis, the above parameters for a 10 mm pullout displacement of a slab with 200
mm of embedment, 1V:10H slope, 90 mm thick asphalt and no traffic load are L = 1 m, h = 90 mm and �max
= 2 mm, which results in E � 42 MPa.

19
The analysis indicates that the required “creep” modulus to close the gap (E � 42 MPa) and support the
asphalt on the base course is about 2% to 4% of that estimated for Fredericton and Ontario climate
conditions (Edyn = 1,100 MPa to 2,500 MPa) and 20% of that for T = 21�C (Edyn = 200 MPa).
Therefore, it is concluded that the asphalt is cannot creep fast enough to deform to the underlying base.
Therefore, longterm creep behavior is unlikely to allow it to remould and close the gap under the asphalt
and the asphalt will need to stand unsupported and holding its own weight.
Figure 23 shows an example of a large section of asphalt over top of the silver car that is unsupported and
holding its own weight. This confirms that the assumption of a small unsupported section of asphalt is
realistic.
Figure 23. Unsupported section of asphalt in a sinkhole
9. SUMMARY AND CONCLUSIONS
This paper presents the results of a study of alternative configurations of approach slabs at the end of
IABs, with the objective of reducing pavement cracking and settlement observed at the far end of the slab
in IABs in Ontario.
The study identified and modeled the failure mechanism in the asphalt using finite element analysis and
development and verification of a solution to reduce asphalt cracking.
The failure mechanism of the asphalt pavement is initiated by the pullout displacement of the approach
slab which initiates an active failure in the backfill at the far end of the slab. The active failure creates
settlements and a gap between the asphalt and the base course due to the high stiffness and strength of
the asphalt in winter, which is the season of maximum bridge contraction and pullout slab displacement.
Then the asphalt cracks and settles when its strength is exceeded due to the tensile stresses induced by
the traffic load on the unsupported section of the asphalt.
The proposed solution consists of 250 mm of asphalt reinforced with 3 or 4 layers of GlassGrid, or
equivalent over a 1V:20H inclined approach slab, with a buried sleeper at the far end of the approach slab.
20
The reinforced section of the asphalt extends from the abutment to 4 m beyond the far end of the
approach slab.
The verification with finite element analysis indicated that the reduction of the maximum strain demand
in the asphalt is about 70% with the proposed alternative approach slab configuration and cracking is
prevented or minimized for the Ontario design truck.
Informed by engineering analysis, Bridge Engineers, Foundation Engineers and Pavement Engineers can
confidently trial the details on upcoming IABs.
ACKNOWLEDGMENT
The authors are grateful for the funding for this study from MTO and we wish to acknowledge Ms. Becca
Lane, Head of Mero and Mr. Stephen Lee, Head of MTO Pavements and Foundations Section for their
support.
REFERENCES
Muttoni A., Dumont AG., Burdet O., Savvilotidou M., Einpaul J., and Nguyen, M. 2013. “Experimental
verification of integral bridge abutments”. Rapport OFROU, Switzerland.
Shaheen M., Tighe S., AlMayah A., and Safiuddin M. 2016. “Determination of dynamic modulus for hot
mix asphalt (HMA) required for mechanistic empirical pavement design guide (MEPDG) implementation”.
Ministry of Transportation, Provincial Highways Management Division Report, Highway Infrastructure
Innovation Funding Program. HIIFP Project 201222. Prepared by the University of Waterloo.
Shelley A. Huntley and Arun J. Valsangkar. 2013. “Field monitoring of earth pressures on integral bridge
abutments”. Canadian Geotechnical Journal. 50: 841857.
Shelley A. Huntley and Arun J. Valsangkar. 2014. “Behaviour of Hpiles supporting an integral abutment
bridge”. Canadian Geotechnical Journal. 51: 713734.
Xiaoqin Jin and Xudong Shao. 2006. “Experience of innovative integral bridges in China”. 7th International
Conference on Short and Medium Span Bridges, Montreal, Canada.