geotech smart24 data acquisition system input terminated ... · the itn-correct noise was...
TRANSCRIPT
SANDIA REPORT SAND2008-5446 Unlimited Release Printed August 2008
Geotech Smart24 Data Acquisition System Input Terminated Noise Seismic Response Adjusted Test: Streckeisen STS2-Low and High Gain, Guralp CMG3T and Geotech GS13 Seismometers Darren M. Hart, Randy Rembold and J. Mark Harris Prepared by Sandia National Laboratories Albuquerque, New Mexico 87185 and Livermore, California 94550 Sandia is a multiprogram laboratory operated by Sandia Corporation, a Lockheed Martin Company, for the United States Department of Energy’s National Nuclear Security Administration under Contract DE-AC04-94AL85000. Approved for public release; further dissemination unlimited.
2
Issued by Sandia National Laboratories, operated for the United States Department of Energy by Sandia Corporation. NOTICE: This report was prepared as an account of work sponsored by an agency of the United States Government. Neither the United States Government, nor any agency thereof, nor any of their employees, nor any of their contractors, subcontractors, or their employees, make any warranty, express or implied, or assume any legal liability or responsibility for the accuracy, completeness, or usefulness of any information, apparatus, product, or process disclosed, or represent that its use would not infringe privately owned rights. Reference herein to any specific commercial product, process, or service by trade name, trademark, manufacturer, or otherwise, does not necessarily constitute or imply its endorsement, recommendation, or favoring by the United States Government, any agency thereof, or any of their contractors or subcontractors. The views and opinions expressed herein do not necessarily state or reflect those of the United States Government, any agency thereof, or any of their contractors. Printed in the United States of America. This report has been reproduced directly from the best available copy. Available to DOE and DOE contractors from U.S. Department of Energy Office of Scientific and Technical Information P.O. Box 62 Oak Ridge, TN 37831 Telephone: (865) 576-8401 Facsimile: (865) 576-5728 E-Mail: [email protected] Online ordering: http://www.osti.gov/bridge Available to the public from U.S. Department of Commerce National Technical Information Service 5285 Port Royal Rd. Springfield, VA 22161 Telephone: (800) 553-6847 Facsimile: (703) 605-6900 E-Mail: [email protected] Online order: http://www.ntis.gov/help/ordermethods.asp?loc=7-4-0#online

SAND2008-5446 Unlimited Release
Printed August 2008
Geotech Smart24 Data Acquisition System Input Terminated Noise
Seismic Response Adjusted Test: Streckeisen STS2-Low and High Gain,
Guralp CMG3T and Geotech GS13 Seismometers
Darren M. Hart, Randy Rembold and J. Mark Harris Ground-based Monitoring R and E
Sandia National Laboratories P.O. Box 5800
Albuquerque, New Mexico 87185
Abstract Sandia National Laboratories has tested, evaluated and reported on the Geotech Smart24 data acquisition system with active Fortezza crypto card data signing and authentication in SAND2008-. One test, Input Terminated Noise, allows us to characterize the self-noise of the Smart24 system. By computing the power spectral density (PSD) of the input terminated noise time series data set and correcting for the instrument response of different seismometers, the resulting spectrum can be compared to the USGS new low noise model (NLNM) of Peterson (1996), and determine the ability of the matched system of seismometer and Smart24 to be quiet enough for any general deployment location. Four seismometer models were evaluated: the Streckeisen STS2-Low and High Gain, Guralp CMG3T and Geotech GS13 models. Each has a unique pass-band as defined by the frequency band of the instrument corrected noise spectrum that falls below the new low-noise model.

________________________________________________________________________ 4
________________________________________________________________________ 5
Table of Contents
1 EXECUTIVE SUMMARY.................................................................................................................. 7 1.1 SMART24 W/FORTEZZA 40SPS AND 40VPP ADC BOARD - DIGITIZER EVALUATION SUMMARY: ..... 7 1.2 CONCLUSIONS: ................................................................................................................................ 8
2 INTRODUCTION ................................................................................................................................ 9 2.1 SCOPE.............................................................................................................................................. 9 2.2 OBJECTIVES..................................................................................................................................... 9
3 DWR TEST AND EVALUATION PROGRAM ............................................................................... 9 3.1 TEST AND EVALUATION BACKGROUND........................................................................................... 9 3.2 STANDARDIZATION/TRACEABILITY................................................................................................. 9 3.3 DWR TEST/EVALUATION PROCESS................................................................................................. 9 3.4 TEST CONFIGURATION AND SYSTEM SPECIFICATIONS................................................................... 10
4 DWR – SMART24 TESTS ................................................................................................................ 10 4.1 STATIC PERFORMANCE TESTS ....................................................................................................... 10 4.2 DWR SEISMIC SENSOR APPLICATION TESTS................................................................................. 11
5 SUMMARY......................................................................................................................................... 12 5.1 SMART24 W/FORTEZZA 40SPS AND 40VPP ADC BOARD - DIGITIZER EVALUATION SUMMARY: ... 12 5.2 CONCLUSIONS: .............................................................................................................................. 13
6 APPENDIX I: DWR TEST DATA SHEETS.................................................................................. 14 6.1 SEISMOMETER TEST DATA SHEET: STS2 – LOW GAIN SEISMOMETER RESPONSE ......................... 15 6.2 SEISMOMETER TEST DATA SHEET: STS2 – HIGH GAIN SEISMOMETER RESPONSE ........................ 16 6.3 SEISMOMETER TEST DATA SHEET: CMG3T SEISMOMETER RESPONSE ......................................... 17 6.4 SEISMOMETER TEST DATA SHEET: GS13 SEISMOMETER RESPONSE ............................................. 18 6.5 SMART24 TEST DATA SHEET: 40 VPP ADC TEST – STATIC/ITN/MPDR.................................... 20 6.6 SMART24 TEST DATA SHEET: SEISMIC SYSTEM NOISE TEST ...................................................... 22 6.7 SMART24 TEST DATA SHEET: SEISMIC SYSTEM NOISE TEST ...................................................... 24 6.8 SMART24 TEST DATA SHEET: SEISMIC SYSTEM NOISE TEST ...................................................... 26 6.9 SMART24 TEST DATA SHEET: SEISMIC SYSTEM NOISE TEST ...................................................... 28
7 DISTRIBUTION ................................................................................................................................ 30

________________________________________________________________________ 6
________________________________________________________________________ 7
1 Executive Summary
Objective: The objective of this work was to evaluate the static performance of the Geotech Smart24 digitizer with Fortezza PCMCIA crypto card actively implementing the signing of data packets for its possible application with four seismometer models: the Streckeisen STS2-Low and High Gain, Guralp CMG3T and Geotech GS13. The results of this evaluation were compared to the USGS New Low Noise Model (NLNM) to determine the sensor’s effective passband (frequencies at which the instrument corrected input terminated noise spectrum is at or below the NLNM) when matched with the Smart24 data logger. Four frequencies, 0.02, 0.1 1.0 and 10 Hz, were chosen to make individual measurements of the amount of separation above or below the NLNM. Description: Smart24 digitizers used in certain applications need to have the capability to be configured to collect data from either an infrasound or seismic application. The one requirement for some sites is to have the capability to sign outgoing data packets. The Smart24 digitizer supports the use of a Fortezza PCMCIA Crypto Card for the purpose of data signing and authentication. For a seismic application the configuration is 40 Vpp ADC Board, LSB of 3.271e-6 V/count, three active channels and sampled at 40 sps. Digitizer testing focused on characterization of one unit serial number s1224 with a single ADC board serial number 1724, and one would expect that other Geotech Smart24 with Fortezza PCMCIA crypto cards to perform in a like manner.
The central recording facility at FACT uses the Geotech GeoHub software suite run on a standard PC for acquisition and data archiving the test data. The GeoHub system was designed for network and array operators to allow greater control in data acquisition, data concentration and distribution for data archiving via its flexible communication protocol. The basic data transmission path from the data loggers to database starts at the Smart24 with a RJ45 Ethernet connection to the FACT internal LAN. The PC running the GeoHub software was connected to the same LAN. The Smart24 and GeoHub communicate via fixed IP addresses. All test data were acquired in near real-time in CSS 3.0 flat-file database records in S4 format.
Testing was performed in a seismic vault for temperature stability. The Smart24 tested was set to the gain of 1, required for seismic or infrasound applications.
1.1 Smart24 w/Fortezza 40sps and 40Vpp ADC Board - Digitizer Evaluation Summary:
Static Performance: The input terminated noise was less than 0.97 counts RMS for the 0.02 to 20 Hz application band. The Maximum Potential Dynamic Range was better than 133.0 dB.
Application Performance STS2 low gain: When the ITN spectrum for the Smart24 was corrected for a Streckeisen STS2 low gain seismometer the resulting spectrum was at or below the USGS LNM minimum-earth noise model between 0.01 and 1 Hz.
The ITN-correct noise was approximately 2.151 nm/s RMS for the 0.02 to 20 Hz application band.
Application Performance STS2 high gain: When the ITN spectrum for the Smart24 was corrected for a Streckeisen STS2 high gain seismometer the resulting spectrum was at or below the USGS LNM minimum-earth noise model between 0.01 and 17 Hz.
The ITN-correct noise was approximately 0.1614 nm/s RMS for the 0.02 to 20 Hz application band.
Application Performance Guralp CMG 3T: When the ITN spectrum for the Smart24 was corrected for a Guralp CMG-3T seismometer the resulting spectrum was at or below the USGS LNM minimum-earth noise model between 0.01 and 1.3 Hz.
________________________________________________________________________ 8
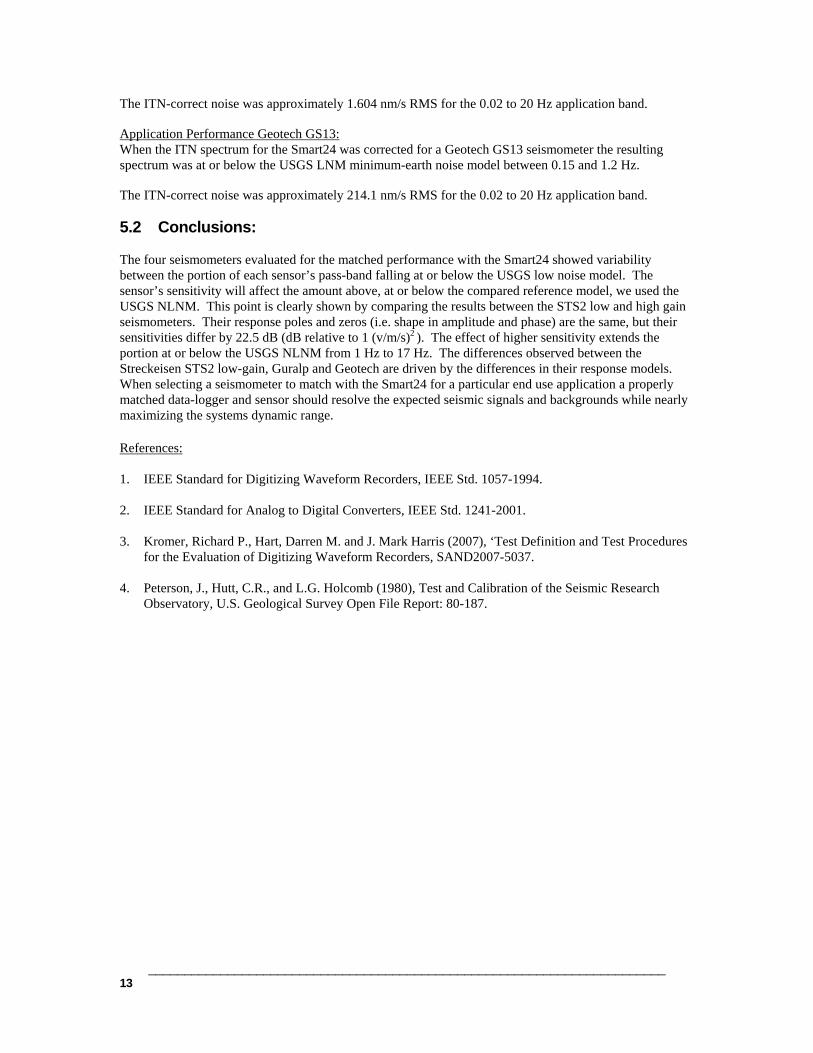
The ITN-correct noise was approximately 1.604 nm/s RMS for the 0.02 to 20 Hz application band.
Application Performance Geotech GS13: When the ITN spectrum for the Smart24 was corrected for a Geotech GS13 seismometer the resulting spectrum was at or below the USGS LNM minimum-earth noise model between 0.15 and 1.2 Hz.
The ITN-correct noise was approximately 214.1 nm/s RMS for the 0.02 to 20 Hz application band.
1.2 Conclusions: The four seismometers evaluated for the matched performance with the Smart24 showed variability between the portion of each sensor’s pass-band falling at or below the USGS low noise model. The sensor’s sensitivity will affect the amount above, at or below the compared reference model, we used the USGS NLNM. This point is clearly shown by comparing the results between the STS2 low and high gain seismometers. Their response poles and zeros (i.e. shape in amplitude and phase) are the same, but their sensitivities differ by 22.5 dB (dB relative to 1 (v/m/s)2 ). The effect of higher sensitivity extends the portion at or below the USGS NLNM from 1 Hz to 17 Hz. The differences observed between the Streckeisen STS2 low-gain, Guralp and Geotech are driven by the differences in their response models. When selecting a seismometer to match with the Smart24 for a particular end use application a properly matched data-logger and sensor should resolve the expected seismic signals and backgrounds while nearly maximizing the systems dynamic range.

________________________________________________________________________ 9
2 Introduction
2.1 Scope This Evaluation Report defines the activities that were performed as part of the evaluation of the Geotech Smart24 configured with a Fortezza Crypto PCMCIA Card describes the results of the testing.
2.2 Objectives The objective of this work was to evaluate the overall technical performance of the Geotech Smart24 digitizer while the Fortezza Card is enabled and signing data outbound data packets. Basic digitizer characterization includes determining LSB, DC offset, noise, dynamic range, time-tag accuracy, channel-to-channel cross-talk, total harmonic distortion and the calibrator’s performance. The results of this evaluation were compared to relevant application requirements or specifications of the Smart24 provided by the manufacturer.
3 DWR Test and Evaluation Program
3.1 Test and Evaluation Background Sandia National Laboratories (SNL), Ground-based Monitoring R&E Department has the capability of evaluating the performance of digitizing waveform recorders and analog-to-digital converters/high- resolution digitizers for geophysical applications.
3.2 Standardization/Traceability Most tests are based on the Institute of Electrical and Electronics Engineers (IEEE) Standard 1057 [Reference 1] for Digitizing Waveform Recorders and Standard 1241 for Analog to Digital Converters [Reference 2]. The analyses based on these standards were performed in the frequency domain or time domain as required. When appropriate, instrumentation calibration was traceable to the National Institute for Standards Technology (NIST).
3.3 DWR Test/Evaluation Process 3.3.1 SMART24 Testing Testing of the Smart24 w/Fortezza, serial number s1224, digitizer was performed between October 2007 and February 2008, at the Sandia National Laboratories Facility for Acceptance, Calibration and Testing (FACT Site), Albuquerque, NM. The unit arrived with one 20 Vpp ADC board installed, serial number 1360. The ADC board has an input range of 20 Volts peak-to-peak (Vpp). Testing the performance of a 40 Vpp ADC board, required that Sandia provide one for testing. The 40 Vpp ADC used for testing was serial number 1724 procured November 2007.
The Smart24 allows up to four data customer profiles to be configured. We configured profile #3 for testing at FACT. Configuration of the profile consisted of setting the peak-to-peak voltage, sample rate and channel naming convention. For both ADC board tested at 20sps data was labeled as c1s –channel 1, c2s – channel 2 and c3s – channel 3; the 40 sps data was labeled as BDF – channel 1, c2p – channel 2 and c3p – channel 3.
3.3.2 SMART24 General Digitizer Performance Tests The following tests were conducted on the Smart24 as described in the test plan: Test Definition and Test Procedures for the Evaluation of Digitizing Waveform Recorders [Reference 3].
The tests selected provide a high level of characterization for IMS when evaluating digitizers for seismic or acoustic applications.
Smart24 w/Fortezza 40Vpp and 40sps Configuration
________________________________________________________________________ 10
Static Performance Tests Input Terminated Noise (DWR-ITN)
Seismic Sensor Application Tests DWR Seismic System Noise Test (DWR-SSN)
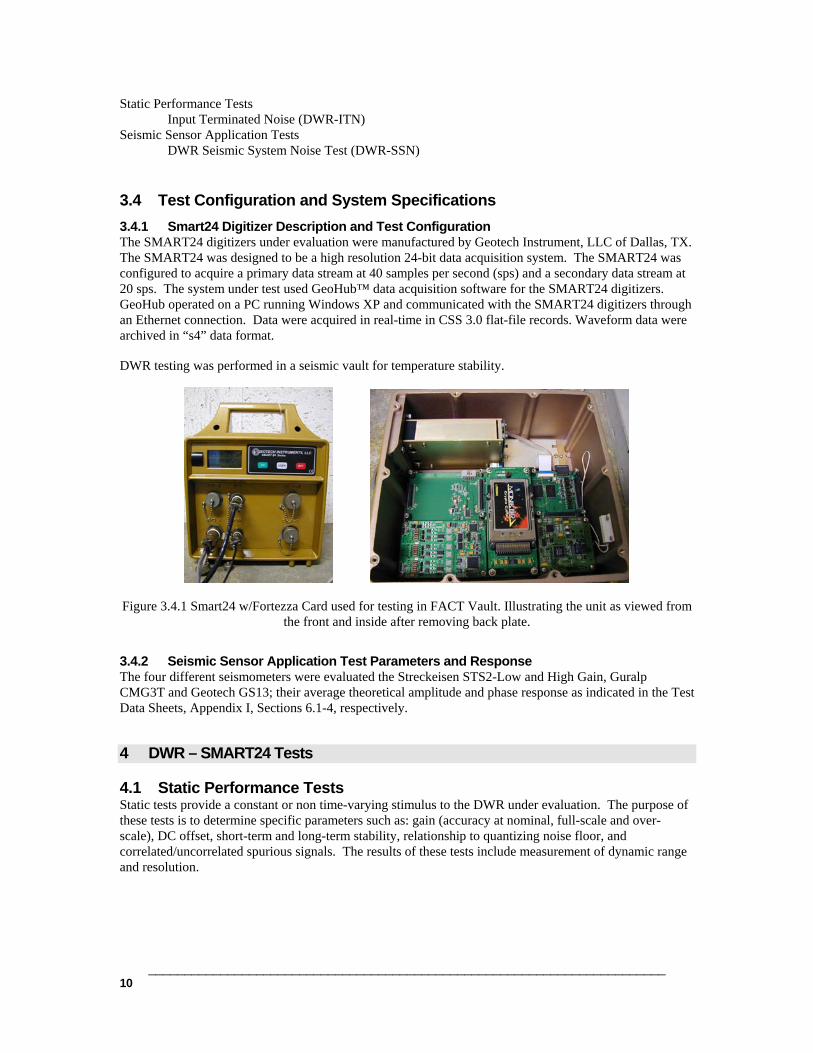
3.4 Test Configuration and System Specifications 3.4.1 Smart24 Digitizer Description and Test Configuration The SMART24 digitizers under evaluation were manufactured by Geotech Instrument, LLC of Dallas, TX. The SMART24 was designed to be a high resolution 24-bit data acquisition system. The SMART24 was configured to acquire a primary data stream at 40 samples per second (sps) and a secondary data stream at 20 sps. The system under test used GeoHub™ data acquisition software for the SMART24 digitizers. GeoHub operated on a PC running Windows XP and communicated with the SMART24 digitizers through an Ethernet connection. Data were acquired in real-time in CSS 3.0 flat-file records. Waveform data were archived in “s4” data format.
DWR testing was performed in a seismic vault for temperature stability.
Figure 3.4.1 Smart24 w/Fortezza Card used for testing in FACT Vault. Illustrating the unit as viewed from the front and inside after removing back plate.
3.4.2 Seismic Sensor Application Test Parameters and Response The four different seismometers were evaluated the Streckeisen STS2-Low and High Gain, Guralp CMG3T and Geotech GS13; their average theoretical amplitude and phase response as indicated in the Test Data Sheets, Appendix I, Sections 6.1-4, respectively.
4 DWR – SMART24 Tests
4.1 Static Performance Tests Static tests provide a constant or non time-varying stimulus to the DWR under evaluation. The purpose of these tests is to determine specific parameters such as: gain (accuracy at nominal, full-scale and over-scale), DC offset, short-term and long-term stability, relationship to quantizing noise floor, and correlated/uncorrelated spurious signals. The results of these tests include measurement of dynamic range and resolution.
________________________________________________________________________ 11
4.1.1 Input Terminated Noise (DWR-ITN) Purpose: The purpose of the input-terminated noise test was to verify the static parameters of the SMART24. These static parameters are dominated primarily by the random noise generated within the digitizer and from other components within the digitizer package. Configuration: The SMART24 Port 1 inputs were terminated with 100 ohms external resistors. Evaluation: A power density spectrum (PDS) of the input-terminated noise provided a measure of the noise floor of the SMART24. RMS noise in the 0.02 to 20 Hz bandwidth for 40 sps data, short term and long-term stability, relationship to quantizing noise floor and correlated and uncorrelated spurious signals were measured. Test Results: DWR Serial Number: 1224, ADC board: 1724 ITN/MPDR Test Data Sheet, Appendix I, Section 6.5. 4.2 DWR Seismic Sensor Application Tests Sensor application tests are those that provide a stimulus to the DWR or interpret data from the DWR that is related to a specific sensor application. The DWR selected for an application should match the characteristics of the interfaced sensor and the expected sensor signals and background. Seismic applications can use all of the available bandwidth when interfaced to broadband seismic sensors or just a part of the available bandwidth when interfaced to long-period or short-period seismic sensors. The choice of system parameters is partially determined by the background that is expected at the location of the sensor. A properly matched DWR/sensor can resolve the expected seismic signals and backgrounds while nearly maximizing the system dynamic range.
DWR Seismic System Noise (DWR-SSN) Purpose: The purpose of the seismic system noise test is to determine ability of the DWR to resolve the expected seismic background using a specific seismometer. The DWR self-noise should be below the expected seismic background and the self-noise of the seismometer. Configuration: The DWR inputs are terminated with the equivalent output impedance of the application sensor. For typical active sensors this is 50-100 ohms. For complex impedance sensors, a range of values may be appropriate. Evaluation: For a specific sensor application, convert the system noise of the DWR to ground motion using the application seismometer response mathematical model. The result of this computation can be overlaid with the USGS Low Earth Noise Model or a site specific seismic background to demonstrate the ability of the DWR to resolve the local seismic background. Test Results: DWR Serial Number: 1224 40sps SSN-STS2 LG Test Data Sheet, Appendix I, Section 6.6. DWR Serial Number: 1224 40sps SSN-STS2 HG Test Data Sheet, Appendix I, Section 6.7. DWR Serial Number: 1224 40sps SSN-CMG3T Test Data Sheet, Appendix I, Section 6.8. DWR Serial Number: 1224 40sps SSN-GS13 Test Data Sheet, Appendix I, Section 6.9.
________________________________________________________________________ 12
5 Summary
Objective: The objective of this work was to evaluate the static performance of the Geotech Smart24 digitizer with Fortezza PCMCIA crypto card actively implementing the signing of data packets for its possible application with four seismometer models: the Streckeisen STS2-Low and High Gain, Guralp CMG3T and Geotech GS13. The results of this evaluation were compared to the USGS New Low Noise Model (NLNM) to determine the sensor’s effective passband (frequencies at which the instrument corrected input terminated noise spectrum is at or below the NLNM) when matched with the Smart24 data logger. Four frequencies, 0.02, 0.1 1.0 and 10 Hz, were chosen to make individual measurements of the amount of separation above or below the NLNM. Description: Smart24 digitizers used in certain applications need to have the capability to be configured to collect data from either an infrasound or seismic application. The one requirement for some sites is to have the capability to sign outgoing data packets. The Smart24 digitizer supports the use of a Fortezza PCMCIA Crypto Card for the purpose of data signing and authentication. For a seismic application the configuration is 40 Vpp ADC Board, LSB of 3.271e-6 V/count, three active channels and sampled at 40 sps. Digitizer testing focused on characterization of one unit serial number s1224 with a single ADC board serial number 1724, and one would expect that other Geotech Smart24 with Fortezza PCMCIA crypto cards to perform in a like manner.
The central recording facility at FACT uses the Geotech GeoHub software suite run on a standard PC for acquisition and data archiving the test data. The GeoHub system was designed for network and array operators to allow greater control in data acquisition, data concentration and distribution for data archiving via its flexible communication protocol. The basic data transmission path from the data loggers to database starts at the Smart24 with a RJ45 Ethernet connection to the FACT internal LAN. The PC running the GeoHub software was connected to the same LAN. The Smart24 and GeoHub communicate via fixed IP addresses. All test data were acquired in near real-time in CSS 3.0 flat-file database records in S4 format.
Testing was performed in a seismic vault for temperature stability. The Smart24 tested was set to the gain of 1, required for seismic or infrasound applications.
5.1 Smart24 w/Fortezza 40sps and 40Vpp ADC Board - Digitizer Evaluation Summary:
Static Performance: The input terminated noise was less than 0.97 counts RMS for the 0.02 to 20 Hz application band. The Maximum Potential Dynamic Range was better than 133.0 dB.
Application Performance STS2 low gain: When the ITN spectrum for the Smart24 was corrected for a Streckeisen STS2 low gain seismometer the resulting spectrum was at or below the USGS LNM minimum-earth noise model between 0.01 and 1 Hz.
The ITN-correct noise was approximately 2.151 nm/s RMS for the 0.02 to 20 Hz application band.
Application Performance STS2 high gain: When the ITN spectrum for the Smart24 was corrected for a Streckeisen STS2 high gain seismometer the resulting spectrum was at or below the USGS LNM minimum-earth noise model between 0.01 and 17 Hz.
The ITN-correct noise was approximately 0.1614 nm/s RMS for the 0.02 to 20 Hz application band.
Application Performance Guralp CMG 3T: When the ITN spectrum for the Smart24 was corrected for a Guralp CMG-3T seismometer the resulting spectrum was at or below the USGS LNM minimum-earth noise model between 0.01 and 1.3 Hz.
________________________________________________________________________ 13
The ITN-correct noise was approximately 1.604 nm/s RMS for the 0.02 to 20 Hz application band.
Application Performance Geotech GS13: When the ITN spectrum for the Smart24 was corrected for a Geotech GS13 seismometer the resulting spectrum was at or below the USGS LNM minimum-earth noise model between 0.15 and 1.2 Hz.
The ITN-correct noise was approximately 214.1 nm/s RMS for the 0.02 to 20 Hz application band.
5.2 Conclusions: The four seismometers evaluated for the matched performance with the Smart24 showed variability between the portion of each sensor’s pass-band falling at or below the USGS low noise model. The sensor’s sensitivity will affect the amount above, at or below the compared reference model, we used the USGS NLNM. This point is clearly shown by comparing the results between the STS2 low and high gain seismometers. Their response poles and zeros (i.e. shape in amplitude and phase) are the same, but their sensitivities differ by 22.5 dB (dB relative to 1 (v/m/s)2 ). The effect of higher sensitivity extends the portion at or below the USGS NLNM from 1 Hz to 17 Hz. The differences observed between the Streckeisen STS2 low-gain, Guralp and Geotech are driven by the differences in their response models. When selecting a seismometer to match with the Smart24 for a particular end use application a properly matched data-logger and sensor should resolve the expected seismic signals and backgrounds while nearly maximizing the systems dynamic range. References:
1. IEEE Standard for Digitizing Waveform Recorders, IEEE Std. 1057-1994. 2. IEEE Standard for Analog to Digital Converters, IEEE Std. 1241-2001. 3. Kromer, Richard P., Hart, Darren M. and J. Mark Harris (2007), ‘Test Definition and Test Procedures
for the Evaluation of Digitizing Waveform Recorders, SAND2007-5037. 4. Peterson, J., Hutt, C.R., and L.G. Holcomb (1980), Test and Calibration of the Seismic Research
Observatory, U.S. Geological Survey Open File Report: 80-187.

________________________________________________________________________ 14
6 Appendix I: DWR Test Data Sheets
________________________________________________________________________ 15
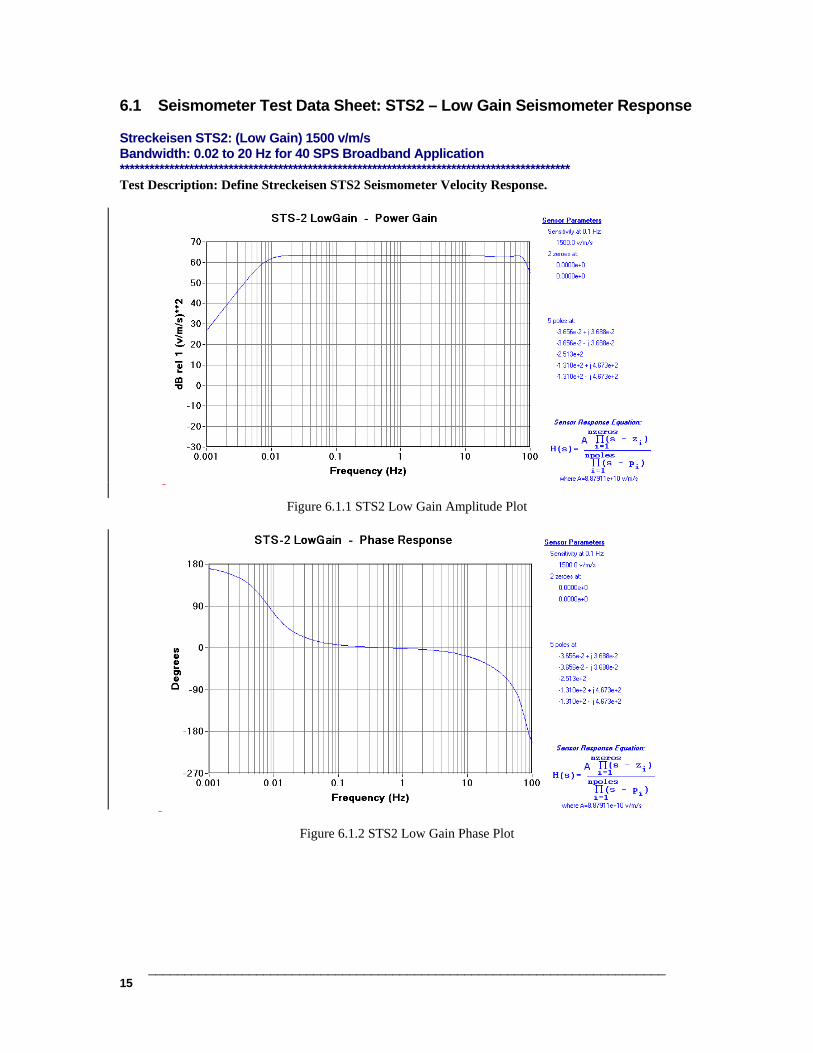
6.1 Seismometer Test Data Sheet: STS2 – Low Gain Seismometer Response Streckeisen STS2: (Low Gain) 1500 v/m/s Bandwidth: 0.02 to 20 Hz for 40 SPS Broadband Application ******************************************************************************************* Test Description: Define Streckeisen STS2 Seismometer Velocity Response.
Figure 6.1.1 STS2 Low Gain Amplitude Plot
Figure 6.1.2 STS2 Low Gain Phase Plot
________________________________________________________________________ 16
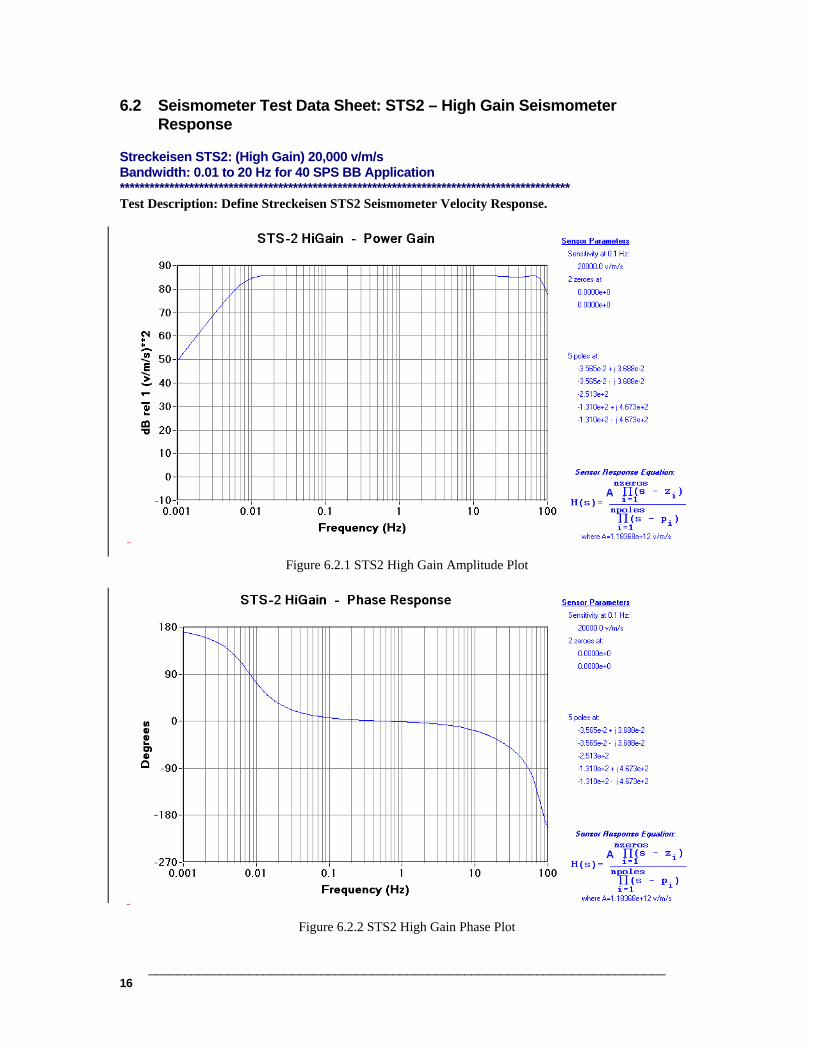
6.2 Seismometer Test Data Sheet: STS2 – High Gain Seismometer Response
Streckeisen STS2: (High Gain) 20,000 v/m/s Bandwidth: 0.01 to 20 Hz for 40 SPS BB Application ******************************************************************************************* Test Description: Define Streckeisen STS2 Seismometer Velocity Response.
Figure 6.2.1 STS2 High Gain Amplitude Plot
Figure 6.2.2 STS2 High Gain Phase Plot
________________________________________________________________________ 17
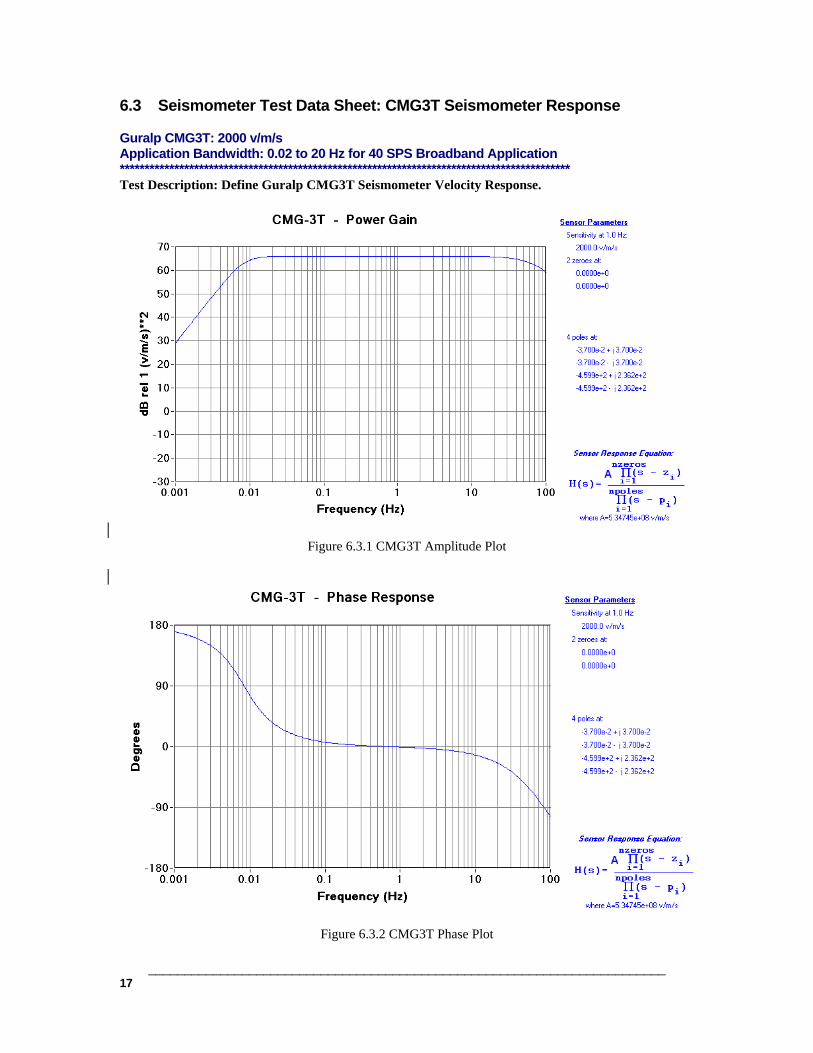
6.3 Seismometer Test Data Sheet: CMG3T Seismometer Response Guralp CMG3T: 2000 v/m/s Application Bandwidth: 0.02 to 20 Hz for 40 SPS Broadband Application ******************************************************************************************* Test Description: Define Guralp CMG3T Seismometer Velocity Response.
Figure 6.3.1 CMG3T Amplitude Plot
Figure 6.3.2 CMG3T Phase Plot
________________________________________________________________________ 18
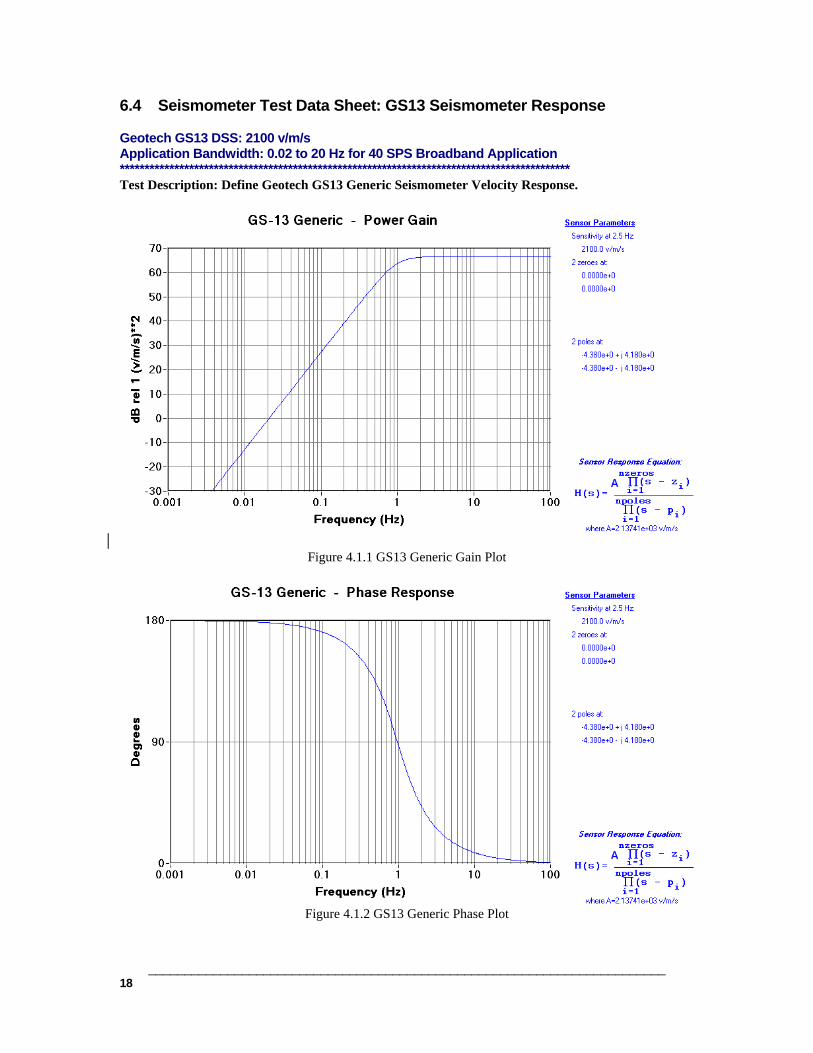
6.4 Seismometer Test Data Sheet: GS13 Seismometer Response Geotech GS13 DSS: 2100 v/m/s Application Bandwidth: 0.02 to 20 Hz for 40 SPS Broadband Application ******************************************************************************************* Test Description: Define Geotech GS13 Generic Seismometer Velocity Response.
Figure 4.1.1 GS13 Generic Gain Plot
Figure 4.1.2 GS13 Generic Phase Plot

________________________________________________________________________ 19
________________________________________________________________________ 20
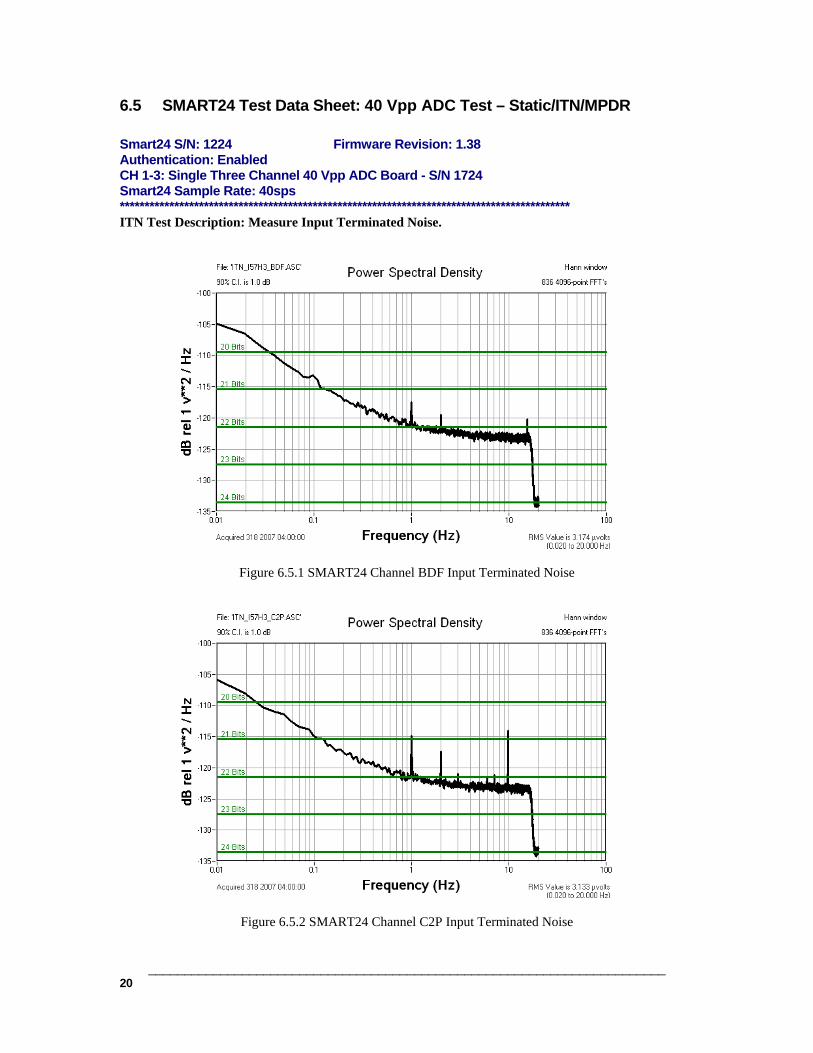
6.5 SMART24 Test Data Sheet: 40 Vpp ADC Test – Static/ITN/MPDR
Smart24 S/N: 1224 Firmware Revision: 1.38 Authentication: Enabled CH 1-3: Single Three Channel 40 Vpp ADC Board - S/N 1724 Smart24 Sample Rate: 40sps ******************************************************************************************* ITN Test Description: Measure Input Terminated Noise.
Figure 6.5.1 SMART24 Channel BDF Input Terminated Noise
Figure 6.5.2 SMART24 Channel C2P Input Terminated Noise

________________________________________________________________________ 21
Figure 6.5.3 SMART24 Channel C3P Input Terminated Noise
Channel RMS Noise µV 0.02 to 20 Hz
Counts RMS
BDF 3.174 0.968 C2P 3.133 0.956 C3P 3.174 0.967
Table 6.5.1 SMART24 40sps RMS Noise
Test Results: Figures 6.5.1-3 and Table 6.5.1 indicate that the SMART24 has < 0.97 counts RMS noise. MPDR Test Description: Compute Maximum Potential Dynamic Range using data from ITN Test.
Channel RMS Noise µV 0.02 to 20 Hz
RMS Full-Scale Volts
MPDR
BDF 3.174 14.14 133.0 C2P 3.133 14.14 133.1 C3P 3.174 14.14 133.0
Table 6.15.2 SMART24 40sps MPDR
Test Results: Table 6.5.2 indicates that the SMART24 Maximum Potential Dynamic Range is greater than 133.0 dB.
________________________________________________________________________ 22
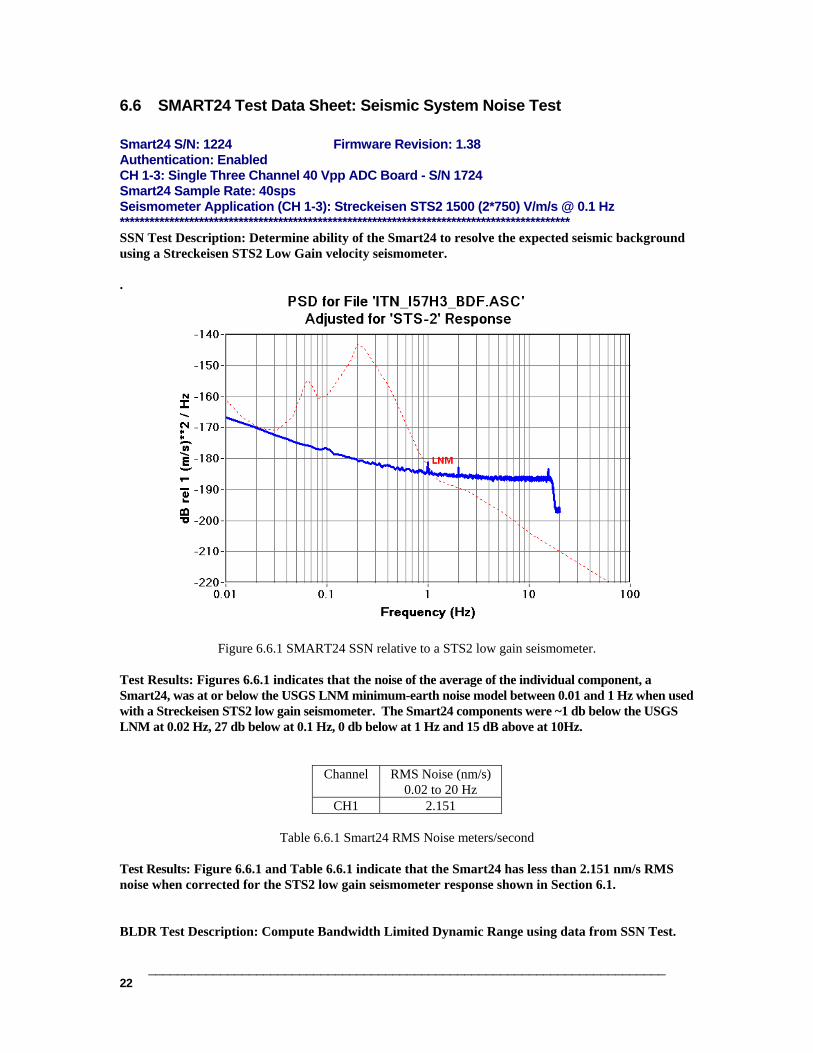
6.6 SMART24 Test Data Sheet: Seismic System Noise Test
Smart24 S/N: 1224 Firmware Revision: 1.38 Authentication: Enabled CH 1-3: Single Three Channel 40 Vpp ADC Board - S/N 1724 Smart24 Sample Rate: 40sps Seismometer Application (CH 1-3): Streckeisen STS2 1500 (2*750) V/m/s @ 0.1 Hz ******************************************************************************************* SSN Test Description: Determine ability of the Smart24 to resolve the expected seismic background using a Streckeisen STS2 Low Gain velocity seismometer. .
Figure 6.6.1 SMART24 SSN relative to a STS2 low gain seismometer. Test Results: Figures 6.6.1 indicates that the noise of the average of the individual component, a Smart24, was at or below the USGS LNM minimum-earth noise model between 0.01 and 1 Hz when used with a Streckeisen STS2 low gain seismometer. The Smart24 components were ~1 db below the USGS LNM at 0.02 Hz, 27 db below at 0.1 Hz, 0 db below at 1 Hz and 15 dB above at 10Hz.
Channel RMS Noise (nm/s) 0.02 to 20 Hz
CH1 2.151
Table 6.6.1 Smart24 RMS Noise meters/second
Test Results: Figure 6.6.1 and Table 6.6.1 indicate that the Smart24 has less than 2.151 nm/s RMS noise when corrected for the STS2 low gain seismometer response shown in Section 6.1. BLDR Test Description: Compute Bandwidth Limited Dynamic Range using data from SSN Test.
________________________________________________________________________ 23
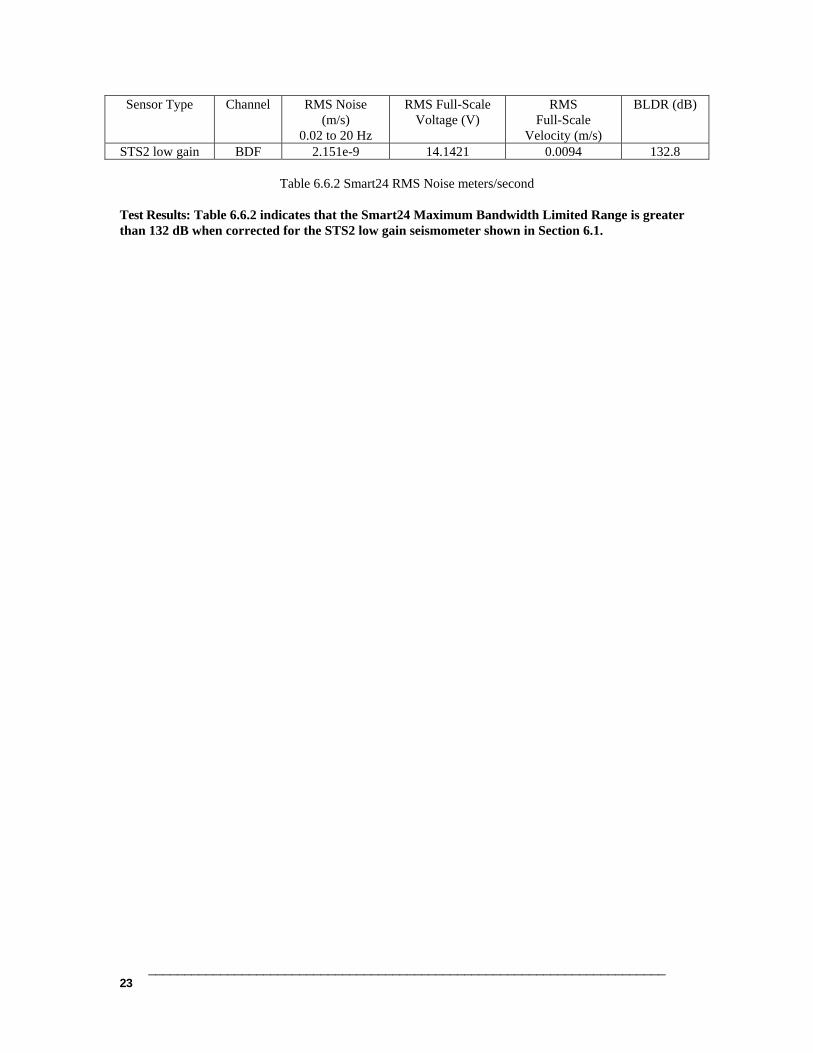
Sensor Type Channel RMS Noise (m/s)
0.02 to 20 Hz
RMS Full-Scale Voltage (V)
RMS Full-Scale
Velocity (m/s)
BLDR (dB)
STS2 low gain BDF 2.151e-9 14.1421 0.0094 132.8
Table 6.6.2 Smart24 RMS Noise meters/second
Test Results: Table 6.6.2 indicates that the Smart24 Maximum Bandwidth Limited Range is greater than 132 dB when corrected for the STS2 low gain seismometer shown in Section 6.1.
________________________________________________________________________ 24
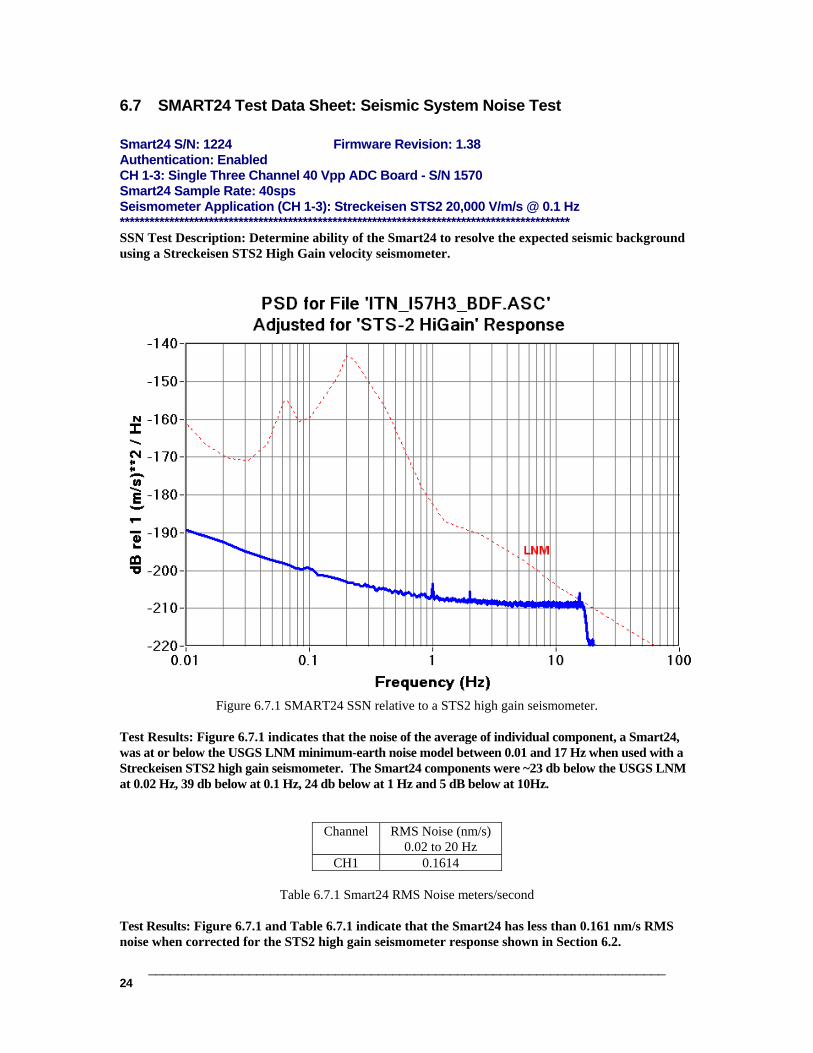
6.7 SMART24 Test Data Sheet: Seismic System Noise Test
Smart24 S/N: 1224 Firmware Revision: 1.38 Authentication: Enabled CH 1-3: Single Three Channel 40 Vpp ADC Board - S/N 1570 Smart24 Sample Rate: 40sps Seismometer Application (CH 1-3): Streckeisen STS2 20,000 V/m/s @ 0.1 Hz ******************************************************************************************* SSN Test Description: Determine ability of the Smart24 to resolve the expected seismic background using a Streckeisen STS2 High Gain velocity seismometer.
Figure 6.7.1 SMART24 SSN relative to a STS2 high gain seismometer.
Test Results: Figure 6.7.1 indicates that the noise of the average of individual component, a Smart24, was at or below the USGS LNM minimum-earth noise model between 0.01 and 17 Hz when used with a Streckeisen STS2 high gain seismometer. The Smart24 components were ~23 db below the USGS LNM at 0.02 Hz, 39 db below at 0.1 Hz, 24 db below at 1 Hz and 5 dB below at 10Hz.
Channel RMS Noise (nm/s) 0.02 to 20 Hz
CH1 0.1614
Table 6.7.1 Smart24 RMS Noise meters/second
Test Results: Figure 6.7.1 and Table 6.7.1 indicate that the Smart24 has less than 0.161 nm/s RMS noise when corrected for the STS2 high gain seismometer response shown in Section 6.2.
________________________________________________________________________ 25
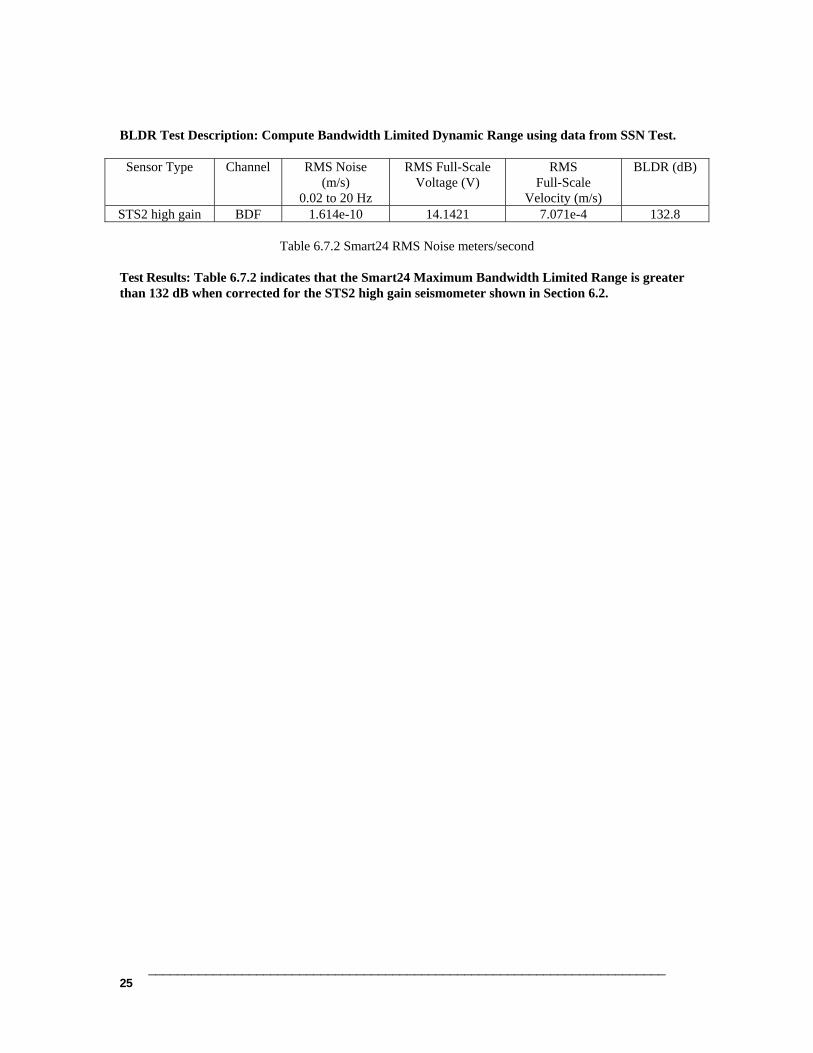
BLDR Test Description: Compute Bandwidth Limited Dynamic Range using data from SSN Test. Sensor Type Channel RMS Noise
(m/s) 0.02 to 20 Hz
RMS Full-Scale Voltage (V)
RMS Full-Scale
Velocity (m/s)
BLDR (dB)
STS2 high gain BDF 1.614e-10 14.1421 7.071e-4 132.8
Table 6.7.2 Smart24 RMS Noise meters/second
Test Results: Table 6.7.2 indicates that the Smart24 Maximum Bandwidth Limited Range is greater than 132 dB when corrected for the STS2 high gain seismometer shown in Section 6.2.

________________________________________________________________________ 26
6.8 SMART24 Test Data Sheet: Seismic System Noise Test
Smart24 S/N: 1224 Firmware Revision: 1.38 Authentication: Enabled CH 1-3: Single Three Channel 40 Vpp ADC Board - S/N 1570 Smart24 Sample Rate: 40sps Seismometer Application (CH 1-3): Guralp CMG3T 2000 V/m/s @ 1 Hz ******************************************************************************************* SSN Test Description: Determine ability of the Smart24 to resolve the expected seismic background using a Guralp CMG3T velocity seismometer.
Figure 6.8.1 SMART24 SSN relative to a Guralp CMG3T seismometer. Test Results: Figure 6.8.1 indicates that the noise of the average of the individual component, a Smart24, was at or below the USGS LNM minimum-earth noise model between 0.01 and 1.3 Hz when used with a Guralp CMG3T seismometer. The Smart24 components were ~3 db below the USGS LNM at 0.02 Hz, 20 db below at 0.1 Hz, 4 db below at 1 Hz and 14 dB above at 10Hz.
Channel RMS Noise (nm/s) 0.02 to 20 Hz
CH1 1.604
Table 6.8.1 Smart24 RMS Noise meters/second
________________________________________________________________________ 27
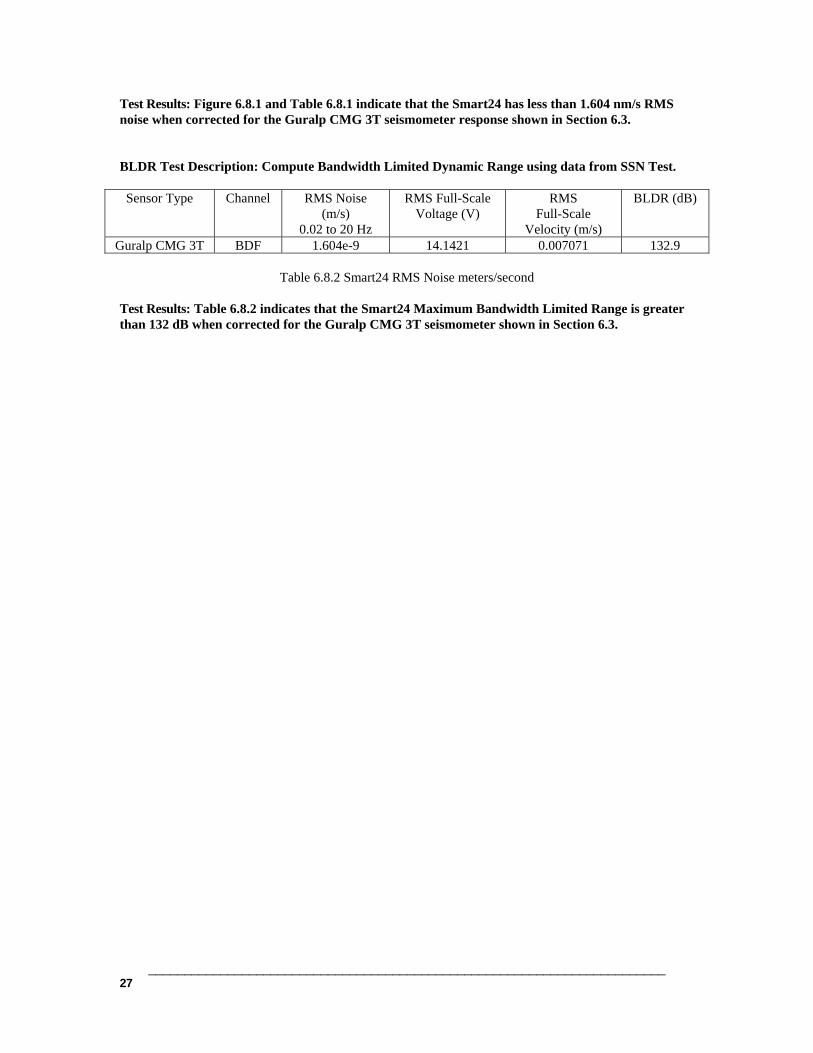
Test Results: Figure 6.8.1 and Table 6.8.1 indicate that the Smart24 has less than 1.604 nm/s RMS noise when corrected for the Guralp CMG 3T seismometer response shown in Section 6.3. BLDR Test Description: Compute Bandwidth Limited Dynamic Range using data from SSN Test. Sensor Type Channel RMS Noise
(m/s) 0.02 to 20 Hz
RMS Full-Scale Voltage (V)
RMS Full-Scale
Velocity (m/s)
BLDR (dB)
Guralp CMG 3T BDF 1.604e-9 14.1421 0.007071 132.9
Table 6.8.2 Smart24 RMS Noise meters/second
Test Results: Table 6.8.2 indicates that the Smart24 Maximum Bandwidth Limited Range is greater than 132 dB when corrected for the Guralp CMG 3T seismometer shown in Section 6.3.
________________________________________________________________________ 28
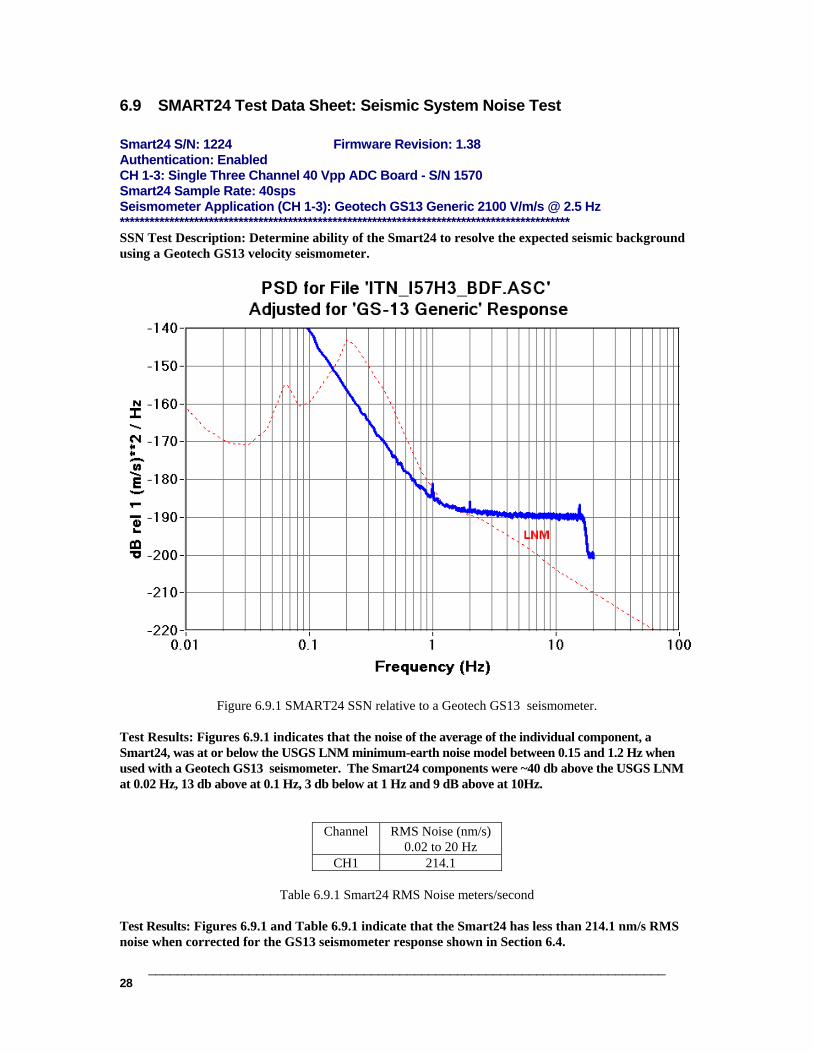
6.9 SMART24 Test Data Sheet: Seismic System Noise Test
Smart24 S/N: 1224 Firmware Revision: 1.38 Authentication: Enabled CH 1-3: Single Three Channel 40 Vpp ADC Board - S/N 1570 Smart24 Sample Rate: 40sps Seismometer Application (CH 1-3): Geotech GS13 Generic 2100 V/m/s @ 2.5 Hz ******************************************************************************************* SSN Test Description: Determine ability of the Smart24 to resolve the expected seismic background using a Geotech GS13 velocity seismometer.
Figure 6.9.1 SMART24 SSN relative to a Geotech GS13 seismometer. Test Results: Figures 6.9.1 indicates that the noise of the average of the individual component, a Smart24, was at or below the USGS LNM minimum-earth noise model between 0.15 and 1.2 Hz when used with a Geotech GS13 seismometer. The Smart24 components were ~40 db above the USGS LNM at 0.02 Hz, 13 db above at 0.1 Hz, 3 db below at 1 Hz and 9 dB above at 10Hz.
Channel RMS Noise (nm/s) 0.02 to 20 Hz
CH1 214.1
Table 6.9.1 Smart24 RMS Noise meters/second
Test Results: Figures 6.9.1 and Table 6.9.1 indicate that the Smart24 has less than 214.1 nm/s RMS noise when corrected for the GS13 seismometer response shown in Section 6.4.
________________________________________________________________________ 29
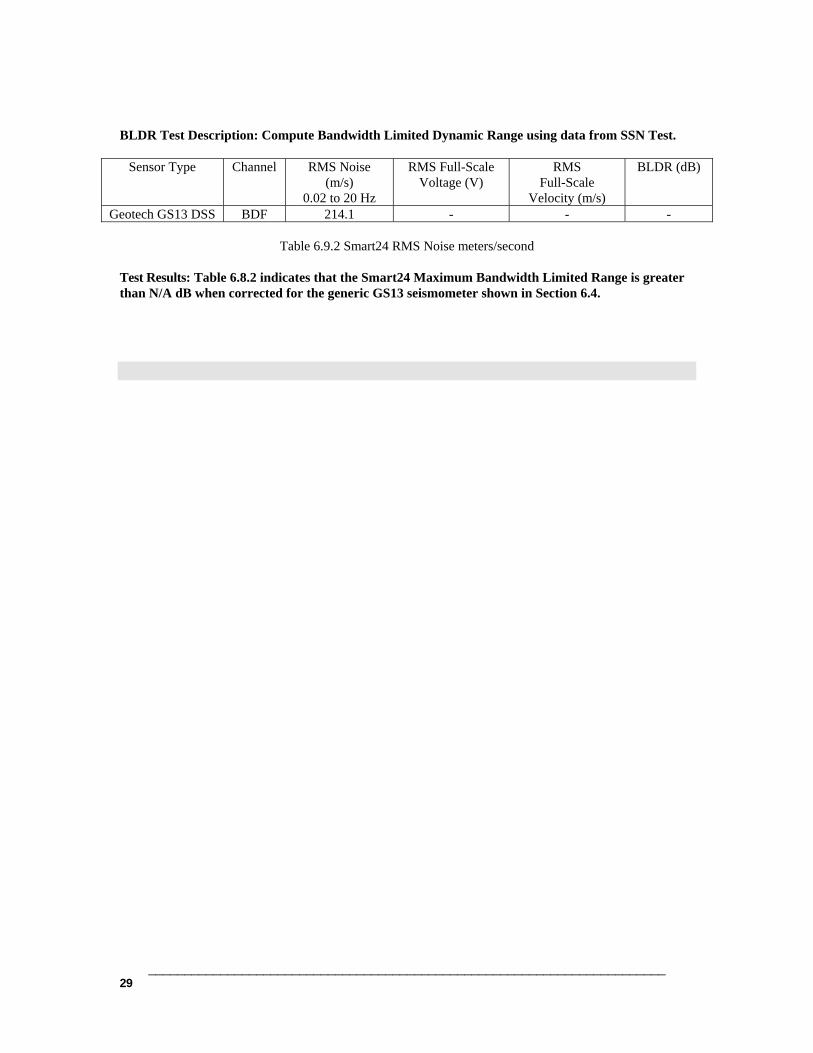
BLDR Test Description: Compute Bandwidth Limited Dynamic Range using data from SSN Test.
Sensor Type Channel RMS Noise (m/s)
0.02 to 20 Hz
RMS Full-Scale Voltage (V)
RMS Full-Scale
Velocity (m/s)
BLDR (dB)
Geotech GS13 DSS BDF 214.1 - - -
Table 6.9.2 Smart24 RMS Noise meters/second
Test Results: Table 6.8.2 indicates that the Smart24 Maximum Bandwidth Limited Range is greater than N/A dB when corrected for the generic GS13 seismometer shown in Section 6.4.

________________________________________________________________________ 30
7 DISTRIBUTION
1 MS0404 Bobby Corbell 05736 1 MS0404 Mark Harris 05736 1 MS0404 Darren Hart 05736 1 MS0404 John Merchant 05736 1 MS0404 Randy Rembold 05736 1 MS0899 Technical Library 9536