geotagging social media content with a refined language modelling approach
TRANSCRIPT

Geotagging Social Media Content with a Refined Language Modelling ApproachGeorgios Kordopatis-Zilos, Symeon Papadopoulos, and Yiannis Kompatsiaris
Centre for Research and Technology Hellas (CERTH) – Information Technologies Institute (ITI)
PAISI 2015, May 19, 2015, Ho Chi Minh City, Vietnam

Where is it?
#2
Depicted landmarkEiffel TowerLocationParis, Tennessee
Keyword “Tennesee” is very important to correctly place the photo.
Source (Wikipedia):http://en.wikipedia.org/wiki/Eiffel_Tower_(Paris,_Tennessee)

The Problem
• A lot of multimedia content is associated with geographic information
• Being able to collect and analyze large amounts of geotagged content could be very useful for several applications, e.g., situational awareness in incidents such as natural disasters, verification, geographic trends, etc.
• Yet, only a very small percentage of Web media content carries explicit information (i.e. GPS coordinates), for instance ~1% of tweets are geotagged
• To this end, methods that can infer the geographic location of Web multimedia content are of interest.
#3

A Refined Language Model for Geotagging
• Extend and improve the widely used Language Model for the problem of location estimation from text metadata
• The proposed improvements include:– Feature selection based on a cross-validation approach– Feature weighting based on spatial entropy– Multiple resolution grids
• Extensive evaluation on a public benchmark shows highly competitive performance and reveals new insights and challenges
#4

Related Work: Gazetteer-based
Methods that use large dictionaries and Volunteered Geographic Information (VGI), e.g., Geonames, Yahoo! GeoPlanet, OpenStreetMap, etc.• Semantics-based IR approach for integrating
gazetteers and VGI (Kessler et al., 2009)• Similarity matching mediating multiple gazetteers in
a meta-gazetteer service (Smart et al., 2010)• Comma groups extracted with heuristic methods
from lists of toponyms (Lieberman et al., 2010)
#5

Related Work: Language Models
Language Models: large corpora of geotagged text to create location-specific language model, i.e. what are the most frequent keywords for a given location• Base approach (Serdyukov et al., 2009)• Disjoint dynamically sized cells (Hauff et al., 2012)• User frequency instead of term frequency (O’Hare &
Murdock, 2012)• Clustering, use of χ2 for feature selection and
similarity search (Van Laere et al., 2011)
#6

Related Work: Multimodal Approaches
Multimodal approaches do not only use text, but also leverage the visual content and other social metadata of geotagged multimedia.• Combination of text metadata and visual content at
two levels of granularity, city- (100km) and landmark-level (100m) (Crandall et al., 2009)
• Build user models leveraging user’s upload history, SN data and hometown (Trevisiol et al., 2013)
• Hierarchical approach using both text-based and visual similarity (Kelm et al., 2011)
#7

Related Work: MediaEval Placing Task
• Yearly benchmarking task where different approaches compete– Each participant can submit up to 5 runs with different
instances/configurations of their method• Dataset for Placing Task 2014
– Flickr CC-licensed images & videos, subset of YFCC 100M– Training: 5M, Testing: 510K (multiple subsets of increasing size are
used for reporting)• Evaluation
– Estimated location of test image/video is compared against the known one, and it is checked whether it belongs to a circle of radius of 10m, 100m, 1km, 10km, 100km and 1000km
– Then, the percentage of images/videos that were correctly placed within each radius are reported, e.g., P@1km
• Competing approaches: both gazetteer- and LM-based
#8

Overview of Approach
#9

Geographic Language Model (1/2)
• Training data: Corpus Dtr of images and videos• Test data: Corpus Dts
• For each item (either in training or test data), we have: user id, title, tags, description
• Title and tags of training images used for building the model. For testing, description is used only if the item has neither title nor tags associated with it.
• Pre-processing: punctuation and symbol removal, lowercasing, numeric tags removed, composite phrases (e.g. “new+york” “new”, “york”) are split into their components
#10

Geographic Language Model (2/2)
• Generate rectangular grid C of areas (cells) of size 0.01⁰ x 0.01⁰ (~1km x 1km near equator)
• For each cell and each tag in the training corpus, compute the tag-cell probability:
– Nu: number of users in Dtr that used tag t inside the borders of c
– Nt: total count of users that used tag t in any cell
• For a new text T with N tags, compute the Most Likely Cell (MLC) cj based on the following:
#11

Geographic Language Model: Example
#12
new: 0.15york: 0.27manhattan: 0.45liberty: 0.33…nyc: 0.52

Feature Selection
• Retaining all possible tags of the training set might result in noise and overfitting and makes the resulting model very memory-demanding select only those tags that are really discriminative
• Use a variant of Cross-Validation on the training set: – split the training set in p folds (=10 in our tests)– use the p-1 folds for creating the LM and one for computing its
accuracy (P@r, where r is the radius we are interested to optimize)– compute tag geographicity: , where Nr is the number of correctly
classified items where tag t appears and Nt is the total number of items where tag t appears
– select only tags that exceed threshold θtgeo and that have been used by a minimum number of users θu
#13

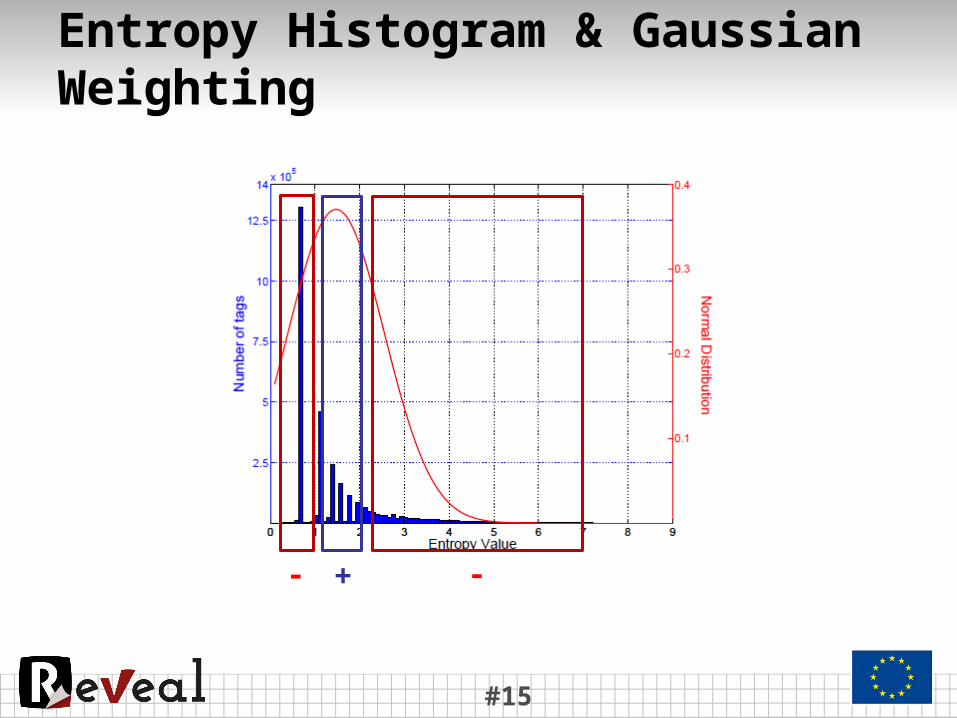
Feature Weighting using Spatial Entropy
• We want to penalize tags that appear in many different places and to give more importance to tags that appear only for specific places.
• To this end, we define a measure of the stochasticity of the tag’s appearance, i.e. its spatial entropy:
where M is the total number of cells.• Once the entropy values are computed, we apply Gaussian
normalization to suppress the weight of tags that take extreme values:
where N is the Gaussian function and μ, σ are the mean value and variance of the distribution and are estimated on Dtr.• Consequently, the MLC is computed based on:
#14
Entropy Histogram & Gaussian Weighting
#15
+ --

Similarity Search
• Having assigned an item to the Most Likely Cell (MLC), we refine the location estimate by searching for the most similar item in the cell.
• The k most similar items are retrieved (from Dtr) using Jaccard similarity on the respective sets of tags:
• The final estimation is the centre of gravity of the k most similar images:
where α determines how strongly the result is influenced by the most similar items.
• If less than k images are retrieved, then only those are used in the above calculation. If no similar images are retrieved, then the centre of MLC is provided as output.
#16

Multiple Resolution Grids
• To increase the granularity of the prediction and at the same time its reliability, we devised the following dual grid scheme:– we build two LMs: one of size 0.01° x 0.01° (coarse
granularity) and one of size 0.001° x 0.001° (fine granularity)
– conduct location estimations based on both– if the fine granularity estimations falls within the cell of the
estimation based on the coarse granularity, then we select the fine granularity
– otherwise, we select the coarse (since we consider it by default more reliable)
#17

Evaluation
• Benchmark dataset: MediaEval 2014• Training set: 5M, Test set: 510K• All experiments conducted on the full test set (510K)
• Two stages of evaluation:– participation in contest (with a limited version of the
proposed approach)– post-contest performance exploration
#18

Evaluation: MediaEval 2014 Contest (1/4)
• Out of the five runs, three were based on variations of the presented approach– run1: LM + feature weighting with spatial entropy +
similarity search + multiple resolution grid – run4: LM only– run5: LM + similarity search(similarity search parameters: α=1, k=4)
• Performance was measured with P@r, where r = 10m, 100m, 1km, 10km, 100km and 1000km
#19

Evaluation: MediaEval 2014 Contest (2/4)
#20
• Proposed improvements (run1) outperform base approach (run4) and base approach + similarity search (run5)
• The improvement is more pronounced in the small ranges (10m, 100m, 1km)

Evaluation: MediaEval 2014 Contest (3/4)
#21
Proposed
Proposed
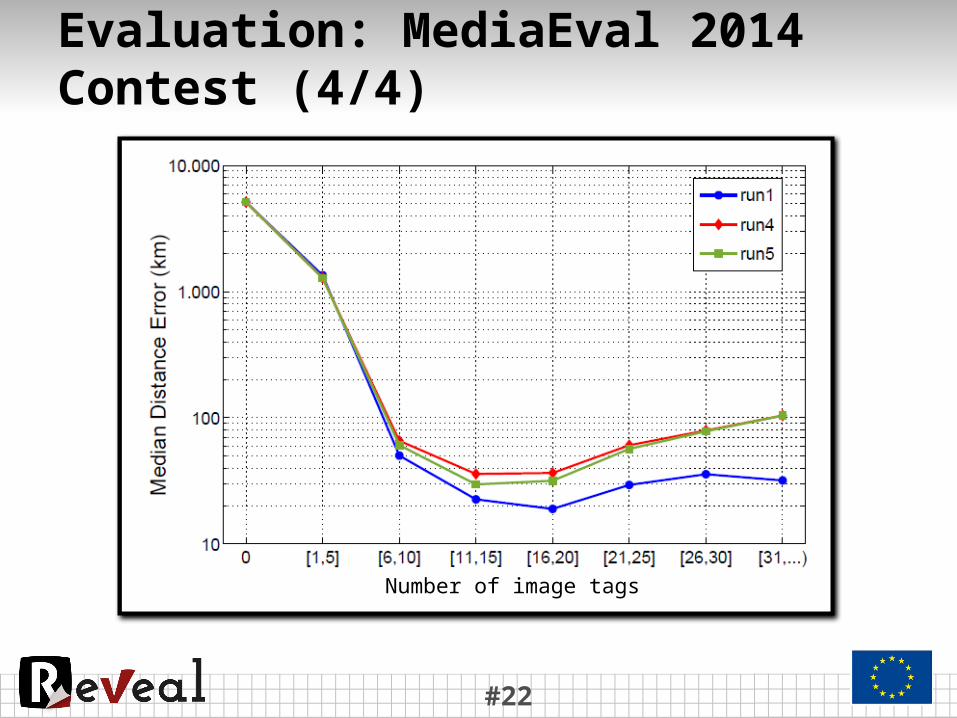
Evaluation: MediaEval 2014 Contest (4/4)
#22
Number of image tags
Post-Contest Evaluation
Explore the role of different factors: • Big training set (YFCC100M): ~48M geotagged items• Feature Selection (FS)• Feature Weighting with Spatial Entropy (SE)• Multiple Resolution Grid (MG)• Similarity Search (SS)Two settings:• FAIR: All users from the training set are completely
removed from the test set• OVERFIT: Users are not removed from the test set even
when some of their media items are included in the training set.
#23

Post-Contest Evaluation
#24
• Clear improvement with the addition of MG and SS• The proposed improvements together with the use
of the bigger dataset make the approach perform better than all other methods in MediaEval 2014
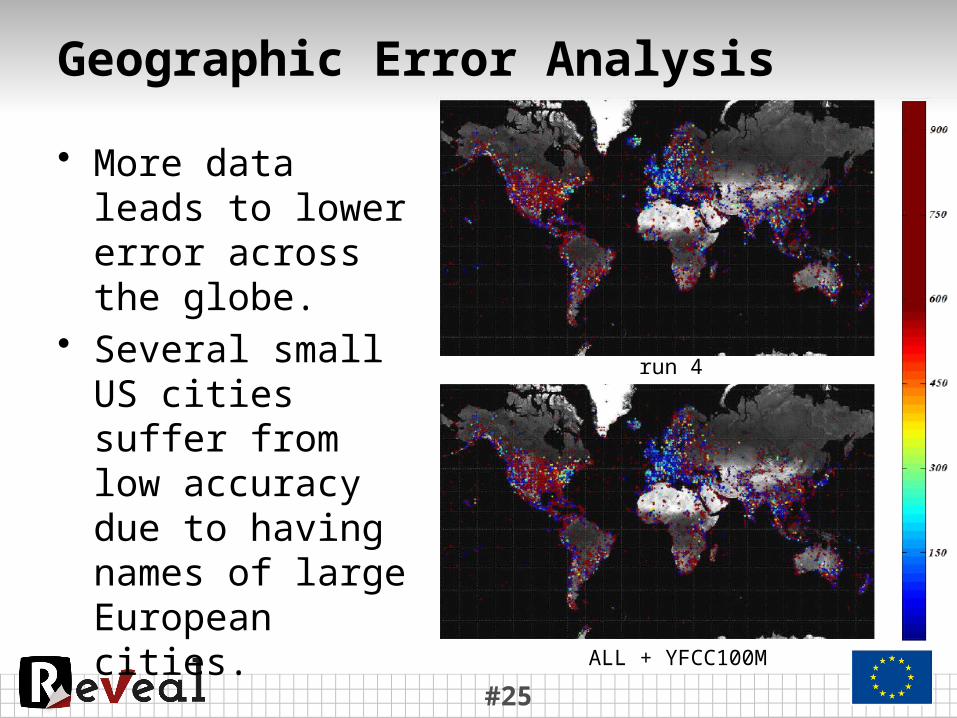
Geographic Error Analysis
• More data leads to lower error across the globe.
• Several small US cities suffer from low accuracy due to having names of large European cities.
#25ALL + YFCC100M
run 4

Big Data vs. Complex Algorithms
#26
Using 10x more data for training led to equivalent performance with using more complex algorithm (LM + extensions) with less data!

Placeability of Media Items
• Sum of cell-tag probabilities is a good indicator of how confident we are in the decision of the classifier.
#27

Complicated Cases
#28
Statue of Liberty

Security Incident Heatmaps
#29
earthquake
riot

Conclusion
• Key contributions– Improved geotagging approach, extending the widely used
language model in three ways: feature selection, weighting, multiple resolution grids
– Thorough analysis of geotagging accuracy offering new insights and highlighting new challenges
• Future Work– Exploit visual features to improve (currently visual-only
approaches perform very poorly)– Integrate gazetteer and structured location data sources (e.g.
Foursquare venues, OpenStreetMap, etc.)– Evaluate in more challenging settings and datasets (e.g. Twitter,
Instagram)#30

References (1/2)
• C. Kessler, K. Janowicz, and M. Bishr. An Agenda for the Next Generation Gazetteer: Geographic Information Contribution and Retrieval. In Proceedings of the 17th ACM SIGSPATIAL International Conference on Advances in Geographic Information Systems, pages 91100. ACM, 2009
• P. Smart, C. Jones, and F. Twaroch. Multi-source Toponym Data Integration and Mediation for a Meta-gazetteer Service. In Proceedings of the 6th international conference on Geographic information science. GIScience10. Springer-Verlag, Berlin, Heidelberg, 234248, 2010
• M.D. Lieberman, H. Samet, and J. Sankaranayananan. Geotagging: using Proximity, Sibling, and Prominence Clues to Understand Comma Groups. In Proceedings of the 6th Workshop on Geographic Information Retrieval, 2010
• P. Serdyukov, V. Murdock, and R. Van Zwol. Placing Flickr Photos on a Map. In SIGIR09, pages 484-491, New York, NY, USA, 2009. ACM
• C. Hauff and G. Houben. Geo-location Estimation of Flickr images: Social Web based Enrichment. ECIR 2012, p. 85-96. Springer LNCS 7224, April 1-5 2012
• N. O'Hare, and V. Murdock. Modeling Locations with Social Media. Information Retrieval, pp. 133, 2012
• O. Van Laere, S. Schockaert, and B. Dhoedt. Finding Locations of Flickr Resources using Language Models and Similarity Search. ICMR 11, New York, USA, 2011. ACM
#31

References (2/2)
• D.J. Crandall, L. Backstrom, D. Huttenlocher, and J. Kleinberg. Mapping the World's Photos. In Proceedings of the 18th international conference on World wide web, WWW 09, pages 761770, New York, NY, USA, 2009. ACM
• M. Trevisiol, H. Jegou, J. Delhumeau, and S. Gravier. Retrieving Geo-Location of Videos with a Divide and Conquer Hierarchical Multimodal Approach. ICMR13, Dallas, United States, April 2013. ACM
• P. Kelm, S. Schmiedeke, and T. Sikora. A Hierarchical, Multi-modal Approach for Placing Videos on the Map using Millions of Flickr Photographs. In Proceedings of the 2011 ACM Workshop on Social and Behavioural Networked Media Access, SBNMA 11, pages 1520, New York, NY, USA, 2011. ACM
#32

Thank you!
• Resources:Slides: http://www.slideshare.net/sympapadopoulos/reveal-geotaggingCode: https://github.com/socialsensor/multimedia-geotaggingBenchmark: http://www.multimediaeval.org/mediaeval2014/placing2014/
• Get in touch:@sympapadopoulos / [email protected] Kordopatis / [email protected]
#33