geospatial coastal zone
DESCRIPTION
Geospatial Coastal ZoneTRANSCRIPT

Visit the National Academies Press online, the authoritative source for all books from the National Academy of Sciences, the National Academy of Engineering, the Institute of Medicine, and the National Research Council: • Download hundreds of free books in PDF • Read thousands of books online for free • Explore our innovative research tools – try the “Research Dashboard” now! • Sign up to be notified when new books are published • Purchase printed books and selected PDF files
Thank you for downloading this PDF. If you have comments, questions or just want more information about the books published by the National Academies Press, you may contact our customer service department toll-free at 888-624-8373, visit us online, or send an email to [email protected]. This book plus thousands more are available at http://www.nap.edu. Copyright © National Academy of Sciences. All rights reserved. Unless otherwise indicated, all materials in this PDF File are copyrighted by the National Academy of Sciences. Distribution, posting, or copying is strictly prohibited without written permission of the National Academies Press. Request reprint permission for this book.
ISBN: 0-309-53110-1, 168 pages, 6 x 9, (2004)
This PDF is available from the National Academies Press at:http://www.nap.edu/catalog/10947.html
http://www.nap.edu/catalog/10947.html
We ship printed books within 1 business day; personal PDFs are available immediately.
A Geospatial Framework for the Coastal Zone: National Needs for Coastal Mapping and Charting
Committee on National Needs for Coastal Mapping and Charting, Mapping Science Committee, National Research Council
Committee on National Needs for Coastal Mapping and ChartingOcean Studies Board
Mapping Science Committee
Division of Earth and Life Studies
THE NATIONAL ACADEMIES PRESSWashington, D.C.www.nap.edu
A Geospatial Frameworkfor the
Coastal ZoneNational Needs for Coastal Mapping and Charting
Copyright © National Academy of Sciences. All rights reserved.
A Geospatial Framework for the Coastal Zone: National Needs for Coastal Mapping and Chartinghttp://www.nap.edu/catalog/10947.html
THE NATIONAL ACADEMIES PRESS • 500 Fifth Street, N.W. • Washington, DC 20001
NOTICE: The project that is the subject of this report was approved by the Governing Boardof the National Research Council, whose members are drawn from the councils of theNational Academy of Sciences, the National Academy of Engineering, and the Institute ofMedicine. The members of the committee responsible for the report were chosen for theirspecial competences and with regard for appropriate balance.
This study was supported by the National Oceanic and Atmospheric Administration,Department of Commerce, under Contract No. 56-DGNA-1-90024 TO#7; by the U.S. GeologicalSurvey, Department of the Interior, under Cooperative Agreement No. O1HQAGO217; andby the U.S. Environmental Protection Agency under Grant No. X-82951601. Any opinions,findings, conclusions, or recommendations expressed in this publication are those of theauthor(s) and do not necessarily reflect the views of the agencies that provided support forthe project.
Cover: Images courtesy Center for Coastal and Ocean Mapping, University of New Hamp-shire. Background image is USGS multibeam data from San Francisco Bay combined withUSGS topographic data; inset image is three-dimensional model of seamless offshore-on-shore dataset produced by Tampa Bay Bathy/Topo/Shoreline Demonstration Project, withhigh sea level superimposed. Cover designed by Michael D. Dudzik.
International Standard Book Number 0-309-09176-4 (Book)International Standard Book Number 0-309-53110-1 (PDF)Library of Congress Control Number 2004106115
Additional copies of this report are available from the National Academies Press, 500 FifthStreet, N.W., Lockbox 285, Washington, DC 20055; (800) 624-6242 or (202) 334-3313 (in theWashington metropolitan area); Internet, http://www.nap.edu
Copyright 2004 by the National Academy of Sciences. All rights reserved.
Printed in the United States of America
Copyright © National Academy of Sciences. All rights reserved.
A Geospatial Framework for the Coastal Zone: National Needs for Coastal Mapping and Chartinghttp://www.nap.edu/catalog/10947.html

The National Academy of Sciences is a private, nonprofit, self-perpetuating society ofdistinguished scholars engaged in scientific and engineering research, dedicated to thefurtherance of science and technology and to their use for the general welfare. Upon theauthority of the charter granted to it by the Congress in 1863, the Academy has a mandatethat requires it to advise the federal government on scientific and technical matters. Dr. BruceM. Alberts is president of the National Academy of Sciences.
The National Academy of Engineering was established in 1964, under the charter of theNational Academy of Sciences, as a parallel organization of outstanding engineers. It isautonomous in its administration and in the selection of its members, sharing with theNational Academy of Sciences the responsibility for advising the federal government. TheNational Academy of Engineering also sponsors engineering programs aimed at meetingnational needs, encourages education and research, and recognizes the superior achieve-ments of engineers. Dr. Wm. A. Wulf is president of the National Academy of Engineering.
The Institute of Medicine was established in 1970 by the National Academy of Sciences tosecure the services of eminent members of appropriate professions in the examination ofpolicy matters pertaining to the health of the public. The Institute acts under the responsi-bility given to the National Academy of Sciences by its congressional charter to be an adviserto the federal government and, upon its own initiative, to identify issues of medical care,research, and education. Dr. Harvey V. Fineberg is president of the Institute of Medicine.
The National Research Council was organized by the National Academy of Sciences in 1916to associate the broad community of science and technology with the Academy’s purposesof furthering knowledge and advising the federal government. Functioning in accordancewith general policies determined by the Academy, the Council has become the principaloperating agency of both the National Academy of Sciences and the National Academy ofEngineering in providing services to the government, the public, and the scientific and engi-neering communities. The Council is administered jointly by both Academies and theInstitute of Medicine. Dr. Bruce M. Alberts and Dr. Wm. A. Wulf are chair and vice chair,respectively, of the National Research Council.
www.national-academies.org
Copyright © National Academy of Sciences. All rights reserved.
A Geospatial Framework for the Coastal Zone: National Needs for Coastal Mapping and Chartinghttp://www.nap.edu/catalog/10947.html
Copyright © National Academy of Sciences. All rights reserved.
A Geospatial Framework for the Coastal Zone: National Needs for Coastal Mapping and Chartinghttp://www.nap.edu/catalog/10947.html

v
COMMITTEE ON NATIONAL NEEDS FORCOASTAL MAPPING AND CHARTING
LARRY A. MAYER (Chair), University of New Hampshire, DurhamKENNETH E. BARBOR, International Hydrographic Bureau, MonacoPAUL R. BOUDREAU, Canadian Department of Fisheries and Oceans,
Dartmouth, Nova ScotiaTHOMAS S. CHANCE, C&C Technologies, Lafayette, LouisianaCHARLES H. FLETCHER, University of Hawaii, HonoluluHOLLY GREENING, Tampa Bay Estuary Program, Saint Petersburg,
FloridaRONGXING LI, The Ohio State University, ColumbusCURT MASON, National Oceanic and Atmospheric Administration
(ret.), West VirginiaSUSAN SNOW-COTTER, Massachusetts Office of Coastal Zone
Management, BostonDAWN J. WRIGHT, Oregon State University, Corvallis
Ocean Studies Board Liaison
RALPH S. LEWIS, Connecticut Geological and Natural History Survey(ret.), Hartford
National Research Council Staff
DAVID A. FEARY, Study Director (from October 2003)TERRY SCHAEFER, Study Director (until October 2003)YVONNE FORSBERGH, Research AssistantBYRON MASON, Senior Project Assistant (from October 2002)ALISON SCHRUM, Project Assistant (until September 2002)
Copyright © National Academy of Sciences. All rights reserved.
A Geospatial Framework for the Coastal Zone: National Needs for Coastal Mapping and Chartinghttp://www.nap.edu/catalog/10947.html
vi
OCEAN STUDIES BOARD
NANCY RABALAIS (Chair), Louisiana Universities Marine Consortium,Chauvin
LEE G. ANDERSON, University of Delaware, NewarkWHITLOW AU, University of Hawaii at ManoaARTHUR BAGGEROER, Massachusetts Institute of Technology, CambridgeRICHARD B. DERISO, Inter-American Tropical Tuna Commission,
La Jolla, CaliforniaROBERT B. DITTON, Texas A&M University, College StationEARL DOYLE, Shell Oil (ret.), Sugar Land, TexasROBERT DUCE, Texas A&M University, College StationPAUL G. GAFFNEY II, Monmouth University, Long Branch, New JerseyWAYNE R. GEYER, Woods Hole Oceanographic Institution, MassachusettsSTANLEY R. HART, Woods Hole Oceanographic Institution, MassachusettsRALPH S. LEWIS, Connecticut Geological and Natural History Survey
(ret.), HartfordWILLIAM F. MARCUSON III, U.S. Army Corp of Engineers (ret.),
Vicksburg, MississippiJULIAN P. MCCREARY, JR., University of Hawaii, HonoluluJACQUELINE MICHEL, Research Planning, Inc., Columbia,
South CarolinaJOAN OLTMAN-SHAY, Northwest Research Associates, Inc., Bellevue,
WashingtonROBERT T. PAINE, University of Washington, SeattleSHIRLEY A. POMPONI, Harbor Branch Oceanographic Institution,
Fort Pierce, FloridaFRED N. SPIESS, Scripps Institution of Oceanography, La Jolla, CaliforniaDANIEL SUMAN, Rosenstiel School of Marine and Atmospheric Science,
University of Miami, Florida
National Research Council Staff
SUSAN ROBERTS, DirectorDAN WALKER, Senior Program OfficerJENNIFER MERRILL, Senior Program OfficerJOANNE BINTZ, Program OfficerTERRY SCHAEFER, Program Officer (until October 2003)ROBIN MORRIS, Financial OfficerSHIREL SMITH, Administrative AssociateJODI BACHIM, Senior Project AssistantNANCY CAPUTO, Senior Project AssistantBYRON MASON, Senior Project AssistantSARAH CAPOTE, Project Assistant
Copyright © National Academy of Sciences. All rights reserved.
A Geospatial Framework for the Coastal Zone: National Needs for Coastal Mapping and Chartinghttp://www.nap.edu/catalog/10947.html
vii
MAPPING SCIENCE COMMITTEEA standing committee of the
BOARD ON EARTH SCIENCES AND RESOURCES
DAVID J. COWEN, (Chair), University of South Carolina, ColumbiaKATHRINE CARGO, New Orleans Geographic Information Systems,
LouisianaKEITH C. CLARKE, University of California, Santa BarbaraWILLIAM J. CRAIG, University of Minnesota, MinneapolisISABEL F. CRUZ, University of Illinois, ChicagoROBERT P. DENARO, NAVTEQ Corporation, Chicago, IllinoisSHOREH ELHAMI, Delaware County Auditor’s Office, OhioDAVID R. FLETCHER, Geographic Paradigm Computing, Albuquer-
que, New MexicoHon. JAMES GERINGER, Environmental Systems Research Institute,
Inc., Wheatland, WyomingDAVID R. MAIDMENT, University of Texas, AustinMARK MONMONIER, Syracuse University, New YorkJOEL MORRISON, The Ohio State University (emeritus), ColumbusSHASHI SHEKHAR, University of Minnesota, MinneapolisNANCY TOSTA, Ross & Associates Environmental Consulting, Ltd.,
Seattle, Washington
National Research Council Staff
PAUL M. CUTLER, Senior Program OfficerRADHIKA S. CHARI, Senior Project Assistant
Copyright © National Academy of Sciences. All rights reserved.
A Geospatial Framework for the Coastal Zone: National Needs for Coastal Mapping and Chartinghttp://www.nap.edu/catalog/10947.html

Copyright © National Academy of Sciences. All rights reserved.
A Geospatial Framework for the Coastal Zone: National Needs for Coastal Mapping and Chartinghttp://www.nap.edu/catalog/10947.html

ix
Preface
While the academic community will long debate the relative rolesof science and technology in fostering an understanding of theworld around us, there can be little doubt that every so often
there are concomitant technical developments that set the stage for a majorleap in scientific understanding. This is indeed the case with respect toremote sensing, mapping, and data-handling technologies, where remark-able advances in the development of satellite-positioning systems, terrestrialand marine mapping sensors, and the digital manipulation of mappingdata using geographic information systems have revolutionized ourability to collect, distribute, analyze, and visualize geospatial data. Alongwith these technological developments has come an evolution in ourunderstanding of the fundamental importance of the coastal zone to thesocial, economic, and environmental well-being of the nation. With thisincreased understanding has also come a new appreciation for the com-plexity, sensitivity, and interconnectedness of the coastal zone system.This convergence of technology and scientific awareness heralds a newera of geospatial data handling and products that, for the first time, mayallow us to address some of the key challenges faced by those chargedwith understanding and managing the coastal zone. Recognizing thesetechnological advances, the critical importance of the coastal zone to thewell-being of the nation, and the fundamental role that mapping andcharting plays in understanding and managing the coastal zone, theNational Oceanic and Atmospheric Administration, the U.S. GeologicalSurvey, and the U.S. Environmental Protection Agency asked the National
Copyright © National Academy of Sciences. All rights reserved.
A Geospatial Framework for the Coastal Zone: National Needs for Coastal Mapping and Chartinghttp://www.nap.edu/catalog/10947.html

x PREFACE
Academies to provide an independent assessment of national coastal zonemapping and charting activities and needs.
With at least 15 federal agencies, almost all coastal states, and innu-merable local agencies, academic institutions, and private companiesinvolved in coastal mapping and charting, this assessment has been a verylarge and difficult task. Through a series of information-gathering exer-cises and meetings, we attempted to understand the short- and long-termmapping needs of the coastal zone community and to determine how wellcurrent activities are meeting these needs. We explored roadblocks togenerating the information needed in appropriate forms, and soughtapproaches for maximizing the efficiency of data collection and the valueof data products. While we cannot be assured that we covered every needand activity, we are confident that we have addressed the major issuesand hope that the recommendations we make will help establish an infra-structure for U.S. coastal zone mapping activities that will allow us toefficiently and effectively manage and preserve our wonderful coastalenvironments.
Larry MayerChair
Copyright © National Academy of Sciences. All rights reserved.
A Geospatial Framework for the Coastal Zone: National Needs for Coastal Mapping and Chartinghttp://www.nap.edu/catalog/10947.html
xi
This report was greatly enhanced by the participants at the four pub-lic committee meetings held as part of this study. The committeewould first like to acknowledge the efforts of those who gave
presentations at the meetings: Robert Ader, RADL Chris Andreasen,Rebecca Beavers, Doug Bellomo, Jim Bennett, Randall E. Billy, Nancy J.Blyler, James Brokaw, Darrell Brown, Stephen K. Brown, William S.Burgess, Margaret A. Davidson, Janet Freedman, Jason Freihage, John W.Haines, Tony LaVoi, W. Jeff Lillycrop, Daniel T. Mates, Bruce McKenzie,Anne Hale Miglarese, Mark E. Monaco, Bruce Parker, Derrick R. Peyton,Abby Sallenger, George F. Sharman, Kathy A. Shield, Karen Siderelis,Robert W. Smith, Joseph Stinus, E. Robert Thieler, Leland F. Thormahlen,and Charles Trees. These talks helped set the stage for fruitful discussionsin the sessions that followed.
The committee is also grateful to a number of people who providedimportant information, commentary, and material for this report: AnneBall, Jerry Bailes, Lenny Coats, Kim Cohen, Greg Colianni, Cindy Fowler,Norman Frommer, Keith Good, Walter R. Johnson, Jim Kendall, CharlesKovach, Pat Leahy, Michael Plastino, Barbara S. Poore, Nancy Rabalais,Steve Raber, Kevin Schexnayder, Miki Schmidt, Gregg Serenbetz, GregSnyder, Richard W. Spinrad, David Stein, Megan Treml, Bill Walker, ErikaWashburn, Pace Wilber, and James Woodley.
The committee would also like to thank the National Research Council(NRC) staff: David Feary, Yvonne Forsbergh, Morgan Gopnik, KristenKrapf, Byron Mason, Alison Schrum, Terry Schaefer, and Winfield Swanson
Acknowledgments
Copyright © National Academy of Sciences. All rights reserved.
A Geospatial Framework for the Coastal Zone: National Needs for Coastal Mapping and Chartinghttp://www.nap.edu/catalog/10947.html

xii ACKNOWLEDGMENTS
for helping us wend our way through the often complex maze of NRCreports.
This report has been reviewed in draft form by individuals chosen fortheir diverse perspectives and technical expertise, in accordance withprocedures approved by the National Research Council’s Report ReviewCommittee. The purpose of this independent review is to provide candidand critical comments that will assist the institution in making its pub-lished report as sound as possible and to ensure that the report meetsinstitutional standards for objectivity, evidence, and responsiveness to thestudy charge. The review comments and draft manuscript remain confi-dential to protect the integrity of the deliberative process. We wish tothank the following individuals for their participation in the review ofthis report:
John D. Bossler, Center for Mapping, The Ohio State University,Columbus
David J. Cowen, Department of Geography, University of SouthCarolina, Columbia
Joseph J. Cox, Chamber of Shipping of America, Washington, D.C.David A. Hart, University of Wisconsin Sea Grant Institute, MadisonNancy Musgrove, Management of Environmental Resources, Inc.,
Seattle, WashingtonRichard Pickrill, Marine Environmental Geoscience, Natural Resources
Canada, Dartmouth, Nova ScotiaWalter Schmidt, Florida State Geological Survey, TallahaseeKaren L. Steinmaus, Pacific Northwest Center for Global Security,
Pacific Northwest National Laboratory, Richland, Washington
Although the reviewers listed above provided many constructivecomments and suggestions, they were not asked to endorse the conclu-sions or recommendations nor did they see the final draft of the reportbefore its release. The review of this report was overseen by Raymond A.Price, Department of Geological Sciences and Geological Engineering(emeritus), Kingston, Ontario, Canada. Appointed by the NationalResearch Council, he was responsible for ensuring that an independentexamination of this report was carried out in accordance with institutionalprocedures and that all review comments were carefully considered.Responsibility for the final content of this report rests entirely with theauthoring committee and the institution.
Copyright © National Academy of Sciences. All rights reserved.
A Geospatial Framework for the Coastal Zone: National Needs for Coastal Mapping and Chartinghttp://www.nap.edu/catalog/10947.html
xiii
EXECUTIVE SUMMARY 1
1 INTRODUCTION 11Coastal Zone Geospatial Data—Mapping and Charting, 13Committee Charge and Scope of the Study, 15
2 COASTAL MAPPING NEEDS AND ACTIVITIES 18Coastal Geospatial Data, Technology, and Products, 20Coastal Issues Requiring Geospatial Data and Products, 25Mapping Needs Beyond the Coastal Zone, 59Summary, 60
3 A COMMON COASTAL ZONE REFERENCE FRAME: THESEAMLESS COASTAL MAP AND CONSISTENT SHORELINE 62The Need for a Common Framework, 64Strategies for Developing a Common Framework, 66Implementation of a Common National Framework, 69Where and What is the Shoreline—Is a National Shoreline
Needed? 71
4 IMPROVING THE QUANTITY AND QUALITY OFCOASTAL REFERENCE FRAME DATA 74Shallow Bathymetry—The Most Critical Gap, 75Strategies for Providing Shallow Bathymetry, 78Terrestrial Satellite Imaging, 83
Contents
Copyright © National Academy of Sciences. All rights reserved.
A Geospatial Framework for the Coastal Zone: National Needs for Coastal Mapping and Chartinghttp://www.nap.edu/catalog/10947.html

xiv CONTENTS
5 ACCESS TO COASTAL GEOSPATIAL DATA 85National Standards and Protocols, 86More than Just a Web Portal, 93
6 INCREASING COASTAL MAPPING AND CHARTINGEFFICIENCY 94Data Collection Overlap and Redundancy—Topography and
Bathymetry, 96Data Collection Overlap and Redundancy—Habitat Mapping, 101Strategies for Addressing Redundancy and Overlap, 102
7 CONCLUSIONS AND RECOMMENDATIONS 110Common Needs, 110A Vision for the Future, 113Recommendations, 114
REFERENCES 123
APPENDIXESA Agency Needs and Activities 129B Committee and Staff Biographies 142C Acronyms 147
Copyright © National Academy of Sciences. All rights reserved.
A Geospatial Framework for the Coastal Zone: National Needs for Coastal Mapping and Chartinghttp://www.nap.edu/catalog/10947.html
A Geospatial Frameworkfor the
Coastal ZoneNational Needs for Coastal Mapping and Charting
Copyright © National Academy of Sciences. All rights reserved.
A Geospatial Framework for the Coastal Zone: National Needs for Coastal Mapping and Chartinghttp://www.nap.edu/catalog/10947.html

Copyright © National Academy of Sciences. All rights reserved.
A Geospatial Framework for the Coastal Zone: National Needs for Coastal Mapping and Chartinghttp://www.nap.edu/catalog/10947.html

1
Executive Summary
The coastal zone is of enormous importance to the well-being of thenation, as our lives and economy are inextricably linked to thefeatures and activities that occur within this dynamic region. Four-
teen of the country’s 20 largest urban corridors occur along the nation’scoast; a major portion of the U.S. economic infrastructure is located nearor on the ocean, and yet the coastal zone also encompasses forests, riversand streams, wetlands, estuaries, beaches, barrier islands, and oceanhabitats. The enormous importance of the economic, environmental, andrecreational components of this complex area places tremendous demandsand responsibilities on those charged with its management and mainte-nance. In order to understand and address the effects of natural andanthropogenic forces in the coastal zone, a holistic multidisciplinaryframework is required to account for the interconnectivity of processeswithin the system. The foundation of this framework is accurate geospatialinformation—information that is depicted on maps and charts.
Science, education, commerce, planning, and resource managementhave relied for centuries on the availability of accurate maps. In coastalregions, high-quality maps are essential for safe navigation, resolvingjurisdictional boundaries, understanding processes, mitigating hazards,tracking environmental changes, establishing inventories of resources andhabitats, and developing new programs and policies. Historically, the fun-damental geospatial data needed in the coastal zone have been capturedand portrayed onshore as “maps” and offshore as “charts.” Unfortunately,differences in scale, resolution, cartographic conventions and projections,and particularly reference datums currently inhibit the seamless combi-
Copyright © National Academy of Sciences. All rights reserved.
A Geospatial Framework for the Coastal Zone: National Needs for Coastal Mapping and Chartinghttp://www.nap.edu/catalog/10947.html

2 A GEOSPATIAL FRAMEWORK FOR THE COASTAL ZONE
nation of existing onshore and offshore data. The result is a lack of stan-dardized, uniform geospatial products that span the coastal zone. Thisinability to produce a seamless map (or chart) across the land-water inter-face is a severe impediment to understanding the many processes that arecontinuous across the shoreline. The lack of standardization has also ledgovernment agencies, the research community, and the private sector toundertake the expensive and time-consuming task of separately generatingnew data and maps to accompany almost all new studies and initiatives.The lack of coordination of coastal zone mapping efforts inevitably leadsto the potential for redundancy of surveys or products.
At least 15 federal agencies are involved in the primary collection oruse of coastal geospatial data, often with responsibilities shared amongmultiple divisions within the same agency. In addition, a plethora of stateand local agencies, academic institutions, and other organizations alsogather and use coastal zone information. This has resulted in a chaoticcollection of potentially overlapping, and often uncoordinated, coastalmapping and charting products that can frustrate the efforts of users totake advantage of existing datasets and build on past studies.
In response to this situation, and believing that an independent exter-nal evaluation could provide valuable new ideas, the National Oceanicand Atmospheric Administration (NOAA), the U.S. Geological Survey(USGS), and the U.S. Environmental Protection Agency (EPA) requestedthat the National Academies undertake a study of national needs forcoastal mapping and charting. The study committee was charged to iden-tify and suggest mechanisms for addressing national needs for spatialinformation in the coastal zone, incorporating an analysis of the majorspatial information requirements of federal agencies as well as the principaluser groups they support. The committee was tasked to identify high-priority needs, evaluate the potential for meeting those needs based onthe current level of effort, and suggest steps to increase collaboration andensure that the nation’s need for spatial information in the coastal zone ismet in an efficient and timely manner.
In order to understand the needs and activities of the very large anddiverse community involved with spatial information in the coastal zone,the committee and staff sought information and perspectives from agenciesand individuals involved in numerous aspects of coastal zone mapping.Despite the complexities of the numerous issues raised by the manyproviders and users of coastal zone data, the consistency of needs andconcerns raised permitted the committee to quickly converge on a visionfor the future of coastal mapping and charting. This vision requires thedevelopment of an integrated and coordinated coastal mapping strategyfor the nation, based on a foundation—a reference frame—upon which alldata collection, analyses, and products can be built. To establish this foun-
Copyright © National Academy of Sciences. All rights reserved.
A Geospatial Framework for the Coastal Zone: National Needs for Coastal Mapping and Chartinghttp://www.nap.edu/catalog/10947.html
EXECUTIVE SUMMARY 3
dation, there must be a national effort to collect the information anddevelop the tools necessary to seamlessly blend topographic (onshore)and bathymetric (offshore) data. These data and tools will permit theestablishment of a nationally coordinated digital database across the land-sea interface consisting of seamless elevation and depth data that can bereferenced or transformed to common vertical and horizontal datums.This database will provide the basic geospatial framework for all sub-sequent data products, much like the USGS topographic sheet basemapshave formed the onshore foundation for a multitude of subsequent studies.Unlike the USGS topographic sheets, however, a coastal zone databasemust be “tide aware” and be able to reconcile the differences betweenonshore and offshore datums.
Our vision for the future of coastal zone mapping and charting alsoincludes mechanisms to ensure communication among all the agenciesand entities involved in order to minimize redundancy of efforts andmaximize operational efficiencies. There will be national and perhapsinternational standards and protocols for data collection and metadatacreation and readily available tools for data transformation and integra-tion. With these tools the user community will be able to evaluate theaccuracy and timeliness of data, change scales and projections, and seam-lessly merge disparate datasets. The database and data integration toolswill be easily accessible to all users, public and private, from a singledigital portal accessible through the Internet.
This is a bold vision but at the same time an obvious one. Who wouldargue with a system that is efficient and produces easily accessible, fullyinterchangeable, accurate, and timely data? The vision may be simple todefine, but its implementation will be anything but simple. The recom-mendations that follow are intended to address the root causes of the exist-ing problems, help overcome the barriers to their solution, and begin toturn this vision into reality.
A SEAMLESS BATHYMETRIC/TOPOGRAPHIC DATASETFOR ALL U.S. COASTAL REGIONS
One of the most serious impediments to coastal zone management isthe inability to produce accurate maps and charts so that objects andprocesses can be seamlessly tracked across the land-water interface. Dif-ferences between agency missions, onshore topographic versus offshorebathymetric mapping techniques, differing vertical reference frames, andthe inherent difficulty of collecting source data in the surf and intertidalzones have combined to produce this fundamental incompatibility. It willbe nearly impossible to properly understand processes, undertake plan-ning, and establish boundaries in the coastal zone while two sets of
Copyright © National Academy of Sciences. All rights reserved.
A Geospatial Framework for the Coastal Zone: National Needs for Coastal Mapping and Chartinghttp://www.nap.edu/catalog/10947.html
4 A GEOSPATIAL FRAMEWORK FOR THE COASTAL ZONE
disparate and nonconvergent maps and charts are being separatelymaintained.
The barrier to the production of continuous integrated mappingproducts across the land-sea interface is the inherent difference in the hori-zontal and vertical reference surfaces (datums) and projections used formaps and charts. Horizontal datum and projection issues can be readilyresolved with existing transformation tools, although these tools must bemade more readily available to the user community. However, verticaldatum issues present a serious challenge. In order to seamlessly combineoffshore and onshore data, vertical datum transformation models must bedeveloped. These models depend on the establishment and maintenanceof a series of real-time tidal-measuring stations, the development of hydro-dynamic models for coastal areas around the nation, and the develop-ment of protocols and tools for merging bathymetric and topographicdatasets.
The Tampa Bay Bathy/Topo/Shoreline Demonstration Project, a col-laborative effort between NOAA and the USGS, has developed a suite ofsuch tools (called Vdatum) and has demonstrated the feasibility of gener-ating a seamless bathymetric/topographic dataset for the Tampa Bay area.This project has also demonstrated both the inherent complexity of suchan undertaking and the substantial benefits that arise from interagencycollaboration and coordination.
Recommendation 1: In order to combine onshore and offshore datain a seamless geodetic framework, a national project to applyVdatum tools should be initiated. This will involve the collectionof real-time tide data and the development of more sophisticatedhydrodynamic models for the entire U.S. coastline, as well as theestablishment of protocols and tools for merging bathymetric andtopographic datasets.
This dataset must be documented and disseminated in such a waythat it can become the base for a wide range of applications, including thedefinition of local, regional, and national shorelines. As a result of thiseffort, it will be possible to merge data collected either on land or offshoreinto a common geodetic reference frame while at the same time allowingapplication-specific maps and charts to be generated that maintain tradi-tional tidal-based datums (e.g., for navigational charts) or orthometricallybased datums (e.g., for topographical maps).
SHORELINE DEFINITION PROTOCOLS
Numerous agencies have identified the lack of a consistently definednational shoreline as a major barrier to informed decision making in the
Copyright © National Academy of Sciences. All rights reserved.
A Geospatial Framework for the Coastal Zone: National Needs for Coastal Mapping and Chartinghttp://www.nap.edu/catalog/10947.html

EXECUTIVE SUMMARY 5
coastal zone. While a consistent shoreline is certainly desirable, many dif-ferent definitions of the shoreline remain embedded in local, state, andfederal laws, making it impractical to call for a single “National Shore-line.” Rather, the key to achieving a consistent shoreline is the seamlessgeodetic framework referred to in Recommendation 1. With a seamlessbathymetric/topographic dataset across the land-water interface, appro-priate difference or tidal models, and consistent horizontal and verticalreference frames, any shoreline definition can be transformed and integratedwithin the common framework. The Vdatum tool kit and associated Websites will be the key to establishing internally consistent shorelines betweenand among disparate surveys and studies.
Recommendation 2: To achieve national consistency, all partiesshould define their shorelines in terms of a tidal datum, allowingvertical shifts to be calculated between and among the various shore-line definitions, while at the same time permitting different agenciesand users to maintain their existing legal shoreline definitions. Insituations where legislation or usage does not preclude it, the com-mittee recommends that the internationally recognized shorelineestablished by NOAA’s National Geodetic Survey be adopted.
The committee encourages the Marine and Coastal Spatial Data Sub-committee of the Federal Geographic Data Committee (FGDC) to pursueimplementation of this recommendation.
EASY ACCESS TO TIMELY DATA
Easy access to timely data is an essential component of effectivecoastal zone management. Many agencies have created Web sites thatoffer access to data in a variety of forms, as well as data manipulationtools. However, these sites still represent only a small percentage of exist-ing coastal zone data.
Recommendation 3: A single Web portal should be established tofacilitate access to all coastal mapping and charting data and derivedproducts. The site should be well advertised within federal andstate agencies, state and local governments, academic institutions,nongovernmental organizations and conservation groups, and toother potential users. The portal should work well with all Webbrowsers and on all computer platforms, to make it easily acces-sible to all users.
The single portal is not intended to host all coastal data. Rather, itshould serve as a focal point that links to many distributed databasesmaintained by individual agencies or organizations. This site would
Copyright © National Academy of Sciences. All rights reserved.
A Geospatial Framework for the Coastal Zone: National Needs for Coastal Mapping and Chartinghttp://www.nap.edu/catalog/10947.html

6 A GEOSPATIAL FRAMEWORK FOR THE COASTAL ZONE
represent the one place where users, particularly new users, could begintheir search for coastal data and derived products. A single, easily acces-sible data portal with appropriate data manipulation tools should alsopromote timely entry and retrieval of data. Coordination of such a sitelogically falls under the purview of the FGDC and is fully consistent withthe Geospatial One-Stop concept.
DATA INTEGRATION, INTERCHANGEABILITY, AND ACCURACY
Providing easy access to data through a single Web portal is a criticalstarting point for addressing the needs of the coastal zone community.However, users must also be able to combine and integrate data collectedby different agencies using a range of sensors and often based on differentdatums or projections. Users must also be able to assess the attributes andaccuracy of the data provided. Integration of data and assessment of dataquality are made possible by the establishment of data and metadata stan-dards and the application of tools for data transformation.
Recommendation 4: All thematic data and other value-addedproducts should adhere to predetermined standards to make themuniversally accessible and transferable through a central Web portal.All sources should supply digital data accompanied by appropriatemetadata.
The FGDC is in the process of establishing a series of standards forthe National Spatial Data Infrastructure (NSDI) that will be applicable toall coastal zone data. Unfortunately, implementation of the NSDI con-tinues to be problematic for the coastal/marine community due to highlyvariable levels of commitment by different agencies and insufficientincentives to fully implement its principles. This may, in part, be due tostructural and budgetary barriers, the inability of a single set of standardsto serve all applications, and disconnects between those developing thestandards and the user community. One approach to addressing this issueis for additional involvement of the private sector.
Recommendation 5: The private sector should be more involved indeveloping and applying data standards and products. Agency pro-curement requirements can be used to encourage the private sectorto deliver needed products in a timely fashion.
The committee is aware of numerous examples where private-sectorinitiatives established well-accepted and easily used data protocols—ineffect de facto standards—that significantly enhance the effectiveness ofdata products. The private sector is often capable of greater speed andefficiency in the adoption of standards and tools than its government
Copyright © National Academy of Sciences. All rights reserved.
A Geospatial Framework for the Coastal Zone: National Needs for Coastal Mapping and Chartinghttp://www.nap.edu/catalog/10947.html

EXECUTIVE SUMMARY 7
agency counterparts. Access to data, metadata, and data standards mustbe complemented by readily available tools to easily convert between andamong different data formats, scales, and projections.
Recommendation 6: Government agencies and the private sectorshould continue to develop tool kits for coastal data transformationand integration. This will facilitate data analysis and the produc-tion of a range of value-added products. The tools should be acces-sible through the Web portal.
Documentation of the tools and techniques used to process data mustalso be provided to help the user community understand the limitationsand appropriate uses of various datasets. A variety of training coursesand workshops will be essential to provide end-users with the knowledgeand tools necessary for intelligent application of the available data.
IMPROVED COORDINATION AND COLLABORATION
Any activity that involves multiple federal, state, and local agencies,academic researchers, and the private sector has the potential for redun-dancy and overlap of effort. This is amplified when the activity requiresexpensive platforms, technologies, and sensors. In the area of coastal zonemapping and charting, the large number of agencies involved, their dif-fering histories, the breadth of their mandates, and the complexity of thetask offer ample opportunities for redundancy and inefficiency. Becausedata acquisition is unquestionably the most expensive aspect of coastalzone mapping, elimination of redundancy and overlap in this area is likelyto yield large savings. Ensuring that all relevant agencies are aware ofeach other’s activities will be an important first step toward improvedcoordination.
Recommendation 7: All federally funded coastal zone mapping andcharting activities should be registered at a common, publicly avail-able Web site. This combined registry should be accessible throughthe single Web portal for coastal zone information.
Each entry in the registry should include a description of the map-ping activity, its location and purpose, the agency collecting the data, thetools to be used, the scales at which data will be collected, and otherrelevant details. Nonfederally funded agencies conducting coastal map-ping activities should be encouraged to register their activities at the samesite. A section of the registry should be dedicated to descriptions ofplanned but unfunded coastal mapping activities, as well as a “wish list”of coastal areas where surveying would be particularly helpful to state orlocal agencies. Technically, components of such registration may already
Copyright © National Academy of Sciences. All rights reserved.
A Geospatial Framework for the Coastal Zone: National Needs for Coastal Mapping and Chartinghttp://www.nap.edu/catalog/10947.html

8 A GEOSPATIAL FRAMEWORK FOR THE COASTAL ZONE
be required under Office of Management and Budget (OMB) Exhibit 300,but Recommendation 7 suggests a considerably expanded effort focusedon making all federally funded coastal zone mapping efforts more widelyknown.
Once implemented, this registry could serve as the focal point fornational coordination of geospatial data collection and analysis efforts.Individual agencies would continue to set their own priorities, butthrough the registry process, overlapping efforts could be quickly identi-fied and avoided. The registry would also facilitate increased efficiencyby highlighting opportunities for “incremental” surveys, where oneagency takes advantage of the mapping activities of another agency in aregion of common interest by providing a small amount of additionalfunding to achieve an additional objective. Such piggyback efforts wouldallow additional agencies to acquire data to meet their needs at minimalincremental cost.
Recommendation 8: To be effective, coordination should be carriedout among all the primary agencies involved in coastal zone map-ping, it should be mediated by a body that has the authority andmeans to monitor and ensure compliance, and it should involvepeople who are knowledgeable enough to identify the most criticalissues.
Structurally, the FGDC appears to be an appropriate body to overseesuch coordination, but many concerns remain about its effectiveness.Some restructuring of the FGDC, and perhaps an empowered Marine andCoastal Spatial Data Subcommittee, will be required to allay these con-cerns. In this light the committee endorses the recommendations of arecent design study team that calls for major structural and managementchanges for the FGDC (FGDC, 2000). A less appealing alternative mightbe either a new government office or an extragovernmental body chargedwith establishing oversight of all national coastal mapping and chartingactivities.
Recommendation 9: Whichever body is charged to carry out theneeded coordination activities, dedicated staff personnel should beassigned to maintain the Web portal (Recommendation 3), theactivities registry (Recommendation 7), and associated Web sites,and to proactively search for areas where efforts can be coordinated,supplemented, or combined to increase efficiency.
Specific areas where better coordination among federal agencies isurgently needed include high-resolution topographic and bathymetricdata acquisition at the land-water interface, including aerial and satelliteimagery, Light Detection and Ranging (LIDAR) surveys, bathymetric
Copyright © National Academy of Sciences. All rights reserved.
A Geospatial Framework for the Coastal Zone: National Needs for Coastal Mapping and Chartinghttp://www.nap.edu/catalog/10947.html

EXECUTIVE SUMMARY 9
surveys, seamless topographic/bathymetric Digital Elevation Models(DEMs)/Digital Depth Models (DDMs), and derived products for map-ping shoreline change, habitat change, hazard vulnerability, and coastalerosion and inundation.
INCREASED DATA COLLECTION
There is a widespread need for more and better data to be collected inthe coastal zone. The single most consistently cited need, among theagencies and the user community, is for enhanced bathymetric data, par-ticularly in very shallow coastal waters. These data provide the basicgeospatial framework for almost all other studies and are a key compo-nent for derived products such as offshore habitat maps.
Recommendation 10: The fundamental reference frame data for theentire coastal zone should be collected, processed, and made avail-able. The dynamic nature of the coastal zone requires that thereshould be specific plans for repeat surveys over time. The impor-tant role of qualified private survey contractors in coastal zonemapping and charting should also be acknowledged. Much of thework done by this sector is contracted by government agencies, andaccordingly the prioritization and tracking of surveys can be coor-dinated by the body called for in Recommendation 8.
Given the number of agencies and private-sector companies involvedin coastal mapping and their disparate missions and budget directives, itis unrealistic to expect agreement on one unified and prioritized nationalmapping initiative. While each agency has responsibility for its ownmapping priorities, a strong and enforceable mechanism for tracking andcoordinating existing, ongoing, and planned mapping efforts (Recommen-dation 7) would increase efficiency to the point where considerably moresurvey work could be carried out for each dollar spent. Inconsistencies inscale and resolution for new data collection efforts could be resolved bythe coastal zone coordinating body called for in Recommendation 8. Aftersurveying agency needs, the coordinating body could determine whetherthe incremental value of collecting data over a larger area or in a slightlydifferent form (e.g., at higher resolution) warrants modification of aplanned surveying effort.
Severe challenges remain for those attempting to map the coastalzone. As well as the fundamental conceptual problem of reconcilingterrestrial and tidal datums, there are also a number of logistical chal-lenges, including shallow depths, waves, turbid waters, and longshorecurrents, all of which make it difficult to operate survey vessels and otherequipment safely, accurately, and efficiently.
Copyright © National Academy of Sciences. All rights reserved.
A Geospatial Framework for the Coastal Zone: National Needs for Coastal Mapping and Chartinghttp://www.nap.edu/catalog/10947.html
10 A GEOSPATIAL FRAMEWORK FOR THE COASTAL ZONE
Recommendation 11: New remote sensing and in-situ technologiesand techniques should be developed to help fill critical data gaps atthe land-water interface.
There are a number of promising new technologies and techniques:integrated bathymetric/topographic LIDAR, multispectral, hyperspectral,and photographic imaging systems; sensors deployed on autonomousunderwater vehicles; “opportunistic” mapping using volunteer recrea-tional boats equipped with specialized mapping sensors approved byissuing agencies; autonomous bottom-crawling vehicles; improvedsatellite-imaging capabilities; and data fusion capabilities. Continued sup-port from funding agencies for development of coastal remote sensingtools, combined with an increased emphasis on coastal needs, will greatlyaccelerate the development and implementation of these critically neededtechnologies. The private sector can play a major role in addressing thisrecommendation.
The recommendations and strategies outlined above call for the estab-lishment of a consistent geospatial framework and the application ofinnovative new acquisition, integration, and data management tech-nologies that should allow coastal zone scientists, engineers, and managersto efficiently produce easily accessible, fully interchangeable, accurate,timely, and useful geospatial data and mapping products that seamlesslyextend across the coastal zone. The recommendations also suggest simplemechanisms to enhance collaboration and cooperation among those chargedwith acquiring data in this complex region. These mechanisms shouldfacilitate efficiency gains that will allow most of the nation’s coastal zoneto be mapped in a timely manner. While simple in concept, implementa-tion of the suggested strategies will require a focused effort on the part ofthe coastal zone community. If implemented, however, the committeebelieves that a major step will have been taken toward assuring the long-term well-being of the coastal zone.
Copyright © National Academy of Sciences. All rights reserved.
A Geospatial Framework for the Coastal Zone: National Needs for Coastal Mapping and Chartinghttp://www.nap.edu/catalog/10947.html
11
1
Introduction
The coastal zone1 represents only 17 percent of the land area of theUnited States, yet it is one of the nation’s greatest environmental,social, and economic assets. Our lives and economy are inextrica-
bly linked to the features and activities found in the coastal zone. It is anexus for tourism and industry, including activities such as shipping andboating; commercial and recreational fishing; exploration and extractionof oil, natural gas, gravel, and sand; recreational use of beaches; and wild-life observation (see Box 1.1). The coastal zone is densely populated andhighly developed, and yet it is also where important habitats such asforests, rivers and streams, wetlands, estuaries, beaches, barrier islands,and the coastal ocean occur. These habitats, which individually supporttheir own unique assemblages of plants and animals, are also complexlylinked with—and dependent on—the coastal environment.
More than 80 percent of the American population lives within 50 milesof the coast, a population component that has doubled in the past decade.By 2010 the population density along ocean shores is projected to reach400 people per square mile, compared to less than 100 per square mile forthe rest of the nation. Fourteen of the country’s 20 largest urban corridorsare along the nation’s coasts, and a major portion of the U.S. economic
1For the purposes of this report, the coastal zone is the region bounded landward by theinland boundary of a coastal county or parish and seaward by the outer limit of the U.S.territorial sea. The coastal zone includes the U.S. component of the area around the GreatLakes.
Copyright © National Academy of Sciences. All rights reserved.
A Geospatial Framework for the Coastal Zone: National Needs for Coastal Mapping and Chartinghttp://www.nap.edu/catalog/10947.html

12 A GEOSPATIAL FRAMEWORK FOR THE COASTAL ZONE
BOX 1.1Economic Value of the Coastal Zone
• The movement of waterborne cargo contributes more than $742 bil-lion to the U.S. gross domestic product and creates employment for morethan 13 million individuals (USDOT, 1999).
• Commercial and recreational fishing contributes more than $111 bil-lion to the economy annually (USDOT, 1999).
• Rapid population growth and the resulting increase in coastal devel-opment during the past 50 years have resulted in greatly increased naturalhazard risk to 160 million Americans and more than $3 trillion in coastalproperty (Heinz Center, 2002).
• A 1992 study calculated that the coastal zone in California aloneprovided an annual economic contribution of $17.3 billion and 370,000jobs (CSC, 2001).
• In 1996, Americans spent $18.1 billion on activities related to wild-life observation in the coastal zone (USDOT, 1999).
• In 1997, about 78 million Americans participated in recreationalboating, using about 16 million boats and spending $19 billion on boatsand boating activities (USDOT, 1999).
• The economic impact of cruise lines is estimated at $11.6 billion peryear (USDOT, 1999).
infrastructure is located near or on the ocean (Hinrichsen, 1999). Morethan 95 percent of overseas trade between the United States and othernations moves by ship, including 9 million barrels of oil per day and over98 percent, by weight, of all non-North American Free Trade Agreement(NAFTA) goods imported into the country. As gateways to our nationand the focal point of commerce, our ports and harbors are critical andvulnerable components of the nation’s infrastructure and homeland security.
Beyond its formal, spatially delimited definition, the coastal zone isinextricably linked to a complex web of environments extending from theupper parts of watersheds out to the open ocean. Variations in watershedoutflows influence the types and concentrations of dissolved and sus-pended materials in coastal waters. Physical, chemical, and biologicalprocesses control the distribution of nutrients, the transport of sediment,and the water circulation in coastal waters. Human activities have oftenresulted in increased sediment and pollution loads to coastal waters,decreased water quality, alteration of physical environments, loss orchange of habitat (both onshore and offshore), depletion of fish stocks
Copyright © National Academy of Sciences. All rights reserved.
A Geospatial Framework for the Coastal Zone: National Needs for Coastal Mapping and Chartinghttp://www.nap.edu/catalog/10947.html

INTRODUCTION 13
and other resources, and degradation of coastal aquifers. Thus the coastalzone provides a critical and sensitive indicator of environmental per-turbations and disruptions.
Weather and climate also have a major impact on the coastal zone.Between 1980 and 2001, total economic losses in the coastal region due toweather-related events exceeded $280 billion (Ross and Lott, 2000). Mostclimate change models predict a rise in sea level and an increase in thefrequency and severity of weather-related events over the coming years,which would put even more pressure on the fragile coastal zone (IPCC,2001).
The importance of the coastal zone to the well-being of the nationplaces tremendous demands and responsibilities on those charged withmanagement of this critical environment. In order to understand andaddress the effects of complex natural and anthropogenic forces in thecoastal zone, a holistic multidisciplinary framework must be developedto adequately describe the interconnectivity of processes in the system. Atthe base of this framework will be accurate information about the loca-tions of important features and processes, both onshore and offshore.
COASTAL ZONE GEOSPATIAL DATA—MAPPING AND CHARTING
The locations of features in space are described by geospatial data.These data—whether in the atmosphere, on or below the earth’s surface,or within the water column—are referenced to a specific position in spaceand then linked to information about the attributes associated with thatposition. Such geospatial data are usually presented in the form of mapsor charts.
Science, education, commerce, planning, and resource managementhave relied for centuries on the availability of accurate maps and charts.In coastal regions, high-quality maps and charts are essential for safenavigation, resolving jurisdictional boundaries, understanding processes,mitigating hazards, tracking environmental changes, establishing inven-tories of resources and habitats, and developing new programs andpolicies. Ideally, to accomplish all of these goals it will be necessary tocombine disparate coastal zone information (e.g., land features, waterdepths, salinity, currents, bottom type, habitat type, infrastructure) into asingle distributed information system that uses spatial coordinates as acommon reference frame. These data can then be depicted on maps andcharts or brought into Geographic Information Systems (GISs), or otherspatially referenced software applications, for analysis. While simple inconcept, the reality of this integration of coastal zone data is extremelycomplex. Those interested in truly understanding the complexities of the
Copyright © National Academy of Sciences. All rights reserved.
A Geospatial Framework for the Coastal Zone: National Needs for Coastal Mapping and Chartinghttp://www.nap.edu/catalog/10947.html

14 A GEOSPATIAL FRAMEWORK FOR THE COASTAL ZONE
coastal zone will need to reach beyond traditional geographic, disciplinary,and political boundaries to develop a new suite of methods, analyticaltools, and products.
Historically, the fundamental data needed in the coastal zone havebeen captured and portrayed onshore as “maps” and offshore as “charts.”Unfortunately, differences in scale, resolution, cartographic conventionsand projections, and particularly reference datums currently inhibit theseamless combination of existing onshore and offshore data. The result isa lack of standardized uniform geospatial products that span the coastalzone. This inability to produce a seamless map (or chart) across the land-water interface is a severe impediment to studying the many processesthat are continuous across the shoreline, particularly studies of coastalchange. The lack of standardization has also led government agencies, theresearch community, and the private sector to undertake the expensiveand time-consuming task of separately generating new data and maps toaccompany almost all new studies and initiatives. The lack of coordina-tion of coastal zone mapping efforts inevitably leads to the potential forredundancy of surveys or products.
At the national level, at least 15 federal agencies are involved in theprimary collection or use of coastal geospatial data (see Appendix A),often with responsibilities shared among multiple divisions within thesame agency. In addition to these federal agencies, a plethora of state andlocal agencies, academic institutions, and other organizations also gatherand use coastal zone information. This has resulted in a chaotic collectionof potentially overlapping, and often uncoordinated, coastal mapping andcharting products that can frustrate the efforts of users to take advantageof existing datasets and build on past studies. Add to this mix an increas-ingly educated and interested public, with growing demands for infor-mation to meet their diverse interests (including environmental protection,commerce, and recreation), and it becomes even more critical for thenation to pursue integrated coastal and ocean mapping in a cost-effective,well-coordinated, and strategic manner.
Fortunately, recent advances in mapping technologies, remote sensing,global positioning, data handling, and computing technologies—particu-larly the rapid development of GISs—have radically changed the density,accuracy, timeliness, and inherent nature (now mostly digital) of coastalmapping data and data products. In addition, programs and entities suchas the National Ocean Partnership Program (NOPP) and the Federal Geo-graphic Data Committee (FGDC) are promoting a greater spirit of part-nership among those involved in coastal zone studies. These new toolsand mechanisms, together with the implementation of appropriate andwell-designed standards, should enable a more thorough, integrated, andorganized approach to coastal zone mapping.
Copyright © National Academy of Sciences. All rights reserved.
A Geospatial Framework for the Coastal Zone: National Needs for Coastal Mapping and Chartinghttp://www.nap.edu/catalog/10947.html
INTRODUCTION 15
COMMITTEE CHARGE AND SCOPE OF THE STUDY
Recognizing both the difficulties and opportunities described above,and believing that an independent external evaluation could provide valu-able new ideas, the National Oceanic and Atmospheric Administration(NOAA), the U.S. Geological Survey (USGS), and the U.S. EnvironmentalProtection Agency (EPA) requested and funded this assessment by theNational Academies of national needs for coastal mapping and charting(see Box 1.2).
The mandate of the committee can be summarized in four questions:
• What are the mapping needs of the coastal community?• Who is doing what?• Are there gaps or overlaps in existing efforts?• How can the needs of the community be met in the most efficient
and effective way possible?
BOX 1.2Statement of Task
This study will identify and suggest mechanisms for addressing nationalneeds for spatial information in the coastal zone. By examining the majorspatial information requirements of federal agencies, as well as the princi-pal user groups they support (e.g., state and local coastal managers, urbanplanners, resource managers, maritime industry), the committee will iden-tify high priority needs, evaluate the potential for meeting these needs basedon the current level of effort, and suggest steps to increase collaborationand ensure that the nation’s need for spatial information in the coastal zoneis met in an efficient and timely manner.
In particular, the committee will identify:
1. Primary datasets and their attributes, such as scale and resolution, aswell as value added products, that are needed to support decision makingin the coastal and ocean environment;
2. Gaps or overlaps among the federal and state programs currently inplace to collect this information, as well as barriers to effective coordina-tion; and
3. Techniques and technologies currently or soon to be available thatcould expand the capability to acquire, archive, and disseminate informa-tion to the user community.
Copyright © National Academy of Sciences. All rights reserved.
A Geospatial Framework for the Coastal Zone: National Needs for Coastal Mapping and Chartinghttp://www.nap.edu/catalog/10947.html

16 A GEOSPATIAL FRAMEWORK FOR THE COASTAL ZONE
Identifying the needs and activities of the U.S. coastal zone commu-nity is an immense task. To conduct this assessment, the committee heldfour regional meetings at which representatives of agencies involved inall aspects of coastal zone mapping made presentations and offered theirperspectives on the needs and activities of their agencies. In addition tothese presentations, the committee communicated with and receivedwritten and oral submissions from individuals involved in coastal zonemapping activities. The requirement in the committee’s statement of taskfor an assessment of the major spatial information requirements of federalagencies, as the basis for federal support of a wide range of user groups,has led to the committee’s focus on making recommendations that pre-dominantly apply at the federal level. Nevertheless, underpinning thecommittee’s recommendations is an appreciation that a broad range ofuser groups, including state and local agencies, constitute the “frontline”for coastal zone activities and that improved federal-level mapping andcharting activities must have the provision of improved information atthese other levels as its focus.
The committee was required to prepare an interim report (NRC,2003a) that focused on a compilation of the coastal mapping and chartingactivities of federal agencies and offered some very preliminary observa-tions. A tabular summary of the agency activity compilation that constituteda major component of the interim report is presented in Appendix A.
Despite the complexities of the numerous issues raised by the manyproviders and users of coastal zone data, the consistency of needs andconcerns permitted the committee to quickly converge on a vision for thefuture of coastal mapping and charting. This vision requires the develop-ment of an integrated and coordinated coastal mapping strategy for thenation, based on a foundation—a reference frame—upon which all datacollection, analyses, and products can be built. To establish this founda-tion, there must be a national effort to collect the information and developthe tools necessary to seamlessly blend topographic (onshore) and bathy-metric (offshore) data. These data and tools will permit the establishmentof a nationally coordinated distributed digital database across the land-sea interface consisting of seamless elevation and depth data that can bereferenced or transformed to common vertical and horizontal datums.This database will provide the basic geospatial framework for all sub-sequent data products, much like the USGS topographic sheet basemapshave formed the onshore foundation for a multitude of subsequent studies.Unlike the USGS topographic sheets, however, a coastal zone databasemust be “tide-aware” and must be able to reconcile the differencesbetween onshore and offshore datums.
Our vision for the future of coastal zone mapping and charting alsoincludes mechanisms to ensure communication among all the agencies
Copyright © National Academy of Sciences. All rights reserved.
A Geospatial Framework for the Coastal Zone: National Needs for Coastal Mapping and Chartinghttp://www.nap.edu/catalog/10947.html
INTRODUCTION 17
and entities involved in order to minimize redundancy of efforts andmaximize operational efficiencies. There will be national—and perhapsinternational—standards and protocols for data collection and metadatacreation and readily available tools for data transformation and integra-tion. With these tools, the user community will be able to evaluate theaccuracy and timeliness of data and change scales and projections, as wellas seamlessly merge disparate datasets. The database and data integra-tion tools will be easily accessible to all users, public and private, from asingle digital portal accessible through the Internet.
This is a bold vision, but at the same time an obvious one. Who wouldargue with a system that is efficient and produces easily accessible, fullyinterchangeable, accurate, and timely data? The vision may be simple todefine, but its implementation will be anything but simple. As discussedin the following chapters, there are serious impediments to attaining thisvision. It is the committee’s hope, however, that the strategies outlinedhere will help the nation to get there. The long-term sustainability of ourcoastal resources may well depend on it.
Copyright © National Academy of Sciences. All rights reserved.
A Geospatial Framework for the Coastal Zone: National Needs for Coastal Mapping and Chartinghttp://www.nap.edu/catalog/10947.html

18
2
Coastal Mapping Needs and Activities
One of the more difficult challenges for the Committee on NationalNeeds for Coastal Mapping and Charting was the identificationof the needs and activities of the extremely large and diverse
community involved with spatial information in the coastal zone. Theintersection of these needs and activities formed the basis for identifyinggaps and overlaps in coastal zone data collection and processing. In orderto assess both the needs and activities, committee members and NationalResearch Council (NRC) staff interviewed representatives of, and solicitedwritten submissions from, agencies involved in coastal zone mapping andcharting. In addition, a series of presentations were made to the committeeby representatives of a wide range of agencies and organizations that useand/or produce information related to the coastal zone. Valuable addi-tional information was also extracted from the National Oceanic andAtmospheric Administration (NOAA) Coastal Services Center (CSC)surveys of coastal resource managers (CSC, 1999; 2002); a CSC-sponsoredstudy of the benefits of Geographic Information Systems (GISs) for stateand regional ocean management (Good and Sowers, 1999); and a NationalMarine Sanctuaries evaluation of the status and needs of spatial informa-tion in marine sanctuaries (NOAA, 2002).
Based on this data collection and information-gathering process, thecommittee identified at least 15 federal agencies, almost all coastal states,and innumerable local agencies, academic institutions, and private com-panies involved in the collection or production of coastal mapping andcharting data or products. While an attempt was made to quantify expendi-
Copyright © National Academy of Sciences. All rights reserved.
A Geospatial Framework for the Coastal Zone: National Needs for Coastal Mapping and Chartinghttp://www.nap.edu/catalog/10947.html

COASTAL MAPPING NEEDS AND ACTIVITIES 19
tures on coastal mapping and charting (each agency was asked to providea reliable estimate of its annual expenditures on coastal mapping andcharting), the inconsistency of responses made it impossible to provide aprecise (or even approximate) total. It is clear, though, that hundreds ofmillions of dollars are spent each year on coastal zone mapping and chart-ing activities. The Office of Management and Budget (OMB) had hoped tocompile a comprehensive accounting of the federal dollars spent ongeospatial data collection in 2002, for publication in early 2003. However,difficulties encountered when attempting to collect these data resulted inthe comprehensive compilation being deferred, with the intention that2003 data should be available in early 2004. Therefore, although not avail-able at the time of publication of this report, the information contained inthe OMB study should finally allow a quantitative assessment of theamount of federal money spent on coastal zone mapping activities.
The information presented to the committee is summarized inAppendix A, based on the more extensive compilation presented in thecommittee’s interim report (NRC, 2003a). This information was reviewedby each agency for accuracy, but the perspective is ultimately that of thiscommittee. Although state and local agencies play a key role in the acqui-sition and use of coastal geospatial data, the breadth and diversity of theseactivities prohibited an exhaustive review of each coastal state’s activitiesand needs.1 The committee found considerable commonality of needs andactivities among the states and local agencies and accordingly has includeda “generic” section on state and local needs and activities. An overarchingexpression of the needs of state and local agencies is probably best pre-sented in the recent Coastal States Organization (CSO) submission to theU.S. Commission on Ocean Policy, which called for “complete mappingof the nation’s coastal areas, including near-shore topography and coastalwatersheds, at a scale and in a form that is readily available and usable bythe states and territories with an initial focus on critical areas under threatto the public or critical coastal or ocean resources.” The CSO also statesthat such a mapping program is needed because of the “lack of accuratemapping of flood plains, erosion zones and shorelines and accessibleinformation to enable states and communities to make well-reasoned,cost-effective, long-term decisions” (CSO, 2002, p. 17).
While the committee has made every attempt to be as complete in itsanalysis as possible, the magnitude of coastal mapping activities acrossthis nation is such that it is possible that some activities and needs have
1A state-by-state review of some activities is presented in the CSC-sponsored study ofGISs for ocean management (Good and Sowers, 1999).
Copyright © National Academy of Sciences. All rights reserved.
A Geospatial Framework for the Coastal Zone: National Needs for Coastal Mapping and Chartinghttp://www.nap.edu/catalog/10947.html

20 A GEOSPATIAL FRAMEWORK FOR THE COASTAL ZONE
been missed. Nonetheless, the committee is confident that the major needsand activities of those involved in coastal mapping and charting in theUnited States have been addressed and, in so doing, a basis has been estab-lished for evaluating the gaps, overlaps, and major issues associated withcurrent activities.
Analysis of the agency activities presented in Appendix A revealedthat, while coastal zone mapping and charting applications are as variedand diverse as the user community, there is a strong thread of consistencyand commonality in important elements of the communities’ needs. Thesecommonalities include a need for:
• A consistent spatial framework for coastal data that allows a seam-less transition from onshore to offshore, including clarification of offshoreboundary definitions.
• A standardized definition of “the shoreline,” to the extent possiblein the context of federal and state legal restrictions.
• Increased collection and availability of primary thematic data,including such elements as shallow-water bathymetry, acoustic and satelliteimagery of the seafloor, bottom type, habitat distribution and classifica-tion standards, land use, land cover, and coastal change data.
• Easy access to up-to-date digital geospatial data, imagery, andmapping products.
• Compatibility among data formats, or standards and transforma-tion protocols that allow easy data exchange, and a means to evaluate theaccuracy of geospatial data.
• Increased inter- and intra-agency communication, cooperation, andcoordination.
Addressing these critical issues, which are described in more detailbelow, will provide the basic reference frame, source data, and tools nec-essary to create the wide range of derivative products needed to efficientlyand effectively manage the coastal zone.
COASTAL GEOSPATIAL DATA, TECHNOLOGY,AND PRODUCTS
The fundamental reference information for all geospatial data con-sists of the position of each data element in three-dimensional space.Within this context it is important to acknowledge the revolutionaryadvances in positioning capability that have taken place over the past30 years. With the advent of universally available, relatively inexpensiveglobal positioning system (GPS) receivers, almost all modern coastal zonedata can now be collected with unprecedented accuracy (on the order of
Copyright © National Academy of Sciences. All rights reserved.
A Geospatial Framework for the Coastal Zone: National Needs for Coastal Mapping and Chartinghttp://www.nap.edu/catalog/10947.html

COASTAL MAPPING NEEDS AND ACTIVITIES 21
10 meters for single-point GPS, 3 meters for differential and WAAS2-enabled GPS, and at the centimeter level for kinematic or carrier position-ing systems3). As will be discussed later, the introduction of GPS alsoprovides for a continuous vertical reference frame from which offshoreand onshore data can eventually be compared. The ability to preciselylocate the position of measurements removes an important level of uncer-tainty from coastal zone surveys and greatly aids in the ability to makemeaningful repeat surveys (for time-series studies). It also emphasizesthe critical need to understand and document the positional accuracy asso-ciated with historical data, especially when comparing GPS-positioneddata to non-GPS-positioned data.
Throughout this report, this positional information will be referred toas reference frame data. Onshore, the vertical component of a position hasinvolved measurements of the dynamic earth surface, determined by mea-suring the elevation of the land surface. Offshore, the vertical componentis determined by measuring both the dynamic earth surface (the depth ofwater to the seafloor) and the dynamic water surface, determined by moni-toring tidal levels (the water level with respect to an established referencesurface [datum] at a given moment in a tidal cycle). Both horizontal andvertical measurements must be made relative to established horizontaland vertical reference frames (the vertical and horizontal datums) that haveto be defined within the context of a survey. The Federal Geographic DataCommittee (FGDC) introduced the concept of “framework data” as acommon-use data layer—the geospatial foundation—upon which anorganization can add additional detailed mapping information (FGDC,1995). Reference frame data, as defined by the committee in this report,are a type of framework data consisting of fundamental geospatial posi-tion information (including the necessary geodetic controls).
The primary (nonderivative) properties of the coastal zone are repre-sented by source data. Source data, and their associated metadata (datadescribing the data), include data from aerial and satellite imagery (con-ventional and digital photography as well as data generated by otherimagery sensors), other remote sensors, and direct measurements orsampling. Properties often measured or sampled directly include sedimentand soil type, soil moisture and porosity, salinity, temperature, turbidity,nutrient concentrations, and data describing plant and animal communities.
Numerous methods, platforms, and sensors are used to collect theframework and source data needed to produce coastal maps and charts(see Box 2.1). Bathymetry is most frequently collected using acoustic
2WAAS (Wide Area Augmentation System) provides correction information from a pre-cisely surveyed ground reference station. See http://gpsinformation.net/exe/waas.html.
3See http://www.geod.nrcan.gc.ca/index_e/geodesy_e/gps-13_e.html.
Copyright © National Academy of Sciences. All rights reserved.
A Geospatial Framework for the Coastal Zone: National Needs for Coastal Mapping and Chartinghttp://www.nap.edu/catalog/10947.html

22 A GEOSPATIAL FRAMEWORK FOR THE COASTAL ZONE
BOX 2.1Coastal Mapping and Charting Technology
1. REMOTE ACOUSTIC SENSORS
Acoustic sensors include underwater instruments that transmit and receivesound underwater to measure various parameters. The most common acousticremote sensors are echosounders and sonars.
Overview of common seafloor mapping systems. SOURCE: U.S. Geologi-cal Survey (USGS) Coastal and Marine Geology Program.a
1.1 SINGLE-BEAM ECHOSOUNDER
The single-beam echosounder has been used extensively to determinewater depths from vessels. This simple sounder measures the round triptime of an acoustic pulse emitted from a hull-mounted transducer andreflected, or echoed, from the seafloor back to the ship. Water depth isdetermined by converting the round-trip travel time into distance. Simpleechosounders use an approximate speed of sound in water to make thisconversion. More accurate echosounders use a separately measured acousticvelocity. Other factors are also taken into consideration to improve accuracy,including the vessel’s instantaneous heave, pitch, roll, squat, tide, and
USCGDifferentialCorrections
GPS
SEISMIC REFLECTION(Subsurface Coverage)
SIDESCAN SONAR(Areal Coverage)
continued
Copyright © National Academy of Sciences. All rights reserved.
A Geospatial Framework for the Coastal Zone: National Needs for Coastal Mapping and Chartinghttp://www.nap.edu/catalog/10947.html

COASTAL MAPPING NEEDS AND ACTIVITIES 23
sensors mounted on ships, launches, or autonomous underwater vehicles.Multibeam sonar systems are becoming increasingly important becausethey can provide complete high resolution coverage of the seafloor as com-pared to the sparse sampling of single-beam sonars. Acoustic backscatterfrom multibeam sonar systems and sidescan sonar systems providesbottom characterization information that can be used for habitat mappingand bottom geomorphology. If water clarity permits, airborne LightDetection and Ranging (LIDAR) systems can provide relatively high reso-lution bathymetry in depths up to 60 meters (although 20 to 30 meters ismore typical). When coupled with a topographic LIDAR and the appropri-ate tidal and geodetic models, LIDAR can provide seamless measurementsacross the shoreline. Recent years have also seen a remarkable revolutionin the spectral and spatial capabilities of airborne and spaceborne imag-ing sensors as well as the analytical tools available for the data derivedfrom these sensors. Photogrammetric and multispectral imagery obtainedfrom aircraft and spacecraft can now provide a wealth of data on landuse, topography, habitat, biological, nutrient, suspended sediment, andshoreline data and in special circumstances can even provide some bathy-metric data. Across the board, the capability of sensors and ancillary sys-tems (e.g., positioning systems) is rapidly increasing, and these increasesin capability (resolution, accuracy, etc.) will inevitably play an importantrole in future coastal zone mapping. In particular, the ability to collectcoregistered datasets (e.g., sonar data combined with video data) and thedevelopment of software that will support data fusion and automatedfeature extraction will greatly facilitate the subsequent analysis and inter-pretation of complex coastal datasets.
Derivative or “value-added” products are created from the integrationand interpretation of reference frame and source data. Most of theseproducts fall into one or more of the following themes:
• Safety of Navigation• Legal and Other Boundaries• Environmental Management and Protection
Habitat and sensitive environmentsWater quality and pollutantsSeafloor type and qualityLiving coastal resourcesLand-use characterization
• Coastal Hazards• Minerals and Energy Management• Coastal Zone Planning and Development• Cultural Resource Management
Copyright © National Academy of Sciences. All rights reserved.
A Geospatial Framework for the Coastal Zone: National Needs for Coastal Mapping and Chartinghttp://www.nap.edu/catalog/10947.html
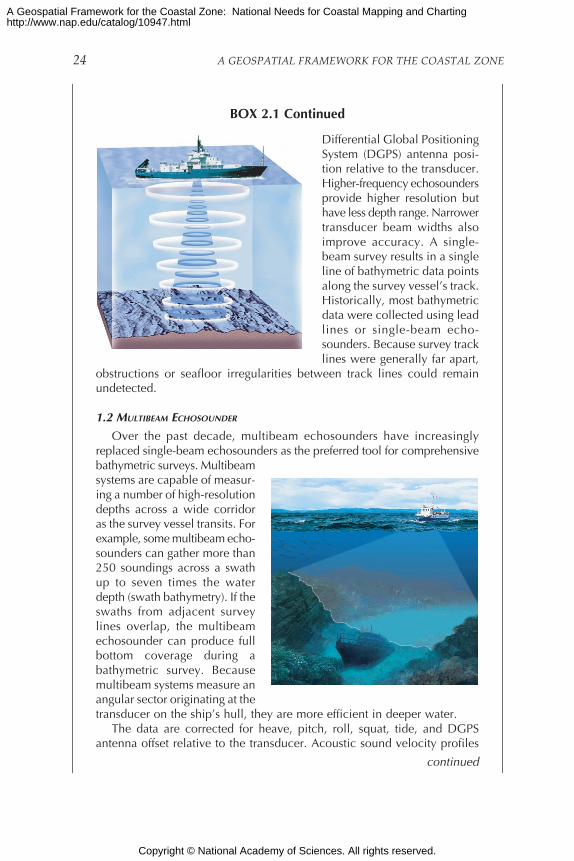
24 A GEOSPATIAL FRAMEWORK FOR THE COASTAL ZONE
Differential Global PositioningSystem (DGPS) antenna posi-tion relative to the transducer.Higher-frequency echosoundersprovide higher resolution buthave less depth range. Narrowertransducer beam widths alsoimprove accuracy. A single-beam survey results in a singleline of bathymetric data pointsalong the survey vessel’s track.Historically, most bathymetricdata were collected using leadlines or single-beam echo-sounders. Because survey tracklines were generally far apart,
obstructions or seafloor irregularities between track lines could remainundetected.
1.2 MULTIBEAM ECHOSOUNDER
Over the past decade, multibeam echosounders have increasinglyreplaced single-beam echosounders as the preferred tool for comprehensivebathymetric surveys. Multibeamsystems are capable of measur-ing a number of high-resolutiondepths across a wide corridoras the survey vessel transits. Forexample, some multibeam echo-sounders can gather more than250 soundings across a swathup to seven times the waterdepth (swath bathymetry). If theswaths from adjacent surveylines overlap, the multibeamechosounder can produce fullbottom coverage during abathymetric survey. Becausemultibeam systems measure anangular sector originating at thetransducer on the ship’s hull, they are more efficient in deeper water.
The data are corrected for heave, pitch, roll, squat, tide, and DGPSantenna offset relative to the transducer. Acoustic sound velocity profiles
continued
BOX 2.1 Continued
Copyright © National Academy of Sciences. All rights reserved.
A Geospatial Framework for the Coastal Zone: National Needs for Coastal Mapping and Chartinghttp://www.nap.edu/catalog/10947.html
COASTAL MAPPING NEEDS AND ACTIVITIES 25
The coastal zone is dynamic. Storms, vegetation and drainage basinchanges, development, sea level rise, tides, wave actions, and currentsalter the coastal zone over time. Consequently, repeat measurements ofreference frame and source data, together with time series of the derivedproducts, are a critical requirement for understanding and managing thecoastal zone.
COASTAL ISSUES REQUIRING GEOSPATIAL DATAAND PRODUCTS
Appendix A summarizes, on an agency-by-agency basis, the needsand activities of the agencies involved in coastal zone mapping and chart-ing. This section recasts those needs and activities within a framework ofthe seven major themes that capture the fundamental raison d’etre formost coastal zone mapping and charting activities. Collectively, thesethemes encompass most issues involved in coastal zone management andplanning:
• Navigation• Homeland Security• Coastal Zone Boundaries• Environmental and Living Resource Management• Coastal Hazards• Minerals and Energy Management• Cultural Resource Management
Navigation
Information and products for safe and efficient navigation are funda-mental to the maritime interests of any coastal nation. Providing safe andefficient navigation generates a sizeable economic benefit, is a cornerstonefor sustainable development, avoids or mitigates environmental catas-trophes, and contributes to the quality of life. Because safe and efficientnavigation forms the foundation for such a broad range of economic,environmental, and recreational activities, maritime nations have historicallyundertaken the tasks of collecting, producing, disseminating, and main-taining the necessary navigational data, products, and services withintheir own waters as a service available to all users at modest cost. In addi-tion, a number of maritime nations with historically global interests havesought to ensure safety of navigation for their merchant and military fleetswherever they may be called on to operate. International organizationsand conventions are devoted to furthering safe and efficient navigation
Copyright © National Academy of Sciences. All rights reserved.
A Geospatial Framework for the Coastal Zone: National Needs for Coastal Mapping and Chartinghttp://www.nap.edu/catalog/10947.html

26 A GEOSPATIAL FRAMEWORK FOR THE COASTAL ZONE
are also measured and integrated into the solution for high-accuracy results.Like single-beam echosounders, higher frequencies have higher resolutionbut are limited to more shallow water. Lower frequencies can sound, withless accuracy, to full ocean depth.
In addition to bathymetry, many multibeam echosounders can alsosimultaneously measure the magnitude of the reflected signal, which resultsin colocated backscatter (or multibeam) imagery. Because hard or roughseabed reflects more energy than soft or smooth seabed, multibeam imagerycan be used for habitat and sediment mapping. The combination of multi-beam echosounder with GPS produces bathymetry and imagery data thatare accurately positioned, so that three-dimensional computer-generateddigital terrain models (bathymetry) can be draped with the accompanyingimagery to depict seabed morphology as well as the nature of sediments.By combining datasets in this way, features can be more easily detected,such as rock outcrops, channels, and small-scale bedforms.
Multibeam data collected by USGS from San Francisco Bay combined withUSGS topographic data. New visualization techniques allow such complexenvironments to be interactively explored in ways that are both intuitiveand quantitative. SOURCE: Image courtesy of the Center for Coastal andOcean Mapping, University of New Hampshire; used with permission.
BOX 2.1 Continued
continued
Copyright © National Academy of Sciences. All rights reserved.
A Geospatial Framework for the Coastal Zone: National Needs for Coastal Mapping and Chartinghttp://www.nap.edu/catalog/10947.html

COASTAL MAPPING NEEDS AND ACTIVITIES 27
BOX 2.2Dynamic Under Keel Clearance Management
In most cargo ports the maximum loading of vessels is determined usinga conservative consideration of numerous factors, together with the errorsassociated with the prediction or estimation of these factors. These factorsinclude bathymetry, tides, ocean swell, water density, and the squat, pitch,roll, and heave of a vessel underway in a channel. If greater precision canbe achieved in the measurement or prediction of these factors, the cumu-lative safety allowance can be reduced and vessel loading maximized.Accurate hydrographic surveys are essential for determining bathymetryand the nature of the water bottom, and for improving the dynamic model-ing of tides, ocean waves, and the dynamic response of a ship transiting thechannel. Several Australian ports actively manage the maximum loading ofcargo ships through real-time ocean swell monitoring, accurate tidal model-ing, high-resolution hydrographic surveys, and ship response modeling.The economic impact is impressive. For the 1996-1997 fiscal year in HayPoint/Dalrymple Bay, Queensland, 123 vessels loaded nearly an additional0.75 million tons of coal. The savings in freight cost was $7.5 million, andthe increased value of exported earnings was $30 million (O’Brien, 1997).
through increased geographic coverage and improved quality of service(IHB, 2001).
Economic Importance of Shipping
As noted earlier, over 98 percent of the nation’s non-NAFTA trade iscarried by ships through the U.S. coastal zone. With access to adequatecharts of the coastal zone, ships can ply the optimum routes, which inmost cases are the shortest navigable routes. In other cases, an optimumshipping route may be longer but traverse a deep water approach thatallows larger, fully loaded ships to proceed to port. By coupling high-resolution hydrographic surveys, accurate tidal monitoring and modeling,and dynamic ship response predictors, the minimum under keel clearancecan be actively managed to maximize the loading of large commercialvessels (see Box 2.2). Additionally, accurate and up-to-date charts andnavigation services should ultimately reduce insurance premiums, asreduced navigation-related incidents are factored into premium calculations.In sum, the advantages of accurate and complete navigational informationyield maximum throughput of cargo at the lowest possible costs.
Copyright © National Academy of Sciences. All rights reserved.
A Geospatial Framework for the Coastal Zone: National Needs for Coastal Mapping and Chartinghttp://www.nap.edu/catalog/10947.html

28 A GEOSPATIAL FRAMEWORK FOR THE COASTAL ZONE
1.3 ACOUSTIC SEABED CHARACTERIZATION
Single-beam echosounders have been used increasingly over the pastdecade not only to collect bathymetry but also to determine seabed char-acteristics. One such system is used by ecologists to characterize habitatsin shallow waters (1.4 to 30meters), where it can work effec-tively at vessel speeds of 8 to 12knots. The first and second (mul-tiple) echoes returned to the sea-bed characterization system’ssensor provide indications of thebottom roughness and hardness,respectively. By examining theinformation from both types ofreturns, sediment type can becharacterized as long as calibra-tion protocols are closelyfollowed. One of the advantages is that the data can be monitored in realtime and thus calibrated for a local environment. The disadvantages arethat it is not effective in very shallow water (less than 1.4 m) and its narrowcoverage may not be suitable for interpolation in areas with patchy distri-bution of sediment types. These systems typically require local calibrationagainst known bottom types for optimal performance.
1.4 SIDESCAN SONARS
Sidescan sonars use the acoustic energy returned laterally from the sea-floor. There are many types of sidescan sonars, and each has its advantagesand disadvantages.
Conventional Sidescan Sonar. Sidescan sonars can be used to makedigital acoustic images of the seabed. Although most sidescan units aretowed behind a survey vessel, they can also be hard mounted to the vesselfor very shallow work. The figure shows a towed sidescan sonar that is“looking” out across the seafloor to either side of the ship. Sidescan sonarstypically gather imagery with higher resolution than multibeam echo-sounders, and over a broader swath width. Because they are towed close tothe seabed, sidescan sonars can also better delineate seabed obstructionssuch as rock outcrops, wrecks, and debris. The seafloor is typically sur-veyed in swaths 100 to 500 meters wide; digital splicing of adjacent sonarlines can be employed to assemble a sidescan sonar mosaic that providescontinuous imaging of a mapping area. Like multibeam imagery, digital
continued
BOX 2.1 Continued
continued
Copyright © National Academy of Sciences. All rights reserved.
A Geospatial Framework for the Coastal Zone: National Needs for Coastal Mapping and Chartinghttp://www.nap.edu/catalog/10947.html

COASTAL MAPPING NEEDS AND ACTIVITIES 29
Navigation Safety
A thorough understanding and charting of the nearshore zone con-tributes to a reduction in maritime accidents and aids in the mitigation ofaccidents should they occur. It is self-evident that properly navigatedships using accurate charts will avoid groundings, with their associatedrisk of oil and hazardous cargo spillage and the potential for destructionof sensitive marine habitats. There are several additional services requiredfor safe and efficient navigation that further prevent or mitigate environ-mental catastrophes. A maritime information system that monitorschanges in the maritime environment and provides mariners with reportsof conditions that affect their operations is integral to providing safe andefficient navigation. Local Notice to Mariners (LNM) provides frequentupdates to navigational products, with information regarding hazardousconditions such as inoperative navigational aids, wrecks, dredging opera-tions, and military exercises. The World Wide Navigational WarningSystem (WWNWS) provides navigational and meteorological warningsand other urgent safety-related messages via radio and satellite commu-nications. Maintaining the currency of navigational information, broad-casting emergent safety information, and providing a 24-hour networkfor mariners to report incidents and unsafe conditions all markedly con-tribute to the avoidance of maritime accidents and to rapid response whenthey do occur.
Navigation safety is of concern for recreational boats as well as largevessels. Annual USCG statistics for recreational boating accidents showthat there are approximately 500 groundings and 200 additional incidentsof “striking submerged objects” each year. Together, these accidents resultin more than 300 injuries and deaths annually and millions of dollars inproperty damage. Because these statistics do not include similar accidentsinvolving nonrecreational vessels such as commercial fishing boats, oil-field supply vessels, and the academic fleet, the true annual cost ofproperty damage is probably substantially greater than that for recre-ational boats alone. Although some proportion of the costs results fromhuman error, there is undoubtedly a significant proportion that resultseither directly from inadequate charts or indirectly from reduced situ-ational awareness that could be rectified with modern electronic chartdisplays.
With the increased availability and decreased cost of GPS receivers,recreational boaters can now receive accurate position data, and manyGPS receivers integrate position data with chart data for easy viewing.Unfortunately, the chart data may not be particularly current and there-fore may no longer represent the geographic regions accurately. This,together with the enormous variety of areas in which recreational boaters
Copyright © National Academy of Sciences. All rights reserved.
A Geospatial Framework for the Coastal Zone: National Needs for Coastal Mapping and Chartinghttp://www.nap.edu/catalog/10947.html

30 A GEOSPATIAL FRAMEWORK FOR THE COASTAL ZONE
sidescan sonar mosaic imagescan be draped over a digital ter-rain model. NOAA often uses acombination of multibeam echo-sounders and sidescan sonar fornautical charting surveys.
The intensity of sound receivedby the sidescan sonar tow vehiclefrom the seafloor (backscatter)provides information on the gen-eral distribution and characteris-tics of surficial sediment. In thelower schematic, strong reflec-tions (high backscatter) fromboulders, gravel, and verticalfeatures facing the sonar trans-ducers are white; weak reflec-tions (low backscatter) from finersediments or shadows behindpositive topographic features areblack.
Chirp Sidescan Sonar. A technical advance from the conventional side-scan sonar is the chirp sidescan sonar. While conventional sidescan sonarstransmit a single frequency (typically 100 or 500 kHz), chirp sidescansonars transmit a range of frequencies (e.g., 114 to 126 kHz). Through itsability to transmit more energy into the water and the employment of pulsecompression techniques, chirp sidescan provides improved target or featureresolution.
High-Speed Sidescan Sonar. Sidescan sonars are generally towed atspeeds ranging from 2 to 5 knots. Faster tow speeds result in sonar imageblurring because consecutive sonar image lines are too far apart. This effectwould be similar to a television that displays only a fraction of the usualnumber of lines on the screen. However, a new high-speed sidescan canbe towed at speeds up to 10 knots, because multiple image lines arerecorded in a single transmission. These higher-speed sonars have signifi-cantly improved the productivity of surveys in less than 100 meters of water.
Synthetic Aperture Sonar. Another technical advance for sidescan sonarsis the newly available synthetic aperture sonar. Synthetic aperture sonarallows consecutive overlapping sonar images to be intelligently stacked
BOX 2.1 Continued
continued
Copyright © National Academy of Sciences. All rights reserved.
A Geospatial Framework for the Coastal Zone: National Needs for Coastal Mapping and Chartinghttp://www.nap.edu/catalog/10947.html
COASTAL MAPPING NEEDS AND ACTIVITIES 31
BOX 2.3Regulation 9 of Chapter V of the
Safety of Life at Sea (SOLAS) Convention
1. Contracting Governments undertake to arrange for the collection andcompilation of hydrographic data and the publication, dissemination, andkeeping up to date of all nautical information necessary for safe navigation.2. In particular, Contracting Governments undertake to co-operate in carry-ing out, as far as possible, the following nautical and hydrographic services,in the manner most suitable for the purpose of aiding navigation:
2.1 To ensure that hydrographic surveying is carried out, as far as pos-sible, adequate to the requirements of safe navigation;2.2 To prepare and issue official nautical charts, sailing directions, listsof lights, tide tables and other official nautical publications, where ap-plicable, satisfying the needs of safe navigation;2.3 To promulgate notices to mariners in order to keep official nauticalcharts and publications, as far as possible, up to date;2.4 To provide data management arrangements to support these services.
3. Contracting Governments undertake to ensure the greatest uniformity incharts and nautical publications and to take into account, whenever pos-sible, the relevant international resolutions and recommendations.4. Contracting Governments undertake to co-ordinate their activities tothe greatest possible degree in order to ensure that hydrographic andnautical information is made available on a worldwide scale as timely,reliably and unambiguously as possible.
travel, has increased the demand for more current and accurate naviga-tional charts (in both paper and electronic formats).
The International Maritime Organization (IMO), a specialized bodyof the United Nations of which the United States is a signatory ContractingGovernment, explicitly described the governmental obligation to providefor safe and efficient navigation in the Safety of Life at Sea (SOLAS) Con-vention (see Box 2.3).
The Marine Navigation Safety Coalition is a marine industry stake-holder group that includes more than 60 organizations, including portauthorities, port associations, shipping associations, pilot associations,cruise lines, insurance companies, marine exchanges, and other privatecorporations. For each of the past several years, the coalition has encour-aged NOAA and Congress to more aggressively address the survey back-
Copyright © National Academy of Sciences. All rights reserved.
A Geospatial Framework for the Coastal Zone: National Needs for Coastal Mapping and Chartinghttp://www.nap.edu/catalog/10947.html

32 A GEOSPATIAL FRAMEWORK FOR THE COASTAL ZONE
(added together), thereby minimizing random noise while enhancing theimage. This technology will allow a 10-fold increase in sidescan sonarresolution, from 1-meter pixel size to 5 centimeters or better across the fullsonar swath. This also means that the volume of collected data will increaseby more than 100-fold.
Interferometric Sonar. Interferometric sonars are designed to gatherboth sidescan imagery and swath bathymetry. Interferometric techniqueshave been tried for many decades with varying degrees of success. In general,they provide excellent sonar imagery but reduced quality of bathymetry,although new developments in sonar design and signal processing areimproving the quality of interferometric bathymetric data. These improvedversions are of particular interest for coastal mapping work because of theirability to achieve very wide swaths in relatively shallow water.
1.5 SUBBOTTOM PROFILER
Subbottom profilers use reflected sound (similar to the way an ultra-sound provides images of internal organs) to provide acoustic (seismic)profiles, or cross sections, of features below the ocean floor. Subbottomsystems operate at lower frequencies than echosounders and imagingsonars. High-resolution subbottom profilers operate at the high end of thefrequency range (e.g., 3.5 kHz)but do not penetrate very far intothe seafloor. Midrange systems(boomers, etc.) collect geophysicalinformation to depths of 80 to100 meters beneath the oceanfloor but provide less detail.Very low frequency seismic sys-tems (air and water guns) areused to profile much deeper intothe subsurface (with a furtherloss of resolution); these are thestandard hydrocarbon explora-tion tool. Subbottom profilers often achieve limited penetration in hard-bottom areas (sand, rocks, etc.) and areas where shallow methane gas hasaccumulated.
2. OTHER UNDERWATER SENSORS
Other underwater sensors include magnetic systems and light-based sys-tems (e.g., cameras and lasers). Some of these have been in use for many
continued
BOX 2.1 Continued
Copyright © National Academy of Sciences. All rights reserved.
A Geospatial Framework for the Coastal Zone: National Needs for Coastal Mapping and Chartinghttp://www.nap.edu/catalog/10947.html

COASTAL MAPPING NEEDS AND ACTIVITIES 33
log (estimated in 2000 to be 43,000 square nautical miles for “critical” areasand 491,000 square nautical miles for “significant” areas; DeBow et al.,2000) and associated tidal monitoring programs. This group maintainsthat such programs are critical for safety of life and the protection ofproperty and the environment as well as for improving the efficiency andcompetitiveness of the U.S. marine transportation system.
Collection and Processing of Source Data for Navigation
For U.S. waters the Office of Coast Survey (OCS), an office of NOAA’sNational Ocean Service (NOS), collects and processes the vast majority ofdata necessary for navigation. OCS vessels, or private industry ships con-tracted by OCS, collect hydrographic data that include bathymetry, tides,water column properties, and bottom composition. Nearly 50 percent ofthe data compiled by OCS are obtained through contract to private indus-try. Aids to Navigation (AtNs) are initially fixed during these surveys;however, USCG normally maintains these aids and provides updatedstatus and position to OCS as conditions warrant.
The National Geodetic Survey (NGS) provides delineation of thenation’s shoreline using numerous techniques, including airborne photo-grammetry, satellite altimetry, LIDAR, and land-based survey. Datacollection performed at low tide may also be useful for detecting shallow-water hazards.
The U.S. Army Corps of Engineers (USACE) is tasked to monitor andmaintain the navigability of numerous harbors and inland waterways.Additionally, the USACE undertakes beach replenishment projects,requiring an understanding of sediment transport processes and theidentification of sediment sources. Each of these activities requires thecollection of bathymetry, bottom composition, and coastal topography,although in some instances the data collection may not meet internationalstandards for nautical charts.
The U.S. Navy collects and processes hydrographic data outside thenation’s territorial waters. These data are provided to the NationalGeospatial-Intelligence Agency (NGA; formerly the National Imagery andMapping Agency) for compilation into the nautical charts and productsthat are used for U.S. and allied military operations. Since September 11,2001, the U.S. Naval Oceanographic Office has collaborated with OCS inthe collection of bathymetric and sidescan sonar data in strategic U.S.harbors (see Homeland Security section below).
The USCG installs and maintains AtNs throughout U.S. waters, andthe precise positions of these AtNs are provided to NOS and NGA forinclusion in nautical charts and publications. Changes in the status orcharacteristics of AtNs and the existence of hazardous conditions are
Copyright © National Academy of Sciences. All rights reserved.
A Geospatial Framework for the Coastal Zone: National Needs for Coastal Mapping and Chartinghttp://www.nap.edu/catalog/10947.html

34 A GEOSPATIAL FRAMEWORK FOR THE COASTAL ZONE
years, while others are more recent developments; all of these technolo-gies, however, are experiencing continual improvements in hardware, soft-ware, and data presentation.
2.1 MAGNETOMETER
The marine magnetometer measures the earth’s magnetic field and isnormally towed from a vessel in a manner similar to the sidescan sonar.Ferrous objects, such as pipe-lines, sunken vessels, and metaldebris, will affect the ambientmagnetic field measured by themagnetometer. These effects, oranomalies, provide indicationsof the presence of features thatare not apparent from data pro-vided by acoustic sensors. Themagnetometer is particularly useful for locating buried or subtle ferrousobjects.
2.2 GRADIOMETER
Gradiometers are actually comprised of two magnetometers, whosesolutions are combined to reduce the effects of ambient ferrous, or mag-netic, noise. They are of particular value when trying to identify smallferrous objects that are within the magnetic field of larger ferrous objects.An example would be locating individual items within a debris field.
2.3 LASER LINE SCAN
Laser line scanning systems are towed or mounted on a sled and movedin a slow constant fashion at a stable height over the seafloor. As the sled
moves forward, a narrow laserbeam incrementally scans a por-tion of the seafloor. Individualscans are combined to create verydetailed images with a qualitythat approaches that of a con-ventional photograph. Accuratepositioning determinations arecritical for assembling continuousmosaic coverage of a mappedarea. One advantage of this lasertechnique is the ability to obtain
BOX 2.1 Continued
continued
Copyright © National Academy of Sciences. All rights reserved.
A Geospatial Framework for the Coastal Zone: National Needs for Coastal Mapping and Chartinghttp://www.nap.edu/catalog/10947.html

COASTAL MAPPING NEEDS AND ACTIVITIES 35
monitored by the USCG and reported through LNMs and provided toNGA for worldwide distribution. Recreational boaters, through theactivities of the U.S. Power Squadron and the USCG Auxiliary, provide avaluable quality assurance function and source of input for LNMs.
NGA does not generally collect source data, relying on the U.S. Navyand exchange agreements with other nations; however, the agencypartnered with the National Aeronautics and Space Administration(NASA) on the Shuttle Radar Topography Mission (SRTM) that collectedhigh-resolution radar altimetry data for over 80 percent of the earth’s landtopography. These data are sufficiently accurate to position a non-tidallycorrected coastline. Additionally, NGA accesses commercial and intelli-gence satellites capable of providing topography and land-use informa-tion; however, the collection of this information is generally restricted toforeign land, and the resulting products are frequently classified.
NGA, NOAA-OCS, USACE, and the Navy access satellite imageryoperated by other government agencies (NOAA’s National EnvironmentalSatellite, Data, and Information Service [NESDIS], National Reconnais-sance Office) or commercial activities (IKONOS, LANDSAT, SPOT, etc.).Historical information regarding coastal processes is accessed througharchives held by state and local governments and academia.
Tools and Applications for Using Navigation Data
The various agencies use different tools and applications to process,disseminate, and display their hydrographic data. NOAA’s CSC Web site4
offers access to GIS tools for accessing rasterized navigation charts, andNOAA’s National Geophysical Data Center (NGDC) Geophysical DataSystem (GEODAS) software offers access to point data in a more basicform. NGA and the Navy developed the Hydrographic Source andAssessment Systems (HYSAS) protocol for the transfer, assessment, andmanipulation of data between these two agencies, and other agencies havesimilar programs tailored to their individual needs. USACE’s ScanningHydrographic Operational Airborne LIDAR Survey (SHOALS) ToolBoxprovides applications for the manipulation of geospatial data and engi-neering calculations. A wide range of private-sector electronic chartproducts (some supported by officially sanctioned databases) offeringboth raster and vector products exist (e.g., Electronic Chart Display andInformation Systems [ECDIS], Ward et al., 2000).
4See http://www.csc.noaa.gov/bins/tools.html.
Copyright © National Academy of Sciences. All rights reserved.
A Geospatial Framework for the Coastal Zone: National Needs for Coastal Mapping and Chartinghttp://www.nap.edu/catalog/10947.html
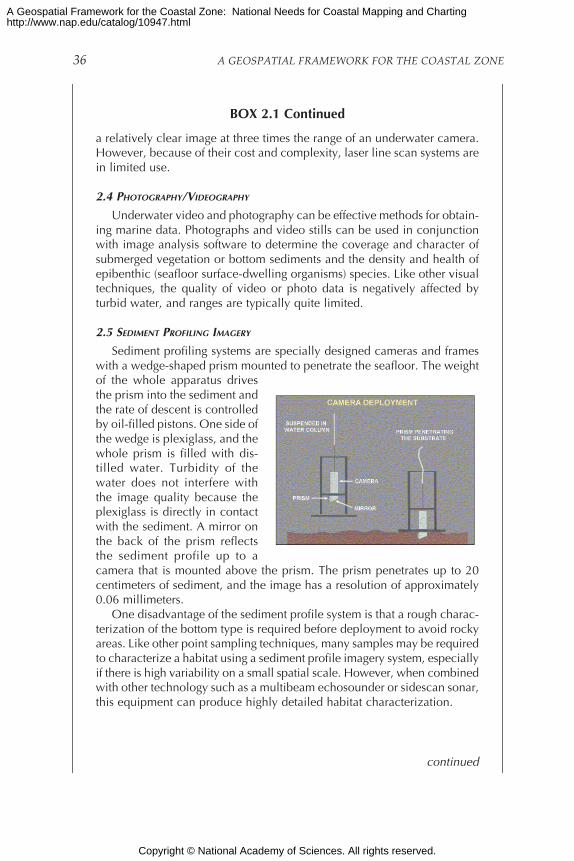
36 A GEOSPATIAL FRAMEWORK FOR THE COASTAL ZONE
a relatively clear image at three times the range of an underwater camera.However, because of their cost and complexity, laser line scan systems arein limited use.
2.4 PHOTOGRAPHY/VIDEOGRAPHY
Underwater video and photography can be effective methods for obtain-ing marine data. Photographs and video stills can be used in conjunctionwith image analysis software to determine the coverage and character ofsubmerged vegetation or bottom sediments and the density and health ofepibenthic (seafloor surface-dwelling organisms) species. Like other visualtechniques, the quality of video or photo data is negatively affected byturbid water, and ranges are typically quite limited.
2.5 SEDIMENT PROFILING IMAGERY
Sediment profiling systems are specially designed cameras and frameswith a wedge-shaped prism mounted to penetrate the seafloor. The weightof the whole apparatus drivesthe prism into the sediment andthe rate of descent is controlledby oil-filled pistons. One side ofthe wedge is plexiglass, and thewhole prism is filled with dis-tilled water. Turbidity of thewater does not interfere withthe image quality because theplexiglass is directly in contactwith the sediment. A mirror onthe back of the prism reflectsthe sediment profile up to acamera that is mounted above the prism. The prism penetrates up to 20centimeters of sediment, and the image has a resolution of approximately0.06 millimeters.
One disadvantage of the sediment profile system is that a rough charac-terization of the bottom type is required before deployment to avoid rockyareas. Like other point sampling techniques, many samples may be requiredto characterize a habitat using a sediment profile imagery system, especiallyif there is high variability on a small spatial scale. However, when combinedwith other technology such as a multibeam echosounder or sidescan sonar,this equipment can produce highly detailed habitat characterization.
continued
BOX 2.1 Continued
continued
Copyright © National Academy of Sciences. All rights reserved.
A Geospatial Framework for the Coastal Zone: National Needs for Coastal Mapping and Chartinghttp://www.nap.edu/catalog/10947.html

COASTAL MAPPING NEEDS AND ACTIVITIES 37
Navigation Products
Numerous safety-of-navigation products are compiled directly fromsource data. The purest examples are databases accessible in hard copy ordigitally through the Internet, such as LNMs, Lists of Lights, AtNs, andRadio Navigation Aids. These products are produced locally by USCGand on a worldwide basis by NGA. More complex products are producedthrough the combination of several data sources. The World Vector Shore-line produced by NGA is an example of a database populated from avariety of sources. On the extreme end of complexity, a nautical chart isthe depiction of numerous datasets, such as bathymetry, AtNs, bottomcomposition, and water column properties. As noted above, nauticalcharts are produced by OCS for U.S. waters and globally by NGA. Simi-larly, USACE produces several products based on source data collectedfor the waterway projects for which the agency is responsible. TypicalUSACE products include inland waterway charts, both hard-copy andelectronic, navigation channel condition reports, and engineering draw-ings of waterway projects. The fact that the above products flow directlyfrom source data does not imply an automated process. Since theseproducts are directly related to safety of navigation, there are extensivequality control, validation, and verification components associated withtheir generation.
The combination of disparate datasets, modeled parameters, and rule-based assumptions is the basis for derived map products for the navigator,such as NGA’s Sailing Directions, Pilot Charts, and Port Directories, aswell as general navigation reference documents such as The American Prac-tical Navigator, sight reduction tables, and nautical almanacs.
Homeland Security
The physical security of U.S. ports is a mission of the USCG in generaland the U.S. Navy for selected ports. Following the terrorist attacks ofSeptember 11, 2001, homeland security has become a priority nationalconcern, with port security being a significant focus. Coastal mappingand charting are integral elements of several components of homelandsecurity. In particular, the mining of a port, the intrusion into the port byswimmers or underwater vehicles, or the release of chemical or biologicalagents into the water are all potential threats. An adequate knowledge ofthe nation’s ports and surrounding coastal areas is a necessary require-ment for defending against or responding to such terrorist attacks.
Counter Mine Warfare (CMW) requires high resolution bathymetryand backscatter data for entire ports and shipping sortie routes out todeep water in advance of any threat. These data are used to identify andprecisely fix all objects on the bottom that may appear mine-like. In the
Copyright © National Academy of Sciences. All rights reserved.
A Geospatial Framework for the Coastal Zone: National Needs for Coastal Mapping and Chartinghttp://www.nap.edu/catalog/10947.html

38 A GEOSPATIAL FRAMEWORK FOR THE COASTAL ZONE
3. REMOTE SENSING FROM AIR AND SPACE
Concomitant with the rapid evolution of sonar technology have beenrevolutionary changes in the spatial and spectral capabilities of imagerycollected from air or space. Remote sensing from the air offers the distinctadvantage of high productivity through large areal coverage. On the otherhand, it is often constrained by weather, visibility, and sun angle. Opticalremote sensing techniques rarely penetrate through the water column butcan provide extremely valuable data to describe the terrestrial componentof the coastal zone, as well as water quality conditions, sediment transport,surface water temperature, and organic productivity.
3.1 AERIAL AND SATELLITE IMAGERY
Photography from aircraft can be accomplished with conventional filmor digital technology. Digital images have the advantage of being viewablein the field, allowing immediate verification of image quality. Positionalinformation is generally recorded concurrently using GPS and InertialMeasurement Unit (IMU) instruments. Disadvantages of aerial photographyinclude difficulties in the timing of flights to coincide with low tide, vegeta-tive cover, and acceptable weather conditions. With adequate groundtruthing, aerial photography can be orthographically rectified (or ortho-rectified), so that the image (an “orthoimage”) can be scaled in both direc-tions. If the aerial imagery has adequate overlap, three-dimensional datacan be generated.
Satellite imaging systems such as Landsat and the Advanced Very HighResolution Radiometer (AVHRR) provide even wider coverage, with multi-spectral information useful for sensing objects in the onshore and very shal-lowest offshore components of the coastal zone. Although the resolution ofthese sensors has been limited to tens of meters up to a few kilometers,recent improvements in high-resolution satellite imaging (e.g., IKONOSand QuickBird) have created the potential for employing satellite images incoastal zone applications that previously have been supported only byaerial photographs. Satellite imagery has the advantage of systematic cov-erage, periodic observations for both short- and long-term change detec-tion, and potentially better cost effectiveness. The committee anticipatesincreased use of satellite images in coastal applications in the future.Unfortunately, satellite-based imaging capabilities degrade rapidly as waterdepth increases. Although the bathymetry of deep-ocean basins may beconsiderably improved using satellite-based radar altimetry (Sandwell etal., 2002), the limited resolution available using this technique in shallowcoastal waters offers little potential for replacing acoustic bathymetricmeasurements.
BOX 2.1 Continued
continued
Copyright © National Academy of Sciences. All rights reserved.
A Geospatial Framework for the Coastal Zone: National Needs for Coastal Mapping and Chartinghttp://www.nap.edu/catalog/10947.html

COASTAL MAPPING NEEDS AND ACTIVITIES 39
event that a harbor is mined, change detection algorithms are used to dis-criminate between the previously mapped mine-like objects and new ob-jects detected by post-mining surveys. Bottom characterization usingacoustic methods and grab or core samples is necessary to determine thelikelihood of mine burial, and accurate current and circulation models arenecessary to predict the trajectory of floating mines. Additionally, descrip-tion of the local magnetic field variability is required to defend againstmagnetic influence mines. CMW efforts typically produce “Q-Route”charts5 that lay out predetermined sortie routes, which can be easilycleared of mines because they have few existing mine-like objects andhave bottom characteristics that would ease the detection and removal ofmines. The various factors affecting CMW are assembled in classifiedMine Pilot Publications for each port of interest.
Visual detection and acoustic detection are the primary methods usedto counter the intrusion of swimmers or underwater vehicles. Acousticdetection in shallow water is difficult, but is more easily accomplishedwith a combination of high resolution bathymetry and bottom and watercolumn characterization that relates to sound propagation. High-resolutionbathymetry is pivotal to improved tidal and current models that areimportant components in understanding waterborne intrusion routes. Inthe event of a release of chemical or biological agents into the water, high-resolution bathymetry, bottom characterization, and tidal and currentmodeling are critical for understanding the propagation of these agentsand their interaction with bottom sediment.
The U.S. Navy has collected data necessary for port security andQ-Route determination for certain strategic naval ports. Post-9/11 activi-ties in support of homeland security demonstrate several examples ofimproved communication and cooperation between agencies. With theneed to expeditiously collect data, NOAA, Navy, USCG, and USACE haveroutinely met and assigned data collection responsibilities against aprioritized list of requirements. This list typically includes 100 percentcoverage of designated port areas for a range of data—high-resolutionbathymetry, acoustic bottom backscatter, sea bottom characterization, fix-ing of mine-like objects, tides, currents, physical properties of the watercolumn, and magnetic variability.
Coastal Zone Boundaries
Boundaries in the coastal zone are linear features defined for a rangeof purposes, including the establishment of national, international, and
5The U.S. Navy refers to shipping lanes in mined or potentially mined waters as “Q-routes”(see NRC, 2003c).
Copyright © National Academy of Sciences. All rights reserved.
A Geospatial Framework for the Coastal Zone: National Needs for Coastal Mapping and Chartinghttp://www.nap.edu/catalog/10947.html
40 A GEOSPATIAL FRAMEWORK FOR THE COASTAL ZONE
Hyperspectral imaging instruments can collect spectral reflectance datain shallow water or over land. The sensors are mounted on small aircraftand detect reflectance up to 288 narrowband wavelengths in the visibleand infrared spectrum. The user can specify which spectral bands are mea-sured and the bandwidths that are used. GPS coordinates and altitude arerecorded along with the reflectance data. The data produced by hyper-spectral imaging achieve very high resolution but require special image-processing software for importation into GIS. Like all aircraft-mounted tech-nologies, hyperspectral sensors require clear, calm, shallow water to obtainhigh-quality data offshore. Variable water chemistry and tidal or solarconditions can alter the spectral signal of particular bottom features, andtherefore a highly trained observer is required to interpret the data.
The Compact Airborne Spectrographic Imager (CASI) was the first com-mercially available hyperspectral sensor. The information gathered by CASIsystems can be used for mapping bathymetry and habitat in shallow water.CASI can also be used to assess some water quality parameters such as thepresence of algae that are associated with Harmful Algal Blooms (HABs;e.g., red tides).
3.2 TOPOGRAPHIC LIDAR
This equipment measures the distance between the ground and an air-craft using laser light. LIDAR sends a short laser pulse, and the elapsed timefor the signal to be reflected from the ground to the airborne receiver isrecorded. Because the laser scans across track, topographic data are collectedacross a wide corridor as the survey proceeds. Highly accurate topographicmaps (up to 20 centimeters vertical resolution) can be made using LIDARin sandy areas, but this technology is not as effective in rocky habitats. Thestrength of the return signal provides additional information about thetarget.
In contrast to bathymetric LIDAR, where federal agencies are providingthe substantial investment needed for initial technology development, topo-graphic LIDAR is a relatively mature technology that is now dominated bythe private sector, with numerous companies offering commercial LIDARservices.b
3.5 BATHYMETRIC LIDAR
Bathymetric LIDAR works like a multibeam echosounder but using lightinstead of sound. It can determine depths across a swath width of 220meters when flown at an altitude of 400 meters. Data densities of 2 meters× 2 meters have been achieved, with a depth resolution to 15 centimeters.In clear water, bathymetric LIDAR is far more productive than ship-based
continued
BOX 2.1 Continued
continued
Copyright © National Academy of Sciences. All rights reserved.
A Geospatial Framework for the Coastal Zone: National Needs for Coastal Mapping and Chartinghttp://www.nap.edu/catalog/10947.html

COASTAL MAPPING NEEDS AND ACTIVITIES 41
local jurisdictions (territorial claims and property lines), hazard studies,and long-term environmental management. In many cases, coastal zoneboundaries represent the convergence of law and spatial mapping. Bothmarine and onshore boundaries share the concept of “cadastre” in thatthey have components of adjudication, survey, and owner rights but differin that the common land-based process of demarcation is not usuallyapplied to marine boundaries. Instead marine boundaries are typicallydelimited mathematically, with no physical evidence like monuments orpins present (Fowler and Treml, 2001). Marine boundaries often definethe initial starting points for many critical legal issues and process studies,but because of the dynamic nature of the coastal environment, theseboundaries may change over time. Timely and routine mapping andupdating of these boundaries are thus extremely important for safe navi-gation, resource management (e.g., Thormahlen, 1999), environmentalmonitoring, coastal development, and many other applications.
The Shoreline
Many coastal zone boundaries are described relative to the dynamicshoreline. Because the shoreline is not static and its location at any pointin time is affected by tides, a discussion of shoreline mapping (and mostother marine boundary mapping) cannot be separated from discussion oftidal datums. A tidal datum is a base elevation used as a reference fromwhich to measure heights or depths that are defined with respect to acertain phase of the tide (Hicks et al., 2000). A number of tidal datums areused in chart making—in the United States, the common datums are MeanHigher High Water (MHHW), Mean High Water (MHW), Mean LowWater (MLW), Mean Lower Low Water (MLLW), and Mean Sea Level(MSL). To establish an official tidal datum, tide measurements are madeover a period of 19 years—the National Tidal Data Epoch (NTDE). Thedatum used—for example, MLW—is thus the average of all of the MLWsover a 19-year period. The 19-year average is used because it representsthe Metonic cycle that accounts for the full range of distances between theearth, the sun, and the moon. The NTDE is reviewed annually for revisionand must be reconsidered every 25 years (Hicks et al., 2000). Dependingon which datum is used, the position of the “shoreline” or land-waterinterface on a map will be different, with significant impact on the deter-mination of maritime boundaries (see Figure 2.1).
Figure 2.1 illustrates the multiple definitions of the shoreline and sub-merged lands that are used by different federal, state, and local authorities.Twenty-one states define the state submerged land boundaries based onthe tide-coordinated shorelines (MHW and MLLW), and the ExclusiveEconomic Zone (EEZ) boundary is determined based on the MLLW shore-
Copyright © National Academy of Sciences. All rights reserved.
A Geospatial Framework for the Coastal Zone: National Needs for Coastal Mapping and Chartinghttp://www.nap.edu/catalog/10947.html
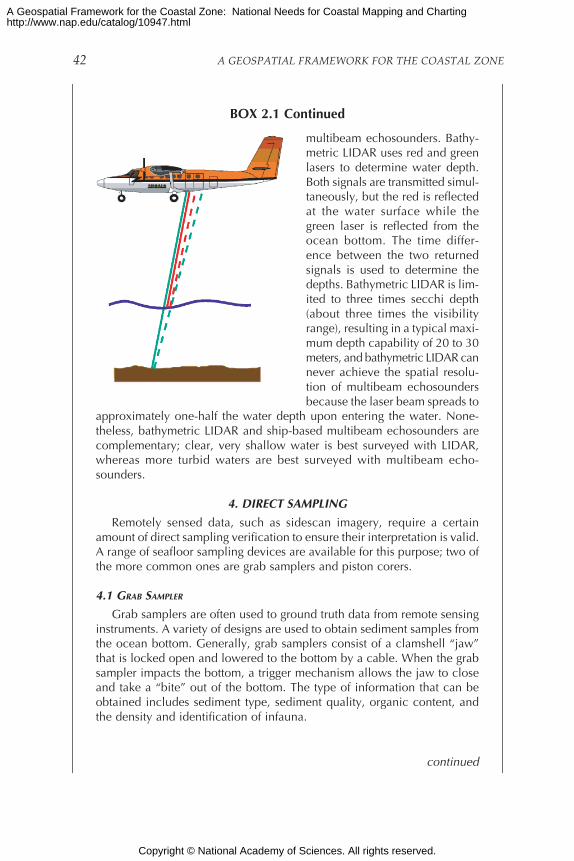
42 A GEOSPATIAL FRAMEWORK FOR THE COASTAL ZONE
multibeam echosounders. Bathy-metric LIDAR uses red and greenlasers to determine water depth.Both signals are transmitted simul-taneously, but the red is reflectedat the water surface while thegreen laser is reflected from theocean bottom. The time differ-ence between the two returnedsignals is used to determine thedepths. Bathymetric LIDAR is lim-ited to three times secchi depth(about three times the visibilityrange), resulting in a typical maxi-mum depth capability of 20 to 30meters, and bathymetric LIDAR cannever achieve the spatial resolu-tion of multibeam echosoundersbecause the laser beam spreads to
approximately one-half the water depth upon entering the water. None-theless, bathymetric LIDAR and ship-based multibeam echosounders arecomplementary; clear, very shallow water is best surveyed with LIDAR,whereas more turbid waters are best surveyed with multibeam echo-sounders.
4. DIRECT SAMPLING
Remotely sensed data, such as sidescan imagery, require a certainamount of direct sampling verification to ensure their interpretation is valid.A range of seafloor sampling devices are available for this purpose; two ofthe more common ones are grab samplers and piston corers.
4.1 GRAB SAMPLER
Grab samplers are often used to ground truth data from remote sensinginstruments. A variety of designs are used to obtain sediment samples fromthe ocean bottom. Generally, grab samplers consist of a clamshell “jaw”that is locked open and lowered to the bottom by a cable. When the grabsampler impacts the bottom, a trigger mechanism allows the jaw to closeand take a “bite” out of the bottom. The type of information that can beobtained includes sediment type, sediment quality, organic content, andthe density and identification of infauna.
BOX 2.1 Continued
continued
Copyright © National Academy of Sciences. All rights reserved.
A Geospatial Framework for the Coastal Zone: National Needs for Coastal Mapping and Chartinghttp://www.nap.edu/catalog/10947.html
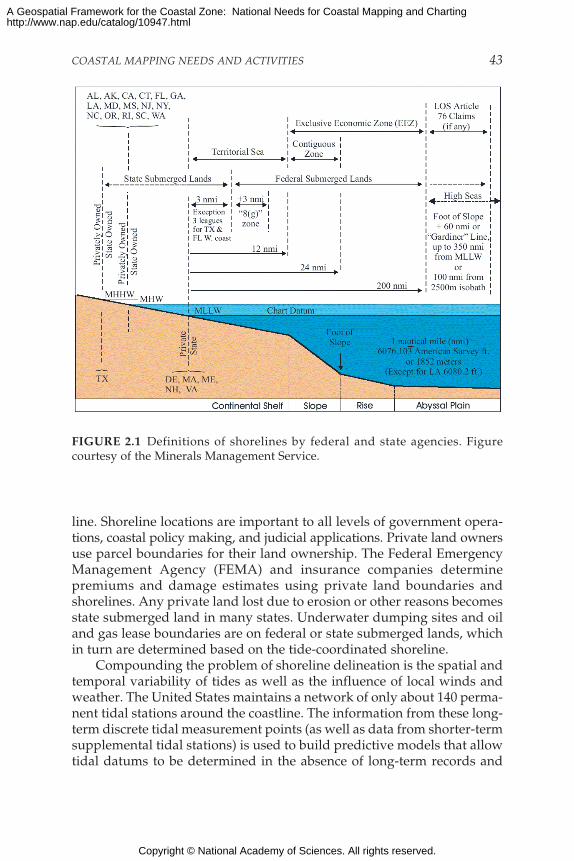
COASTAL MAPPING NEEDS AND ACTIVITIES 43
FIGURE 2.1 Definitions of shorelines by federal and state agencies. Figurecourtesy of the Minerals Management Service.
line. Shoreline locations are important to all levels of government opera-tions, coastal policy making, and judicial applications. Private land ownersuse parcel boundaries for their land ownership. The Federal EmergencyManagement Agency (FEMA) and insurance companies determinepremiums and damage estimates using private land boundaries andshorelines. Any private land lost due to erosion or other reasons becomesstate submerged land in many states. Underwater dumping sites and oiland gas lease boundaries are on federal or state submerged lands, whichin turn are determined based on the tide-coordinated shoreline.
Compounding the problem of shoreline delineation is the spatial andtemporal variability of tides as well as the influence of local winds andweather. The United States maintains a network of only about 140 perma-nent tidal stations around the coastline. The information from these long-term discrete tidal measurement points (as well as data from shorter-termsupplemental tidal stations) is used to build predictive models that allowtidal datums to be determined in the absence of long-term records and
Copyright © National Academy of Sciences. All rights reserved.
A Geospatial Framework for the Coastal Zone: National Needs for Coastal Mapping and Chartinghttp://www.nap.edu/catalog/10947.html

44 A GEOSPATIAL FRAMEWORK FOR THE COASTAL ZONE
4.2 PISTON CORER
Like grab sampling, piston core sampling is generally effective only insoft sediment. Under the right seafloor conditions, typical piston corers canprovide a few meters of oceanbottom sediment samples. Larger“jumbo” piston coring systemscan produce samples up to 30meters long, and there is onegiant piston corer that can pen-etrate to 60 meters. The coringapparatus is lowered to thebottom and triggered. A weightpushes the core barrel into theseafloor while a piston seal inthe barrel causes suction, helpingto recover the sediment sample.The piston core technique resultsin minimal stratigraphic distur-bance.
aSee http://woodshole.er.usgs.gov/operations/sfmapping/dataacq.htm.bSee http://www.airbornelasermapping.com/ALMIndex.html for a national and inter-national listing.
SOURCES: 1.1–single-beam echosounder, image courtesy of the Woods Hole Oceano-graphic Institution; 1.2–multibeam echosounder, image courtesy of Kongsberg Simrad;1.3–acoustic seafloor map, image courtesy of Stenmar Sonavision Limited; 1.4–sidescansonar, image courtesy of USGS Coastal and Marine Geology Program; 1.5–EdgeTechsubbottom profiler, image courtesy of EdgeTech Sonar Products; 2.1–GeometricsG-882 magnetometer, image courtesy of Geometrics; 2.3–laser line scan, imagecourtesy of NOAA Office of Ocean Exploration; 2.5–sediment profile camera deploy-ment, image courtesy of NOAA Coastal Services Center; 3.5–bathymetric LIDAR,image courtesy of Optech, Inc.; 4.2–piston corer, image courtesy of USGS Coastaland Marine Geology Program.
BOX 2.1 Continued
Copyright © National Academy of Sciences. All rights reserved.
A Geospatial Framework for the Coastal Zone: National Needs for Coastal Mapping and Chartinghttp://www.nap.edu/catalog/10947.html
COASTAL MAPPING NEEDS AND ACTIVITIES 45
instantaneous tidal levels to be predicted at locations where tide gaugesare not present. Unfortunately, these predictions are often very coarse andinaccurate and are complicated by local topography, wind, and waves.Finally, the process of making bathymetric measurements close to theshoreline is often difficult. As noted above, acoustic techniques for measur-ing depth are often inaccurate and inefficient in very shallow water, andoptical techniques (e.g., LIDAR) are often foiled by poor visibility in thesurf zone.
The ubiquitous need for defining the shoreline as a critical referencepoint for a range of jurisdictional, scientific, and management purposeshas led to the collection of shoreline data by many agencies using a varietyof techniques. Not all techniques take into consideration the effect of tides.For example, the shoreline delineated on USGS topographic maps isderived from stereo aerial photographs without reference to tidal (MHWor MLLW) datums. This results in the establishment of an instantaneousand static shoreline representing the time the aerial photograph was taken.Some states use similar methods but may delineate a shoreline using onlya single aerial photograph without rectification. The shoreline on mapsdeveloped by the Bureau of Land Management (BLM) is delineated bythe approximate seaward limit of land vegetation, as determined byobservation and surveying. The shorelines depicted on NOAA nauticalcharts are defined as the shorelines generated by the intersections betweenthe land and water surfaces of the MHW and MLLW datums. In practice,the shorelines are derived from stereo aerial photographs taken at timeswhen the water level reaches the estimated MHW and MLLW from long-term tide gauge station observations. The NOAA shoreline is the officialboundary line recognized by international agencies. EEZ boundaries aredefined as boundaries 200 nautical miles from the MLLW shoreline asdepicted on NOAA nautical charts.
Ecological and Land-Use Boundaries
Ecological and/or land-use descriptions and boundaries are neces-sary for effective resource management and coastal planning. At federaland regional levels, land-use boundaries and ecological boundaries in thecoastal zone—such as coral reef, wetland, and land-cover (vegetationtype) boundaries—are generally derived from LANDSAT satellite imageswith resolutions of 15 to 30 meters, or from aerial photographs. Similarly,wetland and Submerged Aquatic Vegetation (SAV) boundaries are derivedfrom satellite and aerial photographs. Watershed boundaries on mapsproduced by FEMA are created from aerial photographs and terrainmodels. State and local jurisdictions often employ more precise mappingwith field verification.
Copyright © National Academy of Sciences. All rights reserved.
A Geospatial Framework for the Coastal Zone: National Needs for Coastal Mapping and Chartinghttp://www.nap.edu/catalog/10947.html

46 A GEOSPATIAL FRAMEWORK FOR THE COASTAL ZONE
Administrative and Legal Boundaries
Administrative boundaries such as forest and park boundaries, refugeand preserve boundaries, marine sanctuary and marine protected areaboundaries, and oil and gas lease boundaries are often established basedon geographic coordinates. Such boundaries are determined based on avariety of fragmented and complex laws, regulations, programs, andspecial jurisdictions and by a variety of means. Cadastral boundaries aresurveyed using both old (surveying) and new technologies (GPS) withdifferent accuracies and often using different coordinate systems.
Often, different boundary definitions of maritime regions are requiredfor different applications. For instance, the MHW shoreline is importantfor FEMA, where catastrophic flooding is of concern, while the MLLWshoreline is required for producing charts that will ensure safe naviga-tion. In other cases the different definitions have no rationale other thanhistorical precedent.
The problems described above in delineating the shoreline and othercoastal boundaries are ubiquitous to all those who need spatial informa-tion in the coastal zone—it is a region that is difficult to map, and referencelines, reference frames, and reference points must be established that canbe easily updated and transferred among a range of users. Consequently,the user community needs improved means to collect data in the regionof the shoreline as well as the means to seamlessly integrate and trans-form data from disparate sources collected for different purposes.
Environmental and Living Resource Management
Human impacts on coastal ecosystems have expanded faster than therate of population growth. Increased stress resulting from development,waste disposal, and the lack of adequate planning and controls have allcontributed to the degradation, loss, and pollution of coastal wetlands,beaches, dunes, nearshore waters, and estuarine habitats. Information andmanagement tools for stressed coastal areas are needed for wise steward-ship and sustainable development. A fundamental requirement is anunderstanding of coastal habitats and ecosystems, their geographicextents, and the manner in which these habitats are changing throughboth natural and anthropogenic processes. The key to obtaining thisunderstanding is the collection of appropriate combinations of one-time“snapshots” and routine time-series measurements of a number of geo-spatial parameters.
Copyright © National Academy of Sciences. All rights reserved.
A Geospatial Framework for the Coastal Zone: National Needs for Coastal Mapping and Chartinghttp://www.nap.edu/catalog/10947.html
COASTAL MAPPING NEEDS AND ACTIVITIES 47
Living Resources and Coastal/Marine Habitats
Geospatial information is required for the management and sustain-able use of a broad range of economically important living resources thatprovide:
• Income from the harvesting of living resources (fisheries/aquaculture);• Habitats that support onshore and nearshore food webs;• Opportunities for recreational activities;• Biogeochemical functions such as buffering and recycling dis-
charges from land (mud flats, barrier islands, and salt marshes); and• Physical protection from storms (e.g., mangroves, coral reefs).
Maps showing the locations and extent of submerged and emergenthabitats are an essential requirement for coastal zone planning activities,so that resources can be properly allocated and development planned tominimize negative ecological impact. Habitat mapping—the descriptionof the physical and biological characteristics of an area—is an essentialfirst step toward development of effective protection strategies for endan-gered and threatened species. The need for coordinated, comprehensivehabitat mapping encompasses environments from the terrestrial to thedeep ocean:
• Terrestrial habitats (riparian areas, wetlands, and coastal uplands);• Shoreline and emergent habitats (beaches, dunes, marshes, and
mangroves);• Intertidal habitats, including areas of shellfish concentrations, sand
and mud flats, and wash zones;• Shallow marine and estuarine habitats requiring significant light
levels (shellfish beds, submerged aquatic vegetation, cold water corals,and coral reefs);
• Identification of essential fish habitat as required by the Magnuson-Stevens Fishery Conservation and Management Act; and
• Deep-water marine shelf habitats (hard-bottom substrates, deeper-water alga and corals, sand and mud deposits).
The basic source data required to characterize this range of habitatsinclude bathymetry and topography, submerged and emergent geology(including depositional environments and bottom characterization), cur-rents and tidal range, and the submerged and emergent ecology (includ-ing the types and distributions of organisms, biological diversity andhealth, and community structure). The synthesis, display, and utilizationof such diverse information components require basemaps that encom-
Copyright © National Academy of Sciences. All rights reserved.
A Geospatial Framework for the Coastal Zone: National Needs for Coastal Mapping and Chartinghttp://www.nap.edu/catalog/10947.html
48 A GEOSPATIAL FRAMEWORK FOR THE COASTAL ZONE
pass offshore and onshore regions and are continuous across local, state,or other jurisdictional boundaries.
Since the coastal zone can be subject to rapid changes, time-series datacollection at appropriate intervals is necessary. Datasets collected atintervals must be comparable and capable of being geographicallycoregistered. The specific habitat mapping requirements identified bythose agencies charged with assessing and mapping habitats and sensi-tive areas and by science and coastal manager users, as identified in theNOAA-CSC Coastal Resource Management Customer Survey, are listed inAppendix A.
An ultimate goal would be the establishment of a uniform habitatclassification system that could provide the basis for mapping livingresources in the coastal zone. The call for a national habitat classificationsystem is one of the recommendations of another NRC report (NRC, 2002),which noted that logical and consistent habitat classification would pro-vide the basis for evaluating the extent and significance of habitat distur-bance. While the complex issues of defining a uniform national habitatclassification scheme are beyond the scope of this report, collection of theframework and source geospatial data essential for such a system are not.
Sediments
Sediment movement in the coastal zone is often responsible forchanges in shoreline position (accretion or erosion), habitat distributionand quality, and bathymetry (deposition and erosion). Such changes arerelevant to human occupation of the coastal zone because they alter portsand navigation channels, change the patterns of hazardous coastal flood-ing, and impact the physical and biological character of coastal areas.Mapping sediment type and tracking sediment movement along thecoastal zone—including the mapping of shoals that impact economic com-merce—are important responsibilities of the federal government and stategovernments. Sediment management for the purpose of keeping shippinglanes open is a major task of the USACE.
Sediments also play a critical role with respect to living resources.Sediments moving across and through coastal ecosystems have thepotential to benefit or harm living communities. Most ecosystems in thecoastal zone rely, to some degree, on a natural substrate. Many speciesexperience substrate-dependent life stages, and their location and settle-ment on particular substrates are key to their reaching maturity andachieving reproductive success. Other species rely on substrate-specificfood sources. As depositional environments and sediment quality change,substrate characteristics are altered, potentially forcing changes in associ-ated ecosystems.
Copyright © National Academy of Sciences. All rights reserved.
A Geospatial Framework for the Coastal Zone: National Needs for Coastal Mapping and Chartinghttp://www.nap.edu/catalog/10947.html
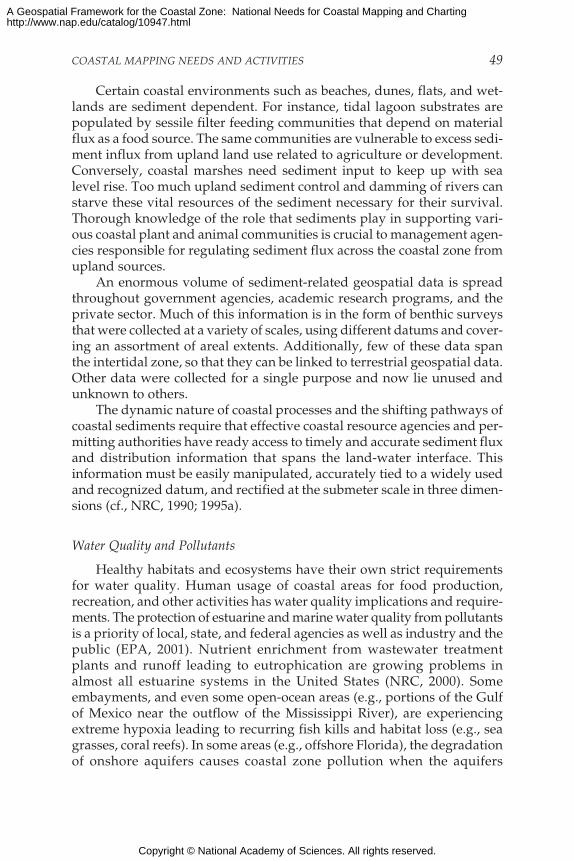
COASTAL MAPPING NEEDS AND ACTIVITIES 49
Certain coastal environments such as beaches, dunes, flats, and wet-lands are sediment dependent. For instance, tidal lagoon substrates arepopulated by sessile filter feeding communities that depend on materialflux as a food source. The same communities are vulnerable to excess sedi-ment influx from upland land use related to agriculture or development.Conversely, coastal marshes need sediment input to keep up with sealevel rise. Too much upland sediment control and damming of rivers canstarve these vital resources of the sediment necessary for their survival.Thorough knowledge of the role that sediments play in supporting vari-ous coastal plant and animal communities is crucial to management agen-cies responsible for regulating sediment flux across the coastal zone fromupland sources.
An enormous volume of sediment-related geospatial data is spreadthroughout government agencies, academic research programs, and theprivate sector. Much of this information is in the form of benthic surveysthat were collected at a variety of scales, using different datums and cover-ing an assortment of areal extents. Additionally, few of these data spanthe intertidal zone, so that they can be linked to terrestrial geospatial data.Other data were collected for a single purpose and now lie unused andunknown to others.
The dynamic nature of coastal processes and the shifting pathways ofcoastal sediments require that effective coastal resource agencies and per-mitting authorities have ready access to timely and accurate sediment fluxand distribution information that spans the land-water interface. Thisinformation must be easily manipulated, accurately tied to a widely usedand recognized datum, and rectified at the submeter scale in three dimen-sions (cf., NRC, 1990; 1995a).
Water Quality and Pollutants
Healthy habitats and ecosystems have their own strict requirementsfor water quality. Human usage of coastal areas for food production,recreation, and other activities has water quality implications and require-ments. The protection of estuarine and marine water quality from pollutantsis a priority of local, state, and federal agencies as well as industry and thepublic (EPA, 2001). Nutrient enrichment from wastewater treatmentplants and runoff leading to eutrophication are growing problems inalmost all estuarine systems in the United States (NRC, 2000). Someembayments, and even some open-ocean areas (e.g., portions of the Gulfof Mexico near the outflow of the Mississippi River), are experiencingextreme hypoxia leading to recurring fish kills and habitat loss (e.g., seagrasses, coral reefs). In some areas (e.g., offshore Florida), the degradationof onshore aquifers causes coastal zone pollution when the aquifers
Copyright © National Academy of Sciences. All rights reserved.
A Geospatial Framework for the Coastal Zone: National Needs for Coastal Mapping and Chartinghttp://www.nap.edu/catalog/10947.html

50 A GEOSPATIAL FRAMEWORK FOR THE COASTAL ZONE
discharge from offshore freshwater springs. Also of concern to coastalresource managers are the impacts of heavy metals (still discharged insmall quantities) on water quality, coastal zone habitats, and benthic andpelagic species.
Resource managers, regulators, and researchers monitor water qualityto assess the baseline condition of water bodies, identify impacts of coastaldischarges and developments, determine temporal and spatial variabilityof estuarine and open-ocean systems, and discover violations of waterquality standards. From baseline and time-series data, researchers alsodevelop models that can aid in predicting the potential impacts of contin-ued development or the effectiveness of proposed management measures.
In the interest of public health, many states (often with assistance fromlocal governments, beach associations, and environmental groups) moni-tor the water quality of swimming beaches during the swimming seasonand make the results available to the public. However, when it comes to amore comprehensive understanding of the status of their coastal waters,relatively few states have the resources to develop long-term comprehen-sive marine monitoring programs beyond what is required for the protec-tion of public health, National Pollutant Discharge Elimination System(NPDES) permits, or Environmental Protection Agency (EPA) 301 (3)(b)reporting requirements. EPA’s National Coastal Assessment Program issupporting state efforts to develop a national marine monitoring systemthat meets state-specific needs. This five-year program provides an oppor-tunity for states to design programs and synthesize data for public out-reach.
The development of ocean-observing arrays and in-situ buoys isexpanding our ability to access real-time water quality data in addition toother oceanographic parameters (e.g., Gulf of Maine Ocean ObservingSystem6). Managers are increasingly looking for ways to spatially depictwater quality data, both as management tools and to provide greater pub-lic access to the data (EPA, 2001). The multidimensional nature of waterquality data complicates the mapping of such data. Water quality data(e.g., dissolved oxygen, total suspended solids, fecal coliform, chlorophyllcontent) are typically plotted as a function of position and depth. An evengreater challenge is to depict water quality data as a function of time (i.e.,time-series plots). Because of the continuum of processes—from land-based sources to offshore sinks—water quality maps need to be continu-ous across the land-sea interface. Intuitive and standardized tools areneeded to integrate and display rich thematic water quality datasets. Oncewater quality data are digitized and tools are developed, managers can
6See http://www.gomoos.org/.
Copyright © National Academy of Sciences. All rights reserved.
A Geospatial Framework for the Coastal Zone: National Needs for Coastal Mapping and Chartinghttp://www.nap.edu/catalog/10947.html

COASTAL MAPPING NEEDS AND ACTIVITIES 51
overlay pollutant source data with habitat and other relevant source datalayers on a consistent mapping framework.
Coastal Hazards
Coasts are by nature dynamic, complex regions where a multitude ofnatural and man-made forces converge to produce change. To mitigatethe impacts of detrimental change and enhance the efficacy of beneficialchange, managers need to be able to understand the causes of suchchanges so that predictive tools and management strategies can be devel-oped. This section focuses on the impact of coastal hazards—occurrencesof detrimental natural change that threaten life, property, and humanactivities along the coast. A recent report (Heinz Center, 2002) noted thatthe rapid population growth and resulting increase in development alongthe coast during the past 50 years have resulted in greatly increasednatural hazard risk to 160 million Americans and more than $3 trillion incoastal property.
The importance of shoreline and coastal hazard issues to the user com-munity is clearly expressed in recent recommendations, made by the CSOto the U.S. Commission on Ocean Policy, that the USACE together withNOAA, FEMA, USGS, and other appropriate agencies should be taskedto “identify, compile, integrate and make available to the states data andinformation on shoreline change and processes, and work in conjunctionwith states and other local project sponsors to identify further informa-tion and data collection processes needed to fill the gaps in understand-ing a comprehensive approach to littoral system management” (CSO,2002; pp. 19-20). The CSO also recommended that the Commission onOcean Policy should “request that Congress appropriate additional fundsauthorized in section 215(c) of WRDA 99 for the National Shoreline Study[and] delineate erosion risks on flood insurance rate maps and incorpo-rate erosion risk into the rate structure of the National Flood InsuranceProgram” (CSO, 2002; p. 20).
Among the more important coastal hazards are coastal flooding, tsu-namis, sea level rise, shoreline erosion and accretion, and other geologicagents such as earthquakes and landslides:
Coastal Flooding
Coastal flooding is the greatest hazard faced by U.S. coastal commu-nities in terms of natural threats to life and property. Flooding may occuras a result of storm rainfall and runoff or by inundation from the sea as aresult of storm surge. In low-lying areas and along vulnerable coasts,storm-induced flooding may be exacerbated by high waves that accelerate
Copyright © National Academy of Sciences. All rights reserved.
A Geospatial Framework for the Coastal Zone: National Needs for Coastal Mapping and Chartinghttp://www.nap.edu/catalog/10947.html
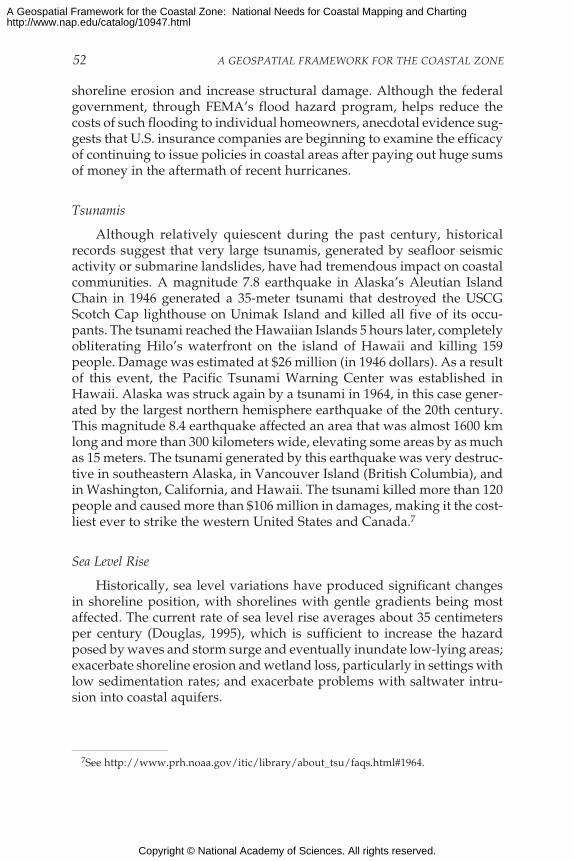
52 A GEOSPATIAL FRAMEWORK FOR THE COASTAL ZONE
shoreline erosion and increase structural damage. Although the federalgovernment, through FEMA’s flood hazard program, helps reduce thecosts of such flooding to individual homeowners, anecdotal evidence sug-gests that U.S. insurance companies are beginning to examine the efficacyof continuing to issue policies in coastal areas after paying out huge sumsof money in the aftermath of recent hurricanes.
Tsunamis
Although relatively quiescent during the past century, historicalrecords suggest that very large tsunamis, generated by seafloor seismicactivity or submarine landslides, have had tremendous impact on coastalcommunities. A magnitude 7.8 earthquake in Alaska’s Aleutian IslandChain in 1946 generated a 35-meter tsunami that destroyed the USCGScotch Cap lighthouse on Unimak Island and killed all five of its occu-pants. The tsunami reached the Hawaiian Islands 5 hours later, completelyobliterating Hilo’s waterfront on the island of Hawaii and killing 159people. Damage was estimated at $26 million (in 1946 dollars). As a resultof this event, the Pacific Tsunami Warning Center was established inHawaii. Alaska was struck again by a tsunami in 1964, in this case gener-ated by the largest northern hemisphere earthquake of the 20th century.This magnitude 8.4 earthquake affected an area that was almost 1600 kmlong and more than 300 kilometers wide, elevating some areas by as muchas 15 meters. The tsunami generated by this earthquake was very destruc-tive in southeastern Alaska, in Vancouver Island (British Columbia), andin Washington, California, and Hawaii. The tsunami killed more than 120people and caused more than $106 million in damages, making it the cost-liest ever to strike the western United States and Canada.7
Sea Level Rise
Historically, sea level variations have produced significant changesin shoreline position, with shorelines with gentle gradients being mostaffected. The current rate of sea level rise averages about 35 centimetersper century (Douglas, 1995), which is sufficient to increase the hazardposed by waves and storm surge and eventually inundate low-lying areas;exacerbate shoreline erosion and wetland loss, particularly in settings withlow sedimentation rates; and exacerbate problems with saltwater intru-sion into coastal aquifers.
7See http://www.prh.noaa.gov/itic/library/about_tsu/faqs.html#1964.
Copyright © National Academy of Sciences. All rights reserved.
A Geospatial Framework for the Coastal Zone: National Needs for Coastal Mapping and Chartinghttp://www.nap.edu/catalog/10947.html
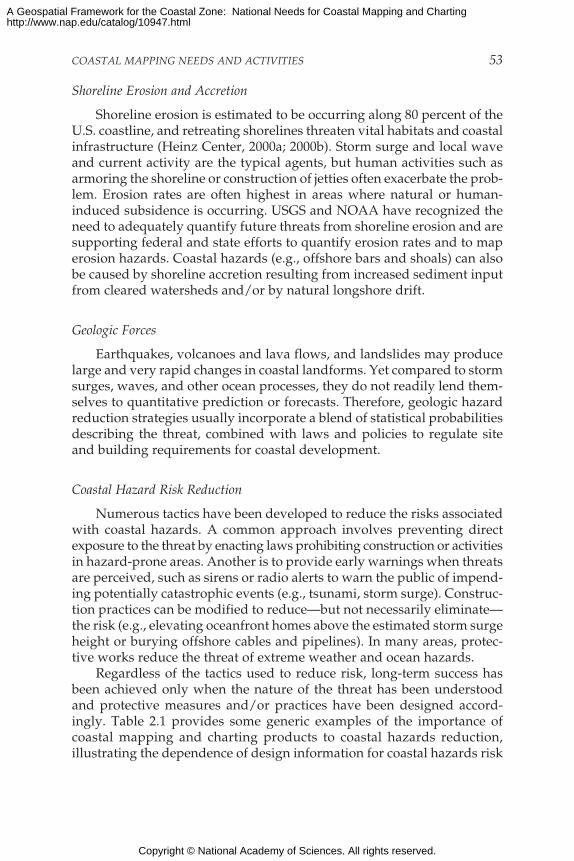
COASTAL MAPPING NEEDS AND ACTIVITIES 53
Shoreline Erosion and Accretion
Shoreline erosion is estimated to be occurring along 80 percent of theU.S. coastline, and retreating shorelines threaten vital habitats and coastalinfrastructure (Heinz Center, 2000a; 2000b). Storm surge and local waveand current activity are the typical agents, but human activities such asarmoring the shoreline or construction of jetties often exacerbate the prob-lem. Erosion rates are often highest in areas where natural or human-induced subsidence is occurring. USGS and NOAA have recognized theneed to adequately quantify future threats from shoreline erosion and aresupporting federal and state efforts to quantify erosion rates and to maperosion hazards. Coastal hazards (e.g., offshore bars and shoals) can alsobe caused by shoreline accretion resulting from increased sediment inputfrom cleared watersheds and/or by natural longshore drift.
Geologic Forces
Earthquakes, volcanoes and lava flows, and landslides may producelarge and very rapid changes in coastal landforms. Yet compared to stormsurges, waves, and other ocean processes, they do not readily lend them-selves to quantitative prediction or forecasts. Therefore, geologic hazardreduction strategies usually incorporate a blend of statistical probabilitiesdescribing the threat, combined with laws and policies to regulate siteand building requirements for coastal development.
Coastal Hazard Risk Reduction
Numerous tactics have been developed to reduce the risks associatedwith coastal hazards. A common approach involves preventing directexposure to the threat by enacting laws prohibiting construction or activitiesin hazard-prone areas. Another is to provide early warnings when threatsare perceived, such as sirens or radio alerts to warn the public of impend-ing potentially catastrophic events (e.g., tsunami, storm surge). Construc-tion practices can be modified to reduce—but not necessarily eliminate—the risk (e.g., elevating oceanfront homes above the estimated storm surgeheight or burying offshore cables and pipelines). In many areas, protec-tive works reduce the threat of extreme weather and ocean hazards.
Regardless of the tactics used to reduce risk, long-term success hasbeen achieved only when the nature of the threat has been understoodand protective measures and/or practices have been designed accord-ingly. Table 2.1 provides some generic examples of the importance ofcoastal mapping and charting products to coastal hazards reduction,illustrating the dependence of design information for coastal hazards risk
Copyright © National Academy of Sciences. All rights reserved.
A Geospatial Framework for the Coastal Zone: National Needs for Coastal Mapping and Chartinghttp://www.nap.edu/catalog/10947.html

54 A GEOSPATIAL FRAMEWORK FOR THE COASTAL ZONE
TABLE 2.1 Mapping/Charting Contributions to Coastal Hazard RiskReduction
Process, Model, and/orHazard Product Type Map or Chart Requirements
Coastal Flooding
Runoff and Flood hazard maps, flood Topographic maps, DEMsrainfall warnings, flood models
Storm surge Flood hazard maps, Blended bathymetric/topographicsurge models maps and DEMs/DDMs
Sea level Rise Inundation maps, Blended bathymetric/topographicrisk assessments maps and DEMs/DDMs
Waves
Wind waves Wave contributions to Blended nearshore bathymetric/storm surge, wave runup topographic maps andand wave setup DEMs/DDMs
Extreme wave vulnerability Blended nearshore bathymetric/assessment topographic maps and DEMs/DDMs
Tsunami Tsunami wave propagation, Blended offshore/nearshore/inundation maps, onshore bathymetric/topographicvulnerability assessment maps and geological maps
Shoreline Erosion and Accretion
Chronic Sea/lake-level rise impacts Repeated mapping to quantify rateon shoreline erosion and and distribution of changeaccretion, coastal changemodels
Sea/lake-level rise Blended nearshore bathymetric/vulnerability assessment topographic maps and DEM/DDMs,
habitat maps
Short-term Hurricane- and storm-induced Pre- and post-storm mapping toerosion and accretion quantify change
Storm vulnerability Blended nearshore bathymetric/assessment topographic maps and
DEMs/DDMs; habitat maps
Winds Topographic effects on High-resolution DEMsextreme winds, wind models,wind vulnerabilityassessments
Landslides Landslide vulnerability Blended bathymetric/topographicassessments maps and DEMs/DDMs
Volcanic Volcano/lava vulnerability Onshore/offshore volcanic activityActivity assessments distribution maps
Earthquakes Seismic vulnerability Onshore/offshore fault and seismicassessments activity maps
Copyright © National Academy of Sciences. All rights reserved.
A Geospatial Framework for the Coastal Zone: National Needs for Coastal Mapping and Chartinghttp://www.nap.edu/catalog/10947.html

COASTAL MAPPING NEEDS AND ACTIVITIES 55
reduction on several types of coastal mapping and charting products. Ofparticular note is the common need for seamless earth surface depictionsacross the land-water interface (i.e., blended bathymetric/topographicdigital elevation models and digital depth models—DEMs/DDMs). Thespecific mapping/charting needs identified by those agencies chargedwith assessing and/or reducing the risks and threats posed by coastalhazards are presented in Appendix A.
Minerals and Energy Management
The coastal zone is the repository of vast quantities of mineral, oil,and gas resources. In addition to the onshore fields located in the coastalzone, a significant percentage of the oil and natural gas produced in theUnited States (18 and 27 percent respectively; NOAA, 1998) comes fromthe federally controlled “Outer Continental Shelf”—that part of the conti-nental margin adjacent to the United States that is not under control of thecoastal state. Typically this is the area beyond 3 nautical miles from theshoreline but within the definition of the coastal zone used for this study.The percentage of oil and gas recovered from the offshore is expected torise significantly over the next few years and with it the revenue collectedby the federal government from oil and gas leases (NOAA, 1998). Theserevenues were between $3 billion and $4 billion in 1998, distributed to thegeneral treasury, the Land and Water Conservation Fund, and the NationalHeritage Fund. In addition to the revenue generated for the federalgovernment and the income generated by the private sector, the offshoreoil and gas industry provides approximately 170,000 jobs in the UnitedStates (NOAA, 1998).
More than 20,000 offshore oil and gas wells have been drilled in theUnited States, a number that is expected to increase in the coming years asthe offshore contains 15 and 19 percent of the nation’s proven oil and gasreserves, respectively, and is thought to contain more than 50 percent ofthe nation’s remaining undiscovered oil and gas reserves (NOAA, 1998).Although there are questions concerning economic viability, the coastalzone also has the potential for providing non-hydrocarbon energy sourcessuch as tidal, wave, and wind power; several wind power projects arecurrently under regulatory review along the northeast to mid-Atlanticcoast.
The coastal zone also contains vast deposits of sand and gravel, phos-phorites, heavy minerals, and other valuable resources such as gold,titanium, and diamonds. These deposits are typically transported to thecoastal zone by rivers and glaciers and then sorted by wave action. Sandand gravel together represent the largest mineral resource extracted fromthe coastal zone. They are used for beach replenishment, barrier island
Copyright © National Academy of Sciences. All rights reserved.
A Geospatial Framework for the Coastal Zone: National Needs for Coastal Mapping and Chartinghttp://www.nap.edu/catalog/10947.html
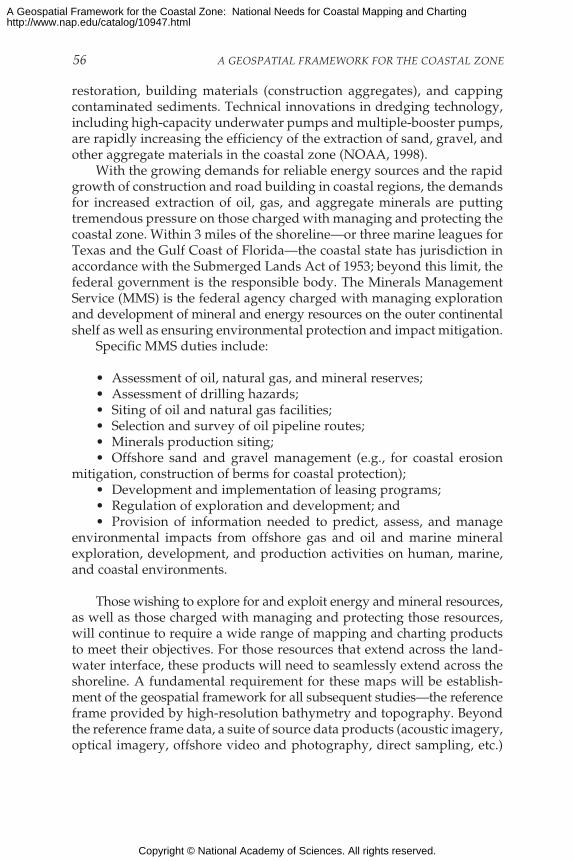
56 A GEOSPATIAL FRAMEWORK FOR THE COASTAL ZONE
restoration, building materials (construction aggregates), and cappingcontaminated sediments. Technical innovations in dredging technology,including high-capacity underwater pumps and multiple-booster pumps,are rapidly increasing the efficiency of the extraction of sand, gravel, andother aggregate materials in the coastal zone (NOAA, 1998).
With the growing demands for reliable energy sources and the rapidgrowth of construction and road building in coastal regions, the demandsfor increased extraction of oil, gas, and aggregate minerals are puttingtremendous pressure on those charged with managing and protecting thecoastal zone. Within 3 miles of the shoreline—or three marine leagues forTexas and the Gulf Coast of Florida—the coastal state has jurisdiction inaccordance with the Submerged Lands Act of 1953; beyond this limit, thefederal government is the responsible body. The Minerals ManagementService (MMS) is the federal agency charged with managing explorationand development of mineral and energy resources on the outer continentalshelf as well as ensuring environmental protection and impact mitigation.
Specific MMS duties include:
• Assessment of oil, natural gas, and mineral reserves;• Assessment of drilling hazards;• Siting of oil and natural gas facilities;• Selection and survey of oil pipeline routes;• Minerals production siting;• Offshore sand and gravel management (e.g., for coastal erosion
mitigation, construction of berms for coastal protection);• Development and implementation of leasing programs;• Regulation of exploration and development; and• Provision of information needed to predict, assess, and manage
environmental impacts from offshore gas and oil and marine mineralexploration, development, and production activities on human, marine,and coastal environments.
Those wishing to explore for and exploit energy and mineral resources,as well as those charged with managing and protecting those resources,will continue to require a wide range of mapping and charting productsto meet their objectives. For those resources that extend across the land-water interface, these products will need to seamlessly extend across theshoreline. A fundamental requirement for these maps will be establish-ment of the geospatial framework for all subsequent studies—the referenceframe provided by high-resolution bathymetry and topography. Beyondthe reference frame data, a suite of source data products (acoustic imagery,optical imagery, offshore video and photography, direct sampling, etc.)
Copyright © National Academy of Sciences. All rights reserved.
A Geospatial Framework for the Coastal Zone: National Needs for Coastal Mapping and Chartinghttp://www.nap.edu/catalog/10947.html

COASTAL MAPPING NEEDS AND ACTIVITIES 57
will provide the basic context needed to understand the distribution andviability of resources as well as the engineering constraints needed for thesiting of platforms, pipelines, and other structures.
In concert with studies aimed at identifying mineral and energyresources, baseline studies of local habitats will be required to understandthe impact of any potential resource extraction. Habitat studies have theirown set of mapping requirements (see above). Much work must also bedone in the areas of risk assessment and mitigation. Plans must be in placeto minimize and mitigate potential disruption of seafloor habitat andbenthic communities resulting from the discharge of chemicals, drillingmuds and cuttings, hydrocarbon emissions, and spills. Each of theserequires detailed maps that depict reference frame, source, and derivativedata.
Many resources are located below the seabed, and in these casessubbottom seismic profiling and other geophysical techniques (gravity,magnetics, resistivity, and heat flow) are used to better understand andmap the structure and distribution of subsurface features. These datasetswill also need to be integrated into the basic geospatial framework, add-ing a three-dimensional mapping component.
Given the breadth of needs associated with oil, gas, and mineralresource extraction in the coastal zone, the range of mapping productsrequired for exploration, exploitation, management, regulation, protec-tion, and mitigation involves almost every conceivable type and form ofmap or chart. The key to the successful balance of exploitation and envi-ronmental protection will be the availability for coastal managers of easilyaccessible and easily manageable data that can be seamlessly integratedand fused. Ensuring that such datasets are readily available is a funda-mental focus of this study.
Cultural Resources Management
Cultural resources along the nation’s coasts and offshore areas includecoastal and maritime parks, maritime preservation sites, underwater andcoastal archeological sites (including Native American middens, rock artsites, excavation sites), maritime national historic landmarks, and nationalmonuments (including lighthouses, life-saving stations, vessels, forts,submerged and coastal shipwrecks, and submerged historic docks andlaunches). Each of these is a valuable time capsule with the potential forrevealing important aspects of the nation’s past.
In order to better understand and preserve this aspect of the nation’sheritage, coastal zone managers require detailed maps and documenta-tion of cultural artifacts. Such documentation typically includes:
Copyright © National Academy of Sciences. All rights reserved.
A Geospatial Framework for the Coastal Zone: National Needs for Coastal Mapping and Chartinghttp://www.nap.edu/catalog/10947.html

58 A GEOSPATIAL FRAMEWORK FOR THE COASTAL ZONE
• Development of GIS-based, integrated cultural and naturalresource data to be used for survey, identification, inventory, evaluation,protection, and preservation of cultural resources;
• Development of management plans for preservation and recrea-tional use of coastal cultural resources; and
• Coordination among agencies and entities (e.g., state agencies,tribal nations, NOAA National Marine Sanctuary System, U.S. Navy,USCG, National Geographic Society) regarding submerged and coastalcultural resources throughout U.S. territories.
Many federal and state agencies have responsibilities for the manage-ment and protection of coastal cultural resources. Examples from amongthe federal agencies include the National Park Service, the NationalMarine Sanctuaries Program established by NOAA to protect importantsubmerged cultural resources and which publishes a shipwreck database,and the Federal Energy Regulatory Commission and USACE whichrequire offshore archeological surveys for pipeline and cable crossingsand consideration of the impact of dredging projects on cultural resources.At the state level, archeological investigations commonly occur in connec-tion with permitting activities as well as under the general purview ofhistorical commissions and state archeological offices. Whether on landor underwater, such investigations are often a two-tiered approach involv-ing a reconnaissance-level survey to determine the potential for signifi-cant finds, together with follow-up work, as necessary, to document thesite. While increased availability of coastal mapping products expandsour knowledge of underwater cultural resources, this availability alsoincreases the risk that archeological sites could be tampered with by sportdivers and treasure hunters. Data security related to cultural assets is amajor concern.
The important source data needed for the management and protec-tion of cultural resources in the coastal zone include:
• High-resolution bathymetry (both reconnaissance and site-specificDDMs);
• Coastal topography (high resolution DEMs);• Coastal configuration, including man-made historical infrastructure
(location and identification of wrecks, submerged docks, launches, etc.);• Remote sensing data, including acoustic imagery (seismic profil-
ing and sidescan sonar at both reconnaissance and site-specific scales) andmagnetometer surveys;
• Physical sampling (grabs, cores, etc.);• Underwater photographic and video imagery (site-specific) and
diver surveys;
Copyright © National Academy of Sciences. All rights reserved.
A Geospatial Framework for the Coastal Zone: National Needs for Coastal Mapping and Chartinghttp://www.nap.edu/catalog/10947.html

COASTAL MAPPING NEEDS AND ACTIVITIES 59
• Aerial and satellite imaging;• Shoreline delineation and reconstruction of old shorelines;• Soil and bottom sediment characteristics;• Marine boundaries to resolve jurisdictional issues; and• Written historical and descriptive data and original field notes.
From the above source data, products such as bathymetric and topo-graphic maps and charts, underwater and aerial photographs and mosaics,and archeological site and artifact illustrations can be produced and usedfor the identification, assessment, monitoring, and protection of coastalcultural resources.
MAPPING NEEDS BEYOND THE COASTAL ZONE
The focus of this study has been the coastal zone, defined by thecommittee and the FGDC to extend to the limits of the U.S. territorial sea(12 nautical miles). This, of course, is an arbitrary and artificial mappinglimit, as coastal and oceanographic processes are continuous offshore, andan emerging need for mapping well beyond the limit of the territorial seashould be acknowledged. One impetus is the need to document thegeospatial framework for the wealth of living and nonliving resourceswithin our nation’s EEZ (presently defined as 200 nautical miles from ourterritorial baseline—the official shoreline defined on NOAA charts). Withfishing as well as hydrocarbon and mineral exploration moving to deeperand deeper waters, we find a pressing need (some of it legislated forexample, by the Magnuson-Stevens Fishery Conservation Act) to betterunderstand deep-water processes and environments. It is also of criticalimportance to establish baselines so that we may better understand andcontrol the impacts of resource exploration and exploitation.
Contributing to this critical need for mapping is Article 76 of theUnited Nations Convention on the Law of the Sea (UNCLOS). Under thisarticle, coastal states may claim jurisdiction over “submerged extensionsof their continental margin beyond the recognized 200 nautical mile limitof their EEZ” (UN, 1983). The circumstances that define whether a coastalstate can extend its jurisdiction are based on a complex set of rules thatrequire an analysis of the depth and shape of the seafloor in areas of inter-est as well as an understanding of the thickness of underlying sediment.Consequently, full implementation of Article 76 requires the collection,assembly, and analysis of a body of relevant bathymetric, geologic, andgeophysical data. The United States has not yet acceded to the UNCLOS,but growing recognition that implementation of Article 76 could conferjurisdiction and management authority over large (and potentially resource-rich) areas of the seabed beyond our current 200 nautical mile limit has
Copyright © National Academy of Sciences. All rights reserved.
A Geospatial Framework for the Coastal Zone: National Needs for Coastal Mapping and Chartinghttp://www.nap.edu/catalog/10947.html

60 A GEOSPATIAL FRAMEWORK FOR THE COASTAL ZONE
renewed interest in the potential for a U.S. claim. In this context, there hasbeen congressionally mandated activity to evaluate the content and com-pleteness of the nation’s bathymetric and geophysical data holdings inareas surrounding the nation’s EEZ, with emphasis on ensuring their use-fulness for substantiating the extension of resource or other national juris-dictions beyond the present 200 nautical mile limit (Mayer et al., 2002;Jakobsson et al., 2003). Congress has also recently funded the first year ofdata collection programs in support of a potential claim under Article 76.
It is the belief of this committee that the strategies and mechanismsestablished for coastal zone mapping, particularly in terms of survey reg-istration, database development, data standards, and data distribution(see below), will be equally applicable to deeper-water mapping efforts.Applying these mechanisms and protocols to EEZ mapping will ensurethat the deeper-water datasets will seamlessly merge with those collectedin the nearshore region.
SUMMARY
There is an immense and substantiated need for geospatial data in thecoastal zone to fulfill a wide variety of uses and applications. At least15 federal agencies, state and local governments, the private sector,academia, and the general public are actively involved in the collection,processing, or dissemination of coastal zone data and/or products. Thechallenge facing the committee has been to evaluate the large volume ofinformation provided and to determine whether there are gaps betweenthe needs for geospatial data and the activities of those acquiring andprocessing data in the coastal zone (i.e., “unfulfilled needs”); to determinewhether there are redundancies in effort, and to establish where and howefficiencies may be gained so that unfulfilled needs can be more effec-tively addressed.
Appendix A, and the expanded description presented in the com-mittee’s interim report, formed the basis for the analysis presented in thischapter by summarizing federal agency needs and activities on an agency-by-agency basis. As Appendix A illustrates, the scope of the identifiedneeds and activities is extremely complex and far-reaching; however, thecommittee’s review of users’ needs and the available information describ-ing activities has revealed several cross-cutting issues related to unful-filled needs. These issues reflect broad-based requirements for better dataacquisition (both quality and quantity of data) and for a better and moreefficient infrastructure to support and encourage cooperative collection,compilation, integration, processing, and dissemination of information.These cross-cutting issues highlight the following needs for:
Copyright © National Academy of Sciences. All rights reserved.
A Geospatial Framework for the Coastal Zone: National Needs for Coastal Mapping and Chartinghttp://www.nap.edu/catalog/10947.html

COASTAL MAPPING NEEDS AND ACTIVITIES 61
• A consistent spatial framework for coastal data that allows a seam-less transition from onshore to offshore, including clarification of offshoreboundary definitions, a consistent geodetic framework for shoreline defi-nitions, and easy transformation between various horizontal and verticaldatums;
• More and better (timely and accurate) primary source data, includ-ing high-resolution topography and shallow-water bathymetry; tide andcurrent information; comprehensive imagery coverage; systematic andstandardized bottom and habitat characterization; and human-use, land-cover, land-use, and coastal change data;
• Consistent data, metadata, and mapping standards as well as ameans to evaluate the accuracy of geospatial data;
• Timely and straightforward access to the existing body of coastal data;• Increased inter- and intra-agency communication, cooperation, and
coordination; and• Enhanced ability to interpret and apply spatial data and tools for
decision making.
The review of agency activities also indicated apparent overlaps in thecollection and processing of coastal zone geospatial data. In some cases theseproved to be only “apparent” overlaps, in that some agencies had similartitles for activities that on the surface appeared to be the same but in actual-ity are not (e.g., the NOAA-CSC Community Vulnerability Assessment Toolused by FEMA and EPA’s Vulnerability Self Assessment Tool, which despitetheir similar names have completely different functions). In other cases,overlaps clearly do exist and must be addressed (e.g., redundancies ofeffort involving the acquisition of shoreline and habitat mapping data).
As the committee explored the intersection of needs and activities, theemphasis remained focused on efficiently establishing the fundamentalinformation and tools necessary to fulfill the nation’s appropriate role incoastal zone mapping and charting. In the following chapter, the presentinability to seamlessly combine onshore and offshore data, compare dif-ferently defined shorelines, and integrate and exchange existing and newcoastal zone maps are described. The quantity and quality of coastal dataare addressed in Chapter 4, with particular emphasis on the referenceframe data (bathymetry and topography) that establish the fundamentalgeospatial framework for all other measurements. Chapter 5 addressesissues of timely and efficient access to these data. Chapter 6 identifiesseveral areas where efficiencies can be gained by better coordination andcollaboration and offers specific suggestions for improving interagencycommunication and collaboration. The strategies and recommendationsassociated with these issues collectively define our approach to fulfillingthe vision outlined in Chapter 1.
Copyright © National Academy of Sciences. All rights reserved.
A Geospatial Framework for the Coastal Zone: National Needs for Coastal Mapping and Chartinghttp://www.nap.edu/catalog/10947.html

62
3
A Common Coastal ZoneReference Frame:
The Seamless Coastal Map andConsistent Shoreline
Working in the coastal zone presents a special challenge, ascoastal processes are dynamic and often continuous across theland-sea interface, whereas the maps and charts that are used
have historically been collected in either one realm or the other. Differ-ences among agency missions and onshore versus offshore topographicand bathymetric mapping techniques, different vertical reference framesused for each of these products, and the inherent difficulty of collectingsource data in the surf and intertidal zones have combined to produce afundamental incompatibility between onshore maps and offshore charts.Yet as seen in the preceding chapter, seamless geospatial datasets acrossthe land-water interface are needed by almost all users wrestling withissues of navigation, resource management, planning, hazard delineationand mitigation, environmental studies, and regulation issues. Often undercontractual pressure, the problem of creating a seamless product is fre-quently solved by ignoring—through data blending and large-scale spatialaveraging—datum transformation issues and the unmapped intertidalregion. In so doing, what had originally been carefully positioned geo-spatial data becomes geospatially error-ridden in the interest of productdelivery. An additionally troublesome feature of this approach is that notrue database is generated—the product is one of a kind and cannot serveas an accurate base for additional studies. Furthermore, the geospatiallycompromised product is often exported to downstream users withouttheir awareness of the inherent geospatial errors and uncertainties.
These error-ridden products may go on to be applied in inappropriateways. For instance, modeling studies of marine hazards such as tsunami
Copyright © National Academy of Sciences. All rights reserved.
A Geospatial Framework for the Coastal Zone: National Needs for Coastal Mapping and Chartinghttp://www.nap.edu/catalog/10947.html

A COMMON COASTAL ZONE REFERENCE FRAME 63
inundation, high-wave flooding, and storm surge flooding rely on inte-grated depth and elevation data. Such modeling exercises are often basedon geospatial data that have positional uncertainties of tens of meters, inaddition to the model prediction uncertainties of tens of meters. The finalproduct, with its partially undetected errors as well as uncertainties ofmany tens of meters in horizontal space and several meters in verticalspace, may be used by authorities for hazard management and mitigation(e.g., the identification of evacuation routes). There is enormous potentialfor catastrophe if vehicles are directed to use a flood-prone evacuationroute that was selected because of faulty elevation data input to a stormsurge model.
As discussed in Chapter 2, an additional critical information elementfor a wide variety of public and private entities is the shoreline position.Although depicted as a fixed line on maps and charts, shorelines aredynamic features that present unique challenges to coastal managers. Thediminishing amount of land area available for development and the over-whelming importance of shorelines as economic, cultural, environmental,and recreational resources place a premium on understanding shorelinedynamics and mapping the characteristics of shoreline change.
Few state, local, or private organizations make their own maps andcharts and thus must extract shoreline information from either U.S. Geo-logical Survey (USGS) topographic maps or National Oceanic and Atmo-spheric Administration (NOAA) nautical charts. In a great many cases thejurisdictional needs of state and local agencies are not represented by theboundaries provided on these federal maps, and the maps themselvesleave the zone between Mean Sea Level (MSL; as delineated by the USGSshoreline) and Mean High Water (MHW) or Mean Lower Low Water(MLLW; as delineated by the NOAA shoreline) unmapped because of thegap between USGS maps and NOAA charts. As a result, state and localneeds are often left unfulfilled. Even worse, errors are frequently promul-gated through imprecise attempts to rectify this situation. The problem ofconsistent shoreline definition applies equally to the Great Lakes coast-line. In a funding environment where coastal zone management funds areallocated on the basis of shoreline length, equity among the states requiresthat a consistent set of definitions and procedures be applied.
The lack of accurate maps and charts that seamlessly cross the land-sea interface creates a serious obstacle for the coastal zone managers ofour nation. These managers need precise, accurate, and timely data andproducts that are easily accessible and usable for a wide variety of appli-cations. A remedy for this situation, and the committee’s vision for thefuture, is the development of a seamless transformation framework that isavailable through a single digital portal that offers data, maps and charts,and tools as well as the ability to translate rapidly from one jurisdictional
Copyright © National Academy of Sciences. All rights reserved.
A Geospatial Framework for the Coastal Zone: National Needs for Coastal Mapping and Chartinghttp://www.nap.edu/catalog/10947.html

64 A GEOSPATIAL FRAMEWORK FOR THE COASTAL ZONE
shoreline to another. Such a portal would be constantly updated withtimely datasets and would offer transformations to all major international,federal, state, and local shoreline needs coupled with tailored map pro-duction. In the following sections the impediments to fulfilling this visionof a seamless coastal geospatial product and possible strategies to over-come these impediments are described in more detail.
THE NEED FOR A COMMON FRAMEWORK
The most critical technical barrier to completing the vision of a seam-less coastal map is the lack of a common reference framework that wouldallow cartographers and coastal zone data managers to weave togethertopographic datasets (e.g., USGS Digital Elevation Models [DEMs]) andbathymetric datasets (e.g., NOAA’s hydrographic survey data) in a waythat is faithful to cadastral, geodetic, and cartographic standards. Thisdeficiency arises for a number of reasons primarily related to differencesin the projections, scale, and horizontal and vertical datums. While prob-lems with horizontal datums, scales, and projections can be resolved withwell-documented digital data and existing tools, resolving vertical datumdiscrepancies is a much more difficult task.
All geospatial datasets must be referenced to some kind of a verticaldatum. Unfortunately, there is no consistent level that is used for this ref-erence. This is due to both historical technical limitations (inaccuracies inlocating points in a pre-global positioning system [GPS] world) and alsobecause of the different protocols and datums used to produce onshoremaps and offshore charts. For instance, USGS DEMs are horizontallyreferenced to the North American Datum 1983 (NAD83) and verticallyreferenced to an orthometric datum that approximates MSL (defined bythe North American Vertical Datum 1988—NAVD88). Older USGS mapproducts used an earlier vertical reference—NAVD29. However, theshoreline depicted on USGS map products does not represent the posi-tion where these datums intersect the earth’s surface but instead is theopportunistic instantaneous waterline captured in aerial photographsused in making the map. NOAA nautical charts are also horizontallyreferenced to NAD83, but all soundings are referenced to contemporaneouslocal MLLW—the average of the lower low water height of each tidal daytaken over the National Tidal Data Epoch. NOAA charts depict bothMHW and MLLW as two shorelines located using tide-controlled aerialphotography. Neither of these shorelines corresponds to the MSL shore-line of the land-based USGS topographic maps.
A map producer will encounter additional inconsistencies in datumdelineation when integrating modern and historical data for the purposeof delineating environmental and cultural changes through time. For
Copyright © National Academy of Sciences. All rights reserved.
A Geospatial Framework for the Coastal Zone: National Needs for Coastal Mapping and Chartinghttp://www.nap.edu/catalog/10947.html

A COMMON COASTAL ZONE REFERENCE FRAME 65
instance, the USGS National Shoreline Assessment project (as well asseveral state-sponsored projects) attempts to incorporate historical NOAAtopographic maps (“T-sheets”) with modern orthorectified aerial photo-graphs, as well as topographic and bathymetric Light Detection andRanging (LIDAR) data. Historical T-sheets from the pre-World War II erawere referenced by surveyors of the time to the local high-water mark, asdelimited by debris and other indicators along the shoreline. There aresubstantial uncertainties associated with how these historical local levelscorrelate to modern MHW, given the influence of subsequent sea-levelchanges, land-level changes, seasonal wave conditions, and thermal changesin water level since the time of these past surveys, together with changesin shoreline position due to sediment flux. It is widely misunderstoodthat the older historical T-sheets present MHW when in fact they simplypresent a high-water mark on the shoreline. Further, modern NOAAnautical charts present a line that is identified as the position of MHW. Inreality the line is the drafted waterline from aerial photography flown atthe approximate time of MHW (as predicted by a model). This line differsfrom the true position of MHW due to the influence of wind and waveset-up (or set-down), which is capable of changing sea-level position by ameter or more. Finally, the position of any given water level (e.g., MLLW)constantly moves along the shoreline in response to the migration of thetide wave as it responds to gravity and friction. A cartographer taskedwith integrating bathymetric data with topographic data must know theinstantaneous position of that wave (the water level) at closely spacedpositions along the mapped area to properly correct geospatial data. Thisrequires a numerical model that predicts the position of the tide levelthrough the highly crenulated bays and promontories of the U.S. shoreline.
The problem of vertical datums is confounded by the fact thatmultiple agencies at many levels of government (federal, state, and local),researchers, and the private sector also use different horizontal datums,different scales, and different projections. If only paper products are pro-duced, there is little opportunity to transform and thus seamlessly inte-grate these individual products. However, if data are digital and welldocumented, tools currently exist to correct and transform differences inresolution, horizontal datum, scale, and projection (e.g., Figure 3.1).Unfortunately, we do not yet have the infrastructure in place to ensurethat data are collected in such a form. Thus, along with the difficulties inproducing mapping products that are continuous across the shoreline,there are also inconsistencies in producing mapping products that are con-tinuous along the shoreline, particularly where such products cross juris-dictional boundaries.
With these unresolved differences or discrepancies in vertical datumsassociated with onshore versus offshore data, it is not possible to generate
Copyright © National Academy of Sciences. All rights reserved.
A Geospatial Framework for the Coastal Zone: National Needs for Coastal Mapping and Chartinghttp://www.nap.edu/catalog/10947.html
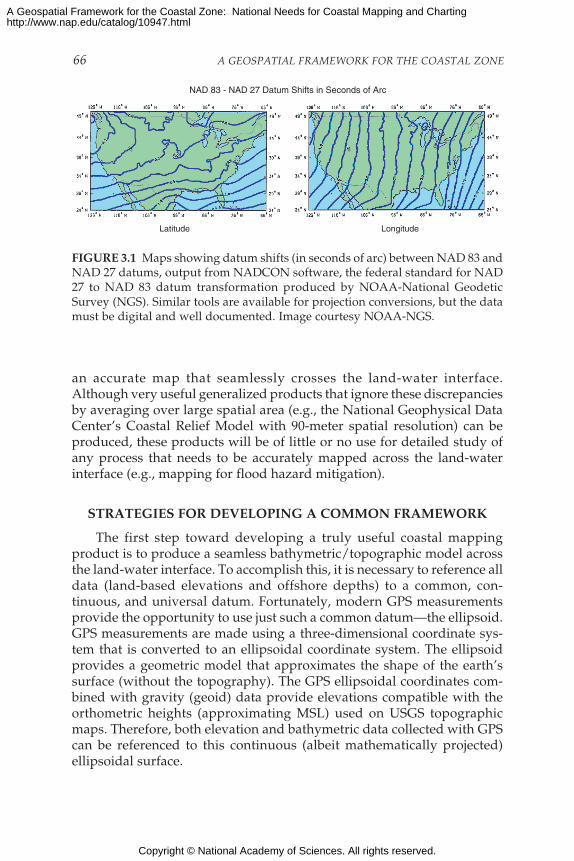
66 A GEOSPATIAL FRAMEWORK FOR THE COASTAL ZONE
FIGURE 3.1 Maps showing datum shifts (in seconds of arc) between NAD 83 andNAD 27 datums, output from NADCON software, the federal standard for NAD27 to NAD 83 datum transformation produced by NOAA-National GeodeticSurvey (NGS). Similar tools are available for projection conversions, but the datamust be digital and well documented. Image courtesy NOAA-NGS.
NAD 83 - NAD 27 Datum Shifts in Seconds of Arc
Latitude Longitude
an accurate map that seamlessly crosses the land-water interface.Although very useful generalized products that ignore these discrepanciesby averaging over large spatial area (e.g., the National Geophysical DataCenter’s Coastal Relief Model with 90-meter spatial resolution) can beproduced, these products will be of little or no use for detailed study ofany process that needs to be accurately mapped across the land-waterinterface (e.g., mapping for flood hazard mitigation).
STRATEGIES FOR DEVELOPING A COMMON FRAMEWORK
The first step toward developing a truly useful coastal mappingproduct is to produce a seamless bathymetric/topographic model acrossthe land-water interface. To accomplish this, it is necessary to reference alldata (land-based elevations and offshore depths) to a common, con-tinuous, and universal datum. Fortunately, modern GPS measurementsprovide the opportunity to use just such a common datum—the ellipsoid.GPS measurements are made using a three-dimensional coordinate sys-tem that is converted to an ellipsoidal coordinate system. The ellipsoidprovides a geometric model that approximates the shape of the earth’ssurface (without the topography). The GPS ellipsoidal coordinates com-bined with gravity (geoid) data provide elevations compatible with theorthometric heights (approximating MSL) used on USGS topographicmaps. Therefore, both elevation and bathymetric data collected with GPScan be referenced to this continuous (albeit mathematically projected)ellipsoidal surface.
Copyright © National Academy of Sciences. All rights reserved.
A Geospatial Framework for the Coastal Zone: National Needs for Coastal Mapping and Chartinghttp://www.nap.edu/catalog/10947.html

A COMMON COASTAL ZONE REFERENCE FRAME 67
While elevations and depths can both be referenced to the ellipsoiddatum, there will always be a need to present data with respect to themore traditional tidal or orthometric datums. Nautical charts, for example,must always be referenced to a tidal datum to ensure that a mariner willknow the depth of water with respect to the real water level (and thusavoid running aground). To assist safe navigation, NOAA uses MLLWbecause it is a very conservative estimate of the water level. Topographicmaps are typically referenced to an orthometric datum because it approxi-mates MSL. The key to producing a seamless dataset across the coastalzone, however, is to understand the differences between the referencesurfaces used to make the measurements (i.e., the differences between theellipsoid and real terrain, between the ellipsoid and the geoid, betweenthe ellipsoid and MLLW, etc.). These differences are expressed as “separa-tion” or “difference” models, and with detailed knowledge of thesemodels, conversions can be made among the various reference frames toproduce a seamless dataset—a Coastal Terrain Model (CTM) across thecoastal zone (see Figure 3.2).
Vertical information collected on land is measured from fixed plat-forms or from airborne or spaceborne platforms whose elevations can bevery precisely determined in a fixed reference system. Bathymetric data,on the other hand, present a more difficult problem because they havehistorically been collected shipboard on a surface that constantly changeswith the tide. True vertical reference frames for bathymetric data existonly at a few discrete points where water-level gauges have preciselydefined a datum like MLLW (and thus where a difference or separationmodel exists). In order to extend (spatially integrate) the vertical referenceframe established at the discrete points where MLLW has been accuratelymeasured by tide gauges, sophisticated hydrodynamic models are needed.
Development of the CTM thus requires vertical datum integration,supported by appropriate tide gauge stations and meteorological obser-vations, together with tools for hydrodynamic modeling. Since the depthsare defined based on the MLLW level, long-term observations of watergauge stations are needed to determine the MLLW, and GPS surveys arethen required to transform the MLLW to the orthometric datum. Conse-quently, the depth information can be referenced to the orthometricdatum, and the topographic and bathymetric data can be integrated intoone unique CTM. Once a continuous CTM is available, the hydrodynamicmodel can be used as a tool to produce water datum surfaces of MHW,MLLW, or any other mean water levels required by the various users. Theintersection of the CTM and a water datum surface will generate a digitalshoreline defined to that water datum. Thus, in order to generate a shore-line of a particular definition (e.g., MHW), the MHW surface needs to beoutput by the model and the MHW shoreline can then be produced as the
Copyright © National Academy of Sciences. All rights reserved.
A Geospatial Framework for the Coastal Zone: National Needs for Coastal Mapping and Chartinghttp://www.nap.edu/catalog/10947.html

68 A GEOSPATIAL FRAMEWORK FOR THE COASTAL ZONE
FIGURE 3.2 Coastal reference systems and observations, illustrating the compo-nents of onshore elevation (e.g., Point P) and offshore bathymetric (e.g., Point Q)data. Based on Li et al. (2003).
Sea Floor
Point Q
Depth
MLLW
MHW
IntertidalZone
Digital Depth Model (DDM)Digital Elevation Model (DEM)
Coastal Terrain Model (CTM)
Ellipsoid - NAD83
Geoid - NAVD88
Point P
Gauge Station(GPS/Water Level)
EllipsoidElevation
(GPS)
OrthometricElevation
Geoid Height
intersection line of the CTM and the MHW surface. Therefore, thisapproach provides a means to digitally produce any datum-defined shore-line and to transform between shorelines with differing definitions.
The development of a hydrodynamic tidal model also allows thetransformation of historical datasets to a common ellipsoidal datum.NOAA, USGS, and other partners have undertaken a pilot project inTampa Bay, Florida, that has demonstrated both the complexity and thefeasibility of generating a seamless bathymetric/topographic dataset (see
Copyright © National Academy of Sciences. All rights reserved.
A Geospatial Framework for the Coastal Zone: National Needs for Coastal Mapping and Chartinghttp://www.nap.edu/catalog/10947.html
A COMMON COASTAL ZONE REFERENCE FRAME 69
Box 3.1). This project required the establishment of a fully calibratedhydrodynamic model for Tampa Bay and the development of a verticaldatum transformation tool (Vdatum) that allows the easy transformationof elevations among as many as 26 orthometric, three-dimensional, or tidaldatums. This pilot project has proven very successful and provides a clearindication of an optimum mechanism for producing seamless coastalcharting products.
IMPLEMENTATION OF A COMMON NATIONAL FRAMEWORK
The Tampa Bay Bathy/Topo/Shoreline Demonstration Project dem-onstrated that, although complex, it is possible to establish a seamlesscoastal framework. The project has also demonstrated the value of inter-agency collaboration. The next step is to establish a national frameworkthat provides a seamless bathymetric/topographic dataset for all U.S.coastal regions. Although horizontal datum issues can be readily resolvedwith existing transformation tools, vertical datum issues present the mostserious challenge to this effort. To resolve the vertical datum issues, aproject to apply Vdatum tools on a national scale is needed, involving thecollection of real-time tide data and the development of more sophisti-cated hydrodynamic models for the entire U.S. coast, as well as the estab-lishment of protocols and tools for merging bathymetric and topographicdatasets. The resulting dataset must be documented and disseminated insuch a way that it can become the basemap for a wide range of applica-tions, including the definition of local, regional, or national shorelines.
Based on presentations and information provided by NOAA-NGS, anational Vdatum project would require an initial five-year effort to expandthe current tidal modeling efforts to include all geographic areas of theU.S. coast. This would involve the development of numerical tidal models1
that in some areas would require the installation of additional tide gauges.Modeling results would be available to users on an area-specific basisthrough a Web-accessible database. This database could be linked to thesingle Web-based coastal geospatial data portal described below (seeChapter 5).
A national Vdatum Web site, linked to a national coastal zone map-ping portal, would ensure that the full suite of Vdatum (and other) trans-formation tools would be easily available to the user community as wellas ensure that data standards and acquisition details would be fully
1The estimated cost would be approximately $2 million for the first year and $1.5 millionfor years 2 to 5. After the fifth year, the system could be maintained and updated for anannual cost of less than $1 million.
Copyright © National Academy of Sciences. All rights reserved.
A Geospatial Framework for the Coastal Zone: National Needs for Coastal Mapping and Chartinghttp://www.nap.edu/catalog/10947.html
70 A GEOSPATIAL FRAMEWORK FOR THE COASTAL ZONE
BOX 3.1NOAA-USGS Tampa Bay Bathy/Topo/Shoreline
Demonstration Project
In this joint demonstration project for the Tampa Bay region, NOAA’sNational Ocean Service (NOS) and the USGS’s Geography Discipline (for-merly the National Mapping Division) blended their bathymetric and topo-graphic datasets into a DEM with all data initially referenced to the ellip-soid. A fully calibrated hydrodynamic model of Tampa Bay was used todetermine the geographic distribution of tidal datums, and the Vdatum toolwas used to transform all bathymetric data from the MLLW datum to theellipsoid (Parker et al., 2001). Recent high-resolution third-party bathymet-ric and topographic data are being incorporated into the DEM. An up-to-date high-resolution shoreline is being developed using data from variousairborne and satellite remote sensing sources. The DEM, shoreline, andadditional data layers will ultimately be available from a Web-accessibledatabase and on CD-ROM. The Web-accessible bathy/topo DEM and ac-companying shorelines will not only solve the problem of inconsistencybetween NOAA and USGS products that has caused difficulty for coastalmanagers but will also provide a standard DEM (or framework) on to whichothers can append their bathymetric, topographic, or other data and willallow detailed modeling of storm-surge or sea-level rise effects. This is thefirst step toward the development of a mutually agreed upon “nationalshoreline.” It is also an excellent example of interagency collaboration andcooperation and a clear indicator of a viable approach to addressing theissue of a seamless vertical datum for the coastal zone. For NOAA andUSGS it represents the beginning of a new way of doing business with eachother that will reduce duplication of effort and better meet the needs ofstate and local agencies.
described with metadata. Once established, the national framework wouldneed to be maintained and regularly updated. Again, a Web portal is thekey to the dissemination and timeliness of information. In addition to themodeling efforts associated with a national framework for seamlesscoastal data integration, there would be the need to collect additionalcoastal zone framework data (topography, bathymetry, and tidal infor-mation), particularly in the very shallow region at the land-water inter-face. Such an expanded mapping effort is discussed in Chapter 4.
Copyright © National Academy of Sciences. All rights reserved.
A Geospatial Framework for the Coastal Zone: National Needs for Coastal Mapping and Chartinghttp://www.nap.edu/catalog/10947.html

A COMMON COASTAL ZONE REFERENCE FRAME 71
WHERE AND WHAT IS THE SHORELINE—IS A NATIONAL SHORELINE NEEDED?
Inextricably linked to the establishment of a national framework forseamless coastal mapping products is the issue of a national shoreline. Asthe fundamental boundary for so many applications and studies, the lackof a consistently defined shoreline has frustrated coastal zone managers,planners, and scientists for many years. Since shoreline definitions typi-cally relate to a water level, the shoreline is dynamic, changing over
Three-dimensional model of seamless dataset produced by Tampa BayBathy/Topo/Shoreline Demonstration Project with high stand of sea levelsuperimposed. Image courtesy of the Center for Coastal and Ocean Map-ping, University of New Hampshire.
Copyright © National Academy of Sciences. All rights reserved.
A Geospatial Framework for the Coastal Zone: National Needs for Coastal Mapping and Chartinghttp://www.nap.edu/catalog/10947.html
72 A GEOSPATIAL FRAMEWORK FOR THE COASTAL ZONE
various temporal and spatial scales. As noted earlier, the shoreline is not adeterministic physical line but rather a conceptual line defined on a statis-tical basis over a finite time. The long-term accuracy and consistency ofshoreline maps cannot be assured, in part because they are subject toceaseless natural and man-made processes that continually alter theshoreline’s shape and character. Modernization of the nation’s definitionand depiction of the shoreline through development and application ofstate-of-the-art geospatial mapping techniques is urgently needed toaddress a wide variety of management, policy, and legal issues on local,national, and international scales.
Although a public law passed by Congress in 1998 provides explicitauthority for NOAA to promulgate national standards for all informationacquired for nautical charting purposes, including shoreline delineation,several different shoreline definitions are in use by various federal, state,and local authorities to meet non-navigational needs. A single nationallyaccepted and consistent U.S. shoreline does not exist, and the use ofinconsistent shoreline definitions between maps, charts, GIS outputs, andother products leads to user confusion and ill-informed decision making.Another reason for this lack of consistency appears to be the significantoverlap in federal efforts to acquire coastal shoreline data and in the sub-sequent generation of derived products, such as shoreline erosion andaccretion maps. This issue is important enough that it will be discussedseparately in Chapter 6.
As discussed in Chapter 2 and illustrated in Figure 2.1, the U.S. coastalzone encompasses a bewildering array of shoreline designations and defi-nitions. The management and regulatory environment includes the dif-ferent concepts of the USGS topographic maps and NOAA charts with aMHW shoreline that is actually a waterline photographed at high tide,leading to the situation where the boundary between private lands andstate jurisdiction is defined as Mean Higher High Water (or a proxy) insome cases, MHW in others, and MLLW in still others. And as notedearlier, the Bureau of Land Management (BLM) defines the shoreline asthe approximate seaward limit of land vegetation. The use of inconsistentshoreline definitions between maps, charts, GISs, and other sources leavesall but the most knowledgeable scratching their collective heads.
Such differences in definitions and boundaries not only result inconfusing map products (with different agencies producing maps withdifferent positions of the shoreline) but also can have serious legal andfinancial ramifications. A striking example of this is The Dinkum SandsCase (Reed, 2000), where the state of Alaska claimed that a sand body offthe northern coast of Alaska was an island and thus constituted a baselinefrom which to calculate a 3-mile state boundary. This baseline extendedthe area under which the state was allowed to grant oil and gas leases
Copyright © National Academy of Sciences. All rights reserved.
A Geospatial Framework for the Coastal Zone: National Needs for Coastal Mapping and Chartinghttp://www.nap.edu/catalog/10947.html

A COMMON COASTAL ZONE REFERENCE FRAME 73
under the Submerged Lands Act. The federal government claimed thatthe sand body was not an island and that consequently the area was underfederal jurisdiction. After 17 years of litigation the U.S. Supreme Courtruled in favor of the federal government, denying Alaska the rights toapproximately $1.6 billion in oil and gas revenues.
Differences in shoreline definition can also lead to unnecessary dupli-cation of data acquisition efforts (typically the most expensive aspect ofcoastal mapping), with individual agencies collecting independent data-sets in accordance with their own definitions of the shoreline. In the courseof presentations to the committee, it became apparent that some agenciesmaintain their own crews and collect their own shoreline data (e.g., BLMcollects its own data to define the vegetation line as the basis for its shore-line). In contrast, other agencies accept shoreline definitions provided byNOAA (e.g., the Minerals Management Service [MMS] uses NOAA’sMLLW shoreline definition). A consistent definition of the shorelinewould thus not only reduce legal and jurisdictional confusion but alsowould undoubtedly lead to increased data acquisition efficiency (seeChapter 6).
While a call for a nationally consistent shoreline is laudable (and prac-tical for some applications), we cannot escape the fact that embedded inlocal, state, and federal laws are an array of legislative definitions of theshoreline that will not be easily changed. With this in mind, it seemsimpractical to recommend adoption of a single national shoreline. How-ever, an alternative is the consistent geodetic framework—the CTM—described above. With the CTM and appropriate difference or tidal models,different agencies can adopt common and consistent horizontal andvertical reference frames and have the ability to transform and integrateshoreline definitions within this common framework. National consis-tency can be achieved when all parties define their shorelines in terms ofa tidal datum, so that vertical shifts can be easily calculated between andamong the various datum-based shoreline definitions. This approach hasthe advantage of allowing agencies and users to maintain their existinglegal shoreline definitions if required. Accordingly, the Vdatum tool kitand associated Web sites are critical for establishing internally consistentshorelines between and among disparate surveys and studies. In thosesituations where legislation or application does not preclude adoption ofa national shoreline, the internationally recognized shoreline as definedby NOAA-NGS should be adopted.
Copyright © National Academy of Sciences. All rights reserved.
A Geospatial Framework for the Coastal Zone: National Needs for Coastal Mapping and Chartinghttp://www.nap.edu/catalog/10947.html

74
4
Improving the Quantity and Quality ofCoastal Reference Frame Data
The costs associated with the acquisition of data (in particular refer-ence frame data) dominate mapping and charting activities. Thepresentations and submissions received by the committee repeatedly
indicated that the present mapping and charting database is inadequatefor applications ranging from safety of navigation to coastal resource man-agement. While the nation will benefit from the collection of additionalcoastal zone data of many types, the need for more fundamental referenceframe data—topography and particularly bathymetry—was consistentlycited as having the highest priority. In 1999 the Coastal Services Center(CSC) surveyed 270 offices representing state resource and environmentalprotection agencies, coastal zone management programs, Sea Grant pro-grams, National Estuarine Research Reserves, National Estuary Programs,and National Marine Sanctuaries (CSC, 1999). The issues represented bythese coastal zone groups included public access to the coast, dredgingand port issues, land use and land-use changes, coastal erosion and accre-tion, planning and response for oil and other hazardous material spills,point and nonpoint source pollution, habitat mapping, fish and shellfishstocks, and watershed management. The survey concluded that, out of 29possible priority datasets, nearshore bathymetry ranked second highest,after high-resolution aerial photography. Although the 2002 CSC surveyresults were not published prior to completion of this report, the draftreport indicated that 83 percent of the respondents require nearshorebathymetry, and of 37 possible priority datasets, bathymetry (when com-bining estuarine, nearshore, and offshore) ranked number one in use and
Copyright © National Academy of Sciences. All rights reserved.
A Geospatial Framework for the Coastal Zone: National Needs for Coastal Mapping and Chartinghttp://www.nap.edu/catalog/10947.html

IMPROVING THE QUANTITY AND QUALITY OF DATA 75
demand (CSC, 2002). These conclusions are neither unexpected nornovel—earlier assessments have consistently reached the same conclusions:
“The greatest information needs of the users in the states, industry,and academia are for bathymetry, imagery, and seabed characterization”(NRC, 1992; p. 2).
“The nation has a large and growing backlog of requests for newsurveys and charts. At the present level of effort, the backlog cannot bereduced” (NRC, 1994a; p. 66).
“NOAA should accelerate the current timetable of approximately 15to 20 years to reduce the current survey backlog. The backlog preventsNOAA from making progress on surveys and charts for the rest of theexclusive economic zone (EEZ)” (USDOT, 1999; p. 103).
Nearly half the depths published on current charts were measuredusing lead line techniques over a sparse grid prior to 1940, and one-thirdof the national shoreline has yet to be mapped. Given limited resources,the National Oceanic and Atmospheric Administration (NOAA) mustallocate priority for survey to “critical areas.” These areas include onlyprimary coastal shipping lanes and approaches to major U.S. ports andlargely exclude the extensive nearshore areas used by fishing fleets,oilfield service vessels, and other commercial, government, academic, andrecreational vessels. Also excluded from these surveys are most of thevast coastal areas managed by the nation’s primary coastal zone man-agers, as well as many of the areas containing “essential fish habitat” thatrequire mandatory mapping under the Magnuson-Stevens Fishery Con-servation and Management Act. The public cost for inadequate bathymetricdata becomes staggering when all factors are included (see Box 4.1).
SHALLOW BATHYMETRY—THE MOST CRITICAL GAP
There is a clear need for an expanded effort in bathymetric dataacquisition in the coastal zone. In deeper waters (greater than about 10meters) the technology to collect these data is available and relativelyefficient (see Chapter 2). Accordingly, if a national commitment to accom-plishing this deeper mapping exists, it should be straightforward toestablish an overarching structure to ensure that it is done efficiently andeffectively. The committee is confident that the approaches outlined herecould form the basis for effective national planning as well as cost savingsthat could be directed to additional data collection. The real challenge and
Copyright © National Academy of Sciences. All rights reserved.
A Geospatial Framework for the Coastal Zone: National Needs for Coastal Mapping and Chartinghttp://www.nap.edu/catalog/10947.html

76 A GEOSPATIAL FRAMEWORK FOR THE COASTAL ZONE
BOX 4.1Public Costs of Inadequate Bathymetry
• Groundings. Of the more than 500 groundings per year in the UnitedStates, many result directly or indirectly from poor charts. The cost includeshundreds of injuries and fatalities, millions of dollars in vessel and otherproperty damage, and the potential for billions of dollars in environmentaldamage. Groundings account for nearly 25 percent of all tanker accidents.Between 1993 and 1996, tankers alone were involved in 174 groundings,14 collisions, and 12 deaths (NOAA, 1999).
• Striking submerged objects. The likelihood of striking submergedobjects will decrease as charts become more up to date and electronicchart display becomes more widespread. Like groundings, collisions withsubmerged objects result in hundreds of injuries and deaths, millions ofdollars in property damage, and the potential for many millions of dollarsin environmental damage.
• Damage to submerged infrastructure. In addition to damage sustainedby vessels, their occupants, and the environment, submerged infrastructurecan also be damaged. Examples include subsea pipelines, power cables,fiber optic cables, and subsea oil and gas production facilities. The cost ofrepairing such installations can easily exceed $500,000 per occurrence.
• Poor spill predictions. One of the best ways to mitigate the effects ofoil spills is to quickly deploy recovery equipment ahead of the spill move-ment. To generate accurate water current predictions, accurate bathymetryis needed. Inadequate bathymetry can exacerbate potentially catastrophicenvironmental damage.
• Longer vessel transits. Because many charts do not contain accurateor comprehensive bathymetric data, vessel operators must take extra pre-cautions that include transiting further out to sea before following the coast.
impediment, however, is the acquisition of high-quality bathymetry inthe shallowest regions—the surf zone, the intertidal zone between lowwater and Mean Sea Level (MSL), and over bars and shoals at river mouthsand tidal inlets. Although the U.S. Geological Survey (USGS) and NOAAdatasets function essentially as national cartographic industry standardsand, with tens of millions of users, are the two most widely used map/chart series available in the United States, it is clear that it is not possibleto create a single, seamless database combining the two without consider-able effort. One very important reason for this is that the surface areabetween Mean Lower Low Water (MLLW) and MSL is not routinelymapped by either agency. Along shorelines of low relief (the most common
Copyright © National Academy of Sciences. All rights reserved.
A Geospatial Framework for the Coastal Zone: National Needs for Coastal Mapping and Chartinghttp://www.nap.edu/catalog/10947.html

IMPROVING THE QUANTITY AND QUALITY OF DATA 77
In areas where water deepens gradually, precautionary measures can add12 or more hours to a single transit for some ships. Thousands of ships,transiting dozens of times along the U.S. coast each year, can result inthousands of unnecessary transit days per year.
• Unused freighter draft. Container ships might reap $8,000 to as muchas $50,000 for each inch of additional draft. To maximize draft and main-tain safety, very accurate depths and tidal information need to be acquired.A single percent improvement in the overall efficiency of America’s marinetransportation system would translate into more than $2 billion in savingsacross the economy within a decade (AAPA, 2003).
• Loss of potential EEZ resources. The United Nations Commission onthe Law of the Sea gives coastal nations the opportunity to extend their EEZunder certain conditions. The United States can potentially increase thesize of its EEZ significantly. To stake its claim, the United States is requiredto perform a range of specified bathymetric and seismic surveys in andaround the country’s EEZ.
• Excess dredging to overcome inadequate charts and tidal data.Hundred of millions of dollars is spent annually on dredging. However, therelated investment in our charting infrastructure has not been made. Thismeans that new post-dredge data that are so important for navigation safetyand import/export cargo tonnage are not available to mariners quicklyenough.
• Seabed damage. Excess damage to the seabed will continue due toattempted scallop harvest in areas with little or no scallops. It has beendemonstrated that multibeam bathymetry can dramatically improve fishingefficiency and significantly reduce unnecessary seabed damage.
case) this gap may extend horizontally for many meters (and in extremecases can extend for hundreds or thousands of meters) and may extendvertically for a meter or more.
The problem is not just one of mandate, but rather the real tech-nological and logistical difficulty of collecting high-quality data in veryshallow water regions. The most comprehensive modern bathymetric databeing collected in shallow water are currently acquired with multibeamsonar from a survey launch. Standard multibeam sonar acoustic tech-niques for collecting high-resolution bathymetric data map a swath ofseafloor over a fixed angle (typically 120° to 150° or 3.4 to 7.4 times thewater depth). The deeper the water, the greater the area covered. As the
Copyright © National Academy of Sciences. All rights reserved.
A Geospatial Framework for the Coastal Zone: National Needs for Coastal Mapping and Chartinghttp://www.nap.edu/catalog/10947.html
78 A GEOSPATIAL FRAMEWORK FOR THE COASTAL ZONE
water shoals, the seafloor area sampled by the echo sounder decreases,making surveying with multibeam sonar an inherently inefficient processin very shallow water (in 2 meters of water the swath from a 150° multi-beam sonar would be less than 15 meters wide—using typical surveyprotocols, a multibeam survey in this water depth would cover a swathonly about 6 meters wide on each survey line). Survey launches are small(typically 7 to 10 meters long), manned, and generally constrained to day-light hours and good sea conditions. As a result, the actual productivesurvey time for a survey launch is generally less than 10 hours in a 24-hourperiod, and such surveys often progress very slowly in shallow waterswhere navigational hazards may be present.
In some areas, problems of survey efficiency and the dangers of oper-ating a vessel in very shallow waters can be overcome through the use ofairborne Light Detection and Ranging (LIDAR) systems. While currentbathymetric LIDAR systems do not achieve the same data density or levelof resolution as multibeam acoustic systems in similar water depths, theycan rapidly provide a relatively complete and accurate picture of seafloorbathymetry. They can record data in up to 50 to 60 meters of water wherewater clarity permits, with a swath width that is unchanged by waterdepth (typically about 200 meters). Water clarity is the critical limitingfactor in the applicability of bathymetric LIDAR, and high water turbidityprecludes the efficient use of bathymetric LIDAR in many regions of thecoastal United States.
Thus, acoustic systems are difficult to operate in the very shallowestregions of the coast, and bathymetric LIDAR systems, which can be oper-ated safely from the air, may have difficulty in regions with high turbidity.Faced with this dilemma, the committee explored what technologies mayaid in mapping the “shallowest of the shallow.”
STRATEGIES FOR PROVIDING SHALLOW BATHYMETRY
To respond to the need for comprehensive and accurate data in shal-low nearshore waters and along beaches, new and improved mappingand data acquisition technologies are being developed. Although researchactivities are attempting to increase the resolution and range of acousticsystems, in shallow water the physics of sound transmission in water is afundamental limitation. Sweep systems that use an array of vertical-incidence transducers rigged on large booms to either side of the surveyvessel may also be efficient in shallow water but need very calm condi-tions to be effective. Incremental advances in swath width may be gainedby new interferometric and synthetic aperture sonars. These sonars pro-vide excellent sidescan sonar data, but with some compromise of thefundamental framework bathymetric data. Nonetheless, these systems
Copyright © National Academy of Sciences. All rights reserved.
A Geospatial Framework for the Coastal Zone: National Needs for Coastal Mapping and Chartinghttp://www.nap.edu/catalog/10947.html
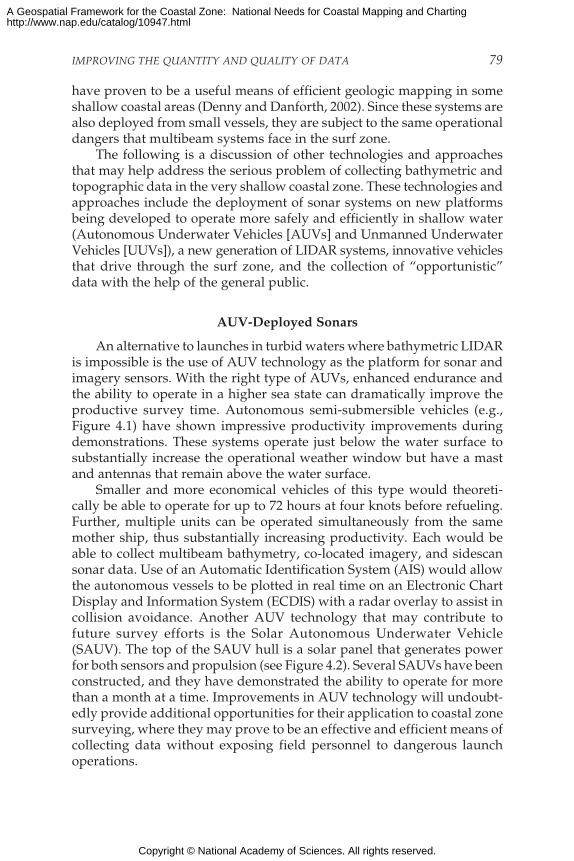
IMPROVING THE QUANTITY AND QUALITY OF DATA 79
have proven to be a useful means of efficient geologic mapping in someshallow coastal areas (Denny and Danforth, 2002). Since these systems arealso deployed from small vessels, they are subject to the same operationaldangers that multibeam systems face in the surf zone.
The following is a discussion of other technologies and approachesthat may help address the serious problem of collecting bathymetric andtopographic data in the very shallow coastal zone. These technologies andapproaches include the deployment of sonar systems on new platformsbeing developed to operate more safely and efficiently in shallow water(Autonomous Underwater Vehicles [AUVs] and Unmanned UnderwaterVehicles [UUVs]), a new generation of LIDAR systems, innovative vehiclesthat drive through the surf zone, and the collection of “opportunistic”data with the help of the general public.
AUV-Deployed Sonars
An alternative to launches in turbid waters where bathymetric LIDARis impossible is the use of AUV technology as the platform for sonar andimagery sensors. With the right type of AUVs, enhanced endurance andthe ability to operate in a higher sea state can dramatically improve theproductive survey time. Autonomous semi-submersible vehicles (e.g.,Figure 4.1) have shown impressive productivity improvements duringdemonstrations. These systems operate just below the water surface tosubstantially increase the operational weather window but have a mastand antennas that remain above the water surface.
Smaller and more economical vehicles of this type would theoreti-cally be able to operate for up to 72 hours at four knots before refueling.Further, multiple units can be operated simultaneously from the samemother ship, thus substantially increasing productivity. Each would beable to collect multibeam bathymetry, co-located imagery, and sidescansonar data. Use of an Automatic Identification System (AIS) would allowthe autonomous vessels to be plotted in real time on an Electronic ChartDisplay and Information System (ECDIS) with a radar overlay to assist incollision avoidance. Another AUV technology that may contribute tofuture survey efforts is the Solar Autonomous Underwater Vehicle(SAUV). The top of the SAUV hull is a solar panel that generates powerfor both sensors and propulsion (see Figure 4.2). Several SAUVs have beenconstructed, and they have demonstrated the ability to operate for morethan a month at a time. Improvements in AUV technology will undoubt-edly provide additional opportunities for their application to coastal zonesurveying, where they may prove to be an effective and efficient means ofcollecting data without exposing field personnel to dangerous launchoperations.
Copyright © National Academy of Sciences. All rights reserved.
A Geospatial Framework for the Coastal Zone: National Needs for Coastal Mapping and Chartinghttp://www.nap.edu/catalog/10947.html

80 A GEOSPATIAL FRAMEWORK FOR THE COASTAL ZONE
FIGURE 4.1 Mast of ORCA AUV underway while surveying. The ORCA is dieselpowered, with a surface mast that allows precise positioning using differentialGlobal Positioning System (GPS) information. Image courtesy of C&C Tech-nologies.
New-Generation LIDARs
Airborne bathymetric LIDAR will always be limited by water clarity.However, new developments in integrated airborne/terrestrial LIDARoffer hope for providing datasets that will greatly facilitate the integrationof onshore and offshore data. These new systems will simultaneously collectdata from airborne bathymetric LIDAR, airborne topographic LIDAR,digital imaging systems, and perhaps even a hyperspectral scanner. Allsystems will be navigated using the same satellite-based system to pro-vide a common vertical and horizontal reference frame. In one version ofthese new generations of LIDAR systems, the U.S. Army Corps of Engi-neers (USACE) Compact Hydrographic Airborne Raid Total Survey
Copyright © National Academy of Sciences. All rights reserved.
A Geospatial Framework for the Coastal Zone: National Needs for Coastal Mapping and Chartinghttp://www.nap.edu/catalog/10947.html

IMPROVING THE QUANTITY AND QUALITY OF DATA 81
FIGURE 4.2 Solar-powered AUV. Image courtesy of the Autonomous UnderseaSystems Institute.
(CHARTS) system, the bathymetric LIDAR component operates at a rateof 1,000 Hz, while the topographic LIDAR component operates at 10,000Hz. The system is compact and easily fits onto most photogrammetricaircraft of opportunity. When linked with the Vdatum tools describedearlier, these new systems will provide data that are ideally suited toaddress the “data gap” at the land-sea interface (see Figure 4.3). Finally,while water clarity will always be an issue with bathymetric LIDARs, thecareful planning of surveys with respect to season and tidal state mayhelp mitigate this problem. Again, with a national structure that allowscoordination of efforts, it should be possible to maximize LIDAR coverage.
Innovative Surf Zone Vehicles
Difficulties in using acoustic and other remote sensing technologiesin very turbid water and in the surf zone have led investigators to developa variety of bottom-following devices that are tracked by instruments toprovide instantaneous measurements of bottom elevation. Early devicesincluded a variety of sea sleds that were towed from the shoreline to out-side the surf zone. Typically, these measured the elevation of the sled
Copyright © National Academy of Sciences. All rights reserved.
A Geospatial Framework for the Coastal Zone: National Needs for Coastal Mapping and Chartinghttp://www.nap.edu/catalog/10947.html

82 A GEOSPATIAL FRAMEWORK FOR THE COASTAL ZONE
FIGURE 4.3 Airborne LIDAR bathymetry registered with rectified digital imag-ery. SOURCE: Quinn (2000).
base using a surveyor’s level and a corresponding rod on a mast, whiledetermining the sled’s horizontal position using either a measured cableor triangulation. With the advent of total surveying stations, all that isneeded is a reflecting prism mounted on the top of the mast to obtain itsspatial coordinates.
Self-propelled vehicles to eliminate the need for towing were devel-oped in the 1970s (Birkemeier and Mason, 1984), and with the advent ofhigh-resolution Differential Global Positioning System (DGPS), continuous
Copyright © National Academy of Sciences. All rights reserved.
A Geospatial Framework for the Coastal Zone: National Needs for Coastal Mapping and Chartinghttp://www.nap.edu/catalog/10947.html
IMPROVING THE QUANTITY AND QUALITY OF DATA 83
movement of the vehicle significantly reduced the cost and time of near-shore surveys. These types of vehicles have been used extensively forrepetitive surveys along the North Carolina coast and also for a few pre-project surveys (particularly for sand budget projects of the USACE).
Opportunistic Mapping
Historically, government agencies charged with the collection of dataand the generation of mapping and charting products have been veryreluctant to accept data from external sources, with government liabilityfor the accuracy of navigation information often cited as the greatestobstacle to accepting third-party information. Incorporating data fromsources other than well-qualified private industry partners remains prob-lematic for nearshore hydrographic data. There are, however, numerousexamples where public activities provide valuable feedback and, in somecases, data collection. The U.S. Power Squadron and the U.S. Coast Guard(USCG) Auxiliary provide quality assurance of charts and aids to naviga-tion by noting discrepancies in charted versus observed nautical informa-tion. Commercial mariners routinely provide weather observations and,through NOAA’s Voluntary Observing Ship Program, commercial shipsare equipped to take bathythermograph observations. The members ofthe International Seakeepers Society equip their yachts with sophisticatedobservation modules capable of measuring several meteorological andnear-surface water column parameters.
A potentially viable means for collecting high-quality bathymetric andother data may be by using a certified “black box” approach, where asealed and calibrated data collection system is installed onboard vesselsof opportunity. These systems record the parameters of interest (e.g.,depth) together with DGPS-based position information. The recorded dataare then downloaded to a central repository for quality control andprocessing.
TERRESTRIAL SATELLITE IMAGING
The coastal zone has a large and important terrestrial component.While mapping challenges for the “dry” regions of the coastal zone areless severe than those for water-covered areas, new developments inremote sensing techniques are rapidly improving the ability to documentthis important region. The recent introduction of high resolution com-mercial satellite imaging systems such as IKONOS (1-meter and 4-meterresolution, depending on channels used) and QuickBird (0.6-meter reso-lution) provide an important new data source for coastal mapping. Inaddition to offering high resolution and multispectral data, these systems
Copyright © National Academy of Sciences. All rights reserved.
A Geospatial Framework for the Coastal Zone: National Needs for Coastal Mapping and Chartinghttp://www.nap.edu/catalog/10947.html
84 A GEOSPATIAL FRAMEWORK FOR THE COASTAL ZONE
provide a short revisit time (around 3 days) and have stereo mappingcapability. In particular, stereo pairs can be formed in near real time dueto a very flexible pointing mechanism. These characteristics make thesenew high-resolution satellite imagery systems very attractive for monitor-ing and change detection as well as coastal mapping.
If ground control is used, IKONOS images are capable of producingmapping products with meter position accuracy for general land featuresand submeter accuracy for objects that can be measured at subpixel level(Di et al., 2003). Although the sensor model is not provided to the users,so-called rational function coefficients are supplied along with stereoimagery to allow generation of Digital Elevation Models (DEMs), ortho-images, and other features. Recent results of tests and experiments to useIKONOS images for coastal mapping have demonstrated the potential toproduce shorelines with about 1-meter horizontal and 2-meter verticalaccuracy (Li et al., 2002). Since a satellite system has a prescribed orbit, itis impractical to require that the satellite images be taken at the time of alocal MLLW or Mean High Water (MHW) level. Shorelines extracted fromIKONOS images are therefore always instantaneous shorelines. In conjunc-tion with an accurate Vdatum model, however, instantaneous shorelinescan be converted to more traditional tidal datum-based or orthometricshorelines. Accordingly, high-resolution satellite imagery appears to haveconsiderable potential for augmenting or replacing aerial photogrammetryin coastal mapping. There are numerous online resources already avail-able that provide access to aerial- or space-derived imagery. These includethe USACE Topographic Engineering Center’s Commercial and CivilImagery Office,1 the USGS Global Land Information System,2 and theMicrosoft TerraServer web site.3
1See http://www.tec.army.mil/tio/.2See http://earthexplorer.usgs.gov/.3See http://www.terraserver.com.
Copyright © National Academy of Sciences. All rights reserved.
A Geospatial Framework for the Coastal Zone: National Needs for Coastal Mapping and Chartinghttp://www.nap.edu/catalog/10947.html

85
5
Access to Coastal Geospatial Data
The fundamental product of the multiplicity of federal, state, andlocal agencies, private companies, academic researchers, and otherswho collect or process coastal zone mapping products is data.
These data are their raison d’etre and as such need to be accessible,accurate, timely, and useful. The application of information technologyhas allowed the development of tools and techniques that have greatlyenhanced our ability to deal with data of all kinds. Almost all data topopulate existing and future coastal geospatial databases will be digitaland amenable to the application of modern tools for managing, manipu-lating, and processing data. Although there will undoubtedly continue tobe efforts to rescue or transform older data, our emphasis in addressingdata issues will substantially focus on digitally collected data.
It is often difficult to find coastal geospatial data and/or derivedproducts. Once located, it is often difficult to judge the quality of the dataor to understand the limitations that apply to their use. With differencesin scales, datums, projections, formats, or resolution, the data are oftendifficult to handle and even more difficult to integrate. As well as thepaucity of tools for analysis and manipulation of coastal zone data, thereare often concerns about data currency because of the short-term temporalscales of many coastal zone processes.
This does not diminish the importance of the wide range of usefulWeb sites providing coastal zone geospatial data, together with tool kitsto manipulate the data. Examples of such sites are those provided by theNational Geophysical Data Center (NGDC) Geophysical Data System
Copyright © National Academy of Sciences. All rights reserved.
A Geospatial Framework for the Coastal Zone: National Needs for Coastal Mapping and Chartinghttp://www.nap.edu/catalog/10947.html

86 A GEOSPATIAL FRAMEWORK FOR THE COASTAL ZONE
(GEODAS), the U.S. Geological Survey (USGS) Coastal and Marine Pro-gram, the Naval Research Laboratory’s (NRL) Geospatial InformationDatabase (GIDB) Portal Web Client, and the sites supported by the CoastalServices Center (CSC; e.g., the Ocean Planning Information System [OPIS]).Although each of these groups provides valuable access to data and tools,they still represent only a small percentage of data collected in the coastalzone, and there is an urgent need for a substantial effort to expand on theexamples set by these organizations.
NATIONAL STANDARDS AND PROTOCOLS
As the committee evaluated the current status of data access and avail-ability, the path ahead was clear. There is a need for the establishment ofnational (and perhaps even international) standards and protocols for datacollection, metadata creation, and tools for data transformation and inte-gration. With these, the user community would be able to evaluate theaccuracy and timeliness of data, change scales and projections, and seam-lessly merge disparate datasets. Most importantly, database and dataintegration tools must be easily accessible to all users, public and private,from a single digital portal accessible through the Internet.
In exploring strategies for implementing this vision, the committeewas often reminded that a mechanism already exists that should havemade much of this vision a reality. This mechanism—Office of Manage-ment and Budget (OMB) Circular A-16 (a directive describing federalagency roles and responsibilities with respect to geospatial data) and theFederal Geographic Data Committee (FGDC) it established—demandsmany of the processes that the committee has recommended. The FGDCis a federal interagency committee, operating under the auspices of theOMB, with responsibility for facilitating and coordinating federal activi-ties related to geospatial data (see Box 5.1). Recognizing the nationalimportance of geospatial data, the lack of generally accepted standards,and the potential for duplication and inefficiencies in spatial data collec-tion and distribution, the FGDC formally defined the National SpatialData Infrastructure (NSDI) in 1994. A series of National Research Councilreports (NRC, 1993; 1994b; 1995b; 2001) advocated creation of the NSDIand recommended activities and initiatives that the FGDC could under-take to increase awareness, involvement, and usefulness of the NSDI. TheOMB recently reissued Circular A-16 to bring it up to date for the 21stcentury (OMB, 2002). Many of the concerns brought up by the coastalzone user community and noted by the committee are directly addressedby Circular A-16, including the establishment of national standards, inter-change formats, and metadata standards for geospatial data; the assuranceof compatibility and interchangeability of datasets; the coordination of
Copyright © National Academy of Sciences. All rights reserved.
A Geospatial Framework for the Coastal Zone: National Needs for Coastal Mapping and Chartinghttp://www.nap.edu/catalog/10947.html
ACCESS TO COASTAL GEOSPATIAL DATA 87
BOX 5.1The FGDC and the National Spatial Data Infrastructure
The FGDC is a federal interagency committee, operating under theauspices of the OMB, responsible for facilitating and coordinating theactivities of the NSDI. The NSDI encompasses policies, standards, andprocedures for organizations to cooperatively produce and share geo-graphic data. The 19 federal agencies that make up the FGDC are develop-ing the NSDI in cooperation with organizations from state, local, and tribalgovernments, the academic community, and the private sector. The NSDIis relevant to any agency that collects, produces, acquires, maintains,distributes, uses, or preserves analog or digital spatial data, including allGeographic Information System (GIS) activities, that are financed directlyor indirectly, in whole or in part, by federal funds.
Different federal agencies have lead responsibilities for the variousspatial data themes. For example, the USGS is responsible for all geologicmapping information and related geoscience spatial data; the NationalOceanic and Atmospheric Administration (NOAA) is responsible for off-shore bathymetry and shoreline delineation. Lead agencies are required topopulate each data theme, principally by developing partnership programswith states, tribes, academia, the private sector, and other federal agencies,and also by facilitating the development and implementation of FGDCstandards for each theme.
In order to build and support the NSDI, any agencies that collect, use,or disseminate geographic information and/or carry out related spatial dataactivities are required, both internally and through their activities involvingpartners, grants, and contracts, to:
• Develop a strategy for advancing geographic information and relatedspatial data activities appropriate to their mission.
• Collect, maintain, disseminate, and preserve spatial information suchthat the resulting data, information, or products can be readily shared withother federal agencies and non-federal users.
• Allocate agency resources to fulfill the responsibilities of effectivespatial data collection, production, and stewardship.
• Use FGDC data standards, FGDC Content Standards for Digital Geo-spatial Metadata, and other appropriate standards; document spatial datawith the relevant metadata; and make metadata available online through aregistered NSDI-compatible clearinghouse node.
• Coordinate and work in partnership with federal, state, tribal, andlocal government agencies, academia, and the private sector to efficientlyand cost effectively collect, integrate, maintain, disseminate, and preservespatial data, building on local data wherever possible.
• Support emergency response activities requiring spatial data in accor-dance with provisions of the Stafford Act and other governing legislation.
• Search all sources, including the NSDI National Clearinghouse, todetermine whether existing federal, state, local, or private data meet agencyneeds before expending funds for data collection.
Copyright © National Academy of Sciences. All rights reserved.
A Geospatial Framework for the Coastal Zone: National Needs for Coastal Mapping and Chartinghttp://www.nap.edu/catalog/10947.html

88 A GEOSPATIAL FRAMEWORK FOR THE COASTAL ZONE
data collection, data maintenance, and data dissemination; and the estab-lishment of a national clearinghouse for geospatial data.
The NSDI National Clearinghouse concept has been incorporated intoan OMB E-government1 initiative called “Geospatial One-Stop,” to pro-vide a single national focal point for FGDC-compliant geospatial data.Geospatial One-Stop was established to provide standards and modelsfor geospatial framework data, an interactive index to geospatial dataholdings at federal and non-federal levels, interaction among federal,state, and local authorities about existing and planned spatial data collec-tions, and a single on-line access point to geospatial data. It is the intentionthat tools will be provided to allow the migration of current non-compliantdata to FGDC standards (FGDC, 2002).
The NSDI concept and the Geospatial One-Stop initiative are admi-rable and, in principle, go a long way toward addressing the frustrationsexpressed by the coastal zone user community. However, implementa-tion of the NSDI appears to have been, and continues to be, problematicfor this community. Although there is a broad awareness of the principlesof the NSDI among federal agencies, there seems to be highly variablecommitment to concurring with its requirements by different agencies anda lack of incentive to fully implement its principles. This is most readilyapparent for the issue of standards, where there are concerns that a singleset of standards may not be able to serve all applications and that thosedeveloping the standards may at times be too far removed from the usercommunity, and/or that standards sometimes appear too complex foreasy implementation and users are unaware of existing tools to simplifythe implementation.
For example, rather than follow the FGDC’s Content Standard forDigital Geospatial Metadata, agencies and research groups often createtheir own, less complex internal standards or in some cases do not writemetadata at all, citing higher priorities and/or lack of resources and time.This defeats the purpose of Geospatial One-Stop, since those agencies orgroups not writing FGDC-compliant metadata are unable to participatein NSDI clearinghouses, which require compliance with the FGDC standard.
Perhaps a more reasonable approach would be to seek strongerinvolvement from the private sector by contracting key aspects of stan-dards development—and the tools to facilitate adoption of standards (seeBox 5.2)—to the private sector and to allow agency procurement processes
1“E-government”—an abbreviation for “Expanding Electronic Government”—is theinitiative overseen by OMB to expand electronic transactions, reduce paperwork, and makegovernment services available using the Internet; see http://www.whitehouse.gov/omb/egov/2003egov_strat.pdf.
Copyright © National Academy of Sciences. All rights reserved.
A Geospatial Framework for the Coastal Zone: National Needs for Coastal Mapping and Chartinghttp://www.nap.edu/catalog/10947.html
ACCESS TO COASTAL GEOSPATIAL DATA 89
BOX 5.2Vendors and Geospatial Standards—A Match Made in Heaven?
Various geospatial data standards have been developed to effectivelyimplement the NSDI. Among them are:
• FGDC’s standards for digital geospatial metadata (including a metadataprofile for shoreline data);
• geospatial positioning accuracy standards (including a U.S. standardfor Nautical Charting Hydrographic Surveys that is currently under review);
• spatial data transfer standards and spatial data content standards forhydrographic data in coastal and inland waterways (under review);
• remote sensing swath data standards; and• classification standards for wetland and deep-water habitats.
Vendors do not create these standards or profiles, but do greatly speedtheir adoption by incorporating them into their software products. Forexample, ESRI’s flagship GIS product—ArcGIS—embraces several currentstandards that are pervasive throughout the information technology arena,including the FGDC metadata standard and the Spatial Data Transfer Stan-dard, as well as Web standards such as Extensible Markup Language (XML)and the Unified Modeling Language (UML, the standard notation for themodeling of real-world objects for object-oriented databases and GIS appli-cations). In terms of metadata, if the user is already using ArcGIS for mostdata display, analysis, and map creation, the metadata documentation toolalready in ArcCatalog will allow an FGDC-compliant metadata record tobe written on the spot.
The ArcSDE application within ArcGIS for dealing with large spatialdatabases operates with commercial database management systems andsupports a variety of formats, including those from standards bodies suchas the OpenGIS Consortium (OGC) and the International Organization forStandardization (ISO), and de facto standard industry formats such asOracle Spatial, Informix Spatial DataBlade, and IBM Spatial Extender.
This is also true of CARIS and its line of hydrographic production data-base and GIS software, which also fully supports the International Hydro-graphic Office’s S-57 Transfer Standard for Digital Hydrographic Data, theS-52 Specifications for Chart Content and Display, and the production ofS-57 Electronic Nautical Charts (ENCs). CARIS Spatial Data Fusion providesWeb filters that help users access data from various clearinghouses withoutneeding to know anything about the specific standards or formats of thedata in those clearinghouses.
Copyright © National Academy of Sciences. All rights reserved.
A Geospatial Framework for the Coastal Zone: National Needs for Coastal Mapping and Chartinghttp://www.nap.edu/catalog/10947.html

90 A GEOSPATIAL FRAMEWORK FOR THE COASTAL ZONE
to continually encourage the private sector to deliver needed products ina timely fashion. As an example, the FGDC and the FGDC Marine andCoastal Spatial Data Subcommittee Web sites do not yet have links to theinternational S-57 Transfer Standard for Digital Hydrographic Data,critical to successful U.S. nautical charting. However, this standard isalready fully supported in several private-sector GIS products, includingvery effective tools for converting non-standard data into compliantforms.
As noted earlier, there are a number of excellent Web sites that arecurrently distributing geospatial data nationwide with FGDC-compliantmetadata.2 However, these are too distributed and limited in their content.The committee strongly supports the development of a single portalspecifically for all coastal mapping and charting data and derivedproducts within the framework of Geospatial One-Stop. This concept doesnot require a single site that contains all coastal data but rather a singlefocal point that can link to distributed databases that all support FGDC-compliant data and to tools that can convert non-compliant data intocompliant data. This site would represent the one place where users,particularly new users, can consistently and reliably begin their searchesfor data and derived products. A single access point should also promoteeasy and timely data entry.
An excellent example of this approach is NRL’s Geospatial Informa-tion Database (GIDB) Web Portal Client (Harris et al., 2003; see Box 5.3).The U.S. National Guard Counter Drug Program is currently using aversion of the GIDB Portal System technology as the basis for its DigitalMapping Server (DMS) portal in support of drug enforcement agents andagencies. This technology is also in use at NGA’s Gateway SIPRNET site,allowing dissemination of local file system information at the NGA Gate-way as well as integrating that information with multiple other non-NGAsources. In 2004 the GIDB technology will be implemented as the oceano-graphic, meteorological, and environmental data delivery system for theU.S. Navy.
Effectively sharing data means more than just the ability to downloada file. Many valuable datasets and excellent analytical tools available onthe Internet are underused and thus do not fulfill their potential. Thismay be due to the fact that the existence and/or purpose of the data maynot be well known by the user community. It also may be due to a lack ofunderstanding by users either of how to access and use the datasets or ofdata limitations. Therefore, in addition to metadata, information is needed
2For example, several coastal/ocean examples are cataloged at http://buccaneer.geo.orst.edu/links/.
Copyright © National Academy of Sciences. All rights reserved.
A Geospatial Framework for the Coastal Zone: National Needs for Coastal Mapping and Chartinghttp://www.nap.edu/catalog/10947.html
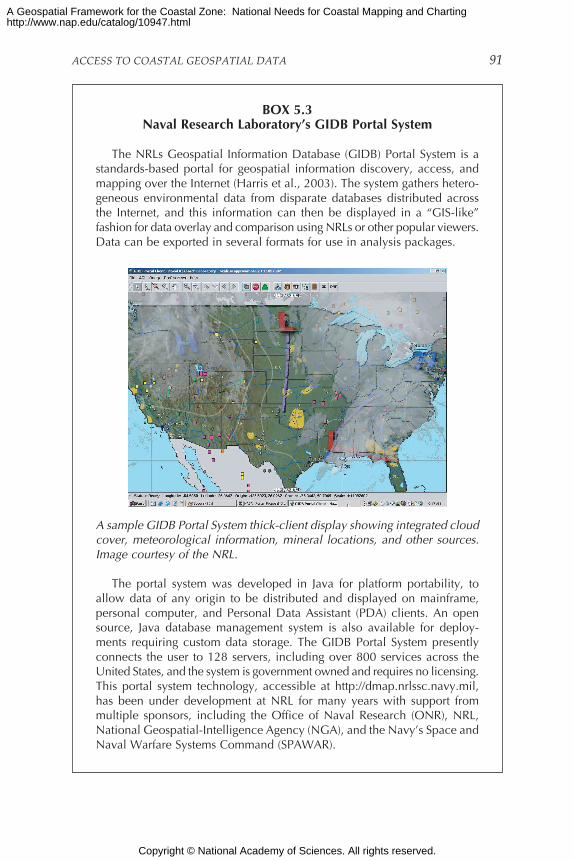
ACCESS TO COASTAL GEOSPATIAL DATA 91
BOX 5.3Naval Research Laboratory’s GIDB Portal System
The NRLs Geospatial Information Database (GIDB) Portal System is astandards-based portal for geospatial information discovery, access, andmapping over the Internet (Harris et al., 2003). The system gathers hetero-geneous environmental data from disparate databases distributed acrossthe Internet, and this information can then be displayed in a “GIS-like”fashion for data overlay and comparison using NRLs or other popular viewers.Data can be exported in several formats for use in analysis packages.
A sample GIDB Portal System thick-client display showing integrated cloudcover, meteorological information, mineral locations, and other sources.Image courtesy of the NRL.
The portal system was developed in Java for platform portability, toallow data of any origin to be distributed and displayed on mainframe,personal computer, and Personal Data Assistant (PDA) clients. An opensource, Java database management system is also available for deploy-ments requiring custom data storage. The GIDB Portal System presentlyconnects the user to 128 servers, including over 800 services across theUnited States, and the system is government owned and requires no licensing.This portal system technology, accessible at http://dmap.nrlssc.navy.mil,has been under development at NRL for many years with support frommultiple sponsors, including the Office of Naval Research (ONR), NRL,National Geospatial-Intelligence Agency (NGA), and the Navy’s Space andNaval Warfare Systems Command (SPAWAR).
Copyright © National Academy of Sciences. All rights reserved.
A Geospatial Framework for the Coastal Zone: National Needs for Coastal Mapping and Chartinghttp://www.nap.edu/catalog/10947.html
92 A GEOSPATIAL FRAMEWORK FOR THE COASTAL ZONE
to describe the appropriate use and limitations of data and derivedproducts. Again, many of these issues are addressed under the NSDI andGeospatial One-Stop, so the fundamental issue becomes a question ofidentifying ways to make the NSDI and Geospatial One-Stop conceptsnationally accepted. A recent report (NRC, 2001) concluded that althoughthe FGDC was successful both in improving access to data through theNational Clearinghouse and in beginning to establish content standardsfor geospatial metadata, little evidence could be found for reduced redun-dancy and diminished costs associated with data creation or maintenance,for improved accuracy of data, or for any removal of the significant insti-tutional barriers inhibiting the development and maintenance of geo-spatial data.
In an assessment of the significance of coastal and marine data in thecontext of the NSDI, Lockwood and Fowler (2000) noted that, althoughthere is an Executive Order to prescribe federal compliance with the NSDI,there are neither any real means of enforcement nor a process to monitorcompliance. They also point out that the federal agencies are given someleeway in determining which data might contribute to the NSDI, withOMB Circular A-16 using terms like “most expeditious,” “with availableresources,” and “practical and economical to do so.” They cite the needfor individual agencies to understand the broader context and the poten-tial benefits that sharing geospatial data can bring in support of theirindividual mandates, as well as the lack of resources for participation inthe NSDI, as further impediments to its success.
The FGDC has recognized problems with implementation of a nationalstrategy for geospatial data. In an effort to improve federal coordinationof geospatial data, the FGDC commissioned a design study team to evalu-ate actions and priorities that the FGDC must address (FGDC, 2000). Basedon discussions and interviews with many people within the member agen-cies of FGDC, the team recognized that there were problems of lack ofsupport and appreciation of the NSDI by senior officials in most of theagencies involved and that there were still problems with interagencycoordination and development of NSDI framework layers. To addressthese issues the team recommended:
• Raising geospatial data awareness to the policy level, to ensure thata clear vision of the NSDI must be presented that is understood by policymakers;
• Identification of full-time coordinators in each agency, with a com-mitment by senior agency officials to support the goals of Circular A-16;
• Greater pressure from OMB;• Clarification of individual responsibilities for national data
stewardship;
Copyright © National Academy of Sciences. All rights reserved.
A Geospatial Framework for the Coastal Zone: National Needs for Coastal Mapping and Chartinghttp://www.nap.edu/catalog/10947.html
ACCESS TO COASTAL GEOSPATIAL DATA 93
• Restructuring of the FGDC to have it report to the Director of USGS,evaluate and modify the current subcommittee structure and responsi-bilities, and focus FGDC staff on interagency non-partisan brokering withfederal agencies;
• Establishing management and oversight accountability that mustinvolve OMB.
The committee is fully supportive of these recommendations, but dis-appointed that—as a consequence of its mandate—the design team couldnot focus on the role that the private sector potentially could play in fur-thering the goals of the NSDI.
MORE THAN JUST A WEB PORTAL
The establishment of a single portal for coastal geospatial data, togetherwith a series of support tools for data transformation, processing, andintegration, will go a long way toward addressing many of the concernsof this committee and the user community. Such tools and databases mustalso be supported by education and training, so that the user communityunderstands and appreciates the limitations of the various datasets andtheir appropriate application. Documentation describing the data collec-tion methods and processing tools used (beyond the brief descriptionsprovided by metadata) must be made available to the community. Forexample, the USGS Seafloor Mapping Group Web site3 provides excellentbackground information on the various acoustic methods used to collectmapping data offshore. The new Oregon Coastal Atlas4 has similar infor-mation about data collection and processing, in addition to providingdata.
Training courses and workshops for users are also essential, andagency efforts should be expanded to provide users of their informationwith the knowledge and tools necessary for intelligent application of thedata. The CSC has paved the way in providing these services to users, andthese services should either be utilized more effectively by other agenciesor be used as a model for other agencies to emulate in transforming theirdata into useful information.
3See http://woodshole.er.usgs.gov/operations/sfmapping.4See http://www.coastalatlas.net.
Copyright © National Academy of Sciences. All rights reserved.
A Geospatial Framework for the Coastal Zone: National Needs for Coastal Mapping and Chartinghttp://www.nap.edu/catalog/10947.html

94
6
Increasing Coastal Mapping andCharting Efficiency
As with any activity that involves multiple federal, state, and localagencies, academic researchers, and the private sector, thereis tremendous potential in coastal zone mapping and charting
activities for redundancy and overlap of effort. This becomes particularlyimportant when the activity involves very expensive platforms andsensors. With the large number of agencies involved, their differing his-tories, the breadth of their mandates, and the complexity of the issues (seeAppendix A), there are many instances of both real and “apparent”redundancies (“apparent” refers to situations where an activity appearssimilar to activities of other programs, either within the same agency or inanother agency, but that in reality serves an important separate purpose).The committee attempted to distinguish between real and apparentredundancies in coastal mapping and charting activities within andbetween agencies based on the information provided directly or throughpresentations at committee meetings (and summarized in Appendix A).When the titles or brief descriptions of activities indicated apparentredundancy with activities performed by another agency or another officewithin the same agency, the activities were investigated further to deter-mine whether the apparent redundancy was real. In many cases it wasdetermined that the activities described were not redundant (and there iscertainly a lesson to be learned about taking great care in naming anddescribing an activity). In other cases, however, the committee found thatefficiencies could be gained through better coordination of activities, andthese are the examples presented here.
Copyright © National Academy of Sciences. All rights reserved.
A Geospatial Framework for the Coastal Zone: National Needs for Coastal Mapping and Chartinghttp://www.nap.edu/catalog/10947.html

INCREASING COASTAL MAPPING AND CHARTING EFFICIENCY 95
It is important to note that the committee did find examples wherecommunication, collaboration, and cooperation were clearly leading toenhanced efficiency and the avoidance of redundant activities (e.g., seeBox 6.1). Examples include collaboration by the National Oceanic andAtmospheric Administration (NOAA) and the U.S. Geological Survey(USGS) in the Bathy/Topo/Shoreline Demonstration Project, efforts byNOAA’s Office of Coast Survey (OCS) and USGS to maximize survey
BOX 6.1Examples of Successful Collaboration
Long Island, New YorkIn Long Island Sound, there is a 23-year history of cooperative State of
Connecticut/USGS/Minerals Management Service/NOAA data collectioninvolving seismic and sidescan sonar surveys; bottom grabs and coring;and bottom reconnaissance using divers, Remotely Operated Vehicles(ROVs), and submersibles. Nine potential study areas have been establishedby producing continuous sidescan sonar mosaics. Most of the data thathave been collected as part of this effort are available on the Internet.a
Several derivative products from this effort have also been publishedand are available on the Internet.b There are very few requests for the dataused to produce these products or for the background related to thesidescan mosaic areas, but there is extensive and growing use of thederivative maps for permitting, resource management, and resource pro-tection applications.
Stellwagen Bank, Jeffreys Ledge, Massachusetts and New HampshireNOAA-OCS, NOAA Fisheries (formerly the National Marine Fisheries
Service), the Sanctuaries Program, USGS, and state and local authorities allhave great interest in the region from north of Cape Cod seaward to an areaknown as Jeffreys Ledge. This region includes the approaches to Bostonand Portsmouth harbors, Stellwagen National Marine Sanctuary, and manyrich fishing grounds, including several regions that have been closed tofishing by NOAA Fisheries. Each of these organizations was planning inde-pendent mapping programs, but now, as a result of a series of meetings andconference calls, all of the mapping efforts (including contract surveys tothe private sector) are being coordinated so that there will be minimaloverlap (except where desired for repeat of comparison surveys) and maxi-mum efficiency.
aSee http://woodshole.er.usgs.gov/project-pages/longislandsound/index.htm.bSee http://woodshole.er.usgs.gov/project-pages/longislandsound/Pubs.htm.
Copyright © National Academy of Sciences. All rights reserved.
A Geospatial Framework for the Coastal Zone: National Needs for Coastal Mapping and Chartinghttp://www.nap.edu/catalog/10947.html

96 A GEOSPATIAL FRAMEWORK FOR THE COASTAL ZONE
value by collecting data relevant to both organizations on a single cruise,USGS-National Park Service (NPS) collaborative mapping programs,Environmental Protection Agency (EPA) collaboration with NOAA,USGS, Fish and Wildlife Service (FWS), and a number of state agencies todetermine national water quality conditions, and the numerous CoastalServices Center (CSC) efforts to organize states and others with respect tostandards and data distribution.
DATA COLLECTION OVERLAP AND REDUNDANCY—TOPOGRAPHY AND BATHYMETRY
Those charged with acquiring or working with coastal zone mappingdata and/or derived products do not have an efficient means of deter-mining whether an area of interest has been previously mapped or isplanned to be mapped. Even when a user is aware that a mapping efforthas been completed, it is often difficult to acquire the data in useful forms.The agencies undertaking mapping programs use various methods to dis-tribute their products, increasingly making digital data available on theInternet, often free of cost. There are numerous examples of excellent Websites that attempt to offer the user easy access to both primary data andderived products (e.g., the National Geophysical Data Center’s GeophysicalData System [GEODAS] and Coastal Relief Model, OCS’s Mapfinder,CSC’s Ocean Planning Information System [OPIS], and many others), butsuch efforts are distributed and managed by individual labs, divisions, oragencies and are often difficult to locate. Currently, individuals seekingspatial data must search many Web sites, contact agency staff, and gener-ally learn through trial and error what data exist and how to obtain them.In addition, the usefulness of coastal data often outlasts the work or eventhe careers of the people who generated the data, and it is essential thatfuture generations have access to such data despite changes in the man-dates of agencies and their staff.
As with most situations where redundancy and overlap exists, theproblem lies mostly in a lack of communication among agencies (andsometimes within agencies), and between agencies and end-users. Duringpresentations to the committee, there were several occasions where repre-sentatives from agencies that were planning mapping or charting programswere made aware of nearly identical programs that existed in, or wereplanned by, other agencies. While the redundancies identified involve thefull range of data collection, analysis, and product development activities,it is redundancy in data collection that is of most concern as this is by farthe most expensive of these activities. Noted below are specific examplesof activities that can benefit from better communication and coordination,followed by suggestions for strategies that may alleviate some of the
Copyright © National Academy of Sciences. All rights reserved.
A Geospatial Framework for the Coastal Zone: National Needs for Coastal Mapping and Chartinghttp://www.nap.edu/catalog/10947.html

INCREASING COASTAL MAPPING AND CHARTING EFFICIENCY 97
potential for duplication of effort and thus produce more effective andefficient coastal zone mapping and charting.
Aerial Imagery
The Cooperative Topographic Mapping Program of the USGS’sGeography Discipline archives and disseminates maps and digital spatialdata products. The program is developing national digital coverage as acomponent of “The National Map” initiative, based on participation withfederal, state, local, and tribal governments; non-profit organizations; andthe private sector. This effort requires coastal topographic data aboveMean High Water (MHW) or perhaps Mean Sea Level (MSL). The USGSnational mapping program uses stereo aerial images for its production oftopographic quadrangles, including digital line graphs, Digital ElevationModels (DEMs), and digital orthophoto quadrangles. Additional aerialphotographs are required periodically to update the mapping products.A significant portion of the aerial photographs required by USGS are incoastal areas where NOAA’s national shoreline mapping program collectshigh-quality, tide-coordinated, stereo aerial photographs. Except for theadditional requirement for tide-coordinated timing, such aerial photo-graphs are also appropriate for topographic mapping by USGS. A coordi-nated effort between the two agencies in coastal areas would allow bothagencies to benefit from their collective efforts and eliminate redundancyor overlap.
LIDAR Data
Individual agency and state efforts to collect Light Detection andRanging (LIDAR) data appear to suffer from a significant lack of coordi-nation and cooperation. NOAA-CSC conducts the Topographic ChangeMapping project, which supports private-sector LIDAR mapping to helpCSC address coastal management needs. There is also an ongoingNational Aeronautics and Space Administration (NASA) and USGSresearch effort to provide LIDAR coverage of the entire U.S. coastline tosupport improved assessment of coastal change hazards. These two pro-grams closely parallel each other, and there is considerable likelihood ofduplication in some regions. In fact, a few years ago the two agencies hadworked together—with NASA—to develop the foundation of theAirborne LIDAR Assessment of Coastal Erosion (ALACE), a partnershipbetween CSC, NASA, and the USGS to collect LIDAR data along the sandybeaches of the United States. Unfortunately, this collaboration no longerexists, and as a result there is considerable potential for duplication andlack of coordination.
Copyright © National Academy of Sciences. All rights reserved.
A Geospatial Framework for the Coastal Zone: National Needs for Coastal Mapping and Chartinghttp://www.nap.edu/catalog/10947.html
98 A GEOSPATIAL FRAMEWORK FOR THE COASTAL ZONE
The U.S. Army Corps of Engineers (USACE) collects bathymetric,topographic, and photogrammetric information in inland waterways andports for a range of purposes. Additionally, environmental conditions aremeasured and monitored using spectral and field sampling techniques todetermine the impacts of engineering projects. The USACE uses itsScanning Hydrographic Operational Airborne LIDAR Survey (SHOALS)bathymetric LIDAR system, which is also capable of being equipped withmultispectral imagers and topographic LIDAR, for mapping and moni-toring of the coastal area. This technology is especially useful in waterstoo shallow or hazardous for efficient employment of survey launches.However, the extent to which USACE project-specific mapping usingSHOALS technology could benefit from, or contribute to, the ongoingefforts of NOAA and the USGS is unclear. The process by which theUSACE prioritizes its coastal mapping activities and coordinates theseactivities among its own regional offices is also unclear. Lack of coordina-tion of shallow bathymetric LIDAR surveys was cited as a problem byone state representative who reported that, while the state was conduct-ing a LIDAR mapping program, he discovered “by happenstance” thatthe USACE was planning LIDAR flights over the same area of coast. Inthe present situation, where many individual states are seeking to obtainextensive or statewide LIDAR coverage of onshore areas, it is imperativethat effective coordination between federal agencies and coastal states beimplemented for maximum efficiency and cost savings.
Shoreline Mapping
Nowhere is the problem of agency overlap more evident than in themapping of the nation’s shorelines. The committee identified several tech-nical reasons for the difficulty in defining, locating, and mapping aconsistent shoreline, but none of these reasons justify the degree of over-lap and lack of coordination evident with respect to shoreline mapping.The following summary of federal shoreline mapping and shorelinechange activities illustrates the nature of this problem. Recommendationsfor reducing these overlaps and improving interagency coordination inthe nation’s shoreline mapping efforts are presented later in this chapter.
National Oceanic and Atmospheric Administration (NOAA)
NOAA’s mission includes the requirement to survey coastal regionsand navigable shoreline water areas to provide an official and accuratedelineation of what the agency and many international bodies define as“The National Shoreline.” These surveys consist of the collection andanalysis of aerial photogrammetric shoreline data by NOAA’s National
Copyright © National Academy of Sciences. All rights reserved.
A Geospatial Framework for the Coastal Zone: National Needs for Coastal Mapping and Chartinghttp://www.nap.edu/catalog/10947.html

INCREASING COASTAL MAPPING AND CHARTING EFFICIENCY 99
Geodetic Survey (NGS) for nautical chart production and the accurategeographical references needed for managing coastal resources. NOAA-OCSuses the shoreline data collected by NGS to prepare nautical charts andother products for navigation. Recently, these data have been produced indigital form from scanned raster (paper) copies of archived coastal surveysoriginally used in the production of nautical charts. Most of these effortsare managed by the NOAA-CSC, which is making the data available viathe Internet and on CD-ROMs for each U.S. coastal state and territory. Forsome states, shoreline data digitization is also being accomplishedthrough partnerships with local coastal zone management programs.
Minerals Management Service (MMS)
MMS derives state and federal baselines based on the definitionagreed to in the United Nations Convention on the Law of the Sea: “. . .[T]he normal baseline for measuring the breadth of the territorial sea isthe low water line along the coast, as marked on large scale charts offi-cially recognized by the coastal state.” MMS uses the NOAA-collectedand -derived Mean Lower Low Water (MLLW) for baseline point devel-opment. Although MMS does not directly perform any coastal mappingor charting, it does support efforts by NOAA’s National Ocean Service(NOS) to collect new information where data gaps exist. The NOAA-OCScoordinates development and dissemination of the base cadastre andmarine boundaries with the MMS Mapping and Boundary Branch. Thiscoordination between NOAA and the MMS is an example of the type ofcollaboration that maximizes efficiency.
U.S. Geological Survey
The USGS Geology Discipline supports scientific investigations ofshoreline change including the National Assessment of Shoreline Change.Primarily using a NASA airborne topographic LIDAR to map the U.S.coastline, the principal purpose of this program is to develop a repeatablecoastal surveying method for periodic measurements of the shoreline.Although it appears that these data could by used by NOAA—and thedata is made available to NOAA—this program is not designed to estab-lish legal boundaries but instead is intended to:
• Establish an objective shoreline for the sandy beaches of the conti-nental United States and Hawaii for the development of consistent esti-mates of coastal change. The committee notes the apparent redundancywith NOAA’s efforts to provide “an official and accurate delineation of‘The National Shoreline.’”
Copyright © National Academy of Sciences. All rights reserved.
A Geospatial Framework for the Coastal Zone: National Needs for Coastal Mapping and Chartinghttp://www.nap.edu/catalog/10947.html

100 A GEOSPATIAL FRAMEWORK FOR THE COASTAL ZONE
• Develop and implement improved uniform methods of assessingand monitoring shoreline change. The committee notes that the FederalEmergency Management Agency (FEMA), USACE, and NOAA also con-duct shoreline change assessments.
• Provide data and information to other federal and state agenciesthrough partnerships.
Federal Emergency Management Agency (FEMA)
FEMA is the principal agency tasked with identification and mitiga-tion of the nation’s coastal hazard threat. Through the use of grant moniesallocated to state agencies and published standards, FEMA oversees theproduction of Flood Insurance Rate Maps (FIRMS). FIRMS delineate thelocation and intensity of flooding hazards in the coastal zone related tohurricane storm surge and tsunami occurrence, based on historical fre-quency and site-specific physical parameters.
Almost all of the current FEMA coastal hazard enterprise has beenfocused on water-level inundation and has not considered other types ofcoastal hazards, such as coastal erosion or sea level rise, which can onlybe effectively evaluated using geospatial tools. Congress has recognizedthis deficiency and drafted legislation that would allow FEMA to engagein coastal erosion mapping, with a significant amount of funding ($150million in 2003 and $200 million in 2004 for map modernization) poten-tially appropriated toward this effort.
Traditionally, FEMA has used a state-by-state approach to collect thegeospatial data necessary for delineating the erosion hazard zone, ratherthan working with other federal agencies in a cooperative effort. The state-by-state approach suffers from parochial definitions and lack of standardsfor data collection and analysis methods and is unlikely to result in thenationally consistent geospatial dataset envisioned by this committee andurgently required by coastal managers, scientists, and policy makers.
U.S. Army Corps of Engineers (USACE)
In 2001, USACE received funding from the Congress to initiate aNational Shoreline Management Study,1 which directs that a report beprepared for Congress describing the state of the shores of the UnitedStates. This study will examine the extent and causes of shoreline erosionand accretion and discuss the economic and environmental impacts ofthese processes. The intent is to provide the information needed for
1See http://www.iwr.usace.army.mil/NSMS/.
Copyright © National Academy of Sciences. All rights reserved.
A Geospatial Framework for the Coastal Zone: National Needs for Coastal Mapping and Chartinghttp://www.nap.edu/catalog/10947.html
INCREASING COASTAL MAPPING AND CHARTING EFFICIENCY 101
developing recommendations on levels of federal/non-federal participa-tion in shore protection and to outline systematic approaches to sandmanagement and coastal management decision making. The scope of thisstudy, particularly investigating the causes of shoreline erosion, appearsto duplicate the efforts of USGS’s science-based National Assessment ofShoreline Change, and it was unclear to the committee whether or howthis apparent duplication would be addressed by the respective agencies.
DATA COLLECTION OVERLAP AND REDUNDANCY—HABITAT MAPPING
In the context of coastal mapping, habitat is necessarily a derivedthematic layer constructed on a variety of primary data sources. Habitatmapping can encompass almost all other primary information sources,including the framework information of topography and bathymetry, andsource data elements, including water movement; the quality, character,and distribution of bottom materials; sediment dynamics; and other bio-logical and chemical components of the ecosystem. The measurement andcompilation of any and all physical, chemical, and biological coastalinformation can be considered “habitat mapping.” With such broad infor-mation needs and high socioeconomic value, it is not surprising that manyagencies express a need for habitat information and/or have active effortsto map habitat.
With so many agencies involved in habitat mapping, there is a highpotential for duplication and overlap. However, there are a number ofdifficulties in assessing potential overlaps and gaps and in recommendingsteps to address the problem. Many individual habitat mapping initia-tives occur on regional or local scales to address specific needs (e.g.,activities of coastal states to address their permitting and managementrequirements). A recent report noted that “in general, habitat maps havebeen compiled only on an ad hoc basis for small areas . . . due partly to thelack of an accepted classification scheme for seafloor habitats in the UnitedStates” (NRC, 2002; p. 31). Different efforts often address different species,biogeographic regions, or research questions. Nevertheless, considerablebenefits and cost savings are likely to result from a national approach tomapping coastal habitats. As with all thematic layers, the basic geospatialdata (topography and bathymetry) are an essential component of habitatmapping, providing the framework upon which habitat data are dis-played and referenced. At the next level, information describing substratetype and distribution and sedimentary processes are components of habi-tat characterization (e.g., Kostylev et al., 2001). Consequently, sidescansonar imagery, multibeam backscatter, aerial and satellite imagery, sea-floor photography, and other techniques for determining the nature of
Copyright © National Academy of Sciences. All rights reserved.
A Geospatial Framework for the Coastal Zone: National Needs for Coastal Mapping and Chartinghttp://www.nap.edu/catalog/10947.html

102 A GEOSPATIAL FRAMEWORK FOR THE COASTAL ZONE
seafloor substrate are an important additional layer for mapping habitat.In addition, more ephemeral and difficult to measure parameters likesalinity, currents, water temperature and range, nutrient levels, and asso-ciated species are all components of a final determination of habitat.Although the complexity of the issues involved with habitat mapping mayjustify involvement of numerous agencies in the collection of habitat data,it is likely that better coordination of effort and broader access to datawould lead to increased efficiency.
An additional requirement to support consistency of habitat mappingamong agencies and other users is a nationally—if not internationally—accepted marine habitat classification system. Such a system would ensurethat a map developed in one region is comparable to that from anotherarea in terms of nomenclature, quality assurance, and other standards.This will allow appropriate understanding, planning, and action to addressthreats to the important species, biodiversity, and habitats that extendbeyond state or national borders.
STRATEGIES FOR ADDRESSING REDUNDANCY AND OVERLAP
The Federal Budget Process—the Problem Behind the Problem
The lack of coordination and communication within and betweenfederal agencies, as well as between state and federal entities, has resultedin overlap and redundancy, not only in terms of agency operations butalso in terms of agency missions related to coastal mapping and charting.This probably comes as no surprise to most federal managers, for in avery real sense the budgetary and programmatic decision making pro-cesses of the federal government favor those who set themselves apart bypromoting their own agendas, rather than those who would supportcoordinated partnerships between agencies. In large measure, the federalbudget process discourages partnership planning and funding.
Each federal fiscal year’s budget cycle begins with the developmentof an agency-level budget proposal. For example, the component bureaus(USGS, NPS, FWS, MMS, etc.) of the Department of the Interior all developseparate proposals. The bureaus set priorities and goals for the myriad ofindividual efforts to be continued or initiated by their offices during thecoming fiscal year. Bureau proposals are then submitted to the departmentfor review, where they are subject to departmental priorities reflecting ahost of policy, legislative, regulatory, procurement, and managementneeds that are usually more closely tied to the administration’s prioritiesthan those at the bureau level.
Although these two steps probably offer the highest potential forrewarding internal or internal/external partnerships under the existing
Copyright © National Academy of Sciences. All rights reserved.
A Geospatial Framework for the Coastal Zone: National Needs for Coastal Mapping and Chartinghttp://www.nap.edu/catalog/10947.html

INCREASING COASTAL MAPPING AND CHARTING EFFICIENCY 103
budget system (perhaps because the benefits are clearer to the interestedparties), such partnerships face strong competition from internal forcesseeking to preserve, sustain, and, most often, expand internal fundingand capabilities. Requests for funding to support partnerships with otheragencies may be denied because of a perceived risk that if one agencypartner fails to receive funding, the project may not be viable; alterna-tively, it may be denied because if a single project is listed in more thanone agency’s budget, it may appear to be a duplication when in reality itis actually cost sharing.
The next step is submission of departmental budgets to the Office ofManagement and Budget (OMB), where individual examiners, assignedto particular departments and bureaus, review the proposals. Among theobjectives of such reviews is the reduction or elimination of any requestsfor funding that do not fall within the administration’s priorities, as wellas identification of potential redundancies. There is potential for OMBexaminers to perceive funding for the same project in two or more agen-cies’ budgets as a duplication of effort and to eliminate funding to one ormore of the partnering agencies.
After OMB makes its decisions, the departmental budget requests arecompiled into the president’s request to Congress. In both the House andthe Senate, separate committees dealing with the individual “bins” of thefederal budget review, deliberate, and ultimately arrive at a “mark” foreach of the line items in the administration’s request. Agencies withcoastal mapping and charting responsibilities and needs are distributedacross a number of congressional committees that authorize and appro-priate funds. The “stovepipe” nature of the committee system, combinedwith the location of agencies with coastal mapping and charting responsi-bilities in different “pipes,” limits opportunities for promoting or estab-lishing interagency partnerships.
Occasionally, legislation is passed that directs specific agencies towork in partnership to address a critical national need. However, fundsmay not have been appropriated for the new directive, which means thatfunding must come from existing agency budgets. Occasionally a programwill generate support across several levels of the government. One of thesewas the U.S. Global Climate Change Research Program, which developeda strong rationale for centralized funding to address this critical nationalconcern. As a result, OMB strongly supported interagency requests foradditional funds.
It is with this in mind that the committee encourages OMB manage-ment and agency/bureau representatives to the Federal Geographic DataCommittee (FGDC) to recognize that no single agency has the resources,or the mission, to collect the data and develop the models necessary tosupport the comprehensive geospatial products that will meet all of the
Copyright © National Academy of Sciences. All rights reserved.
A Geospatial Framework for the Coastal Zone: National Needs for Coastal Mapping and Chartinghttp://www.nap.edu/catalog/10947.html

104 A GEOSPATIAL FRAMEWORK FOR THE COASTAL ZONE
nation’s coastal user needs. Only through intensive and extensive partner-ships between and within agencies can significant progress be madetoward the community vision of an integrated and continuous coastalzone mapping and charting product.
Enhancing Inter- and Intra-agency Cooperation and Collaboration
The committee recognizes a pressing need for establishing andimproving formal and informal mechanisms for collaboration in planning,funding, and implementing the nation’s coastal mapping and chartingefforts. We appreciate that success will ultimately depend on support atmany levels of government, from agency offices, to OMB examiners, toCongress. Our overarching concern is that without such mechanisms, thenation’s capability to map and chart its coastal areas will be seriouslydegraded by duplicative and unnecessarily costly field efforts, lack ofstandardized approaches for enhancing the utility of the data and derivedproducts, and serious gaps in capability and data coverage. In the follow-ing paragraphs we present specific mechanisms that could be used to fur-ther such collaborations.
Mandatory registration of all federally funded coastal mapping andcharting activities in a central, publicly available database.
As noted above, in the process of the committee’s meetings we observedseveral occasions where representatives from agencies that were planningmapping or charting programs were made aware of nearly identical pro-grams that existed in, or were planned by, other agencies. If this happenedseveral times in the course of only four committee meetings, there isclearly a serious problem. As a first—and enforceable—step in ensuringthat information be readily available, the committee recommends that allagencies receiving federal funds for coastal mapping or charting activitiesbe required to register these activities in a publicly available, easily acces-sible database. This database would contain critical information on thespatial extent of the survey, the equipment used, the parameters measured,and so forth. The database would track surveys completed but, mostimportantly, would list surveys being planned. In this way, other organi-zations could identify the extent and parameters for planned surveys.While registration cannot be made mandatory for states and those fundedby sources other than federal funds, they should be encouraged to regis-ter their planned and completed activities. In addition, these organiza-tions would have a single place to search to find what federally fundedsurveys have already been done and, more importantly, what surveys areplanned in their regions. There could also be a portion of the database
Copyright © National Academy of Sciences. All rights reserved.
A Geospatial Framework for the Coastal Zone: National Needs for Coastal Mapping and Chartinghttp://www.nap.edu/catalog/10947.html
INCREASING COASTAL MAPPING AND CHARTING EFFICIENCY 105
reserved for a “surveys needed” section, where all agencies or organiza-tions (including non-federal organizations) could list areas that are in needof mapping as well as the type of data required.
Aspects of this recommendation are already covered under the newlyrevised OMB Circular A-16 (OMB, 2002):
. . . [A]ll agencies that collect, use, or disseminate geographic informationand/or carry out related spatial data activities will, both internally andthrough their activities involving partners, grants, and contracts:
Prepare, maintain, publish, and implement a strategy for advancinggeographic information and related spatial data activities appropriate totheir mission, in support of the NSDI Strategy. Annually report to OMBon your achievements relative to your strategies, and include spatial dataassets within Exhibit 300 submissions (see OMB Circular A-11, sec. 300). . . [and] . . . before the obligation of funds, ensure that all expendituresfor spatial data and related systems activities financed directly or indirectly,in whole or in part, by federal funds are compliant with the standardsand provisions of the FGDC. All Information Technology systems whichprocess spatial data should identify planned investments for spatial dataand compliance with FGDC standards within the Exhibit 300 capital assetand business plan and submission (see OMB Circular A-11, sec. 300).
While this directive requires some degree of registration for all geo-spatial data collection activities, the committee calls for a much morefocused database to encompass coastal zone-specific activities, linked tothe proposed single coastal zone Web portal.
Through a system based on the centralized registration of coastalsurvey work and a centralized coordination office, the specifications forproposed work could be viewed by all interested parties. If an agencynotes that survey work is being planned by others in an area of interest toit, the agency can assess the proposed data types and specifications andthen may choose to fund any incremental costs necessary to bring thesurvey specifications into line with its own needs. Thus, the registry notonly would serve to reduce redundancy and overlap but would also havethe potential to greatly enhance efficiency by facilitating “incremental”surveys, that is, when one agency plans a survey for a particular purpose(e.g., bathymetry for safety of navigation) and another agency requires adifferent type of data in the same area (e.g., backscatter for habitat map-ping), the “piggyback” agency can provide the incremental fundingrequired to collect the additional data rather than conducting a veryexpensive independent survey (see Box 6.2). The database would beserved by the single Web portal dedicated to coastal zone mapping(described in Chapter 5).
In 2001 the USGS Geography Discipline proposed that it shoulddevelop “The National Map”—a database of continuously maintained
Copyright © National Academy of Sciences. All rights reserved.
A Geospatial Framework for the Coastal Zone: National Needs for Coastal Mapping and Chartinghttp://www.nap.edu/catalog/10947.html
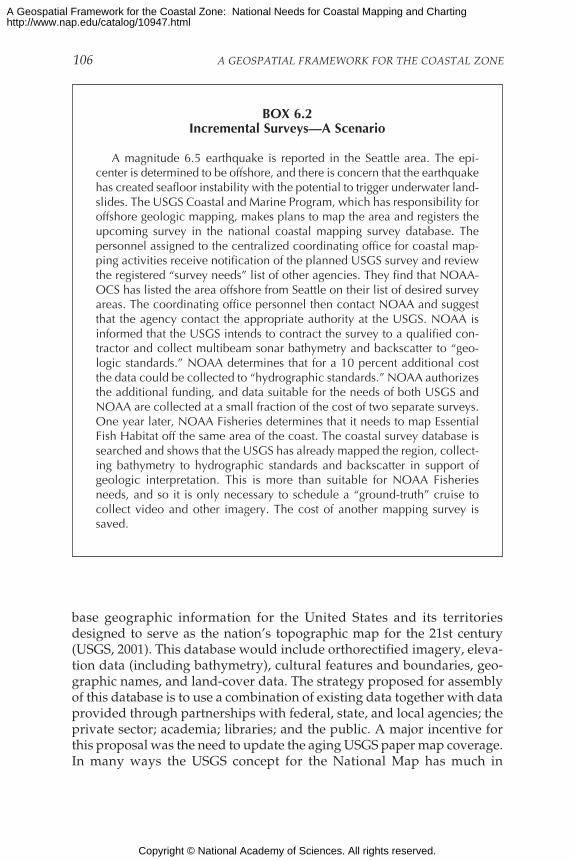
106 A GEOSPATIAL FRAMEWORK FOR THE COASTAL ZONE
BOX 6.2Incremental Surveys—A Scenario
A magnitude 6.5 earthquake is reported in the Seattle area. The epi-center is determined to be offshore, and there is concern that the earthquakehas created seafloor instability with the potential to trigger underwater land-slides. The USGS Coastal and Marine Program, which has responsibility foroffshore geologic mapping, makes plans to map the area and registers theupcoming survey in the national coastal mapping survey database. Thepersonnel assigned to the centralized coordinating office for coastal map-ping activities receive notification of the planned USGS survey and reviewthe registered “survey needs” list of other agencies. They find that NOAA-OCS has listed the area offshore from Seattle on their list of desired surveyareas. The coordinating office personnel then contact NOAA and suggestthat the agency contact the appropriate authority at the USGS. NOAA isinformed that the USGS intends to contract the survey to a qualified con-tractor and collect multibeam sonar bathymetry and backscatter to “geo-logic standards.” NOAA determines that for a 10 percent additional costthe data could be collected to “hydrographic standards.” NOAA authorizesthe additional funding, and data suitable for the needs of both USGS andNOAA are collected at a small fraction of the cost of two separate surveys.One year later, NOAA Fisheries determines that it needs to map EssentialFish Habitat off the same area of the coast. The coastal survey database issearched and shows that the USGS has already mapped the region, collect-ing bathymetry to hydrographic standards and backscatter in support ofgeologic interpretation. This is more than suitable for NOAA Fisheriesneeds, and so it is only necessary to schedule a “ground-truth” cruise tocollect video and other imagery. The cost of another mapping survey issaved.
base geographic information for the United States and its territoriesdesigned to serve as the nation’s topographic map for the 21st century(USGS, 2001). This database would include orthorectified imagery, eleva-tion data (including bathymetry), cultural features and boundaries, geo-graphic names, and land-cover data. The strategy proposed for assemblyof this database is to use a combination of existing data together with dataprovided through partnerships with federal, state, and local agencies; theprivate sector; academia; libraries; and the public. A major incentive forthis proposal was the need to update the aging USGS paper map coverage.In many ways the USGS concept for the National Map has much in
Copyright © National Academy of Sciences. All rights reserved.
A Geospatial Framework for the Coastal Zone: National Needs for Coastal Mapping and Chartinghttp://www.nap.edu/catalog/10947.html

INCREASING COASTAL MAPPING AND CHARTING EFFICIENCY 107
common with this committee’s vision for easy access to data derived frommultiple sources and available from a single Web site. A recent review ofthe USGS plans for the National Map (NRC 2003b) applauded the NationalMap vision, describing it as ambitious, challenging, and worthwhile, butalso noted that there was little new in the USGS proposal and that thebiggest challenges that will need to be overcome are not scientific or tech-nical, but rather institutional and cultural. This committee considers thatincorporating offshore geospatial data will present additional challengesrelated to the technical issues involved with including bathymetric eleva-tion data (as described in detail above), and to the significant institutionalchallenges involved with assuming some degree of responsibility for thecompleteness, consistency, and accuracy of data elements that are themandated responsibility of other federal agencies. The acknowledgmentin the National Map implementation plan of the importance of partner-ships is a gratifying recognition of the need for extensive interagencycollaboration among all agencies involved.
Formal coordination of geospatial data collection and analysis efforts
Coordination of coastal zone mapping activities among all the pri-mary agencies involved in coastal zone mapping must be through amechanism that has the means to monitor and ensure compliance. Struc-turally, the FGDC seems to be the appropriate body to oversee suchcoordination, although this committee has concerns about the effective-ness of current FGDC initiatives (see below). Either a restructured andempowered FGDC Marine and Coastal Spatial Data Subcommittee or asubcontract to an independent third party (e.g., the National Ocean Part-nership Program [NOPP]) could serve in this role. Irrespective of whetherthe FGDC subcommittee or a third party plays this role, there will be theneed for a dedicated staff member to locate and mine databases andreports, and to establish a Web-based focal point for agency activities.
Joint Offices for Thematic Coordination
In the 1980s and 1990s, NOAA and USGS supported a joint office forExclusive Economic Zone (EEZ) mapping to coordinate the activities ofthe two agencies and reduce inefficiencies and overlap in costly oceanmapping activities. Using the same rationale, this committee recommendsthat similar office(s) be established that would house one (Full-timeEquivalent) FTE from each of the representative agencies. The mission ofsuch office(s) would be to reduce programmatic, budgetary, and opera-tional overlap by identifying potential or existing areas of duplication aswell as opportunities for joint ventures, and then to coordinate the devel-
Copyright © National Academy of Sciences. All rights reserved.
A Geospatial Framework for the Coastal Zone: National Needs for Coastal Mapping and Chartinghttp://www.nap.edu/catalog/10947.html

108 A GEOSPATIAL FRAMEWORK FOR THE COASTAL ZONE
opment of joint plans, schedules, and budget initiatives. Existing needsfor such coordination in coastal mapping and charting thematic areaswould include federal activities in:
• Source data collection: topographic and bathymetric data acquisi-tion (USGS, NOAA, USACE);
• National blended topographic/bathymetric Digital ElevationModels/Digital Depth Models (National Geospatial-Intelligence Agency,NOAA, USGS);
• Derived products for shoreline mapping and coastal erosionhazards (USGS, NOAA, FEMA, USACE).
Specific Target Areas
It is clear from the above examples that significant synergy and costeffectiveness could be achieved if multiple agencies shared resources,data, and tools for endeavors that are similar or, in some cases, evenidentical. We have suggested mechanisms to help ensure high levels ofcollaboration and cooperation—we now suggest specific target areaswhere enhanced cooperation and collaboration are essential:
• Data acquisition. There should be an initial focus on coordinatingdata collection efforts at the land-water interface. Efforts should be madeto maximize the types of data acquired using at least topographic LIDARat low tide and, if possible, bathymetric LIDAR for shallow nearshorewaters. Consideration should also be given to collecting multispectral andhyperspectral data and aerial and satellite imagery, to maximize the areaof geographic coverage. In addition, planning should begin for a coordi-nated, interagency, high-resolution shoreline mapping program to estab-lish a baseline condition for periodic resurveys in order to quantifyshoreline change rates. These activities should involve FEMA, NASA,NOAA, USACE, and USGS.
• Derived products. A number of assessment efforts are underway thatcould benefit greatly from new or closer coordination through both formaland informal mechanisms involving at least the agencies indicated in thefollowing points.
—Shoreline change maps, to involve the Bureau of Land Manage-ment, FEMA, NOAA, USACE, and USGS.
—Habitat change maps, to involve EPA, FWS, NOAA Fisheries,NOAA-NOS, and USGS.
—Hazard vulnerability assessments, to involve FEMA, NOAA, andUSGS.
Copyright © National Academy of Sciences. All rights reserved.
A Geospatial Framework for the Coastal Zone: National Needs for Coastal Mapping and Chartinghttp://www.nap.edu/catalog/10947.html

INCREASING COASTAL MAPPING AND CHARTING EFFICIENCY 109
—Modeling of coastal inundation, to involve FEMA, NOAA, USACE,and USGS.
• Improved data exchange and transfer between federal, state, and localagencies, including improved dissemination of shoreline data via theInternet. FGDC should take a stronger role in supporting these community-based efforts (see Chapter 5).
• Research and development to investigate new technologies for shorelinemapping, (e.g., by using LIDAR). Here, NASA’s continued support fordevelopment of remote sensing and an increased emphasis by the NationalScience Foundation (NSF) and NOPP on coastal needs would go a longway toward improving the nation’s nearshore and coastal mapping capa-bilities. The private sector has also been a leader in innovation in this area.
Finally, we cannot ignore the fact that the extraordinarily large popu-lation base that depends on the coastal zone can also be a powerfulpolitical force. User-driven requests to Congress and to individual agenciesfrom the Coastal States Organization, the Coastal Zone ManagementProgram, and other state and local entities that would benefit from moreefficient and standardized federal efforts are an important element of anysuccessful mapping and charting support and coordination strategy.Expanded educational efforts stressing the value and utility of partneredfederal and federal/state efforts could be an effective way for the agenciesto sensitize Congress and users to the need for additional resources.
Copyright © National Academy of Sciences. All rights reserved.
A Geospatial Framework for the Coastal Zone: National Needs for Coastal Mapping and Chartinghttp://www.nap.edu/catalog/10947.html

110
7
Conclusions and Recommendations
This report describes the major coastal zone spatial informationrequirements of federal agencies and the user groups they support,identifies high-priority needs, evaluates the potential for meeting
those needs, and suggests steps to increase collaboration and ensure thatthe need for spatial information in the coastal zone is met in an efficientand timely manner. Information was gathered through a review of rele-vant literature and through interviews, presentations, and written sub-missions from a broad range of agency personnel, user groups, and otherindividuals working in the coastal zone. Due to the huge scope of coastalmapping activities throughout the nation, it is possible that some issueshave been overlooked. Nonetheless, we are confident that the major needsand activities of those involved in coastal mapping and charting in theUnited States are included, making it possible to identify gaps, overlaps,and major issues. The consistency and commonality of the needsexpressed and issues raised allowed the committee to develop a vision forthe future of U.S. coastal zone mapping and charting, and to maketargeted recommendations for achieving that vision.
COMMON NEEDS
While the range of coastal zone mapping and charting applications isas varied and diverse as the user community, there is a striking common-ality to certain elements of the community’s needs, encompassing:
• A consistent spatial framework for coastal data that allows a seam-
Copyright © National Academy of Sciences. All rights reserved.
A Geospatial Framework for the Coastal Zone: National Needs for Coastal Mapping and Chartinghttp://www.nap.edu/catalog/10947.html
CONCLUSIONS AND RECOMMENDATIONS 111
less transition from onshore to offshore, including clarification of offshoreboundary definitions and a framework to allow consistent shorelinedefinitions;
• Increased collection and availability of primary reference frameand thematic data, including shallow-water bathymetry, acoustic andsatellite imagery of the seafloor, bottom type, habitat distribution and clas-sification standards, land use, land cover, and coastal change data.
• Easy access to up-to-date digital, geospatial data, imagery, andmapping products;
• Compatibility among data formats, or standards and transforma-tion protocols that allow easy data exchange, and a means to evaluate theaccuracy of geospatial data; and
• Increased inter- and intra-agency communication, cooperation, andcoordination.
Addressing these critical issues, which are described in more detailbelow, will provide the basic reference frame, source data, and toolsnecessary to create the wide range of derivative products needed to effi-ciently and effectively manage the coastal zone.
A Consistent Spatial Framework
Any discussion of the coastal zone must acknowledge the uniqueaspects of this dynamic region. Coastal zone data collection and mappingpresent a special challenge because most coastal processes are both con-tinuous across the land-sea interface and are subject to constant naturaland anthropogenic change. The historical divisions between topographicmapping techniques onshore and bathymetric charting approaches off-shore, and the fundamentally different vertical reference frames used,have resulted in a serious incompatibility between existing maps andcharts. In particular, offshore features must be measured with respect tothe constantly changing tide level, adding considerable complexity tocoastal zone mapping and creating enormous difficulties in seamlesslymerging onshore and offshore data. A multiplicity of tidal datums, andtheir dynamic nature, has produced ambiguity in the definition of theshoreline, creating considerable confusion and difficulty in integratingcoastal zone studies and management. Additionally, the ever-shiftingland-water interface poses significant logistical challenges for mapping.Shallow water, waves, turbidity, and longshore currents all contribute tothe difficulty of operating vessels and equipment accurately and safely.These issues are all reflected in the unified call from the user communityfor a consistent spatial framework that allows a seamless transition fromonshore to offshore.
Copyright © National Academy of Sciences. All rights reserved.
A Geospatial Framework for the Coastal Zone: National Needs for Coastal Mapping and Chartinghttp://www.nap.edu/catalog/10947.html

112 A GEOSPATIAL FRAMEWORK FOR THE COASTAL ZONE
Primary Reference Frame and Thematic Data
A strong common thread was also found in the specific types of dataneeded. By far the greatest demand is for bathymetric data, to provide thefundamental geospatial framework to which all other offshore data canbe linked. Bathymetric data in the shallowest regions of the coastal zone,where logistical challenges make data collection more difficult, are essen-tial to provide the “missing link” between onshore topographic data andmore easily collected deeper bathymetric data. Derivative needs that werehighlighted by the community include bottom type, human-use, land-cover, and time-series data describing coastal change. Acoustic and satelliteimagery of the seafloor and onshore coastal zone would be particularlyuseful for understanding bottom types and habitat. The value of each ofthese derivative datasets would be greatly enhanced if referenced to acontinuous, seamless, onshore/offshore geospatial framework.
Access to Data and Products
The second most common need expressed by the user communitywas the desire for easy access to up-to-date, digital coastal geospatial data,images, and maps. The range of data collection activities related to coastalgeospatial data collection is staggering. Although some of these dataremain buried within the organizations that collected them, much isbecoming accessible through Web sites that allow public access to someor all of the data. There is not yet, however, a single Web portal to accesscoastal zone data. A search for all available data from a given region canbe a costly, frustrating, or even an impossible task. Whatever mechanismis established for better data distribution, the dynamic nature of coastalprocesses requires that the data be updated regularly and made availablein a very timely manner.
Data Compatibility and Accuracy
In order for the accessed data to be most useful, data collected bydifferent organizations at different times and using different sensors mustbe in forms that allow easy exchange and integration. The user commu-nity must also have a way to evaluate the accuracy of the data it accesses.This means that standards must be established, metadata provided, andtools developed for data transformation and data fusion.
Agency Communication, Cooperation, and Coordination
There is widespread demand by the user community for increasedinter- and intra-agency communication, cooperation, and coordination of
Copyright © National Academy of Sciences. All rights reserved.
A Geospatial Framework for the Coastal Zone: National Needs for Coastal Mapping and Chartinghttp://www.nap.edu/catalog/10947.html
CONCLUSIONS AND RECOMMENDATIONS 113
coastal mapping activities. Particularly in the area of data acquisition,which is the most costly aspect of mapping in the coastal zone, redun-dancy and lack of communication appear to exist. Of particular concernwere the large number of shoreline and habitat mapping efforts beingundertaken by different agencies and by different offices within agencies.Some overlap might be expected, given the large number of organizationsinvolved, the varied histories and mandates of these organizations, thecomplex definitions of shoreline and habitat, and the many other difficultissues facing those working in the coastal zone. Although not surprising,it is unquestionably inefficient and often counterproductive. In contrast,there are also a number of examples where laudable cooperation andcollaboration among agencies have been achieved. Examples of suchcollaborative efforts include the National Oceanic and AtmosphericAdministration (NOAA) and U.S. Geological Survey (USGS) Bathy/Topo/Shoreline Demonstration Project, NOAA-Office of Coast Survey (OCS)/USGS efforts to maximize survey value by collecting data relevant to bothorganizations on a single cruise, USGS/National Park Service (NPS) col-laborative mapping programs, the Environmental Protection Agency’s(EPA) collaboration with NOAA, USGS, Fish and Wildlife Service (FWS),and a number of state agencies to determine national water quality condi-tions, and numerous NOAA-Coastal Services Center (CSC) initiativeswith respect to standards and data distribution. These positive examplesare often the result of fortuitous information exchanges between the rightpeople at the right moment. To build on these successes, mechanisms arerequired to promote full information exchange and make collaborationand cooperation the rule rather than the exception.
A VISION FOR THE FUTURE
The commonality of the issues raised and the needs expressed formsthe basis for a vision for the future of coastal zone mapping and charting.This vision requires the development of an integrated and coordinatedcoastal mapping strategy for the nation, based on a foundation—a refer-ence frame—on which all data collection, analyses, and products can bebuilt. To establish this foundation, there must be a national effort to col-lect the information and develop the tools necessary to seamlessly blendtopographic (onshore) and bathymetric (offshore) data. These data andtools will permit the establishment of a nationally coordinated digitaldatabase across the land-sea interface consisting of seamless elevation anddepth data that can be referenced or transformed to common vertical andhorizontal datums.
This database will provide the basic geospatial framework for all sub-sequent data products, much like the USGS topographic sheet basemaps
Copyright © National Academy of Sciences. All rights reserved.
A Geospatial Framework for the Coastal Zone: National Needs for Coastal Mapping and Chartinghttp://www.nap.edu/catalog/10947.html
114 A GEOSPATIAL FRAMEWORK FOR THE COASTAL ZONE
have formed the foundation for a multitude of subsequent studies. Unlikethe USGS topographic sheets, however, a coastal zone database must takeaccount of tidal variation and be able to reconcile the differences betweenland and offshore datums.
The committee’s vision for the future of coastal zone mapping andcharting also includes mechanisms to ensure communication among allagencies and entities involved in order to minimize redundancy of effortsand maximize operational efficiencies. There will be national—and perhapsinternational—standards and protocols for data collection and metadatacreation and readily available tools for data transformation and integra-tion. With these tools the user community will be able to evaluate theaccuracy and timeliness of data, change scales and projections, and seam-lessly merge disparate datasets. The database and data integration toolswill be easily accessible to all users, public and private, from a singledigital portal accessible through the Internet.
This is a bold vision but at the same time an obvious one. Who wouldargue with a system that is efficient and produces easily accessible, fullyinterchangeable, accurate, and timely data? The vision may be simple todefine, but its implementation will be anything but simple. The recom-mendations that follow are intended to address the root causes of theexisting problems, help overcome the barriers to their solution, and beginto turn this vision into reality.
RECOMMENDATIONS
A Seamless Bathymetric/Topographic Dataset forAll U.S. Coastal Regions
One of the most serious impediments to coastal zone management isthe inability to produce accurate maps and charts so that objects and pro-cesses can be seamlessly tracked across the land-water interface. Differ-ences between agency missions, onshore topographic versus offshorebathymetric mapping techniques, differing vertical reference frames, andthe inherent difficulty of collecting source data in the surf and intertidalzones have combined to produce this fundamental incompatibility. It willbe impossible to properly understand processes, undertake planning, andestablish boundaries in the coastal zone while two sets of disparate andnon-convergent maps and charts are being separately maintained.
The barrier to the production of continuous integrated mappingproducts across the land-sea interface is the inherent difference in the hori-zontal and vertical reference surfaces (datums) and projections used formaps and charts. Horizontal datum and projection issues can be readilyresolved with existing transformation tools, although these tools must be
Copyright © National Academy of Sciences. All rights reserved.
A Geospatial Framework for the Coastal Zone: National Needs for Coastal Mapping and Chartinghttp://www.nap.edu/catalog/10947.html

CONCLUSIONS AND RECOMMENDATIONS 115
made more readily available to the user community. However, verticaldatum issues present a serious challenge. In order to seamlessly combineoffshore and onshore data, vertical datum transformation models must bedeveloped. These models depend on the establishment and maintenanceof a series of real-time tidal measuring stations, the development ofhydrodynamic models for coastal areas around the nation, and the devel-opment of protocols and tools for merging bathymetric and topographicdatasets.
The Tampa Bay Bathy/Topo/Shoreline Demonstration Project, a col-laborative effort between NOAA and the USGS, has developed a suite ofsuch tools (called Vdatum) and has demonstrated the feasibility of gener-ating a seamless bathymetric/topographic dataset for the Tampa Bay area.This project has also demonstrated both the inherent complexity of suchan undertaking and the substantial benefits that arise from interagencycollaboration and coordination.
Recommendation 1: In order to combine onshore and offshore datain a seamless geodetic framework, a national project to applyVdatum tools should be initiated. This will involve the collectionof real-time tide data and the development of more sophisticatedhydrodynamic models for the entire U.S. coastline, as well as theestablishment of protocols and tools for merging bathymetric andtopographic datasets.
This dataset must be documented and disseminated in such a waythat it can become the base for a wide range of applications, including thedefinition of local, regional, or national shorelines. As a result of this effort,it will be possible to merge data collected either on land or offshore into acommon geodetic reference frame, while at the same time allowingapplication-specific maps and charts to be generated that maintain tradi-tional tidal-based datums (e.g., for navigational charts) or orthometricallybased datums (e.g., for topographical maps).
Shoreline Definition Protocols
Numerous agencies have identified the lack of a consistently definednational shoreline as a major barrier to informed decision making in thecoastal zone. While a consistent shoreline is certainly desirable, many dif-ferent definitions of the shoreline remain embedded in local, state, andfederal laws, making it impractical to call for a single “National Shore-line.” Rather, the key to achieving a consistent shoreline is the seamlessgeodetic framework referred to in Recommendation 1. With a seamlessbathymetric/topographic dataset across the land-water interface, appro-
Copyright © National Academy of Sciences. All rights reserved.
A Geospatial Framework for the Coastal Zone: National Needs for Coastal Mapping and Chartinghttp://www.nap.edu/catalog/10947.html

116 A GEOSPATIAL FRAMEWORK FOR THE COASTAL ZONE
priate difference or tidal models, and consistent horizontal and verticalreference frames, any shoreline definition can be transformed and inte-grated within the common framework. The Vdatum tool kit and associatedWeb sites will be the key to establishing internally consistent shorelinesbetween and among disparate surveys and studies.
Recommendation 2: To achieve national consistency, all partiesshould define their shorelines in terms of a tidal datum, allowingvertical shifts to be calculated between and among the variousshoreline definitions, while at the same time permitting differentagencies and users to maintain their existing legal shoreline defini-tions. In situations where legislation or usage does not preclude it,the committee recommends that the internationally recognized shore-line established by NOAA’s National Geodetic Survey be adopted.
The committee encourages the Federal Geographic Data Committee’s(FGDC) Marine and Coastal Spatial Data Subcommittee to pursue imple-mentation of this recommendation.
Easy Access to Timely Data
Easy access to timely data is an essential component of effectivecoastal zone management. Many agencies have created Web sites thatoffer access to data in a variety of forms as well as data manipulationtools. However, these sites still represent only a small percentage of exist-ing coastal zone data.
Recommendation 3: A single Web portal should be established tofacilitate access to all coastal mapping and charting data and derivedproducts. The site should be well advertised within federal andstate agencies, state and local governments, academic institutions,nongovernmental organizations and conservation groups, and toother potential users. The portal should work well with all Webbrowsers and on all computer platforms, to make it easily acces-sible to all users.
The single portal is not intended to host all coastal data. Rather, itshould serve as a focal point that links to many distributed databasesmaintained by individual agencies or organizations. This site would rep-resent the one place where users, particularly new users, could begin theirsearch for coastal data and derived products. A single, easily accessibledata portal with appropriate data manipulation tools should also promotethe timely entry and retrieval of data. Coordination of such a site logically
Copyright © National Academy of Sciences. All rights reserved.
A Geospatial Framework for the Coastal Zone: National Needs for Coastal Mapping and Chartinghttp://www.nap.edu/catalog/10947.html

CONCLUSIONS AND RECOMMENDATIONS 117
falls under the purview of the FGDC, and is fully consistent with theGeospatial One-Stop concept.
Data Integration, Interchangeability, and Accuracy
Providing easy access to data through a single Web portal is a criticalstarting point for addressing the needs of the coastal zone community.However, users must also be able to combine and integrate data collectedby different agencies using a range of sensors and often based on differentdatums or projections. Users must also be able to assess the attributes andaccuracy of the data provided. Integration of data and assessment of dataquality are made possible by the establishment of data and metadatastandards and the application of tools for data transformation.
Recommendation 4: All thematic data and other value-addedproducts should adhere to predetermined standards to make themuniversally accessible and transferable through a central Web portal.All sources should supply digital data accompanied by appropriatemetadata.
The FGDC is in the process of establishing a series of standards forthe National Spatial Data Infrastructure (NSDI) that will be applicable toall coastal zone data. Unfortunately, implementation of the NSDI con-tinues to be problematic for the coastal/marine community due to highlyvariable levels of commitment by different agencies and insufficientincentives to fully implement its principles. This may, in part, be due tothe structural and budgetary barriers discussed in Chapter 6, the inabilityof a single set of standards to serve all applications, and disconnectsbetween those developing the standards and the user community. Oneapproach to addressing this issue is for additional involvement by theprivate sector.
Recommendation 5: The private sector should be more involved indeveloping and applying data standards and products. Agency pro-curement requirements can be used to encourage the private sectorto deliver needed products in a timely fashion.
The committee is aware of numerous examples where private-sectorinitiatives established well-accepted and easily used data protocols—ineffect de facto standards—that significantly enhance the effectiveness ofdata products. The private sector is often capable of greater speed andefficiency in the adoption of standards and tools than its governmentagency counterparts. Access to data, metadata, and data standards must
Copyright © National Academy of Sciences. All rights reserved.
A Geospatial Framework for the Coastal Zone: National Needs for Coastal Mapping and Chartinghttp://www.nap.edu/catalog/10947.html

118 A GEOSPATIAL FRAMEWORK FOR THE COASTAL ZONE
be complemented by readily available tools to easily convert between andamong different data formats, scales, and projections.
Recommendation 6: Government agencies and the private sectorshould continue to develop tool kits for coastal data transformationand integration. This will facilitate data analyses and the produc-tion of a range of value-added products. The tools should be acces-sible through the Web portal.
Documentation of the tools and techniques used to process data mustalso be provided to help the user community understand the limitationsand appropriate uses of various datasets. A variety of training coursesand workshops will be essential to provide end-users with the knowledgeand tools necessary for intelligent application of the available data.
Improved Coordination and Collaboration
Any activity that involves multiple federal, state, and local agencies,academic researchers, and the private sector has the potential for redun-dancy and overlap of effort. This is amplified when the activity requiresexpensive platforms, technologies, and sensors. In the area of coastal zonemapping and charting, the large number of agencies involved, their dif-fering histories, the breadth of their mandates, and the complexity of thetask offer ample opportunities for redundancy and inefficiency. Becausedata acquisition is unquestionably the most expensive aspect of coastalzone mapping, elimination of redundancy and overlap in this area is likelyto yield large savings. Ensuring that all relevant agencies are aware of oneanother’s activities will be an important first step toward improved coor-dination.
Recommendation 7: All federally funded coastal zone mapping andcharting activities should be registered at a common, publicly avail-able Web site. This combined registry should be accessible throughthe single Web portal for coastal zone information.
Each entry in the registry should include a description of the map-ping activity, its location and purpose, the agency collecting the data, thetools to be used, the scales at which data will be collected, and other rel-evant details. Non-federally funded agencies conducting coastal mappingactivities should be encouraged to register their activities at the same site.A section of the registry should be dedicated to descriptions of plannedbut unfunded coastal mapping activities, as well as a prioritized compila-tion of coastal areas where surveying would be particularly helpful tostate or local agencies. Technically, components of such registration may
Copyright © National Academy of Sciences. All rights reserved.
A Geospatial Framework for the Coastal Zone: National Needs for Coastal Mapping and Chartinghttp://www.nap.edu/catalog/10947.html
CONCLUSIONS AND RECOMMENDATIONS 119
already be required under Office of Management and Budget (OMB)Exhibit 300, but Recommendation 7 suggests a considerably expandedeffort focused on making all federally funded coastal zone mapping effortsmore widely known.
Once implemented, this registry could serve as the focal point fornational coordination of geospatial data collection and analysis efforts.Individual agencies would continue to set their own priorities, but throughthe registry process any overlapping efforts could be quickly identifiedand avoided. The registry would also facilitate increased efficiency byhighlighting opportunities for “incremental” surveys, where one agencytakes advantage of the mapping activities of another agency in a region ofcommon interest by providing a small amount of additional funding toachieve an additional objective. Such “piggyback” collaborative effortswould allow additional agencies to acquire data that meet their needs atminimal incremental cost.
Recommendation 8: To be effective, coordination should be carriedout among all the primary agencies involved in coastal zone map-ping; it should be mediated by a body that has the authority andmeans to monitor and ensure compliance; and it should involvepeople who are knowledgeable enough to identify the most criticalissues.
Structurally, the FGDC appears to be an appropriate body to overseesuch coordination, but many concerns remain about its effectiveness.Some restructuring of FGDC, and perhaps an empowered Marine andCoastal Spatial Data Subcommittee, will be required to allay these con-cerns. In this light the committee endorses the recommendations of arecent design study team that calls for major structural and managementchanges for the FGDC (FGDC, 2000). A less appealing alternative mightbe either a new government office or an extra-governmental body chargedwith establishing oversight of all national coastal mapping and chartingactivities.
Recommendation 9: Whichever body is charged to carry out theneeded coordination activities, dedicated staff personnel should beassigned to maintain the Web portal (Recommendation 3), theactivities registry (Recommendation 7), and associated Web sites,and to proactively search for areas where efforts can be coordinated,supplemented, or combined to increase efficiency.
Specific areas where better coordination among federal agencies isurgently needed (with the agencies likely to be involved listed in paren-theses) include the following:
Copyright © National Academy of Sciences. All rights reserved.
A Geospatial Framework for the Coastal Zone: National Needs for Coastal Mapping and Chartinghttp://www.nap.edu/catalog/10947.html

120 A GEOSPATIAL FRAMEWORK FOR THE COASTAL ZONE
• High-resolution topographic and bathymetric data acquisition atthe land-water interface, including aerial and satellite imagery, LightDetection and Ranging (LIDAR) surveys, and bathymetric surveys (FederalEmergency Management Agency [FEMA], National Aeronautics andSpace Administration [NASA], NOAA, U.S. Army Corps of Engineers[USACE], and USGS).
• National seamless topographic/bathymetric Digital ElevationModels/Digital Depth Models (National Geospatial-Intelligence Agency[NGA], NOAA, and USGS).
• Derived products for mapping shoreline change (Bureau of LandManagement [BLM], FEMA, NOAA, USACE, and USGS), habitat change(EPA, FWS, NOAA Fisheries, NOAA-National Ocean Service, and USGS),hazard vulnerability (FEMA, NOAA, and USGS), and coastal inundation anderosion hazards (FEMA, NOAA, USACE, and USGS).
Increased Data Collection
There is a widespread need for more and better data to be collected inthe coastal zone. Growing pressure from a variety of constituencies (e.g.,fisheries, shipping and navigation, Law of the Sea implementers, resourcemanagers) will lead to ever-greater demands for useful information. Thesingle most consistently cited need among the agencies and the user com-munity is for enhanced bathymetric data, particularly in very shallowcoastal waters. These data provide the basic geospatial framework foralmost all other studies and are a key component for derived productssuch as offshore habitat maps.
Recommendation 10: The fundamental reference frame data for theentire coastal zone should be collected, processed, and made avail-able. The dynamic nature of the coastal zone requires that thereshould be specific plans for repeat surveys over time. The impor-tant role of qualified private survey contractors in coastal zonemapping and charting should also be acknowledged. Much of thework done by this sector is contracted by government agencies, andaccordingly the prioritization and tracking of surveys can be coor-dinated by the body called for in Recommendation 8.
Given the number of agencies and private-sector companies involvedin coastal mapping, and their disparate missions and budget directives, itis unrealistic to expect agreement on a single, unified and prioritizednational mapping initiative. While each agency has responsibility for itsown mapping priorities, a strong and enforceable mechanism for trackingand coordinating existing, ongoing, and planned mapping efforts (as out-
Copyright © National Academy of Sciences. All rights reserved.
A Geospatial Framework for the Coastal Zone: National Needs for Coastal Mapping and Chartinghttp://www.nap.edu/catalog/10947.html
CONCLUSIONS AND RECOMMENDATIONS 121
lined in Recommendation 7) would increase efficiency to the point whereconsiderably more survey work could be carried out for each dollar spent.Inconsistencies in scale and resolution for new data collection efforts couldbe resolved by the coastal zone coordinating body called for in Recom-mendation 8. After surveying agency needs, the coordinating body coulddetermine whether the incremental value of collecting data over a largerarea or in a slightly different form (e.g., at higher resolution) warrantsmodification of a planned surveying effort.
Severe challenges remain for those attempting to map the coastalzone. As well as the fundamental conceptual problem of reconcilingterrestrial and tidal datums, there are also a number of logistical chal-lenges, including shallow depths, waves, turbid waters, and longshorecurrents, that make it difficult to operate survey vessels and other equip-ment safely, accurately, and efficiently.
Recommendation 11: New remote sensing and in situ technologiesand techniques should be developed to help fill critical data gaps atthe land-water interface.
There are a number of promising new technologies and techniques:
• Integrated bathymetric/topographic LIDAR, multispectral, hyper-spectral, and photographic imaging systems;
• Sensors deployed on autonomous underwater vehicles;• “Opportunistic” mapping using volunteer recreational boats
equipped with specialized mapping sensors approved by issuing agencies;• Autonomous bottom-crawling vehicles;• Improved satellite imaging capabilities; and• Data fusion capabilities.
Continued support from funding agencies for development of coastalremote sensing tools, combined with an increased emphasis on coastalneeds, will greatly accelerate the development and implementation ofthese critically needed technologies. The private sector can play a majorrole in addressing this recommendation.
Underestimation of the importance of the coastal zone threatens thewell-being of the nation, and those charged with management and main-tenance of this critical environment carry tremendous demands andresponsibilities. In order to understand and address the effects of com-plex natural and anthropogenic forces in the coastal zone, a holisticmultidisciplinary framework must be developed to account for the inter-connectivity of processes within the system. At the base of this frameworkis accurate geospatial information about the locations of important features
Copyright © National Academy of Sciences. All rights reserved.
A Geospatial Framework for the Coastal Zone: National Needs for Coastal Mapping and Chartinghttp://www.nap.edu/catalog/10947.html

122 A GEOSPATIAL FRAMEWORK FOR THE COASTAL ZONE
and processes, both onshore and offshore. The recommendations andstrategies outlined above call for the establishment of a consistent geo-spatial framework and the application of innovative new acquisition,integration, and data management technologies that should allow coastalzone scientists, engineers, and managers to efficiently produce easilyaccessible, fully interchangeable, accurate, timely, and useful geospatialdata and mapping products that seamlessly extend across the coastal zone.The recommendations also suggest simple mechanisms to enhance col-laboration and cooperation among those charged with acquiring data inthis complex region. These mechanisms should facilitate efficiency gainsthat will allow most of the nation’s coastal zone to be mapped in a timelymanner. While simple in concept, implementation of the suggested strat-egies will require a focused effort on the part of the coastal zone commu-nity. If implemented, however, the committee believes that a major stepwill have been taken toward assuring the long-term well-being of thecoastal zone.
Copyright © National Academy of Sciences. All rights reserved.
A Geospatial Framework for the Coastal Zone: National Needs for Coastal Mapping and Chartinghttp://www.nap.edu/catalog/10947.html
123
References
AAPA (American Association of Port Authorities), 2003. Marine Navigation Facts. Online;available at http://www.aapa-ports.org/govrelations/mnsc_bkrnd.htm; accessedAugust 2003.
Birkemeier, W.A., and C. Mason, 1984. The CRAB: A unique nearshore surveying vehicle.Journal of Surveying Engineering, 110: 1-7.
CSC (Coastal Services Center), 1999. Highlights of the 1999 Coastal Resource ManagementCustomer Survey. NOAA Coastal Services Center. Online; available at http://www.csc.noaa.gov/survey; accessed August 2003.
CSC (Coastal Services Center), 2001. How Much is This Beach Worth? Calculating the Valueof the Environment. Coastal Services, 4(1): 4-5.
CSC (Coastal Services Center), 2002. 2002 Coastal Resource Management Customer Survey:Preliminary Results. NOAA Coastal Services Center. Online; available at http://www.csc.noaa.gov/survey/02survey.pdf; accessed October 2003.
CSO (Coastal States Organization), 2002. Revised Recommendations from the Coastal StatesOrganization to the U.S. Commission on Ocean Policy, October 25, 2002. Washington, D.C.:Coastal States Organization, 41pp.
DeBow, S.P., Jr., C.B. Greenawalt, and J. Ferguson, 2000. How NOAA Uses Private Industry toSupport Nautical Charting. Online; available at http://chartmaker.ncd.noaa.gov/hsd/IHR_June_00.htm; accessed October 2003.
Denny, J.F., and W.W. Danforth, 2002. USGS shallow water mapping surveys using an inter-ferometric sonar system. In: Multibeam Echosounding—the Total Inshore Solution? Pro-ceedings of the Hydrographic Society, United Kingdom, Southern Region Workshop,Special Publication 48.
Di, K., R. Ma, and R. Li, 2003. Geometric processing of IKONOS geo stereo imagery forcoastal mapping applications. Journal of Photogrammetric Engineering and Remote Sensing,69: 873-879.
Douglas, B.C., 1995. U.S. National Report to IUGG, 1991-1994. Reviews of Geophysics, 33 Supple-ment. Online; available at http://www.agu.org/revgeophys/dougla01/dougla01.html; accessed October 2003.
Copyright © National Academy of Sciences. All rights reserved.
A Geospatial Framework for the Coastal Zone: National Needs for Coastal Mapping and Chartinghttp://www.nap.edu/catalog/10947.html

124 A GEOSPATIAL FRAMEWORK FOR THE COASTAL ZONE
EPA (U.S. Environmental Protection Agency), 2001. National Coastal Condition Report. EPA-620/R-01/005. Washington, D.C.: U.S. Environmental Protection Agency, Office ofResearch and Development and Office of Water, 204 pp. Online; available at http://www.epa.gov/owow/oceans/nccr/index.html; accessed August 2003.
FGDC (Federal Geographic Data Committee), 1995. Development of a National Digital Geo-spatial Data Framework. Washington, D.C.: U.S. Government Printing Office. Online;available at http://www.fgdc.gov/framework/framdev.html; accessed October 2003.
FGDC (Federal Geographic Data Committee), 2000. Improving Federal Agency Geospatial Coor-dination. Washington, D.C.: FGDC, 24 pp. Online; available at http://www.fgdc.gov/fgdc/dst511.doc; accessed October 2003.
FGDC (Federal Geographic Data Committee), 2002. Geospatial One-Stop: Office of Managementand Budget Capital Asset Plan (Exhibit 300). Washington, D.C.: FGDC, 35 pp. Online;available at http://www.fgdc.gov/geo-one-stop/docs/one_stop.pdf; accessed Octo-ber 2003.
Fowler, C., and E. Treml, 2001. Building a marine cadastral information system for the UnitedStates–A case study. Computers, Environment and Urban Systems, 25: 493-507.
Good, J.W., and D. Sowers, 1999. Benefits of Geographic Information Systems for State andRegional Ocean Management. Final Report to the Coastal Services Center, NationalOceanic and Atmospheric Administration. Sea Grant Special Report 99-01. Corvallis:Oregon State University.
Harris, M., K. Shaw, F. McCreedy, R. Ladner, R. Wilson, E. Warner, U. Katikaneni, and J.Sample, 2003. Access to Environmental Data via NRL’s Geospatial Information Database.Proceedings of the Maritime Reconnaissance for NATO’s Recognized EnvironmentalPicture 2003 Conference, La Spezia, Italy, NRL/PP/7440-03-1014.
Heinz Center (The H. John Heinz III Center for Science, Economics and the Environment),2000a. The Hidden Costs of Coastal Hazards. Washington, D.C.: Island Press, 220 pp.
Heinz Center (The H. John Heinz III Center for Science, Economics and the Environment),2000b. Evaluation of Erosion Hazards. Washington, D.C.: Island Press, 205 pp.
Heinz Center (The H. John Heinz III Center for Science, Economics and the Environment),2002. Human Links to Coastal Disasters. Washington, D.C.: Island Press, 139 pp.
Hicks, S.D., R.L. Sillcox, C.R. Nichols, B. Via, and E.C. McCray, 2000. Tide and Current Glossary.Washington, D.C.: National Oceanic and Atmospheric Administration, National OceanService, Center for Operational Oceanographic Products and Services, 29 pp.
Hinrichsen, D., 1999. Coastal Waters of the World: Trends, Threats, and Strategies. Washington,D.C.: Island Press.
IHB (International Hydrographic Bureau), 2001. National Maritime Policies and HydrographicServices. Monaco: International Hydrographic Bureau, Publication M-2: I-1–I-7.
IPCC (Intergovernmental Panel on Climate Change), 2001. Climate Change 2001: The ScientificBasis. Contribution of Working Group 1 to the Third Assessment Report of the Intergovern-mental Panel on Climate Change. Cambridge: Cambridge University Press, 881 pp.
Jakobsson, M., L.A. Mayer, and A. Armstrong. 2003. Analysis of data relevant to extendinga coastal state’s jurisdiction over the seafloor under Law of the Sea Article 76. Inter-national Hydrographic Review, 4(1): 2-18.
Kostylev, V.E., B.J. Todd, G.B.J. Fader, R.C. Courtney, G.D.M. Cameron, and R.A. Pickrill,2001. Benthic habitat mapping on the Scotian Shelf based on multibeam bathymetry,surficial geology and seafloor photographs. Marine Ecology Progress Series, 219: 121-137.
Li, R., R. Ma, and K. Di, 2002. Digital tide-coordinated shoreline. Journal of Marine Geodesy,25(1/2): 27-36.
Li, R., K.W. Bedford, C.K. Shum, J.R. Ramirez, A. Zhang, and A. Elaksher, 2003. Integration ofMulti-source Spatial Information for Coastal Management and Decision Making. Proceed-ings of the 2003 NSF Digital Government Conference, Boston, May 18-21, 2003: 67-70.
Copyright © National Academy of Sciences. All rights reserved.
A Geospatial Framework for the Coastal Zone: National Needs for Coastal Mapping and Chartinghttp://www.nap.edu/catalog/10947.html
REFERENCES 125
Lockwood, M., and C. Fowler, 2000. Significance of coastal and marine data within the con-text of the United States National Spatial Data Infrastructure. Pp. 261-278 in: D.J. Wright,and D.J. Bartlett, (eds.), Marine and Coastal Geographical Information Systems. ResearchMonographs in Geographical Information Systems. London: Taylor and Francis.
Mayer, L.A., M. Jakobsson, and A. Armstrong, 2002. The Compilation and Analysis of DataRelevant to a U.S. Claim Under United Nations Law of the Sea Article 76: A Prelimi-nary Report to Congress. Online; available at http://www.ccom.unh.edu/unclos/;accessed August 2003.
NOAA (National Oceanic and Atmospheric Administration), 1998. 1998 Year of the Ocean:Ocean Energy and Minerals: Resources for the Future. In: Year of the Ocean DiscussionPapers, NOAA Office of the Chief Scientist, Washington, D.C., 30 pp.
NOAA (National Oceanic and Atmospheric Administration), 1999. NOAA FY2000 BudgetRequest. Washington D.C.: NOAA, 196 pp.
NOAA (National Oceanic and Atmospheric Administration), 2002. Sanctuaries Science,Evaluation of Status and National Needs. Washington, D.C.: National Marine SanctuaryPrograms, 75 pp.
NRC (National Research Council), 1990. Managing Coastal Erosion. Washington, D.C.:National Academy Press, 182 pp.
NRC (National Research Council), 1992. Working Together in the EEZ: Final Report of theCommittee on Exclusive Economic Zone Information Needs. Washington, D.C.: NationalAcademy Press, 108 pp.
NRC (National Research Council), 1993. Toward a Coordinated Spatial Data Infrastructure forthe Nation. Washington, D.C.: National Academy Press, 171 pp.
NRC (National Research Council), 1994a. Charting a Course into the Digital Era: Guidance forNOAA’s Nautical Charting Mission. Washington, D.C.: National Academy Press, 133 pp.
NRC (National Research Council), 1994b. Promoting the National Spatial Data InfrastructureThrough Partnerships. Washington, D.C.: National Academy Press, 113 pp.
NRC (National Research Council), 1995a. Beach Nourishment and Protection. Washington, D.C.:National Academy Press, 352 pp.
NRC (National Research Council), 1995b. A Data Foundation for the National Spatial Data Infra-structure. Washington, D.C.: National Academy Press, 45 pp.
NRC (National Research Council), 2000. Clean Coastal Waters: Understanding and Reducing theEffects of Nutrient Pollution. Washington, D.C.: National Academy Press, 405 pp.
NRC (National Research Council), 2001. National Spatial Data Infrastructure Partnership Pro-grams: Rethinking the Focus. Washington, D.C.: National Academy Press, 82 pp.
NRC (National Research Council), 2002. Effects of Trawling and Dredging on Seafloor Habitat.Washington, D.C.: National Academy Press, 136 pp.
NRC (National Research Council), 2003a. National Needs for Coastal Mapping and Charting:Interim Report. Washington, D.C.: The National Academies Press, 84 pp.
NRC (National Research Council), 2003b. Weaving a National Map: Review of the U.S. GeologicalSurvey Concept of The National Map. Washington, D.C.: The National Academies Press,128 pp.
NRC (National Research Council), 2003c. Environmental Information for Naval Warfare. Wash-ington, D.C.: The National Academies Press, 203 pp.
O’Brien, T., 1997. Experience using an innovative under keel clearance prediction system inAustralian ports. Port Technology International, 6: 165-169.
OMB (Office of Management and Budget), 2002. Circular No. A-16 Revised: Coordination ofGeographic Information and Related Spatial Data Activities. Online; available at http://www.whitehouse.gov/omb/circulars/a016/a016_rev.html; accessed October 2003.
Copyright © National Academy of Sciences. All rights reserved.
A Geospatial Framework for the Coastal Zone: National Needs for Coastal Mapping and Chartinghttp://www.nap.edu/catalog/10947.html

126 A GEOSPATIAL FRAMEWORK FOR THE COASTAL ZONE
Parker, B., D. Milbert, R. Wilson, K. Hess, J. Bailey, and C. Fowler, 2001. A Tampa BayBathymetric/Topographic Digital Elevation Model with Internally Consistent Shore-lines for Various Datums. In: Proceedings Hydro 2001 (SP42). Norwich, U.K.: TheHydrographic Society, 11 pp.
Quinn, R., 2000. Bathymetry with Airborne Lidar & Videography. Backscatter; ObservingAquatic Environments. Alliance for Marine Remote Sensing Association, 11(2): 8-17.
Reed, M.W., 2000. The Dinkum Sands Case. Pp. 133-160 in: Shore and Sea Boundaries. Volume3. U.S. Government Printing Office, Washington D.C.
Ross, T., and N. Lott, 2000. A Climatology of Recent Extreme Weather and Climate Events. NOAA-NESDIS National Climatic Data Center, Technical Report No. 2000-02, 17 pp.
Sandwell, D.T., S.T. Gille, and W.H.F. Smith (eds.), 2002. Bathymetry from Space: Oceanography,Geophysics, and Climate. Bethesda, Md.: Geoscience Professional Services, 24 pp.
Thormahlen, L., 1999. Boundary Development on the Outer Continental Shelf. OCS Report MMS99-0006. Washington, D.C.: U.S. Department of the Interior, Minerals ManagementService, 12 pp.
UN (United Nations), 1983. The Law of the Sea, Official Text of the United Nations Conven-tion on the Law of the Sea with Annexes and Index. Publication Sales No. E.83.V.5.New York: United Nations.
USDOT (U.S. Department of Transportation), 1999. An Assessment of the U.S. Marine Trans-portation System: A Report to Congress. Washington, D.C., 122 pp.
USGS (U.S. Geological Survey), 2001. The National Map: Topographic Mapping for the 21st Cen-tury. Reston, VA. Online; available at http://nationalmap.usgs.gov/report/national_map_report_final.pdf; accessed September 2003.
Ward, R., C. Roberts, and R. Furnass, 2000. Electronic Chart Display and Information Systems[ECDIS]: State-of-the-Art in Nautical Charting. Pp. 149-161 in: D.J. Wright, and D.J.Bartlett, (eds.), Marine and Coastal Geographical Information Systems. Research Mono-graphs in Geographical Information Systems. London: Taylor and Francis.
Copyright © National Academy of Sciences. All rights reserved.
A Geospatial Framework for the Coastal Zone: National Needs for Coastal Mapping and Chartinghttp://www.nap.edu/catalog/10947.html

APPENDIXES
Copyright © National Academy of Sciences. All rights reserved.
A Geospatial Framework for the Coastal Zone: National Needs for Coastal Mapping and Chartinghttp://www.nap.edu/catalog/10947.html

Copyright © National Academy of Sciences. All rights reserved.
A Geospatial Framework for the Coastal Zone: National Needs for Coastal Mapping and Chartinghttp://www.nap.edu/catalog/10947.html

129
Appendix A
Agency Needs and Activities
Summary of the unfulfilled needs and activities identified by thoseagencies and entities charged with assessment and mapping of coastalareas, and/or the production of coastal mapping data and products.
Identified Unfulfilled Needs for Activities Related to CoastalAgency or Entity Coastal Mapping and Charting Mapping Data and Products
Department of CommerceNational Oceanic and Atmospheric AdministrationNational Environmental Satellite, Data and Information Service (NESDIS)
NESDIS • Nationally consistent ` • Data from environmental buoysshoreline definition • Wetland characterization
• Harmful Algal Bloom (HAB)Observing System
• Satellite-based environmentalremote sensing systems forenvironmental data
• Coastal Relief Model• Bathymetric and geophysical
datasets• Real-time meteorological data• Oceanographic data• Tsunami data
Copyright © National Academy of Sciences. All rights reserved.
A Geospatial Framework for the Coastal Zone: National Needs for Coastal Mapping and Chartinghttp://www.nap.edu/catalog/10947.html
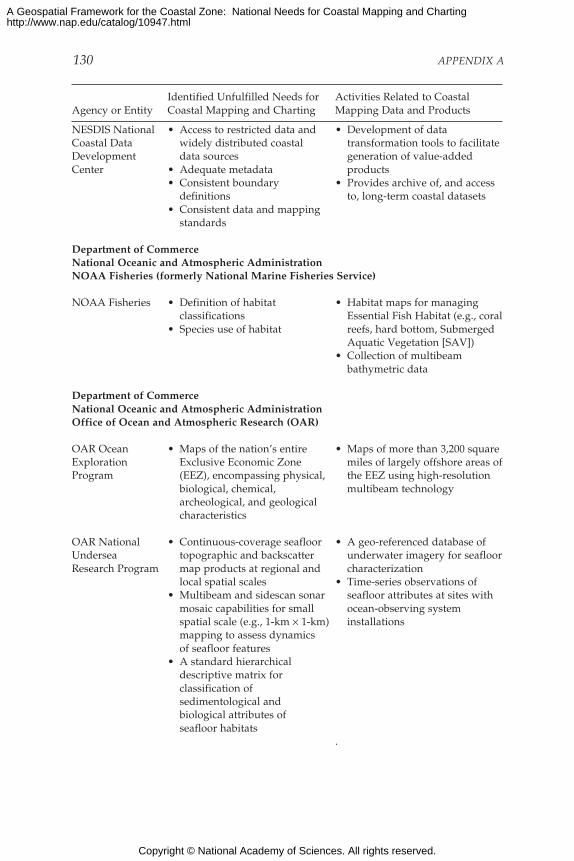
130 APPENDIX A
NESDIS National • Access to restricted data and • Development of dataCoastal Data widely distributed coastal transformation tools to facilitateDevelopment data sources generation of value-addedCenter • Adequate metadata products
• Consistent boundary • Provides archive of, and accessdefinitions to, long-term coastal datasets
• Consistent data and mappingstandards
Department of CommerceNational Oceanic and Atmospheric AdministrationNOAA Fisheries (formerly National Marine Fisheries Service)
NOAA Fisheries • Definition of habitat • Habitat maps for managingclassifications Essential Fish Habitat (e.g., coral
• Species use of habitat reefs, hard bottom, SubmergedAquatic Vegetation [SAV])
• Collection of multibeambathymetric data
Department of CommerceNational Oceanic and Atmospheric AdministrationOffice of Ocean and Atmospheric Research (OAR)
OAR Ocean • Maps of the nation’s entire • Maps of more than 3,200 squareExploration Exclusive Economic Zone miles of largely offshore areas ofProgram (EEZ), encompassing physical, the EEZ using high-resolution
biological, chemical, multibeam technologyarcheological, and geologicalcharacteristics
OAR National • Continuous-coverage seafloor • A geo-referenced database ofUndersea topographic and backscatter underwater imagery for seafloorResearch Program map products at regional and characterization
local spatial scales • Time-series observations of• Multibeam and sidescan sonar seafloor attributes at sites with
mosaic capabilities for small ocean-observing systemspatial scale (e.g., 1-km × 1-km) installationsmapping to assess dynamicsof seafloor features
• A standard hierarchicaldescriptive matrix forclassification ofsedimentological andbiological attributes ofseafloor habitats
.
Identified Unfulfilled Needs for Activities Related to CoastalAgency or Entity Coastal Mapping and Charting Mapping Data and Products
Copyright © National Academy of Sciences. All rights reserved.
A Geospatial Framework for the Coastal Zone: National Needs for Coastal Mapping and Chartinghttp://www.nap.edu/catalog/10947.html

APPENDIX A 131
Department of CommerceNational Oceanic and Atmospheric AdministrationNational Ocean Service (NOS)
NOS Center for • Improved VDatum • Collects and distributes tideOperational transformation tools and use and water-level predictions,Oceanographic of kinematic global observations, reference datums,Products and positioning systems (GPSs) and tidal zoning to supportServices in all operations nautical charting and shoreline
• Expanded network of tidal mappingstations
NOS Coastal • Shorelines and elevations that • Coastal remote sensingServices Center are nationally consistent • Coastal change analysis(CSC) • Uniform standards for • Land-cover mapping
coastal mapping • HAB forecasting• Access to restricted data • Geospatial data and application• Timely data delivery in development
readily accessible formats • Environmental characterizations• Consistent metadata and • Watershed modeling
standards for coastal • Fish and vulnerabilityinformation and maps assessments of coastal hazards
• Seamless bathy/topo • High-accuracy coastalcoverage topography
• Environmental Sensitivity • Digital shorelineIndex mapping nationwide • Geospatial training courses
• Essential Fish Habitat • Coastal metadata tools andmapping training
• Data and information accesstools
• NOS Enterprise GIS Initiative
NOS National • Data available on Internet • Shallow-water benthic habitatCenters for • Consistent standards and mappingCoastal Ocean data interchange • Estimating bathymetry in clearScience • Access to non-federal shallow water using satellite
databases imagery• Consistent horizontal • Coral reef habitat maps
datums • Models of habitat/species• Consistent collection and associations
display standards andprotocols for land-sea data
• Ship time in remote areas
Identified Unfulfilled Needs for Activities Related to CoastalAgency or Entity Coastal Mapping and Charting Mapping Data and Products
Copyright © National Academy of Sciences. All rights reserved.
A Geospatial Framework for the Coastal Zone: National Needs for Coastal Mapping and Chartinghttp://www.nap.edu/catalog/10947.html

132 APPENDIX A
NOS National • Web-based shoreline data • National Spatial ReferenceGeodetic Survey dissemination System
• Improved data exchange • Seamless digital database ofbetween federal/state/local the national shorelineagencies • Tidal datums
• Updated shorelines for 1,200 • Aerial photographsnautical charts • Geodetic Tool Kit
• New technologies forshoreline mapping
• Improved hydrodynamicmodels and tidal zoning
NOS National • Detailed high-resolution • Ensure that each NationalMarine Sanctuary bathymetry in marine Marine Sanctuary is accuratelyProgram sanctuaries characterized (benthic habitat,
• Biogeographic information bathymetry, shoreline, etc.)for key areas • Publication of a shipwreck
• Adequate jurisdictional databaseboundary definitions • Accurate delineation of
• Seamless bathy/topo sanctuary and adjacent parkintegration boundaries
NOS Office of • Nationally consistent shoreline • Nautical chartsCoast Survey definition • Water depth, bottom
• Efficient techniques for characteristics, historical datashallow-water bathymetry of bathymetry and shoreline
• Seamless vertical datum • Blended bathymetry/topography, including digitalelevation models and consistent“shorelines” for coastal managers
NOS Office of • Standardized blended • Administers National EstuarineOcean and high-resolution bathymetric- Research Reserves and stateCoastal Resource topographic digital elevation Coastal Zone ManagementManagement models and maps Programs
• Within New England • Hydrodynamic analyses,Estuarine Research Society shoreline erosion, nearshoresingle-habitat classification habitat characterization mapsscheme for coastal zone • Risk analyses for sea level rise
NOS Office of • Reconnaissance aerial • Environmental Sensitivity MapsResponse and photography • Identification and inventory ofRestoration • Bathymetry abandoned and submerged
• TopoLIDAR vessels and their environmentalconsequences
• Assist resource managers inunderstanding the extent andnature of the threats posed byabandoned vessels
Identified Unfulfilled Needs for Activities Related to CoastalAgency or Entity Coastal Mapping and Charting Mapping Data and Products
Copyright © National Academy of Sciences. All rights reserved.
A Geospatial Framework for the Coastal Zone: National Needs for Coastal Mapping and Chartinghttp://www.nap.edu/catalog/10947.html

APPENDIX A 133
NOS Special • Nationally consistent • NOS Mapfinder Web siteProducts Office standards for metadata, • NOAA Enterprise GIS
data content, and models • Inventory of marine managed• National synoptic coastal areas
mapping capability • Coastal Assessment Framework• Datasets for a foundation • Digital Atlas of West Coast
(bathymetry, topography) Living Marine Resourcesand core socioeconomicinformation (demographics,land use) for national andregional-scale assessmentsof coastal change
Department of DefenseU.S. Army Corps of Engineers (USACE)
USACE • Nationally consistent • Topographic Light Detectionshoreline definition and Ranging (LIDAR) and
• Better access to time-sensitive multispectral imagersdata • LIDAR bathymetric systems—
• Lower cost for data acquisition SHOALS• Standard formats for GIS • National Shoreline Management• Consistent standards for Study to determine extent and
content, metadata, transfer, causes of shoreline changecollection, accuracy, improved • Regional sediment managementdata use, models, and tools GIS
• Blended bathymetric/ • Wave and surge modelingtopographic maps • Harbor and waterways projects,
• Engineering products from including hydrographic surveysremotely sensed data and dredging
Identified Unfulfilled Needs for Activities Related to CoastalAgency or Entity Coastal Mapping and Charting Mapping Data and Products
Copyright © National Academy of Sciences. All rights reserved.
A Geospatial Framework for the Coastal Zone: National Needs for Coastal Mapping and Chartinghttp://www.nap.edu/catalog/10947.html
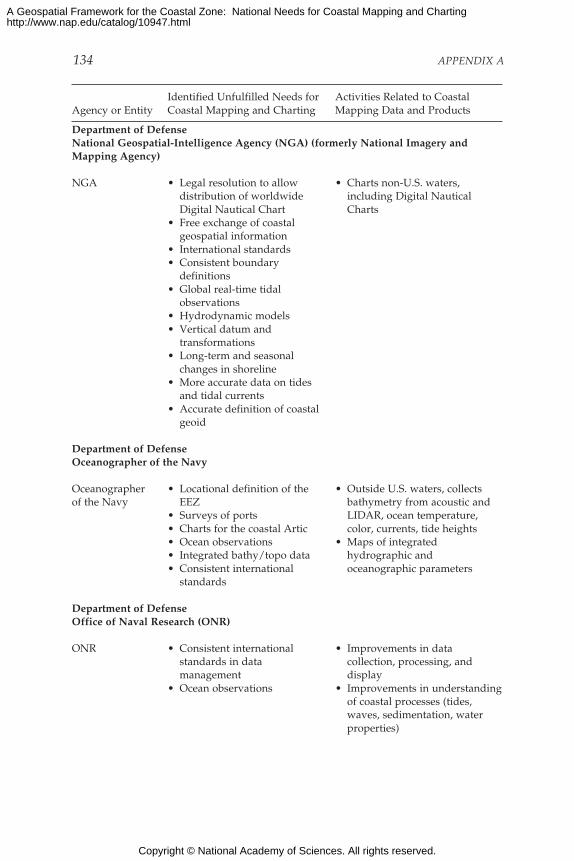
134 APPENDIX A
Department of DefenseNational Geospatial-Intelligence Agency (NGA) (formerly National Imagery andMapping Agency)
NGA • Legal resolution to allow • Charts non-U.S. waters,distribution of worldwide including Digital NauticalDigital Nautical Chart Charts
• Free exchange of coastalgeospatial information
• International standards• Consistent boundary
definitions• Global real-time tidal
observations• Hydrodynamic models• Vertical datum and
transformations• Long-term and seasonal
changes in shoreline• More accurate data on tides
and tidal currents• Accurate definition of coastal
geoid
Department of DefenseOceanographer of the Navy
Oceanographer • Locational definition of the • Outside U.S. waters, collectsof the Navy EEZ bathymetry from acoustic and
• Surveys of ports LIDAR, ocean temperature,• Charts for the coastal Artic color, currents, tide heights• Ocean observations • Maps of integrated• Integrated bathy/topo data hydrographic and• Consistent international oceanographic parameters
standards
Department of DefenseOffice of Naval Research (ONR)
ONR • Consistent international • Improvements in datastandards in data collection, processing, andmanagement display
• Ocean observations • Improvements in understandingof coastal processes (tides,waves, sedimentation, waterproperties)
Identified Unfulfilled Needs for Activities Related to CoastalAgency or Entity Coastal Mapping and Charting Mapping Data and Products
Copyright © National Academy of Sciences. All rights reserved.
A Geospatial Framework for the Coastal Zone: National Needs for Coastal Mapping and Chartinghttp://www.nap.edu/catalog/10947.html
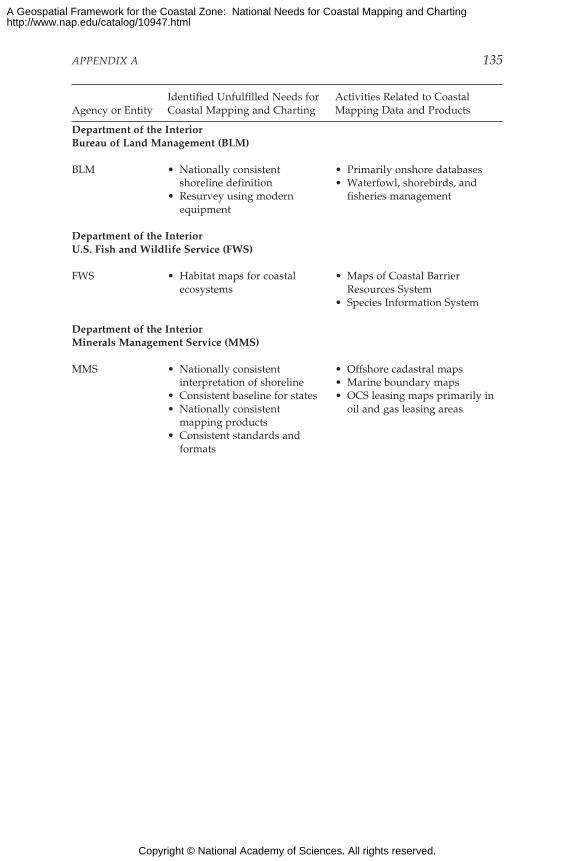
APPENDIX A 135
Department of the InteriorBureau of Land Management (BLM)
BLM • Nationally consistent • Primarily onshore databasesshoreline definition • Waterfowl, shorebirds, and
• Resurvey using modern fisheries managementequipment
Department of the InteriorU.S. Fish and Wildlife Service (FWS)
FWS • Habitat maps for coastal • Maps of Coastal Barrierecosystems Resources System
• Species Information System
Department of the InteriorMinerals Management Service (MMS)
MMS • Nationally consistent • Offshore cadastral mapsinterpretation of shoreline • Marine boundary maps
• Consistent baseline for states • OCS leasing maps primarily in• Nationally consistent oil and gas leasing areas
mapping products• Consistent standards and
formats
Identified Unfulfilled Needs for Activities Related to CoastalAgency or Entity Coastal Mapping and Charting Mapping Data and Products
Copyright © National Academy of Sciences. All rights reserved.
A Geospatial Framework for the Coastal Zone: National Needs for Coastal Mapping and Chartinghttp://www.nap.edu/catalog/10947.html

136 APPENDIX A
Department of the InteriorNational Park Service (NPS)
NPS • Nationally consistent • Baseline geologic data for parksshoreline definition • Submerged resources center for
• Benthic habitat archeological projectscharacterization (coral reefs, • Shoreline change monitoringSAV) • Vulnerability maps for parks
• Shoreline change rates • Survey, identification,• Threats to natural and inventory, evaluation,
cultural resources protection, and preservation of• Estuaries/wetlands mapping cultural resources• Anthropogenic alterations• Seamless topo/bathy maps• Sediment pathways and
transport• Shoreline change rates• Island mapping and geologic
framework• Forecast and hindcast
shoreline configuration• Anthropogenic alterations• Climate change impacts• Vulnerability indices• Base mapping (bathymetry,
backscatter)• Subsidence modeling (e.g.,
USS Arizona settling)• Critical mapping units
identified for submerged,anthropogenic, coastal-riverine, intertidal, subtidal
Department of the InteriorU.S. Geological Survey (USGS)
USGS Biology • Better benthic habitat • Coral reef mapsDiscipline characterization of natural • Benthic habitat maps
and artificial reefs • Physical habitat maps• Mapping of risks to resources • Nursery and coastal foraging
in hazard-prone areas habitat of fishes, birds, andmammals
• Coastal erosion GIS• Storm, coastal erosion, and sea
level rise impacts on livingresources
• Modeling of ecosystem responseto coastal disturbance
Identified Unfulfilled Needs for Activities Related to CoastalAgency or Entity Coastal Mapping and Charting Mapping Data and Products
Copyright © National Academy of Sciences. All rights reserved.
A Geospatial Framework for the Coastal Zone: National Needs for Coastal Mapping and Chartinghttp://www.nap.edu/catalog/10947.html
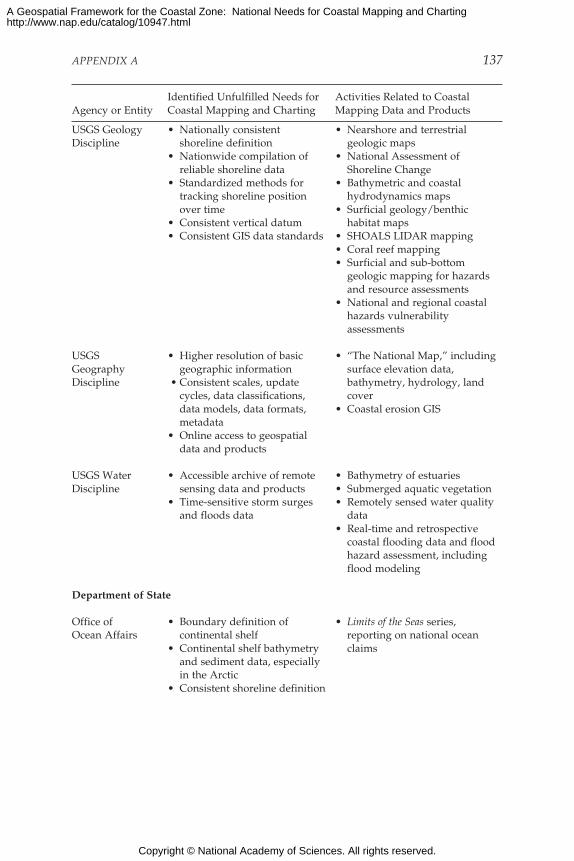
APPENDIX A 137
USGS Geology • Nationally consistent • Nearshore and terrestrialDiscipline shoreline definition geologic maps
• Nationwide compilation of • National Assessment ofreliable shoreline data Shoreline Change
• Standardized methods for • Bathymetric and coastaltracking shoreline position hydrodynamics mapsover time • Surficial geology/benthic
• Consistent vertical datum habitat maps• Consistent GIS data standards • SHOALS LIDAR mapping
• Coral reef mapping• Surficial and sub-bottom
geologic mapping for hazardsand resource assessments
• National and regional coastalhazards vulnerabilityassessments
USGS • Higher resolution of basic • “The National Map,” includingGeography geographic information surface elevation data,Discipline • Consistent scales, update bathymetry, hydrology, land
cycles, data classifications, coverdata models, data formats, • Coastal erosion GISmetadata
• Online access to geospatialdata and products
USGS Water • Accessible archive of remote • Bathymetry of estuariesDiscipline sensing data and products • Submerged aquatic vegetation
• Time-sensitive storm surges • Remotely sensed water qualityand floods data data
• Real-time and retrospectivecoastal flooding data and floodhazard assessment, includingflood modeling
Department of State
Office of • Boundary definition of • Limits of the Seas series,Ocean Affairs continental shelf reporting on national ocean
• Continental shelf bathymetry claimsand sediment data, especiallyin the Arctic
• Consistent shoreline definition
Identified Unfulfilled Needs for Activities Related to CoastalAgency or Entity Coastal Mapping and Charting Mapping Data and Products
Copyright © National Academy of Sciences. All rights reserved.
A Geospatial Framework for the Coastal Zone: National Needs for Coastal Mapping and Chartinghttp://www.nap.edu/catalog/10947.html

138 APPENDIX A
Department of Homeland SecurityFederal Emergency Management Agency (FEMA)
FEMA • Nationally consistent • Storm surge models, includingshoreline definition bathymetry, topography
• Blended bathymetric/ • Environmentally sensitive areastopographic maps • Coastal erosion maps
• Wave and flood models • Earthquake, flood, and wind• Comprehensive climate and hazard maps
storm data • Coastal communityvulnerability assessments
Department of Homeland SecurityU.S. Coast Guard (USCG)
USCG • High-resolution imagery and • Positions of Aids to Navigationbathymetry to support • Updates of navigation chartshomeland security • Aids to Navigation Information
• Coastal circulation models System
U.S. Environmental Protection Agency (EPA)
EPA Office of • Location accuracy of data • Monitoring and assessmentWater, Office of points from various sources activities to support waterResearch and • Timely access to data sources quality, safe drinking water,Development, (water quality, sediment marine debris, watershedOffice of Air chemistry) from other modeling, HAB mappingand Radiation agencies or academic sources • Environmapper for Water
• Compatibility between data • National Environmentalformats (scale, projections) Information Exchange Network
• Adequate storage andhardware
• National consistency forairshed and watershed maps
National Aeronautics and Space Administration (NASA)
NASA • Long-term geodetically • Coral reef mappingcontrolled tide gauge system • Geodetic imaging, digital data
• Ability to separate different onlinecomponents of sea level • Global maps of water qualitychange parameters
• Technology development forcoastal hazards development
Identified Unfulfilled Needs for Activities Related to CoastalAgency or Entity Coastal Mapping and Charting Mapping Data and Products
Copyright © National Academy of Sciences. All rights reserved.
A Geospatial Framework for the Coastal Zone: National Needs for Coastal Mapping and Chartinghttp://www.nap.edu/catalog/10947.html

APPENDIX A 139
Identified Unfulfilled Needs for Activities Related to CoastalAgency or Entity Coastal Mapping and Charting Mapping Data and Products
National Science Foundation (NSF)
NSF • Centralized online metadata • Marine environmental datacatalog collected by principal
• Quality control of data investigators must be deposited• User-friendly Web-based in a designated national data
tools for searching and center no later than 2 yearsaccessing data after being collected
• Standard digital forms forreporting data
Office of Management and BudgetFederal Geographic Data Committee (FGDC)
FGDC • Improved interagency • Development of the Nationalcoordination Spatial Data Infrastructure
• Improved collaboration and (NSDI)minimization of duplication • Support and publicizebetween agencies Geospatial One-Stop
• Increased progress on FGDC • Promulgation of standardsFramework • Support for NSDI
• Increased acceptance of Communications ToolkitFGDC standards andprotocols
• Quicker approval of spatialdata collection and mappingstandards
• Increased private-sectorinvolvement
• Improved data access
States, Tribes, and Territories
Resource • Enhanced ability to interpret • Varies widely by entityManagers, and apply spatial data andas identified by imagery for decision makingresponse to • Access to information fromCSC (1999) other entities
• Enhanced interagencycoordination
• Habitat and human-usemaps and data
• Nearshore and estuarybathymetry
• Fish distribution• Wetland function• Land-use change maps
Copyright © National Academy of Sciences. All rights reserved.
A Geospatial Framework for the Coastal Zone: National Needs for Coastal Mapping and Chartinghttp://www.nap.edu/catalog/10947.html
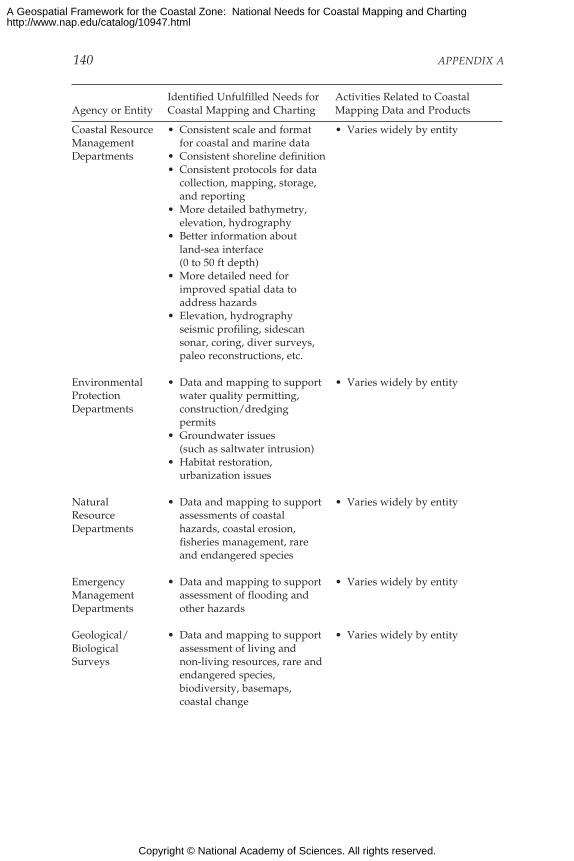
140 APPENDIX A
Coastal Resource • Consistent scale and format • Varies widely by entityManagement for coastal and marine dataDepartments • Consistent shoreline definition
• Consistent protocols for datacollection, mapping, storage,and reporting
• More detailed bathymetry,elevation, hydrography
• Better information aboutland-sea interface(0 to 50 ft depth)
• More detailed need forimproved spatial data toaddress hazards
• Elevation, hydrographyseismic profiling, sidescansonar, coring, diver surveys,paleo reconstructions, etc.
Environmental • Data and mapping to support • Varies widely by entityProtection water quality permitting,Departments construction/dredging
permits• Groundwater issues
(such as saltwater intrusion)• Habitat restoration,
urbanization issues
Natural • Data and mapping to support • Varies widely by entityResource assessments of coastalDepartments hazards, coastal erosion,
fisheries management, rareand endangered species
Emergency • Data and mapping to support • Varies widely by entityManagement assessment of flooding andDepartments other hazards
Geological/ • Data and mapping to support • Varies widely by entityBiological assessment of living andSurveys non-living resources, rare and
endangered species,biodiversity, basemaps,coastal change
Identified Unfulfilled Needs for Activities Related to CoastalAgency or Entity Coastal Mapping and Charting Mapping Data and Products
Copyright © National Academy of Sciences. All rights reserved.
A Geospatial Framework for the Coastal Zone: National Needs for Coastal Mapping and Chartinghttp://www.nap.edu/catalog/10947.html
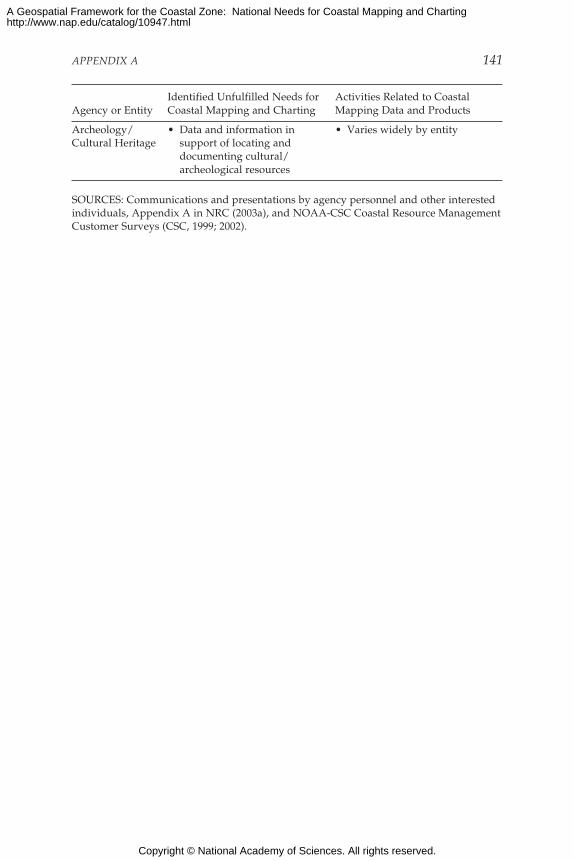
APPENDIX A 141
Identified Unfulfilled Needs for Activities Related to CoastalAgency or Entity Coastal Mapping and Charting Mapping Data and Products
Archeology/ • Data and information in • Varies widely by entityCultural Heritage support of locating and
documenting cultural/archeological resources
SOURCES: Communications and presentations by agency personnel and other interestedindividuals, Appendix A in NRC (2003a), and NOAA-CSC Coastal Resource ManagementCustomer Surveys (CSC, 1999; 2002).
Copyright © National Academy of Sciences. All rights reserved.
A Geospatial Framework for the Coastal Zone: National Needs for Coastal Mapping and Chartinghttp://www.nap.edu/catalog/10947.html

142
Appendix B
Committee and Staff Biographies
Larry A. Mayer (Chair), University of New Hampshire. Larry Mayerearned his Ph.D. at the Scripps Institution of Oceanography. He is currentlydirector of the Center for Coastal and Ocean Mapping and co-director ofthe Joint Hydrographic Center at the University of New Hampshire.Dr. Mayer’s research interests include sonar imaging, remote classificationof the seafloor, and applications of visualization techniques to problemsof ocean mapping. He has participated in more than 45 cruises during thepast 20 years and has been chief or co-chief scientist of numerous expedi-tions, including two legs of the Ocean Drilling Program. He is a recentrecipient of the Keen Medal in Marine Geology, was a member of thePresident’s Panel on Ocean Exploration, and was recently awarded anhonorary doctorate from the University of Stockholm.
Rear Admiral Kenneth E. Barbor, International Hydrographic Bureau.Rear Admiral Kenneth Barbor earned his M.S. in meteorology and ocean-ography at the Naval Postgraduate School. He currently serves as directorof the International Hydrographic Bureau. RDML Barbor was theinaugural director of the Hydrographic Science Research Center at theUniversity of Southern Mississippi, a part of the Department of MarineScience located at the Stennis Space Center. He retired from the U.S. Navyafter a 28-year career that included assignments as commander of theNaval Meteorology and Oceanography Command, directing the Navy’soperational hydrography, oceanography, and meteorology activities;commanding officer of a hydrographic survey unit and two meteorologyand oceanography forecast units; and headquarter staff tours with the
Copyright © National Academy of Sciences. All rights reserved.
A Geospatial Framework for the Coastal Zone: National Needs for Coastal Mapping and Chartinghttp://www.nap.edu/catalog/10947.html
APPENDIX B 143
Oceanographer of the Navy and Naval Meteorology and OceanographyCommand.
Paul R. Boudreau, Bedford Institute of Oceanography. Paul Boudreaureceived his M.S. in ecology from Dalhousie University. He is currentlymanager of the Habitat Management Division of the Canadian Depart-ment of Fisheries and Oceans. Mr. Boudreau’s research interests includehabitat and population production in freshwater, estuarine, and marineecosystems and environmental impact assessment, which includesdevelopment, application, and analysis associated with mapping marinebenthic habitats. He holds numerous committee positions, includingmembership on the International Council for the Exploration of the SeaWorking Group on Marine Habitat Mapping.
Thomas S. Chance, C&C Technologies. Thomas Chance received his M.S.degrees in geodesy and industrial administration from Purdue Univer-sity. He is founder and president of C&C Technologies, a hydrographicand land-surveying company headquartered in Lafayette, Louisiana.Mr. Chance is a member of the Hydrographic Society, the Institute ofNavigation, the Society of American Military Engineers, and the MarineTechnology Society. His expertise includes surveying for the submarinetelecommunications industry, the offshore oil industry, and the U.S.government (including NOAA and the USGS). Mr. Chance served on thePresident’s Panel for Ocean Exploration. He also participated in the GlobalOcean-floor Mapping Project workshop.
Charles H. Fletcher, University of Hawaii. Charles Fletcher received hisPh.D. in geology, with a concentration in coastal sedimentology andPleistocene-Holocene sea level change, from the University of Delaware.Dr. Fletcher is currently a professor of geology and geophysics in theSchool of Ocean and Earth Science and Technology (SOEST) at the Uni-versity of Hawaii. His research interests include coastal sedimentarygeology, which focuses on sediment budgets, sea-level history, erosionand accretion patterns, hazards, shelf sedimentation, and coastal zonemanagement. Dr. Fletcher also has an interest in carbonate reefs, reefhistory, remote sensing, and habitat mapping. In 2001, Dr. Fletcher receivedthe Robert W. Clopton Award for Outstanding Service to the Community.
Holly Greening, Tampa Bay Estuary Program. Holly Greening receivedher M.S. from Florida State University. She has been a senior scientist atthe Tampa Bay National Estuary Program since 1991. Ms. Greening’sresponsibilities include coordinating state, federal, and universityresearchers and resource managers investigating impacts to the natural
Copyright © National Academy of Sciences. All rights reserved.
A Geospatial Framework for the Coastal Zone: National Needs for Coastal Mapping and Chartinghttp://www.nap.edu/catalog/10947.html
144 APPENDIX B
resources of Tampa Bay. Her research interests include freshwater inflow,atmospheric deposition, and watershed management. Ms. Greeningrecently served on the NRC Committee on Causes and Management ofCoastal Eutrophication and serves on the Governing Board of the Estua-rine Research Federation.
Rongxing Li, Ohio State University. Rongxing Li received his Ph.D. inphotogrammetry and remote sensing from the Technical University ofBerlin. He is currently a professor of geoinformation and geodetic scienceat Ohio State University. His research interests include Geographic Infor-mation Systems, Land Information Systems, photogrammetry, remotesensing, and applications involving coastal mapping, environmentalmonitoring and transportation. Dr. Li is a certified photogrammist and amember of the American Society for Photogrammetry and Remote Sensing.He is also a member of the American Society of Civil Engineers and theAmerican Geophysical Union.
Curt Mason, Private Consultant. Curt Mason received his B.S. fromOregon State University and his M.S. in physical oceanography fromTexas A&M University. From 1997 until his retirement in 2001, Mr. Masonserved as a senior coastal oceanographer for NOAA. His primary areas ofexpertise include beach erosion, coastal storm impacts, and tidal inlethydrodynamic and sedimentary processes. During his 36 years as a coastaloceanographer for the federal government, he led a major Corps of Engi-neers research program on tidal inlets, in addition to establishing anddirecting the Corps of Engineers Field Research Facility. Mr. Mason servedas a program director in the NOAA National Sea Grant Program andCoastal Ocean Program offices; led the establishment of and served asdeputy director for the NOAA Coastal Services Center, coordinated majorbudget initiatives within NOAA and the Department of Commerce onnational disaster reduction (for which he received the department’s BronzeMedal in 1998), and served as the NOAA/USGS liaison for science inter-actions and budget initiatives. He recently served on the National AcademiesCommittee to Review the USGS Coastal and Marine Geology Program.
Susan Snow-Cotter, Massachusetts Office of Coastal Zone Management.Susan Snow-Cotter received her M.A. in marine affairs from the Univer-sity of Washington. She holds a B.A. in political science with an emphasisin environmental politics from the University of Massachusetts/Amherst.Ms. Snow-Cotter is currently the assistant director at the Executive Officeof Environmental Affairs for Massachusetts Office of Coastal Zone Manage-ment. She has 15 years of experience with ocean resource managementincluding aquaculture, habitat mitigation, regulatory review of coastal
Copyright © National Academy of Sciences. All rights reserved.
A Geospatial Framework for the Coastal Zone: National Needs for Coastal Mapping and Chartinghttp://www.nap.edu/catalog/10947.html
APPENDIX B 145
and ocean development, and exotic species planning and management.Ms. Snow-Cotter represents Massachusetts on several regional andnational programs including the Gulf of Maine Council on the MarineEnvironment, the Minerals Management Service’s Outer Continental ShelfPolicy Committee and the Northeast Aquatic Nuisance Species Panel.
Dawn J. Wright, Oregon State University. Dawn Wright received herPh.D. in physical geography and marine geology from the University ofCalifornia, Santa Barbara, in 1994. She is currently a professor of geographyand oceanography at Oregon State University. Dr. Wright’s researchinterests include geographic information science, marine geography,tectonics of mid-ocean ridges, and the processing and interpretation ofhigh-resolution bathymetric, video, and underwater photographic images.She has completed oceanographic fieldwork in some of the most geologi-cally active regions of the planet, including the East Pacific Rise, the Mid-Atlantic Ridge, the Juan de Fuca Ridge, the Tonga Trench, volcanoesunder the Japan Sea and the Indian Ocean, and has dived three times inthe Alvin submersible. Dr. Wright serves on the board of directors of theUniversity Consortium for Geographic Information Science, and hasrecently edited the books Marine and Coastal Geographical InformationSystems (Taylor & Francis, 2000) and Undersea with GIS (ESRI Press, 2002).
Staff
David A. Feary has been a senior program officer with the Board on EarthSciences and Resources since 1999, where he also has responsibility forthe Committee on Seismology and Geodynamics. He earned his Ph.D. atthe Australian National University before a 15-year period as a researchscientist with the marine program at the Australian Geological SurveyOrganisation. During this time he participated in numerous researchcruises—many as chief or co-chief scientist—and most recently was co-chief scientist for Ocean Drilling Program Leg 182. His research activitieshave focused on the role of climate as a primary control on carbonate reefformation.
Terry Schaefer was a program officer with the Ocean Studies Board fromAugust 2001 until October 2003. Terry received his Ph.D. in oceanographyand coastal sciences from Louisiana State University in 2001 and a master’sdegree in biology/coastal zone studies from the University of WestFlorida in 1996. In 1998, Terry served as a John A. Knauss Marine Policyfellow in the Office of the Chief Scientist, National Oceanic and Atmo-spheric Administration. During his time with the Ocean Studies Board hedirected the study Science and its Role in the National Marine Fisheries Service
Copyright © National Academy of Sciences. All rights reserved.
A Geospatial Framework for the Coastal Zone: National Needs for Coastal Mapping and Chartinghttp://www.nap.edu/catalog/10947.html

146 APPENDIX B
(2002). Previously, Terry worked for the U.S. Environmental ProtectionAgency, National Park Service, U.S. Army Corps of Engineers, U.S. Fishand Wildlife Service, and the U.S. Forest Service. Dr. Schaefer’s interestsinclude recruitment dynamics of marine populations, experimental statis-tics, coastal zone management, and marine policy.
Yvonne Forsbergh was a research assistant for the Board on Earth Scienceand Resources. Previously, she was a program analyst for the Office ofGrants and Special Programs at Howard Hughes Medical Institute forboth the Precollege Science Education Program and the Graduate ScienceEducation Program. She has also held a position with the Board on Scienceand Technology for International Development as consultant and pro-gram administrator. She holds a B.S. from the University of Tennessee inmicrobiology and education, and she is currently a M.Ed. candidate atGeorge Mason University in instructional technology.
Byron Mason is a senior project assistant for the Division on Earth andLife Studies. He received a B.A. in anthropology from the University ofFlorida. During his time at the NRC he has assisted with the completionof two reports: Implementing Climate and Global Change Research (2004) andA Geospatial Framework for the Coastal Zone: National Needs for Coastal Map-ping and Charting (2004).
Alison Schrum was a project assistant with the Ocean Studies Boardthrough much of 2002, where she was primarily involved with organiza-tional aspects of the National Needs for Coastal Mapping and Charting study.
Copyright © National Academy of Sciences. All rights reserved.
A Geospatial Framework for the Coastal Zone: National Needs for Coastal Mapping and Chartinghttp://www.nap.edu/catalog/10947.html

147
Appendix C
Acronyms
AIS Automatic Identification SystemALACE Airborne LIDAR Assessment of Coastal ErosionAtN Aids to NavigationAUV Autonomous Underwater VehicleAVHRR Advanced Very High Resolution Radiometer
BLM Bureau of Land Management
CASI Compact Airborne Spectrographic ImagerCHARTS Compact Hydrographic Airborne Raid Total SurveyCMW Counter Mine WarfareCSC Coastal Services CenterCSO Coastal States OrganizationCTM Coastal Terrain Model
DDM Digital Depth ModelDEM Digital Elevation ModelDGPS Differential Global Positioning SystemDMS Digital Mapping Server
ECDIS Electronic Chart Display and Information SystemEEZ Exclusive Economic ZoneENC Electronic Nautical ChartEPA U.S. Environmental Protection Agency
Copyright © National Academy of Sciences. All rights reserved.
A Geospatial Framework for the Coastal Zone: National Needs for Coastal Mapping and Chartinghttp://www.nap.edu/catalog/10947.html

148 APPENDIX C
FEMA Federal Emergency Management AgencyFGDC Federal Geographic Data CommitteeFIRMS Flood Insurance Rate MapsFTE Full-time EquivalentFWS U.S. Fish and Wildlife Service
GEODAS Geophysical Data SystemGIDB Geospatial Information DatabaseGIS Geographic Information System(s)GPS Global Positioning System
HAB Harmful Algal BloomHYSAS Hydrographic Source and Assessment System
IMO International Maritime OrganizationIMU Inertial Measurement UnitISO International Organization for Standardization
LIDAR Light Detection and RangingLNM Local Notice to Mariners
MHHW Mean Higher High WaterMHW Mean High WaterMLLW Mean Lower Low WaterMLW Mean Low WaterMMS Minerals Management ServiceMSL Mean Sea Level
NAD North American DatumNAFTA North American Free Trade AgreementNASA National Aeronautics and Space AdministrationNAVD North American Vertical DatumNESDIS National Environmental Satellite, Data, and Information ServiceNGA National Geospatial-Intelligence Agency (formerly National
Imagery and Mapping Agency)NGDC National Geophysical Data CenterNGS National Geodetic SurveyNOAA National Oceanic and Atmospheric AdministrationNOPP National Ocean Partnership ProgramNOS National Ocean ServiceNPDES National Pollutant Discharge Elimination SystemNPS National Park ServiceNRC National Research Council
Copyright © National Academy of Sciences. All rights reserved.
A Geospatial Framework for the Coastal Zone: National Needs for Coastal Mapping and Chartinghttp://www.nap.edu/catalog/10947.html
APPENDIX C 149
NRL Naval Research LaboratoryNSDI National Spatial Data InfrastructureNSF National Science FoundationNTDE National Tidal Data Epoch
OAR Office of Ocean and Atmospheric ResearchOCS Office of Coast SurveyOGC Open GIS ConsortiumOMB Office of Management and BudgetONR Office of Naval ResearchOPIS Ocean Planning Information SystemORCA Oceanographic Remotely Controlled Automaton
ROV Remotely Operated Vehicle
SAUV Solar Autonomous Underwater VehicleSAV Submerged Aquatic VegetationSHOALS Scanning Hydrographic Operational Airborne LIDAR SurveySOLAS Safety of Life at SeaSPAWAR Space and Naval Warfare Systems CommandSRTM Shuttle Radar Topography Mission
UML Unified Modeling LanguageUNCLOS United Nations Convention on the Law of the SeaUSACE U.S. Army Corps of EngineersUSCG U.S. Coast GuardUSGS U.S. Geological SurveyUUV Unmanned Underwater Vehicle
WAAS Wide Area Augmentation SystemWWNWS World Wide Navigational Warning System
XML Extensible Markup Language
Copyright © National Academy of Sciences. All rights reserved.
A Geospatial Framework for the Coastal Zone: National Needs for Coastal Mapping and Chartinghttp://www.nap.edu/catalog/10947.html