georgia criminal justice data landscape report
TRANSCRIPT

GEORGIA CRIMINAL JUSTICE DATA LANDSCAPE REPORT
EXECUTIVE SUMMARY

The Georgia Criminal Justice Data Landscape Report is provided as a service to the public and policy makers interested in Georgia’s criminal justice system. The data in this report are intended to be a reference. The report offers a look back at the past decade of data on Georgia’s adult and juvenile criminal justice systems and the people involved in those systems.
As government leaders and other stakeholders across Georgia deliberate the future of criminal justice policy, trend and comparison data can provide helpful perspectives and important context. This report is designed to be a stand-alone, go-to source for data, charts, and explanatory narrative to offer context, historical trends, and insights on criminal justice trends in Georgia. The report highlights the impacts of criminal justice reform on incarceration and community supervision.
ADULTS
YOUTHThe data show that the number of youth detained in a regional youth detention center (RYDC) or sentenced to a youth development campus (YDC) has trended down since juvenile justice reform in 2013.
The data show a decrease in the number of adults arrested. The number of adults incarcerated in prison has moderated since the enactment of criminal justice reform, which began in 2012.
Similarly, the number of people on probation and parole has decreased since 2017.
Source: Georgia Department of Community SupervisionNote: Incarceration data are from June of each year. Source: Kaplan
EXECUTIVE SUMMARY
Sources: Governor’s Office of Planning and Budget; Georgia Juvenile Justice Clearinghouse, Juvenile Justice Data Exchange
2012
350,000 60,000
Adu
lts
Arr
este
d
Adu
lts
Inca
rcer
ated
in P
riso
n
300,000 58,000
250,000 56,000
200,000 54,000
150,000 52,000
100,000 50,000
50,000 48,000
0 46,0002013 2014 2015 2016 2017 2018
Adults Arrested Adults Incarcerated (prison)
2017 2018 2019 2020
Peo
ple
on P
roba
tion
Peo
ple
on P
arol
e
206,000 205,000 204,000 203,000 202,000 201,000 200,000 199,000 198,000 197,000 196,000 195,000
23,000 22,000 21,000 20,000 19,000 18,000
17,000 16,000
People on Probation People on Parole
Youth Arrested Youth Sentenced to Secure Confinement (YDC) Youth in Secure Detention (RYDC)
2014 2015 2016 2017 2018 2019
25,000
20,000
15,000
10,000
5,000
0
12,000
10,000
8,000
6,000
4,000
2,000
0
Yout
h A
rres
ted
Yout
h in
Sec
ure
Det
enti
on/C
onfin
emen
t
1 | GEORGIA CRIMINAL JUSTICE DATA LANDSCAPE REPORT EXECUTIVE SUMMARY

CRIMINAL JUSTICE REFORM IN GEORGIA
A series of legislative changes starting in 2012 under the direction of Governor Nathan Deal and the Special Council on Criminal Justice Reform for Georgians transformed state criminal justice policy, law, and funding. Six significant pieces of criminal justice legislation were passed during Governor Deal’s eight years in office.
In some cases inflection points in the data trends can be attributed to criminal justice reform or the COVID-19 pandemic. In other cases, more analysis is needed to understand why certain trends have changed in the last few years for certain populations and for certain types of crimes.
The impact of reforms on the criminal justice system is evident in the data: The number of people incarcerated in Georgia’s prisons peaked at more than 57,500 in 2012. In the immediate aftermath of HB 1176, the number of people incarcerated dropped 7.7% to just over 53,000 in 2014, but has increased only slightly since then. Adult criminal justice reforms established a new baseline for sentence length for people incarcerated in the state prison system. The data show that, since reform, the number of adults serving sentences of five years or less dropped as the use of alternative sentences increased. Similarly, downward trends for youth involved in the juvenile justice system were sustained, and in some cases, accelerated with reform. For example, the youth arrest rate for violent offenses decreased 49.6% between 2009 and 2018.
The number of people supervised by the Department of Community Supervision (DCS) decreased steadily from 2017—when reform legislation related to parole and probation was enacted—to 2020: a reduction of 3.0% of people on probation and a reduction of 16.3% of people on parole. More information and research are needed to better understand how declining arrest and incarceration rates compare to state budgets for the correctional system and parole and probation.
House Bill 1176 2012
House Bill 349 2013
Senate Bill 365 2014
House Bill 310 2015
Senate Bill 174 2017
House Bill 242 2013
Note: Data are for June of each year.Source: Georgia Department of Corrections
60,000
58,000
56,000
54,000
52,000
50,000
48,000
46,000
44,000
42,000
40,000
PEOPLE INCARCERATED IN GEORGIA PRISONS, 2010–2019
First criminal justice reform bill
2000
2010
2001
2011
2002
2012
2003
2013
2004
2014
2005
2015
2006
2016
2007
2017
2008
2018
2009
2019
2 | GEORGIA CRIMINAL JUSTICE DATA LANDSCAPE REPORT EXECUTIVE SUMMARY

As of publication of this report, some data for 2019 and 2020 have not yet been released. Data available for 2020 reflect the impact of the pandemic on the criminal justice system and the persons being adjudicated and incarcerated. The incarceration data reflect the impact of courts being closed and having minimal operations for a significant part of 2020 due to emergency judicial orders. With limited court activity and fewer trials, more people arrested were allowed to await their court date at home rather than in local jails. The domino effect was that fewer people were convicted and incarcerated.
Prior to COVID-19, county jails continually housed more than 35,000 people. In response to the COVID-19 pandemic, between March and June 2020, the state saw a total reduction of 26.9% of people in county jails. After June 2020, the number of people incarcerated in county jails increased 14% through November 2020.
COVID-19 PANDEMIC
Average Number
Awaiting Trial
Serving Sentence
Average Number
Awaiting Trial
Serving Sentence
Georgia 23,591 64.3% 21.7% 20,539 67.3% 19.7%
Rural Counties 4,964 53.3% 20.1% 4,493 55.1% 19.3%
Urban Counties 18,627 68.1% 22.1% 16,046 71.8% 20.7%
Atlanta MSA 11,157 65.8% 24.1% 9,468 69.9% 21.5%
Rest of the State 12,435 63.1% 19.6% 11,072 65.3% 18.2%
BEFORE COVID-19 DURING COVID-19
June 2015 – December 2019 March – December 2020
CHANGES TO THE PERCENTAGE OF PEOPLE INCARCERATED IN GEORGIA COUNTY JAILS AWAITING TRIAL OR SERVING A SENTENCE, JUNE 2015–DECEMBER 2020
Source: Georgia Department of Community Affairs
3 | GEORGIA CRIMINAL JUSTICE DATA LANDSCAPE REPORT EXECUTIVE SUMMARY
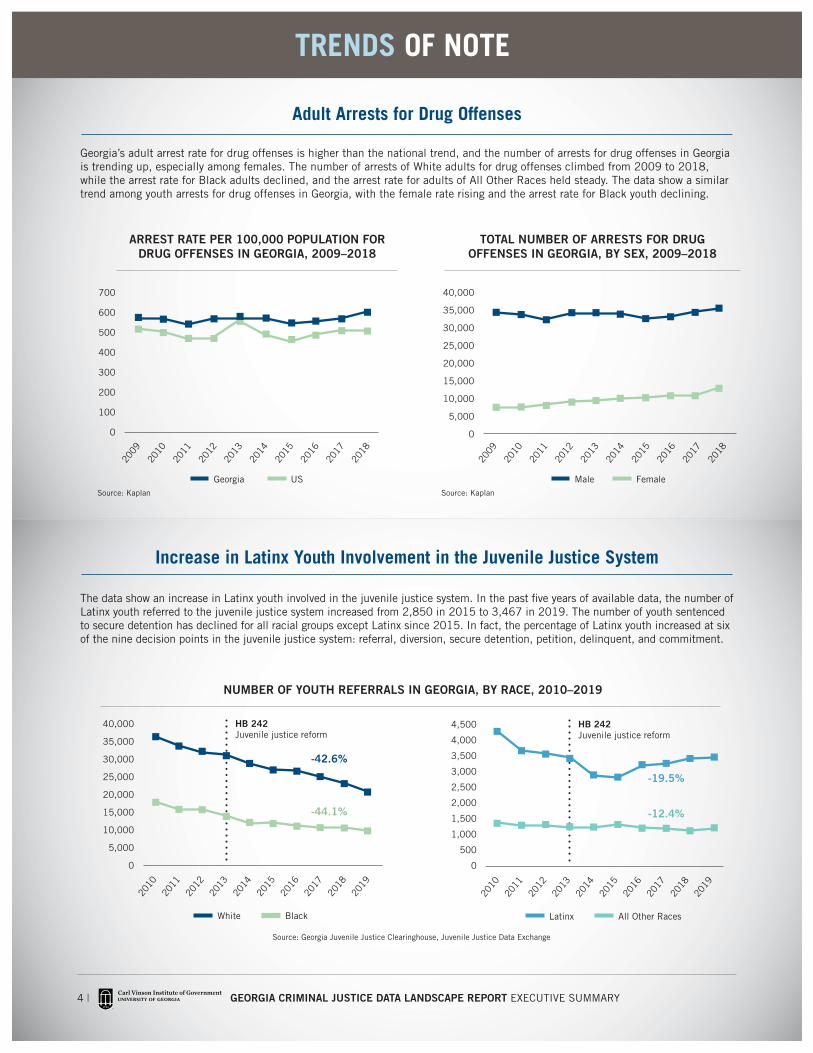
Georgia’s adult arrest rate for drug offenses is higher than the national trend, and the number of arrests for drug offenses in Georgia is trending up, especially among females. The number of arrests of White adults for drug offenses climbed from 2009 to 2018, while the arrest rate for Black adults declined, and the arrest rate for adults of All Other Races held steady. The data show a similar trend among youth arrests for drug offenses in Georgia, with the female rate rising and the arrest rate for Black youth declining.
The data show an increase in Latinx youth involved in the juvenile justice system. In the past five years of available data, the number of Latinx youth referred to the juvenile justice system increased from 2,850 in 2015 to 3,467 in 2019. The number of youth sentenced to secure detention has declined for all racial groups except Latinx since 2015. In fact, the percentage of Latinx youth increased at six of the nine decision points in the juvenile justice system: referral, diversion, secure detention, petition, delinquent, and commitment.
TRENDS OF NOTE
Adult Arrests for Drug Offenses
Increase in Latinx Youth Involvement in the Juvenile Justice System
Source: Kaplan
Source: Georgia Juvenile Justice Clearinghouse, Juvenile Justice Data Exchange
Source: Kaplan
NUMBER OF YOUTH REFERRALS IN GEORGIA, BY RACE, 2010–2019
2009
2010
2011
2012
2013
2014
2015
2016
2017
2018
2009
2010
2011
2012
2013
2014
2015
2016
2017
2018
40,000
35,000
30,000
25,000
20,000
15,000
10,000
5,000
0
Male Female
TOTAL NUMBER OF ARRESTS FOR DRUG OFFENSES IN GEORGIA, BY SEX, 2009–2018
2010
2011
2012
2013
2014
2015
2016
2017
2018
2019
40,000
35,000
30,000
25,000
20,000
15,000
10,000
5,000
0
-42.6%
-44.1%
HB 242 Juvenile justice reform
White Black
2010
2011
2012
2013
2014
2015
2016
2017
2018
2019
4,500
4,000
3,500
3,000
2,500
2,000
1,500
1,000
500
0
-19.5%
-12.4%
HB 242 Juvenile justice reform
Latinx All Other Races
700
600
500
400
300
200
100
0
Georgia US
ARREST RATE PER 100,000 POPULATION FOR DRUG OFFENSES IN GEORGIA, 2009–2018
4 | GEORGIA CRIMINAL JUSTICE DATA LANDSCAPE REPORT EXECUTIVE SUMMARY

The number of White youth involved in the juvenile justice system declined the most at
six decision points — arrest, referral, commitment, secure detention (RYDC), petition,
and delinquent — while the number of Black youth decreased the most at the diversion and
secure confinement (YDC) decision points.
The number of youth admitted to RYDCs decreased 52.6%
from 2010 to 2019, while the number of youth served at YDCs
decreased 63.3%.
ADDITIONAL RESOURCESFor a copy of the full report and other supplemental information, go to cviog.uga.edu/GeorgiaCJReport;
Georgia criminal justice data visualizations curated by the Carl Vinson Institute of Government can be accessed at https://georgiadata.org/topics/Courts-and-Crime.
The total number of arrests in Georgia fell 20.6% from 2009 to 2018, while the
arrest rate dropped 28.1%.
The arrest rate per 100,000 population for violent offenses in Georgia decreased 26.6% compared to a decrease of 12.4% in the US overall
from 2009 to 2018.
In 2018, Black adults comprised 31.6% of the adult population in Georgia but accounted for 59.0% of arrests in the state
for violent offenses.
A much higher proportion of Black people in Georgia, particularly males, are
arrested compared to their proportion in the overall state population. This is the case for
both adults and youth.
The number of people on probation and parole decreased steadily from
2017 to 2020: a reduction of 3.0% of people on parole and a reduction
of 16.3% of people on parole.
OTHER TRENDS IN THE ADULT POPULATION
OTHER TRENDS IN THE YOUTH POPULATION
5 | GEORGIA CRIMINAL JUSTICE DATA LANDSCAPE REPORT EXECUTIVE SUMMARY

TIMELINE OF MAJOR CRIMINAL JUSTICE LEGISLATION IN GEORGIA
6 | GEORGIA CRIMINAL JUSTICE DATA LANDSCAPE REPORT EXECUTIVE SUMMARY
SB 440 1994 • Known as the Juvenile Justice
Reform Act of 1994
• Created Seven Deadly Sins
• Youth age 13 and older can be tried as an adult under certain circumstances
• Allows youth to be sentenced to life without parole
SB 441 1995 • Known as Mandatory Minimums of
1995
• Offenders convicted of one of the Seven Deadly Sins must serve minimum of 10 years
• Also known as “two strikes” law: offenders convicted of two of the Seven Deadly Sins sentenced to life without parole
SB 365 2014 • Created Program and Treatment
Completion Certificate
• Required the Georgia Department of Corrections to develop reentry programs for returning citizens
HB 310 2015 • Consolidated felony probation supervision under new
Department of Community Supervision
• Created Board of Community Supervision to oversee private and governmental misdemeanor probation providers
SB 174 2017 • Implemented probation and parole reforms
• Created behavioral incentive date (BID)
• Created additional eligibility for early probation termination
• Allowed for transition to unsupervised probation
HB 1176 2012 • First of Governor Deal’s criminal
justice reform laws
• Raised the threshold for felony theft from $500 to $1,500
• Created degrees of severity for crimes such as burglary, forgery, and theft
• Provided alternatives to incarceration for low-risk, nonviolent offenders who committed drug and property offenses
• Allowed imposition of graduated sanctions in response to probation violations
• Allowed courts to order electronic monitoring for all offenders
• Provided a $10 million investment in accountability courts
HB 242 2013 • Also called the Juvenile Justice Reform Act
• Eliminated mandatory minimums for youth in the justice system
• Focused use of out-of-home placements on higher-level offenders; prohibited use for status offenses
• Focused resources on evidence-based practices to reduce recidivism
• Required the use of assessment instruments before detaining a youth in a secure facility
• Allowed alternative forms of supervision for lower-risk, lower-need youth
HB 349 2013• Created higher education grant for use upon release for those who
complete their GED while incarcerated
• Allowed judges discretion in sentencing in some drug-related cases and Seven Deadly Sins sentences
• Defined unsupervised probation
• Allowed restoration of a suspended driver’s license for limited use by drug and mental health accountability court participants to facilitate participation in court-ordered program
1994 1995 2012 2013 2014 2015 2016 2017 2018 2019 2020 2021
GEORGIA CRIMINAL JUSTICE DATA LANDSCAPE REPORT
EXECUTIVE SUMMARY
Carl Vinson Institute of GovernmentThe Carl Vinson Institute of Government is a public service unit of the University of Georgia that has been providing training and technical assistance to governments in Georgia for more than 90 years. The mission of the Institute of Government is to promote excellence in government. We work to increase the capacity of governments in Georgia to better serve their constituents through training, applied research, technical assistance, and technology solutions. The Institute conducts nonpartisan research that helps partners make better data-informed decisions.
The Institute of Government has compiled data to inform decision-making for years. The Georgia County Guide is one example of an annual data report in which county-level data are compiled in a single location. The Institute’s website Georgiadata.org provides interactive and static table data on a variety of topics. Criminal justice is just one of many search topics on Georgiadata.org, allowing the public and policy makers to access and filter data at the county level and by demographic variables.
Public Welfare FoundationFor over 70 years, Public Welfare Foundation has supported efforts to advance justice and opportunity for people in need. Today, the Foundation’s efforts focus on catalyzing a transformative approach to justice that is community-led, restorative, and racially just through investments in criminal justice and youth justice reforms. These efforts honor the Foundation’s core values of racial equality, economic well-being, and fundamental fairness for all.
Learn more at www.publicwelfare.org.
AcknowledgementsThe Institute of Government would like to thank the analysts, writers, editors, and graphic artists who helped gather, analyze, visualize, and describe the data in the report. Each section of the report was developed in consultation with subject matter experts and was reviewed by state agency data experts when possible.
Carl Vinson Institute of Government Authors and Contributors
Holly Lynde, Fiscal Analyst
Emily Franklin, Fiscal Analyst
Sandy Lee, Consultant
Jan Coyne, Cartographer
David Tanner, Associate Director
Courtney Alford-Pomeroy, Communications Director
Jake Brower, Graphic Designer
Karen DeVivo, Editor