george l. argyros school of business and economics bus
TRANSCRIPT

CHAPMAN UNIVERSITY George L. Argyros School of Business and Economics
BUS 602P - Accounting and
Financial Analysis - Fall 2019
Textbook Packet
Table of Contents Hartgraves and Morse Chap. 1 and 2
Problems
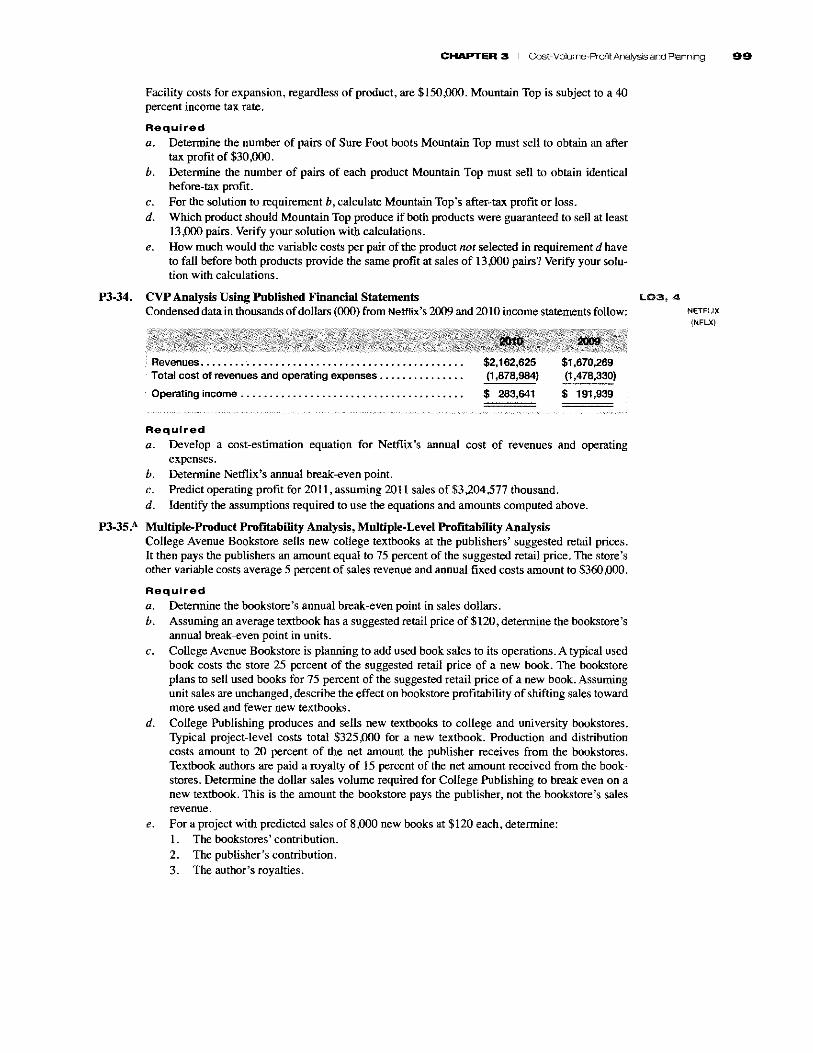
Hartgraves and Morse Chap. 3
Hartgraves and Morse Chap. 1-3 Solutions – on website
In-class problems for Dyckman,
et al. 5th Ed
Solutions to in-class problems for Dyckman, et al. 5th Ed – on website
Problems for Dyckman, et al. 4th Ed – on website
Solutions for Dyckman, et al. 4th Ed – on website

CHAPMAN UNIVERSITY George L. Argyros School of Business and Economics
BUS 602P - Accounting and
Financial Analysis - Fall 2019
Textbook Packet
Table of Contents Hartgraves and Morse Chap. 1 and 2
Problems
Hartgraves and Morse Chap. 3
Hartgraves and Morse Chap. 1-3 Solutions – on website
In-class problems for Dyckman,
et al. 5th Ed
Solutions to in-class problems for Dyckman, et al. 5th Ed – on website
Problems for Dyckman, et al. 4th Ed – on website
Solutions for Dyckman, et al. 4th Ed – on website

Hartgraves and Morse Chap. 1
and 2 Problems

keY terMs
MULtipLe CHOiCe
1. Which of the following is not a characteristic of Managerial Accounting? a. no external standards b. reports primarily on past decisions c. Provides information for internal users d. information is more detailed
2. Controlling is the process of: a. selecting goals and adopting strategies for achieving them b. Delegating authority to others to take action to implement plans c. Organizing employees into line and staff functions d. ensuring that results agree with plans
3. Which of the following is not a cost driver? a. The gender of the wait staff at a restaurant b. The number of customers in a restaurant c. The size of a restaurant d. The policy of empowering a waitress to make the decision to give a customer a free dessert
because of the delay in delivering the main entrée.4. Which of the following is not one of the three basic types of cost drivers discussed in the text?
a. Activity cost drivers b. Organizational cost drivers c. Direct cost drivers d. structural cost drivers
5. Which of the following is not likely to be regarded as an action that has ethical implications in today’s business environment? a. Purchasing supplies from a relative or friend rather than seeking bids b. using different depreciation methods for calculating depreciation expense for the financial
statements and the income tax return c. Failing to recognize obsolete inventory to avoid missing a profit forecast d. shifting costs for one contract to another to make the profits of the contracts line up with initial
forecasts
disCUssiOn QUestiOns
Q1-1. Contrast financial and managerial accounting on the basis of user orientation, purpose of informa-tion, level of aggregation, length of time period, orientation toward past or future, conformance to external standards, and emphasis on objective data.
Q1-2. What three themes are a part of strategic cost management?
Multiple C
hoice Answ
ers1. b
2. d 3. a
4. c 5. b
activity, 14activity cost drivers, 16controlling, 11corporate governance, 18corporate social responsibility, 19cost driver analysis, 7cost drivers, 14ethics, 17
financial accounting, 4for-profit organizations, 8goal, 8internal control systems, 18managerial accounting, 4mission, 7not-for-profit organizations, 8organization chart, 11
organizing, 11planning, 11strategic cost management, 7strategic position, 9strategic position analysis, 7strategy, 8value chain analysis, 7
chaPter 1 | Managerial Accounting: Tools for Decision Making 21
Q1-3. Distinguish between a mission and a goal. Q1-4. Describe the three strategic positions that Porter views as leading to business success. Q1-5. Distinguish between how managerial accounting would support the strategy of cost leadership and
the strategy of product differentiation. Q1-6. Why are the phases of planning, organizing, and controlling referred to as a continuous cycle? Q1-7. identify three advances that have fostered the move away from isolated national economic systems
toward an interdependent global economy. Q1-8. What are the three interrelated dimensions of today’s competition? Q1-9. Differentiate among structural, organizational, and activity cost drivers. Q1-10. What is the link between performing activities and incurring costs? Q1-11. how can top management establish an ethical tone in an organization? Q1-12. Describe how pressures to have desirable short-run outcomes can lead to ethical dilemmas.
Assignments with the logo in the margin are available in . See the Preface of the book for details.
Mini exerCises
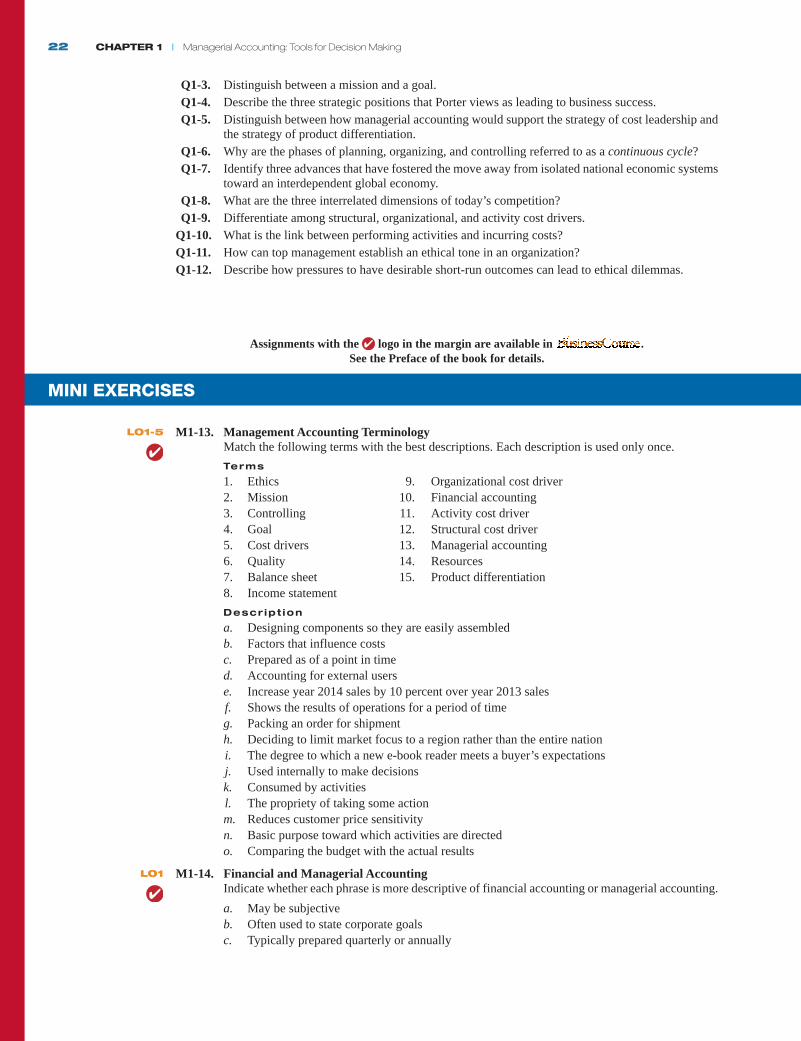
M1-13. Management Accounting TerminologyMatch the following terms with the best descriptions. each description is used only once.Terms
1. ethics 9. Organizational cost driver 2. Mission 10. Financial accounting 3. Controlling 11. Activity cost driver 4. Goal 12. structural cost driver 5. Cost drivers 13. Managerial accounting 6. Quality 14. resources 7. Balance sheet 15. Product differentiation 8. income statementdescr ipt ion
a. Designing components so they are easily assembled b. Factors that influence costs c. Prepared as of a point in time d. Accounting for external users e. increase year 2014 sales by 10 percent over year 2013 sales f. shows the results of operations for a period of time g. Packing an order for shipment h. Deciding to limit market focus to a region rather than the entire nation i. The degree to which a new e-book reader meets a buyer’s expectations j. used internally to make decisions k. Consumed by activities l. The propriety of taking some action m. reduces customer price sensitivity n. Basic purpose toward which activities are directed o. Comparing the budget with the actual results
M1-14. Financial and Managerial Accountingindicate whether each phrase is more descriptive of financial accounting or managerial accounting. a. May be subjective b. Often used to state corporate goals c. Typically prepared quarterly or annually
LO1-5
LO1
22 chaPter 1 | Managerial Accounting: Tools for Decision Making
d. May measure time or customer satisfaction e. Future oriented f. has a greater emphasis on cost-benefit analysis g. Keeps records of assets and liabilities h. highly aggregated statements i. Must conform to external standards j. special-purpose reports k. Decision-making tool l. income statement, balance sheet, and statement of cash flows
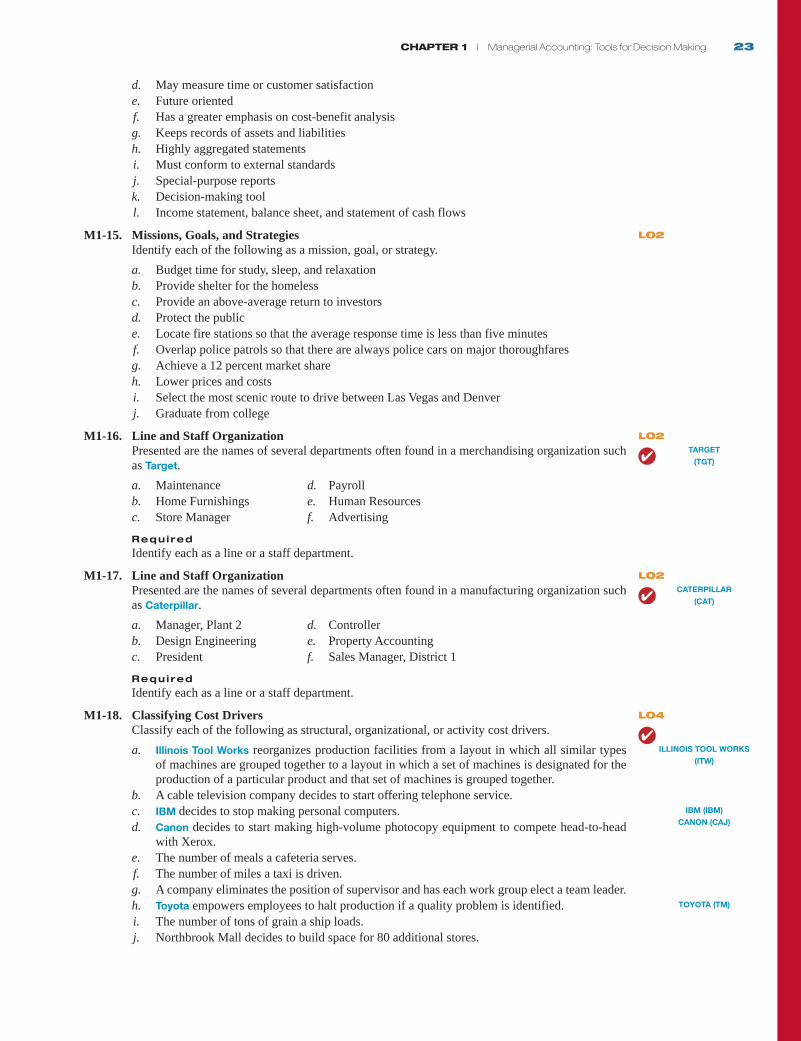
M1-15. Missions, Goals, and Strategiesidentify each of the following as a mission, goal, or strategy. a. Budget time for study, sleep, and relaxation b. Provide shelter for the homeless c. Provide an above-average return to investors d. Protect the public e. locate fire stations so that the average response time is less than five minutes f. Overlap police patrols so that there are always police cars on major thoroughfares g. Achieve a 12 percent market share h. lower prices and costs i. select the most scenic route to drive between las Vegas and Denver j. Graduate from college
M1-16. Line and Staff OrganizationPresented are the names of several departments often found in a merchandising organization such as Target. a. Maintenance d. Payroll b. home Furnishings e. human resources c. store Manager f. Advertising
Required
identify each as a line or a staff department.
M1-17. Line and Staff OrganizationPresented are the names of several departments often found in a manufacturing organization such as Caterpillar. a. Manager, Plant 2 d. Controller b. Design engineering e. Property Accounting c. President f. sales Manager, District 1
Required
identify each as a line or a staff department.
M1-18. Classifying Cost DriversClassify each of the following as structural, organizational, or activity cost drivers. a. Illinois Tool Works reorganizes production facilities from a layout in which all similar types
of machines are grouped together to a layout in which a set of machines is designated for the production of a particular product and that set of machines is grouped together.
b. A cable television company decides to start offering telephone service. c. IBM decides to stop making personal computers. d. Canon decides to start making high-volume photocopy equipment to compete head-to-head
with Xerox. e. The number of meals a cafeteria serves. f. The number of miles a taxi is driven. g. A company eliminates the position of supervisor and has each work group elect a team leader. h. Toyota empowers employees to halt production if a quality problem is identified. i. The number of tons of grain a ship loads. j. northbrook Mall decides to build space for 80 additional stores.
LO2
LO2TARGET
(TGT)
LO2CATERPILLAR
(CAT)
LO4
ILLINOIS TOOL WORKS
(ITW)
IBM (IBM)
CANON (CAJ)
TOYOTA (TM)
chaPter 1 | Managerial Accounting: Tools for Decision Making 23

M1-19. Classifying Cost Drivershenderson Construction managers provide design and construction management services for vari-ous commercial construction projects. senior managers are trying to apply cost driver concepts to their firm to better understand henderson’s costs.
Required
Classify each of the following actions or decisions as structural, organizational, or activity cost drivers. a. The decision to be a regional leader in computer-assisted design services. b. The decision to allow staff architects to follow a specific project through to completion. c. The daily process of inspecting the progress on various construction projects. d. The process of conducting extensive client interviews to assess the exact needs for henderson
services. e. The decision to expand the market area by establishing an office in another state. f. The decision to use only henderson staff rather than relying on subcontractors. g. The process of receiving approval from government authorities along with appropriate per-
mits for each project. h. The decision to organize the workforce into project teams. i. The decision to build a new headquarters facility with areas for design and administration as
well as storage and maintenance of construction equipment. j. The process of grading building sites and preparing forms for foundations.
exerCises
E1-20. Financial and Managerial AccountingAssume Amy Fuller has just been promoted to product manager at Kraft Foods. Although she is an accomplished sales representative and well versed in market research, her accounting background is limited to reviewing her paycheck, balancing her checkbook, filing income tax returns, and re-viewing the company’s annual income statement and balance sheet. she commented that while the financial statements are no doubt useful to investors, she just doesn’t see how accounting can help her be a good product manager.
Required
Based on her remarks, it is apparent that Amy’s view of accounting is limited to financial account-ing. explain some of the important differences between financial and managerial accounting and suggest some ways managerial accounting can help Amy be a better product manager.
E1-21. Developing an Organization ChartDevelop an organization chart for a three-outlet bakery chain with a central baking operation and deliveries every few hours. Assume the business is incorporated and that the president has a single staff assistant. Also assume that the delivery truck driver reports to the bakery manager.
E1-22. Identifying Monetary and Nonmonetary Performance Measuresidentify possible monetary and nonmonetary performance measures for each of the following situ-ations. One nonmonetary measure should relate to quality, and one should relate to time. a. Duke University wishes to evaluate the success of last year’s graduating class. b. Grady Memorial Hospital wishes to evaluate the performance of its emergency room. c. Wal-mart wishes to evaluate the performance of its online order–filling operations. d. Marriott Hotels wishes to evaluate the performance of registration activities at one of its hotels. e. FedEx wishes to evaluate the success of its operations in Knoxville.
E1-23. Identifying Monetary and Nonmonetary Performance Measuresidentify possible monetary and nonmonetary performance measures for each of the following situ-ations. One nonmonetary measure should relate to quality, and one should relate to time. a. AT&T’s evaluation of the performance of its internet service in Boston. b. Comcast Cable’s evaluation of the performance of new customer cable installations in
springfield.
LO4
LO1KRAFT FOODS GROUP
(KRFT)
LO2
LO2
DUKE UNIVERSITY
GRADY MEMORIAL HOSPITAL
WAL-MART STORES (WMT)
MARRIOTT (MAR)
FEDEx (FDx)
LO2
AT&T (T)
COMCAST (CMCSA)
DELL COMPUTER (DELL)
24 chaPter 1 | Managerial Accounting: Tools for Decision Making

c. Dell Computer’s evaluation of the performance of its logistical arrangements for delivering computers to residential customers.
d. Amazon.com’s evaluation of the performance of its Web site. e. Rice University’s evaluation of the success of its freshman admissions activities.
E1-24. Identifying Information Needs of Different ManagersMatt Parker operates a number of auto dealerships for Ford and Mitsubishi. identify possible mon-etary and nonmonetary performance measures for each of the following situations. One nonmon-etary measure should relate to quality, and one should relate to time. a. An individual sales associate. b. The sales manager of a single dealership. c. The general manager of a particular dealership. d. The corporate chief financial officer. e. The president of the corporation.
E1-25. Activities and Cost DriversFor each of the following activities, select the most appropriate cost driver. each cost driver may be used only once.
Activity Cost Driver
1. Pay vendors a. Number of different raw material items2. Receive material deliveries b. Number of classes offered3. Inspect raw materials c. Number of machine hours4. Plan for purchases of raw materials d. Number of employees 5. Packaging e. Number of maintenance hours6. Supervision f. Number of units of raw materials received7. Employee training g. Number of new customers8. Operating machines h. Number of deliveries9. Machine maintenance i. Number of checks issued
10. Opening accounts at a bank j. Number of customer orders
CAses And prOJeCts
C1-26. Goals and Strategies a. What is your instructor’s goal for students in this course? What strategies has he or she devel-
oped to achieve this goal? b. What is your goal in this course? What strategies will help you achieve this goal? c. What is your goal for this semester or term? What strategies will help you achieve this goal? d. What is your next career goal? What strategies will help you achieve this goal?
C1-27. Product DifferentiationYou are the owner of lobster’s unlimited. You have no trouble catching lobsters, but you have dif-ficulty in selling all that you catch. The problem is that all lobsters from all vendors look the same. You do catch high-quality lobsters, but you need to be able to tell your customers that your lobsters are better than those sold by other vendors.
Required
a. What are some possible ways of distinguishing your lobsters from those of other vendors? b. explain the possible results of this differentiation.
C1-28. Ethics and Short-Term BorrowingJill, an administrative assistant, is in charge of petty cash for a local law firm. normally, about $300 is kept in the petty cash box. When Jill is short on cash and needs some for lunch or to pay her babysitter, she sometimes takes a few dollars from the box. since she is in charge of the box, nobody knows that she takes the money, and she always replaces it within a few days.
AMAZON.COM (AMZN)
RICE UNIVERSITY
LO2FORD
MITSUBISHI
LO4
LO2
LO3
LO5
chaPter 1 | Managerial Accounting: Tools for Decision Making 25

Required
a. is Jill’s behavior ethical? b. Assume that Jill has recently had major problems meeting her bills. she also is in charge of
purchasing supplies for the office from petty cash. last week when she needed $50 for the babysitter, she falsified a voucher for the amount of $50. is this behavior ethical?
C1-29. Ethics and Travel ReimbursementBill takes many business trips throughout the year. All of his expenses are paid by his company. last week he traveled to rio De Janeiro, Brazil, and stayed there on business for five days. he is allowed a maximum of $50 per day for food and $150 per day for lodging. To his surprise, the food and accommodations in Brazil were much less than he expected. Being upset about traveling last week and having to sacrifice tickets he’d purchased to a red sox baseball game, he decided to inflate his expenses a bit. he increased his lodging expense from $80 per day to $100 per day and his food purchased from $30 per day to $40 per day. Therefore, for the five-day trip, he overstated his expenses by $150 total. After all, the allowance was higher than the amount he spent.
Required
Assume that the company would never find out that he had actually spent less. Are Bill’s actions ethical? Are they acceptable?
C1-30. Ethical Issues with Supplier-Buyer PartnershipsJohn snyder was excited to learn of his appointment as Circuit electronics Corporation’s sales rep-resentative to household Appliance, inc. For the past four years, Circuit electronics has supplied all of the electric switches used in household’s washers and dryers. As Circuit electronics’ sales representative, John snyder’s job involves the following tasks.
1. Working with household engineers to design electric switches that can be manufactured to meet household’s cost and quality requirements.
2. Assisting household in resolving any problems related to electric switches. 3. Monitoring the inventory levels of electric switches at household and placing orders for ad-
ditional switches when appropriate.This appointment will require John to move to stutgart, Germany, for two years. Although John has mixed feelings about the move, he is familiar with the success of the program in improving Circuit electronics’ financial performance. he is also very much aware of the fact that the two previous sales representatives received promotions at the end of their appointments. As John toured the household factory in stutgart with his predecessor, Janet smith, his ex-citement turned to concern. it became apparent that Circuit electronics had not been supplying household with the best available switches at the lowest possible costs. Although the switches were adequate, they were more likely to wear out after five or six years of use than would switches currently on the market (and being used by household’s competitors). Furthermore, taking into account the current number of switches in transit by ship from north America to europe, it also appeared that the inventory level of electric switches would soon be more than enough to satisfy household’s needs for the next four months.
Required
if you were John, what would you do?
C1-31. Expected Values of Questionable DecisionsThe members of the jury had to make a decision in a lawsuit brought by the state of Alabama against Exxon Mobil. The suit revolved around natural-gas wells that exxon drilled in state-owned waters. After signing several leases obligating exxon to share revenues with Alabama, company officials started questioning the terms of the agreement that prohibited deducting several types of processing costs before paying the state royalties. During the course of the trial, a memo by an in-house attorney of exxon Mobil came to light. The memo noted that Royal Dutch/Shell, which had signed a similar lease, interpreted it “in the same manner as the state.” The memo then presented arguments the company might use to claim the deduction, estimated the probability of the arguments being successful (less than 50 percent), and proceeded to consider whether exxon should obey the law using a cost-benefit analysis. Ac-cording to the memo, “if we adopt anything beyond a ‘safe’ approach, we should anticipate a quick audit and subsequent litigation.” The memo also observed that “our exposure is 12 percent interest
LO5
LO5
LO5ExxON MOBIL (xOM)
ROYAL DUTCH/SHELL (RDS-B)
26 chaPter 1 | Managerial Accounting: Tools for Decision Making

on underpayments calculated from the due date, and the cost of litigation.” Deducting the question-able costs did, indeed, result in an audit and a lawsuit. source: Business Week.9
Required
if you were a member of the jury, what would you do? Why?
C1-32. Management Decisions Affecting Cost DriversAn avid bicycle rider, you have decided to use an inheritance to start a new business to sell and repair bicycles. Two college friends have already accepted offers to work for you.
Required
a. What is the mission of your new business? b. suggest a strategic positioning goal you might strive for to compete with area hardware and
discount stores that sell bicycles. c. identify two items that might be long-range goals. d. identify two items that might be goals for the coming year. e. Mention two decisions that will be structural cost drivers. f. Mention two decisions that will be organizational cost drivers. g. identify two activity cost drivers.
C1-33. Success Factors and Performance MeasurementThree years ago, Vincent Chow completed his college degree. The economy was in a depressed state at the time, and Vincent managed to get an offer of only $25,000 per year as a bookkeeper. in addition to its relatively low pay, this job had limited advancement potential. since Vincent was an enterprising and ambitious young man, he instead started a business of his own. he was convinced that because of changing lifestyles, a drive-through coffee establishment would be profitable. he was able to obtain backing from his parents to open such an establishment close to the industrial park area in town. Vincent named his business The Cappuccino express and decided to sell only two types of coffee: cappuccino and decaffeinated. As Vincent had expected, The Cappuccino express was very well received. Within three years, Vincent had added another outlet north of town. he left the day-to-day management of each site to a manager and turned his attention toward overseeing the entire enterprise. he also hired an assistant to do the record keeping and other selected chores.10
Required
a. Develop an organization chart for The Cappuccino express. b. What factors can be expected to have a major impact on the success of The Cappuccino
express? c. What major tasks must Vincent undertake in managing The Cappuccino express? d. What are the major costs of operating The Cappuccino express? e. Vincent would like to monitor the performance of each site manager. What measure(s) of
performance should he use? f. if you suggested more than one measure, which of these should Vincent select if he could use
only one? g. suppose that last year, the original site had yielded total revenues of $146,000, total costs
of $122,000, and hence, a profit of $24,000. Vincent had judged this profit performance to be satisfactory. For the coming year, Vincent expects that due to factors such as increased name recognition and demographic changes, the total revenues will increase by 20 percent to $175,200. What amount of profit should he expect from the site? Discuss the issues involved in developing an estimate of profit.
9 Mike France, “When Big Oil Gets Too slick,” Business Week, April 9, 2001, p. 70.10 Based on Chee W. Chow, “instructional Case: Vincent’s Cappuccino express—A Teaching Case to help students Master Basic Cost Terms and Concepts Through interactive learning,” Issues in Accounting Education, spring 1995, pp. 173–190.
LO4
LO2
chaPter 1 | Managerial Accounting: Tools for Decision Making 27

sOLUtiOns tO revieW prObLeMs
Mid-Chapter Review
Solut ion
2, 5, 7, 8, 9, and 10
Chapter-End Review
Solut ion
a. Activity cost driverb. structural cost driverc. structural cost driverd. Activity cost drivere. Activity cost driverf. structural cost driverg. Organizational cost driverh. Organizational cost driveri. Organizational cost driverj. Organizational cost driver
28 chaPter 1 | Managerial Accounting: Tools for Decision Making

batch-level activity, 48capacity costs, 39coefficient of determination, 43committed fixed costs, 39cost behavior, 32cost estimation, 40cost prediction, 41customer-level activity, 49direct labor, 47direct materials, 47discretionary fixed costs, 39
facility-level activity, 48, 49fixed costs, 33high-low method of cost
estimation, 40least-squares regression analysis,
43managed fixed costs, 39manufacturing overhead, 47marginal cost, 36market-segment-level activity, 49mixed costs, 33
order-level activity, 49product-level activity, 48project-level activity, 49relevant range, 35, 37scatter diagram, 42semivariable costs, 33step costs, 33unit-level activity, 47, 49variable costs, 32
keY terMs
MULtipLe CHOiCe
1. A graph of the total cost of ingredients used in Blaze Pizza’s pizzas most closely resembles this total cost behavior pattern: a. Variable cost b. Fixed cost c. Mixed cost d. step cost
2. At a sales volume of 50 units the average cost is $ 410 per unit and the variable cost is $ 10 per unit. Assuming a linear cost behavior pattern, if sales double to 100 units the average cost will be: a. $ 10 b. $200 c. $205 d. $210
3. increasing the length of the time period included in each observation of activity and cost will assist in overcoming this possible problem in cost estimation: a. Data not based on normal operations b. nonlinear relationship between total costs and activity c. Changes in technology or prices d. Failure to match activity and costs within each observation
4. Arch manufactures a product with the following manufacturing cost hierarchy for its only current product:
Cost
Unit. . . . . . . . . . . . . . . . . . . . . . . . . . . . . . . . . . . . . . . . . . . . . . . . . . . . . . . . . . . . . . . . . . . . . $20/unitBatch . . . . . . . . . . . . . . . . . . . . . . . . . . . . . . . . . . . . . . . . . . . . . . . . . . . . . . . . . . . . . . . . . . . $500/batchProduct . . . . . . . . . . . . . . . . . . . . . . . . . . . . . . . . . . . . . . . . . . . . . . . . . . . . . . . . . . . . . . . . . $10,000/yearFacility . . . . . . . . . . . . . . . . . . . . . . . . . . . . . . . . . . . . . . . . . . . . . . . . . . . . . . . . . . . . . . . . . . $50,000/year
next year Arch plans to manufacture 50,000 units of product in batches of 500 units. Arch’s predicted manufacturing costs for next year are: a. $1,560,000 b. $1,500,000 c. $1,110,000 d. $660,000
Multiple C
hoice Answ
ers1. a
2. d 3. d
4. c 5. d
chaPter 2 | Cost Behavior, Activity Analysis, and Cost Estimation 51

5. West sells specialized products produced by electronics companies to 100 engineering firms at a selling price based on West’s purchase price. West’s customer cost hierarchy is as follows:
Cost
Unit. . . . . . . . . . . . . . . . . . . . . . . . . . . . . . . . . . . . . . . . . . . . . . . . . . . . . . . 80 percent of selling priceBatch . . . . . . . . . . . . . . . . . . . . . . . . . . . . . . . . . . . . . . . . . . . . . . . . . . . . . $200 per sales orderCustomer . . . . . . . . . . . . . . . . . . . . . . . . . . . . . . . . . . . . . . . . . . . . . . . . . . $1,000 per customer per yearFacility . . . . . . . . . . . . . . . . . . . . . . . . . . . . . . . . . . . . . . . . . . . . . . . . . . . . $120,000 per year
next year West plans to sell $4,000,000 of product to the 100 engineering firms they serve. They anticipate that each firm will place an average of 4 orders. West’s predicted customer costs for next year are: a. $80,000 b. $300,000 c. $3,200,000 d. $3,500,000
disCUssiOn QUestiOns
Q2-1. Briefly describe variable, fixed, mixed, and step costs and indicate how the total cost function of each changes as activity increases within a time period.
Q2-2. Why is presenting all costs of an organization as a function of a single independent variable, al-though useful in obtaining a general understanding of cost behavior, often not accurate enough to make specific decisions concerning products, services, or activities?
Q2-3. explain the term “relevant range” and why it is important in estimating total costs. Q2-4. how are variable and fixed costs determined using the high-low method of cost estimation? Q2-5. Distinguish between cost estimation and cost prediction. Q2-6. Why is a scatter diagram helpful when used in conjunction with other methods of cost estimation? Q2-7. identify two advantages of least-squares regression analysis as a cost estimation technique. Q2-8. Why is it important to match activity and costs within a single observation? When is this matching
problem most likely to exist? Q2-9. During the past century, how have direct materials, direct labor, and manufacturing overhead
changed as a portion of total manufacturing costs? What is the implication of the change in manu-facturing overhead for cost estimation?
Q2-10. Distinguish between the unit-, batch-, product-, and facility-level activities of a manufacturing organization.
Assignments with the logo in the margin are available in . See the Preface of the book for details.
Mini exerCises
M2-11. Classifying Cost BehaviorClassify the total costs of each of the following as variable, fixed, mixed, or step. sales volume is the cost driver. a. salary of the department manager b. Memory chips in a computer assembly plant c. real estate taxes d. salaries of quality inspectors when each inspector can evaluate a maximum of 1,000 units per
day e. Wages paid to production employees for the time spent working on products f. electric power in a factory g. raw materials used in production
LO1
52 chaPter 2 | Cost Behavior, Activity Analysis, and Cost Estimation

h. Automobiles rented on the basis of a fixed charge per day plus an additional charge per mile driven
i. sales commissions j. Depreciation on office equipment
M2-12. Classifying Cost BehaviorClassify the total costs of each of the following as variable, fixed, mixed, or step. a. straight-line depreciation on a building b. Maintenance costs at a hospital c. rent on a photocopy machine charged as a fixed amount per month plus an additional charge
per copy d. Cost of goods sold in a bookstore e. salaries paid to temporary instructors in a college as the number of course sessions varies f. lumber used by a house construction company g. The costs of operating a research department h. The cost of hiring a dance band for three hours i. laser printer paper for a department printer j. electric power in a restaurant
M2-13. Classifying Cost BehaviorFor each of the following situations, select the most appropriate cost behavior pattern (as shown in the illustrations following this problem) where the lines represent the cost behavior pattern, the vertical axis represents costs, the horizontal axis represents total volume, and the dots represent actual costs. each pattern may be used more than once. a. Variable costs per unit b. Total fixed costs c. Total mixed costs d. Average fixed costs per unit e. Total current manufacturing costs f. Average variable costs g. Total costs when employees are paid $15 per hour for the first 40 hours worked each week and
$20 for each additional hour. h. Total costs when employees are paid $15 per hour and guaranteed a minimum weekly wage of
$300. i. Total costs per day when a consultant is paid $200 per hour with a maximum daily fee of
$1,000. j. Total variable costs k. Total costs for salaries of social workers where each social worker can handle a maximum of
25 cases l. A water bill where a flat fee of $800 is charged for the first 100,000 gallons and additional
water costs $0.005 per gallon m. Total variable costs properly used to estimate step costs n. Total materials costs o. rent on exhibit space at a convention
LO1
LO1
chaPter 2 | Cost Behavior, Activity Analysis, and Cost Estimation 53

Some other relationship
(1) (2) (3) (4)
(5) (6) (7) (8)
(9) (10) (11) (12)
Graphs for Min i Exerc ise 2-13
M2-14. Classifying Cost BehaviorFor each of the graphs displayed following this problem, select the most appropriate cost behavior pattern where the lines represent the cost behavior pattern, the vertical axis represents total costs, the horizontal axis represents total volume, and the dots represent actual costs. each pattern may be used more than once. a. A cellular telephone bill when a flat fee is charged for the first 500 minutes of use per month
and additional use costs $0.25 per minute b. Total selling and administrative costs c. Total labor costs when employees are paid per unit produced d. Total overtime premium paid production employees e. Average total cost per unit f. salaries of supervisors when each one can supervise a maximum of 10 employees g. Total idle time costs when employees are paid for a minimum 40-hour week h. Materials costs per unit i. Total sales commissions j. electric power consumption in a restaurant k. Total costs when high volumes of production require the use of overtime and obsolete
equipment l. A good linear approximation of actual costs m. A linear cost estimation valid only within the relevant range
LO1
54 chaPter 2 | Cost Behavior, Activity Analysis, and Cost Estimation

Some otherrelationship
(1) (2) (3) (4)
(5) (6) (7) (8)
(9) (10) (11) (12)
Graphs for Min i Exerc ise 2-14
exerCises
E2-15. Computing Average Unit CostsThe total monthly operating costs of Chili To Go are:
$12,000 1 $0.50Xwhere
X 5 servings of chiliRequired
a. Determine the average cost per serving at each of the following monthly volumes: 100; 1,000; 5,000; and 10,000
b. Determine the monthly volume at which the average cost per serving is $0.70.
E2-16. Automatic versus Manual ProcessingPhoto station Company operates a printing service for customers with digital cameras. The cur-rent service, which requires employees to download photos from customer cameras, has monthly operating costs of $6,000 plus $0.20 per photo printed. Management is evaluating the desirability of acquiring a machine that will allow customers to download and make prints without employee assistance. if the machine is acquired, the monthly fixed costs will increase to $10,000 and the variable costs of printing a photo will decline to $0.04 per photo.
Required
a. Determine the total costs of printing 20,000 and 50,000 photos per month: 1. With the current employee-assisted process. 2. With the proposed customer self-service process. b. Determine the monthly volume at which the proposed process becomes preferable to the cur-
rent process.
LO2
LO2
chaPter 2 | Cost Behavior, Activity Analysis, and Cost Estimation 55

E2-17. Automatic versus Manual ProcessingMid-Town Copy service processes 2,100,000 photocopies per month at its mid-town service cen-ter. Approximately 50 percent of the photocopies require collating. Collating is currently per-formed by high school and college students who are paid $8 per hour. each student collates an average of 5,000 copies per hour. Management is contemplating the lease of an automatic collating machine that has a monthly capacity of 6,000,000 photocopies, with lease and operating costs total-ing $1,550, plus $0.05 per 1,000 units collated.
Required
a. Determine the total costs of collating 500,000 and 1,500,000 per month: 1. With student help. 2. With the collating machine. b. Determine the monthly volume at which the automatic process becomes preferable to the
manual process.
E2-18. High-Low Cost EstimationAssume the local DHL delivery service hub has the following information available about fleet miles and operating costs:
Year Miles Operating Costs
2012 . . . . . . . . . . . . . . . . . . . . . . . . . . . . . . . . . . . . . . . . . . . . . . . . . . 556,000 $182,0002013 . . . . . . . . . . . . . . . . . . . . . . . . . . . . . . . . . . . . . . . . . . . . . . . . . . 684,000 214,000
Required
use the high-low method to develop a cost-estimating equation for total annual operating costs.
E2-19. Scatter Diagrams and High-Low Cost EstimationAssume the local Pearle Vision has the following information on the number of sales orders re-ceived and order-processing costs.
Month Sales Orders Order-Processing Costs
1 . . . . . . . . . . . . . . . . . . . . . . . . . . . . . . . . . . 3,000 $32,0002 . . . . . . . . . . . . . . . . . . . . . . . . . . . . . . . . . . 1,500 22,4003 . . . . . . . . . . . . . . . . . . . . . . . . . . . . . . . . . . 4,400 55,4004 . . . . . . . . . . . . . . . . . . . . . . . . . . . . . . . . . . 2,800 31,2005 . . . . . . . . . . . . . . . . . . . . . . . . . . . . . . . . . . 2,300 25,6006 . . . . . . . . . . . . . . . . . . . . . . . . . . . . . . . . . . 1,200 17,0007 . . . . . . . . . . . . . . . . . . . . . . . . . . . . . . . . . . 2,000 24,000
Required
a. use information from the high- and low-volume months to develop a cost-estimating equation for monthly order-processing costs.
b. Plot the data on a scatter diagram. using the information from representative high- and low- volume months, develop a cost-estimating equation for monthly production costs.
c. What factors might have caused the difference in the equations developed for requirements (a) and (b)?
E2-20. Scatter Diagrams and High-Low Cost EstimationFrom April 1 through October 31, Will County highway Department hires temporary employees to mow and clean the right-of-way along county roads. The County road Commissioner has asked you to help her in determining the variable labor cost of mowing and cleaning a mile of road. The following information is available regarding current-year operations:
LO2
LO2
DHL (DHL)
LO2, 3PEARLE VISION
LO2, 3
56 chaPter 2 | Cost Behavior, Activity Analysis, and Cost Estimation

MonthMiles Mowed and Cleaned
Labor Costs
April . . . . . . . . . . . . . . . . . . . . . . . . . . . . . . . . . . . . . . . . . . . . . . . . . . . . . . 350 $8,000May . . . . . . . . . . . . . . . . . . . . . . . . . . . . . . . . . . . . . . . . . . . . . . . . . . . . . . 300 7,500June . . . . . . . . . . . . . . . . . . . . . . . . . . . . . . . . . . . . . . . . . . . . . . . . . . . . . . 400 9,000July. . . . . . . . . . . . . . . . . . . . . . . . . . . . . . . . . . . . . . . . . . . . . . . . . . . . . . . 250 5,500August . . . . . . . . . . . . . . . . . . . . . . . . . . . . . . . . . . . . . . . . . . . . . . . . . . . . 375 8,500September . . . . . . . . . . . . . . . . . . . . . . . . . . . . . . . . . . . . . . . . . . . . . . . . . 200 5,000October . . . . . . . . . . . . . . . . . . . . . . . . . . . . . . . . . . . . . . . . . . . . . . . . . . . 100 4,800
Required
a. use the information from the high- and low-volume months to develop a cost-estimating equation for monthly labor costs.
b. Plot the data on a scatter diagram. using the information from representative high- and low-volume months, use the high-low method to develop a cost-estimating equation for monthly labor costs.
c. What factors might have caused the difference in the equations developed for requirements (a) and (b)?
d. Adjust the equation developed in requirement (b) to incorporate the effect of an anticipated 7 percent increase in wages.
E2-21. Cost Behavior Analysis in a Restaurant: High-Low Cost EstimationAssume a Jimmy John’s restaurant has the following information available regarding costs at rep-resentative levels of monthly sales:
Monthly sales in units
5,000 8,000 10,000
Cost of food sold. . . . . . . . . . . . . . . . . . . . . . . . . . . . . . . . . . . . . . . . $10,000 $16,000 $20,000
Wages and fringe benefits . . . . . . . . . . . . . . . . . . . . . . . . . . . . . . . . 4,250 4,400 4,500
Fees paid delivery help . . . . . . . . . . . . . . . . . . . . . . . . . . . . . . . . . . . 1,250 2,000 2,500
Rent on building . . . . . . . . . . . . . . . . . . . . . . . . . . . . . . . . . . . . . . . . 1,200 1,200 1,200
Depreciation on equipment. . . . . . . . . . . . . . . . . . . . . . . . . . . . . . . . 600 600 600
Utilities . . . . . . . . . . . . . . . . . . . . . . . . . . . . . . . . . . . . . . . . . . . . . . . . 500 560 600
Supplies (soap, floor wax, etc.) . . . . . . . . . . . . . . . . . . . . . . . . . . . . 150 180 200
Administrative costs . . . . . . . . . . . . . . . . . . . . . . . . . . . . . . . . . . . . . 1,300 1,300 1,300
Total . . . . . . . . . . . . . . . . . . . . . . . . . . . . . . . . . . . . . . . . . . . . . . . . . . $19,250 $26,240 $30,900
Required
a. identify each cost as being variable, fixed, or mixed. b. use the high-low method to develop a schedule identifying the amount of each cost that is
mixed or variable per unit. Total the amounts under each category to develop an equation for total monthly costs.
c. Predict total costs for a monthly sales volume of 10,000 units.
E2-22. Developing an Equation from Average CostsThe Desert Dog and Cat hotel is a pet hotel located in las Vegas. Assume that in March, when dog-days (occupancy) were at an annual low of 500, the average cost per dog-day was $22. in July, when dog-days were at a capacity level of 4,500, the average cost per dog-day was $8.
Required
a. Develop an equation for monthly operating costs. b. Determine the average cost per dog-day at an annual volume of 24,000 dog-days.
LO2JIMMY JOHN’S (SANDWICHES)
LO2
chaPter 2 | Cost Behavior, Activity Analysis, and Cost Estimation 57

E2-23. Selecting an Independent Variable: Scatter DiagramsPeak Production Company produces backpacks that are sold to sporting goods stores throughout the rocky Mountains. Presented is information on production costs and inventory changes for five recent months:
January February March April May
Finished goods inventory in units:Beginning. . . . . . . . . . . . . . . . . . . . . 30,000 40,000 50,000 30,000 60,000Manufactured . . . . . . . . . . . . . . . . . 60,000 90,000 80,000 90,000 100,000
Available. . . . . . . . . . . . . . . . . . . . . . 90,000 130,000 130,000 120,000 160,000Sold . . . . . . . . . . . . . . . . . . . . . . . . . (50,000) (80,000) (100,000) (60,000) (120,000)
Ending . . . . . . . . . . . . . . . . . . . . . . . 40,000 50,000 30,000 60,000 40,000
Manufacturing costs . . . . . . . . . . . . $300,000 $500,000 $450,000 $450,000 $550,000
Required
a. With the aid of scatter diagrams, determine whether units sold or units manufactured is a better predictor of manufacturing costs.
b. Prepare an explanation for your answer to requirement (a). c. Which independent variable, units sold or units manufactured, should be a better predictor of
selling costs? Why?
E2-24. Selecting a Basis for Predicting Shipping Expenses (Requires Computer Spreadsheet*)Penn Company assembles and sells computer boards in western Pennsylvania. in an effort to im-prove the planning and control of shipping expenses, management is trying to determine which of three variables—units shipped, weight shipped, or sales value of units shipped—has the closest relationship with shipping expenses. The following information is available:
MonthUnits
ShippedWeight
Shipped (lbs.)Sales Value of Units Shipped
Shipping Expenses
May . . . . . . . . . . . . . . . . . . . . . 3,000 6,200 $100,000 $ 5,600June . . . . . . . . . . . . . . . . . . . . . 5,000 8,000 110,000 7,700July. . . . . . . . . . . . . . . . . . . . . . 4,000 8,100 80,000 6,500August . . . . . . . . . . . . . . . . . . . 7,000 10,000 114,000 10,400September . . . . . . . . . . . . . . . . 6,000 7,000 140,000 8,600October . . . . . . . . . . . . . . . . . . 4,500 8,000 160,000 8,200
Required
a. With the aid of a spreadsheet program, determine whether units shipped, weight shipped, or sales value of units shipped has the closest relationship with shipping expenses.
b. using the independent variable that appears to have the closest relationship to shipping ex-penses, develop a cost-estimating equation for total monthly shipping expenses.
c. use the equation developed in requirement (b) to predict total shipping expenses in a month when 5,000 units, weighing 7,000 lbs., with a total sales value of $114,000 are shipped.
prObLeMs
P2-25. High-Low and Scatter Diagrams with Implications for RegressionTrumpet Bagels produces and sells bagels at each of its restaurants. Presented is monthly cost and sales information for one of Trumpet’s restaurants.
LO2, 3
LO2, 3
* This exercise and several subsequent assignments require the use of a computer spreadsheet such as excel® to solve. This assignment assumes previous knowledge of computer spreadsheets.
LO2, 3
58 chaPter 2 | Cost Behavior, Activity Analysis, and Cost Estimation

Month Sales (Dozens) Total Costs
January . . . . . . . . . . . . . . . . . . . . . . . . . . . . . . . . . . . . . . . . . . . 7,500 $28,800February. . . . . . . . . . . . . . . . . . . . . . . . . . . . . . . . . . . . . . . . . . . 6,000 26,400March . . . . . . . . . . . . . . . . . . . . . . . . . . . . . . . . . . . . . . . . . . . . . 4,000 20,400April . . . . . . . . . . . . . . . . . . . . . . . . . . . . . . . . . . . . . . . . . . . . . . 1,500 19,200May . . . . . . . . . . . . . . . . . . . . . . . . . . . . . . . . . . . . . . . . . . . . . . 5,000 21,600June . . . . . . . . . . . . . . . . . . . . . . . . . . . . . . . . . . . . . . . . . . . . . . 5,500 23,400
Required
a. using the high-low method, develop a cost-estimating equation for total monthly costs. b. 1. Plot the equation developed in requirement (a). 2. using the same graph, develop a scatter diagram of all observations for the bagel shop.
select representative high and low values and draw a second cost-estimating equation. c. Which is a better predictor of future costs? Why? d. if you decided to develop a cost-estimating equation using least-squares regression analysis,
should you include all the observations? Why or why not? e. Mention two reasons that the least-squares regression is superior to the high-low and scatter
diagram methods of cost estimation.
P2-26. Multiple Cost Driversscottsdale ltd. manufactures a variety of high-volume and low-volume products to customer de-mand. Presented is information on 2013 manufacturing overhead and activity cost drivers.
Level Total Cost Units of Cost Driver
Unit. . . . . . . . . . . . . . . . . . . . . . . . . . . . . . . . $500,000 10,000 machine hoursBatch . . . . . . . . . . . . . . . . . . . . . . . . . . . . . . 100,000 500 customer ordersProduct . . . . . . . . . . . . . . . . . . . . . . . . . . . . 200,000 25 products
Product X1 required 2,000 machine hours to fill 10 customer orders for a total of 8,000 units.
Required
a. Assuming all manufacturing overhead is estimated and predicted on the basis of machine hours, determine the predicted total overhead costs to produce the 8,000 units of product X1.
b. Assuming manufacturing overhead is estimated and predicted using separate rates for ma-chine hours, customer orders, and products (a multiple-level cost hierarchy), determine the predicted total overhead costs to produce the 8,000 units of product X1.
c. Calculate the error in predicting manufacturing overhead using machine hours versus using multiple cost drivers. indicate whether the use of only machine hours results in overpredicting or underpredicting the costs to produce 8,000 units of product X1.
d. Determine the error in the prediction of X1 batch-level costs resulting from the use of only machine hours. indicate whether the use of only machine hours results in overpredicting or underpredicting the batch-level costs of product X1.
e. Determine the error in the prediction of X1 product-level costs resulting from the use of only machine hours. indicate whether the use of only machine hours results in overpredicting or underpredicting the product-level costs of product X1.
P2-27. Unit- and Batch-Level Cost DriversKC, a fast-food restaurant, serves fried chicken, fried fish, and French fries. The managers have estimated the costs of a batch of fried chicken for KC’s all-you-can-eat Friday Fried Fiesta. each batch must be 100 pieces. The chicken is precut by the chain headquarters and sent to the stores in 10-piece bags. each bag costs $4. Preparing a batch of 100 pieces of chicken with KC’s special coating takes one employee two hours. The current wage rate is $8 per hour. Another cost driver is the cost of putting fresh oil into the fryers. new oil, costing $6, is used for each batch.
Required
a. Determine the cost of preparing one batch of 100 pieces. b. if management projects that it will sell 300 pieces of fried chicken, determine the total batch
and unit costs. c. if management estimates the sales to be 350 pieces, determine the total costs.
LO4
LO4
chaPter 2 | Cost Behavior, Activity Analysis, and Cost Estimation 59

d. how much will the batch costs increase if the government raises the minimum wage to $10 per hour?
e. if management decided to reduce the number of pieces in a batch to 50, determine the cost of preparing 350 pieces. Assume that the batch would take half as long to prepare, and manage-ment wants to replace the oil after 50 pieces are cooked.
P2-28. Optimal Batch SizeThis is a continuation of parts “c” and “e” of P2-27.
Required
should management reduce the batch size to 50? Why or why not?
CAses And prOJeCts
C2-29. Negative Fixed Costs“This is crazy!” exclaimed the production supervisor as he reviewed the work of his new assistant. “You and that computer are telling me that my fixed costs are negative! Tell me, how did you get these negative fixed costs, and what am i supposed to do with them?”
Required
explain to the supervisor the meaning of the negative “fixed costs” and what can be done with them.
C2-30. Significance of High R-SquaredMark Adams had always been suspicious of “newfangled mathematical stuff,” and the most recent suggestion of his new assistant merely confirmed his belief that schools are putting a lot of useless junk in students’ heads. it seems that after an extensive analysis of historical data, the assistant suggested that the number of pounds of scrap was the best basis for predicting manu-facturing overhead. in response to Mr. Adams’s rage, the slightly intimidated assistant indicated that of the 35 equations he tried, pounds of scrap had the highest coefficient of determination with manufacturing overhead.
Required
Comment on Adams’s reaction. is it justified? is it likely that the number of pounds of scrap is a good basis for predicting manufacturing overhead? is it a feasible basis for predicting manufactur-ing overhead?
C2-31. Estimating Machine Repair Costsin an attempt to determine the best basis for predicting machine repair costs, the production su-pervisor accumulated daily information on these costs and production over a one-month period. Applying simple regression analysis to the data, she obtained the following estimating equation:
Y 5 $800 2 $2.60X
where Y 5 total daily machine repair costs X 5 daily production in units
Because of the negative relationship between repair costs and production, she was somewhat skep-tical of the results, even though the r-squared was a respectable 0.765.
Required
a. What is the most likely explanation of the negative variable costs? b. suggest an alternative procedure for estimating machine repair costs that might prove more
useful.
C2-32. Ethical Problem Uncovered by Cost EstimationMesa Management Company owns and provides management services for several shopping centers. After five years with the company, Mike Moyer was recently promoted to the position of manager of Charlestown, an 18-store mall on the outskirts of a downtown area. When he ac-cepted the assignment, Mike was told that he would hold the position for only a couple of years because Charlestown would likely be torn down to make way for a new sports stadium. Mike
LO4
LO3
LO3
LO3
LO3
60 chaPter 2 | Cost Behavior, Activity Analysis, and Cost Estimation

was also told that if he did well in this assignment, he would be in line for heading one of the company’s new 200-store operations that were currently in the planning stage. While reviewing Charlestown’s financial records for the past few years, Mike observed that last year’s oil consumption was up by 8 percent, even though the number of heating degree days was down by 4 percent. somewhat curious, Mike uncovered the following information:
• Charlestown is heated by forced-air oil heat. The furnace is five years old and has been well maintained.
• Fuel oil is kept in four 5,000-gallon underground oil tanks. The oil tanks were installed 25 years ago.
• Replacing the tanks would cost $80,000. If pollution was found, cleanup costs could go as high as $2,000,000, depending on how much oil had leaked into the ground and how far it had spread.
• Replacing the tanks would add more congestion to Charlestown’s parking situation.
Required
What should Mike do? explain.
C2-33. Activity Cost Drivers and Cost EstimationCool Mountain ice Cream Company produces ten varieties of ice cream in large vats, several thousand gallons at a time. The ice cream is distributed to several categories of customers. some ice cream is packaged in large containers and sold to college and university food services. some is packaged in half-gallon or small containers and sold through wholesale distributors to grocery stores. Finally, some is packaged in a variety of individual servings and sold directly to the public from trucks owned and operated by Cool Mountain. Management has always assumed that costs fluctuated with the volume of ice cream, and cost-estimating equations have been based on the following cost function:
Estimated costs 5 Fixed costs 1 Variable costs per gallon 3 Production in gallons lately, however, this equation has not been a very accurate predictor of total costs. At the same time, management has noticed that the volumes and varieties of ice cream sold through the three distinct distribution channels have fluctuated from month to month.
Required
a. What relevant major assumption is inherent in the cost-estimating equation currently used by Cool Mountain?
b. Why might Cool Mountain wish to develop a cost-estimating equation that recognizes the hierarchy of activity costs? explain.
c. Develop the general form of a more accurate cost-estimating equation for Cool Mountain. Clearly label and explain all elements of the equation, and provide specific examples of costs for each element.
C2-34. Multiple Regression Analysis for a Special Decision (Requires Computer Spreadsheet)For billing purposes, south Town health Clinic classifies its services into one of four major proce-dures, X1 through X4. A local business has proposed that south Town provide health services to its employees and their families at the following set rates per procedure:
X1 . . . . . . . . . . . . . . . . . . . . . . . . . . . . . . . . . . . . . . . . . . . . . . . . . . . . . . . . . . . . . . . . . . . . . . . $ 45X2 . . . . . . . . . . . . . . . . . . . . . . . . . . . . . . . . . . . . . . . . . . . . . . . . . . . . . . . . . . . . . . . . . . . . . . . 90X3 . . . . . . . . . . . . . . . . . . . . . . . . . . . . . . . . . . . . . . . . . . . . . . . . . . . . . . . . . . . . . . . . . . . . . . . 60X4 . . . . . . . . . . . . . . . . . . . . . . . . . . . . . . . . . . . . . . . . . . . . . . . . . . . . . . . . . . . . . . . . . . . . . . . 105
Because these rates are significantly below the current rates charged for these services, man-agement has asked for detailed cost information on each procedure. The following information is available for the most recent 12 months.
LO3, 4
LO2, 3
chaPter 2 | Cost Behavior, Activity Analysis, and Cost Estimation 61

Month Total Cost
Number of Procedures
x1 x2 x3 x4
1 . . . . . . . . . . . . . $23,000 30 100 205 75 2 . . . . . . . . . . . . . 25,000 38 120 180 90 3 . . . . . . . . . . . . . 27,000 50 80 140 150 4 . . . . . . . . . . . . . 19,000 20 90 120 100 5 . . . . . . . . . . . . . 20,000 67 50 160 80 6 . . . . . . . . . . . . . 27,000 90 75 210 105 7 . . . . . . . . . . . . . 25,500 20 110 190 110 8 . . . . . . . . . . . . . 21,500 15 120 175 80 9 . . . . . . . . . . . . . 26,000 60 85 125 14010 . . . . . . . . . . . . . 22,000 20 90 100 14011 . . . . . . . . . . . . . 22,800 20 70 150 13012 . . . . . . . . . . . . . 26,500 72 60 200 120
Required
a. use multiple regression analysis to determine the unit cost of each procedure. how much variation in monthly cost is explained by your cost-estimating equation?
b. evaluate the rates proposed by the local business. Assuming south Town has excess capacity and no employees of the local business currently patronize the clinic, what are your recom-mendations regarding the proposal?
c. evaluate the rates proposed by the local business. Assuming south Town is operating at capac-ity and would have to turn current customers away if it agrees to provide health services to the local business, what are your recommendations regarding the proposal?
C2-35. Cost Estimation, Interpretation, and Analysis (Requires Computer Spreadsheet)newport Table Company produces two styles of tables, dining room and kitchen. Presented is monthly information on production volume and manufacturing costs:
Total Manufacturing
CostsTotal Tables Produced
Dining Room Tables
ProducedKitchen Tables
Produced
June 2012 . . . . . . . . . . . $46,650 250 50 200
July. . . . . . . . . . . . . . . . . 50,888 205 105 100
August . . . . . . . . . . . . . . 60,630 285 105 180
September . . . . . . . . . . . 39,743 210 40 170
October . . . . . . . . . . . . . 42,120 175 75 100
November . . . . . . . . . . . 52,575 210 110 100
December . . . . . . . . . . . 53,018 245 90 155
January 2013 . . . . . . . . . 47,325 250 50 200
February. . . . . . . . . . . . . 47,235 220 70 150
March . . . . . . . . . . . . . . . 44,475 180 80 100
April . . . . . . . . . . . . . . . . 97,800 315 180 135
May . . . . . . . . . . . . . . . . 59,933 280 105 175
June . . . . . . . . . . . . . . . . 52,043 255 75 180
July. . . . . . . . . . . . . . . . . 55,380 235 110 125
August . . . . . . . . . . . . . . 46,223 195 85 110
September . . . . . . . . . . . 60,435 260 120 140
October . . . . . . . . . . . . . 53,708 250 90 160
November . . . . . . . . . . . 57,600 270 100 170
December . . . . . . . . . . . 37,650 165 60 105
LO2, 3
62 chaPter 2 | Cost Behavior, Activity Analysis, and Cost Estimation
Required
a. use the high-low method to develop a cost-estimating equation for total manufacturing costs. interpret the meaning of the “fixed” costs and comment on the results.
b. use the chart feature of a spreadsheet to develop a scatter graph of total manufacturing costs and total units produced. use the graph to identify any unusual observations.
c. excluding any unusual observations, use the high-low method to develop a cost-estimating equation for total manufacturing costs. Comment on the results, comparing them with the results in requirement (a).
d. use simple regression analysis to develop a cost-estimating equation for total manufacturing costs. What advantages does simple regression analysis have in comparison with the high-low method of cost estimation? Why must analysts carefully evaluate the data used in simple regression analysis?
e. A customer has offered to purchase 50 dining room tables for $220 per table. Management has asked your advice regarding the desirability of accepting the offer. What advice do you have for management? Additional analysis is required.
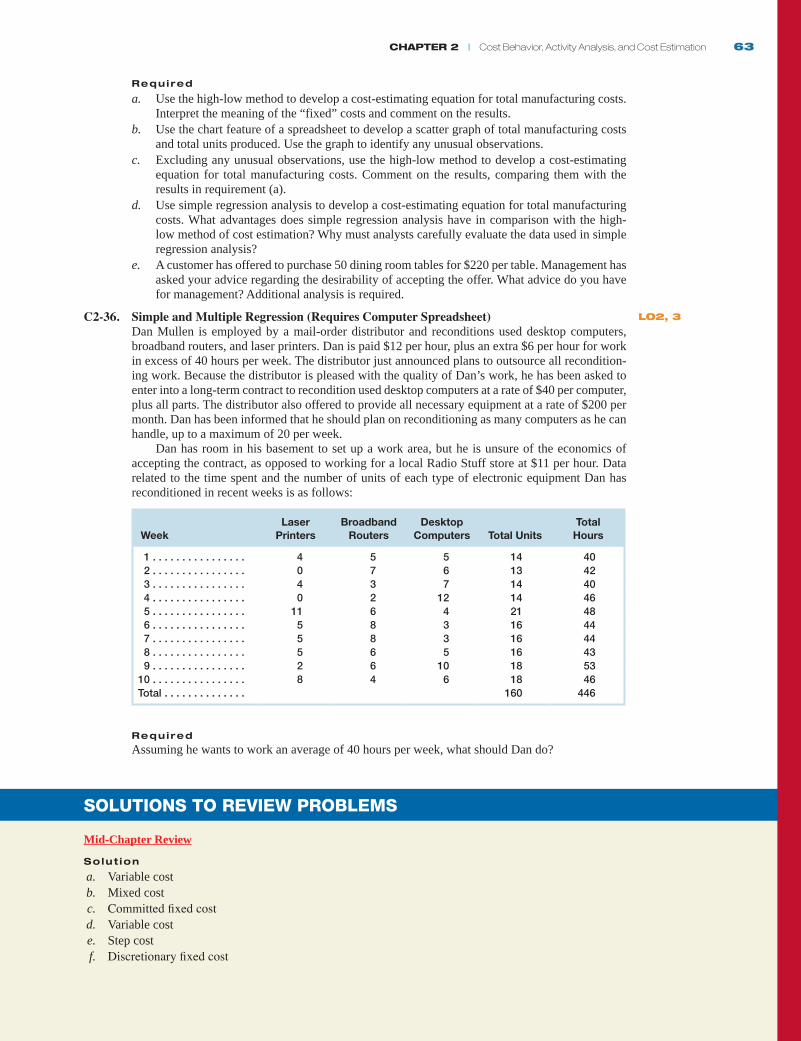
C2-36. Simple and Multiple Regression (Requires Computer Spreadsheet)Dan Mullen is employed by a mail-order distributor and reconditions used desktop computers, broadband routers, and laser printers. Dan is paid $12 per hour, plus an extra $6 per hour for work in excess of 40 hours per week. The distributor just announced plans to outsource all recondition-ing work. Because the distributor is pleased with the quality of Dan’s work, he has been asked to enter into a long-term contract to recondition used desktop computers at a rate of $40 per computer, plus all parts. The distributor also offered to provide all necessary equipment at a rate of $200 per month. Dan has been informed that he should plan on reconditioning as many computers as he can handle, up to a maximum of 20 per week. Dan has room in his basement to set up a work area, but he is unsure of the economics of accepting the contract, as opposed to working for a local radio stuff store at $11 per hour. Data related to the time spent and the number of units of each type of electronic equipment Dan has reconditioned in recent weeks is as follows:
WeekLaser
PrintersBroadband
RoutersDesktop
Computers Total UnitsTotal
Hours
1 . . . . . . . . . . . . . . . . 4 5 5 14 40 2 . . . . . . . . . . . . . . . . 0 7 6 13 42 3 . . . . . . . . . . . . . . . . 4 3 7 14 40 4 . . . . . . . . . . . . . . . . 0 2 12 14 46 5 . . . . . . . . . . . . . . . . 11 6 4 21 48 6 . . . . . . . . . . . . . . . . 5 8 3 16 44 7 . . . . . . . . . . . . . . . . 5 8 3 16 44 8 . . . . . . . . . . . . . . . . 5 6 5 16 43 9 . . . . . . . . . . . . . . . . 2 6 10 18 5310 . . . . . . . . . . . . . . . . 8 4 6 18 46Total . . . . . . . . . . . . . . 160 446
Required
Assuming he wants to work an average of 40 hours per week, what should Dan do?
sOLUtiOns tO revieW prObLeMs
Mid-Chapter Review
Solut ion
a. Variable cost b. Mixed cost c. Committed fixed cost d. Variable cost e. step cost f. Discretionary fixed cost
LO2, 3
chaPter 2 | Cost Behavior, Activity Analysis, and Cost Estimation 63

g. Fixed cost (Without knowing the purpose of renting the car, the cost cannot be classified as committed or discretionary.)
h. Mixed cost i. step cost j. Discretionary fixed cost
Chapter-End Review
Solut ion
a. Fixed costs are easily identified. They are the same at each activity level. Variable and mixed costs are determined by dividing the total costs for an item at two activity levels by the corresponding units of activity. The quotients of the variable cost items will be identical at both activity levels. The quotients of the mixed costs will differ, being lower at the higher activity level because the fixed costs are being spread over a larger number of units.
Cost Behavior
Cost of food sold. . . . . . . . . . . . . . . . . . . . . . . . . . . . . . . . . . . . . . . . . . . . . . . . . . . . . . . . . . . VariableWages and salaries . . . . . . . . . . . . . . . . . . . . . . . . . . . . . . . . . . . . . . . . . . . . . . . . . . . . . . . . . MixedRent on building . . . . . . . . . . . . . . . . . . . . . . . . . . . . . . . . . . . . . . . . . . . . . . . . . . . . . . . . . . . FixedDepreciation on equipment. . . . . . . . . . . . . . . . . . . . . . . . . . . . . . . . . . . . . . . . . . . . . . . . . . . FixedUtilities . . . . . . . . . . . . . . . . . . . . . . . . . . . . . . . . . . . . . . . . . . . . . . . . . . . . . . . . . . . . . . . . . . . MixedSupplies . . . . . . . . . . . . . . . . . . . . . . . . . . . . . . . . . . . . . . . . . . . . . . . . . . . . . . . . . . . . . . . . . . MixedMiscellaneous . . . . . . . . . . . . . . . . . . . . . . . . . . . . . . . . . . . . . . . . . . . . . . . . . . . . . . . . . . . . . Mixed
b. The cost of food sold was classified as a variable cost. hence, the cost of food may be determined by dividing the total costs at either observation by the corresponding number of units.
b 5$1,575 total variable costs
2,100 units5 $0.75X
Wages and salaries were previously classified as a mixed cost. hence, the cost of wages and salaries is determined using the high-low method.
(variable cost) b 5$1,675 2 $1,5252,700 2 2,100
5 0.25X(fixed cost) a 5 $1,525 total cost 2 ($0.25 3 2,100) variable cost
5 $1,000
rent on building was classified as a fixed cost.
a 5 $1,500
Total monthly costs most likely follow a mixed cost behavior pattern. hence, they can be determined using the high-low method.
b 5$6,556 2 $5,8482,700 2 2,100
5 $1.18Xa 5 $5,848 2 ($1.18 3 2,100)
5 $3,370Total costs 5 $3,370 1 $1.18X
where
X 5 unit sales
64 chaPter 2 | Cost Behavior, Activity Analysis, and Cost Estimation

c. and d.
Volume Total Costs Average Cost per Unit
1,000. . . . . . . . . . . . . . . . . . . . . . . . . . . . . $3,370 1 ($1.18 3 1,000) 5 $4,550 $4,550/1,000 5 $4.5502,000. . . . . . . . . . . . . . . . . . . . . . . . . . . . . $3,370 1 ($1.18 3 2,000) 5 $5,730 $5,730/2,000 5 $2.865
The average costs differ at 1,000 and 2,000 units because the fixed costs are being spread over a differ-ent number of units. The larger the number of units, the smaller the average fixed cost per unit.
chaPter 2 | Cost Behavior, Activity Analysis, and Cost Estimation 65

Hartgraves and Morse Ch. 3


In-class problems from
Dyckman, et al. 5th Edition