geophysically estimated porosity of selected …
TRANSCRIPT
GEOPHYSICALLY ESTIMATED POROSITY OF SELECTED
PALEOZOIC ROCKS IN THE UPPER COLORADO RIVER BASIN,
COLORADO, UTAH, WYOMING, AND ARIZONA
by Gregory A. Wetherbee and William P. Van Liew
US. GEOLOGICAL SURVEY
Water-Resources Investigations Report 904049
Denver, Colorado 1991

U.S. DEPARTMENT OF THE INTERIOR
MANUEL LUJAN, JR., Secretary
U.S. GEOLOGICAL SURVEYDallas L. Peck, Director
For additional information Copies of this report canwrite to: be purchased from:
District Chief U.S. Geological SurveyU.S. Geological Survey Books and Open-File Reports SectionBox 25046, Mail Stop 415 Box 25425, Mail Stop 517Federal Center Federal CenterDenver, CO 80225-0046 Denver, CO 80225-0425

CONTENTS
PageAbstract----- - - --- -- - - - - -- -- - - 1Introduction ----- - - - __ ___________ ___ ___ i
Purpose and scope ----------- --- -- - ________ _________ 2Geologic setting - -- - ----- ________ ___ __ ______ 4
Methods of estimating porosity from analysis of geophysical logs ----- 6Results of geophysically estimated porosity analysis- ---- - 15Summary----- - -------- -- _________ __ -_ _ __________________ 26Selected references-- -- - _____ ___________ _____ _ 29
PLATES [In pocket]
Plate 1. Diagram showing Paleozoic stratigraphic columns and hydrogeologic units for the Upper Colorado River Basin--excluding the San Juan Basin Colorado, Utah, Wyoming, and Arizona.
2. Geophysically estimated porosity for selected formationsin aquifers in the upper Paleozoic rocks and map showing borehole locations in the Upper Colorado River Basin, Colorado, Utah, Wyoming, and Arizona.
3. Geophysically estimated porosity for selected formations in aquifers in the middle, lower, and basal Paleozoic rocks and map showing borehole locations in the Upper Colorado River Basin, Colorado, Utah, Wyoming, and Arizona.
FIGURES
Page Figure 1. Map showing location of the study area and areal extent of
Paleozoic rocks in the Upper Colorado River Basin ____--___ 32. Map showing principal tectonic features of the Upper
Colorado River Basin-- - -- -- -- ______ ______ 53-6. Graphs showing:
3. Natural-gamma log and porosity estimated from sonic, neutron, and bulk-density logs showing response to shale lenses - -- -- -- - - - - 9
4. Relation of depth below land surface to porosity from geophysical logs, showing response to presence of natural gas ____ __ __ _________ __ _ IQ
5. Caliper log and porosity from sonic, neutron, andbulk-density logs showing response to a fracture - -- 11
6. Variation of porosity with depth from the sonic logand from laboratory analysis of core samples- ---- -- 13
7. Map showing locations of boreholes used for comparison of geophysical-porosity and laboratory core-porosity values --- ----____-_ _____ - ______ __ ___ 16
111

PageFigures 8-14. Graphs showing comparison of porosity values estimated by
geophysical methods and by laboratory core analysis for:8. The White Rim Sandstone Member of the Cutler
Formation in borehole 67 179. The Weber Sandstone in borehole 44 18
10. The Tensleep Sandstone in borehole 17 1911. The Tensleep Sandstone in borehole 21 2012. The Tensleep Sandstone in borehole 20 2113. The Tensleep Sandstone in borehole 5 2214. The Leadville Limestone in borehole 76- 23
15. Map showing grand mean geophysically estimated porosityof aquifers in upper Paleozoic rocks 24
16. Map showing grand mean geophysically estimated porosity of aquifers in the middle, lower, and basal Paleozoic rocks - 25
17. Histogram showing distribution of grand meangeophysically estimated porosity of aquifers in theupper Paleozoic rocks 27
18. Histogram showing distribution of grand meangeophysically estimated porosity of aquifers in themiddle Paleozoic rocks 28
TABLES
Page Table 1. Summary of matrix parameters used for porosity estimation 12
2. Matrix parameters used for porosity estimation for individualformations 14
3. Ranges of grand mean geophysically estimated porosity values 26
CONVERSION FACTORS
Multiply By To obtain
foot (ft) 0.3048 metergallon per minute (gal/min) 0.00353 cubic meter per secondsquare mile (mi 2 ) 2.590 square kilometerinch (in.) 2.54 centimetermicrosecond per foot (ps/ft) 3,281,000 seconds per meteratmosphere (atm) 76.0 centimeter of mercury
gram per cubic centimeter 62.43 pound per cubic foot (g/cm3 )
Temperature in degree Celsius (°C) may be converted to degree Fahrenheit (°F) by using the following equation:
°F=9/5 (°C)+32.
The following term and abbreviation also is used in this report:
American Petroleum Institute units (API units)
IV

GEOPHYSICALLY ESTIMATED POROSITY OF SELECTED PALEOZOIC ROCKSIN THE UPPER COLORADO RIVER BASIN, COLORADO,
UTAH, WYOMING, AND ARIZONA
By Gregory A. Wetherbee and William P. Van Liew
ABSTRACT
As part of the Regional Aquifer Systems Analysis of the Upper Colorado River Basin, the porosity in selected Paleozoic rocks was estimated from borehole geophysical logs of oil-and-gas exploratory boreholes. Assumptions were made concerning the geophysical properties of selected sandstone, lime stone, and dolomite rocks in order to calculate porosity from sonic, neutron, and bulk-density logs. Departures from conditions requisite for porosity estimations from each type of log were identified; the most common departure was the presence of shale in the formation rock. Intervals containing shale lenses, natural gas, and fractures were discarded from the analysis; however, no accounting was made for interstitial shale.
Geophysically estimated porosity values were compared with laboratory- porosity values of core samples from 19 formation intervals in 17 boreholes, and a general correspondence was established. Porosity then was calculated from the sonic, neutron, and bulk-density logs from 99 formation intervals in- 63 boreholes in which all 3 geophysical logs had been run, but in which no laboratory core analysis had been done.
The grand mean geophysically estimated porosity of the sandstones that comprise the aquifers in upper Paleozoic rocks ranges from 1.0 to 16.2 percent. The grand mean geophysically estimated porosity of the carbonate rocks that comprise aquifers in the middle Paleozoic rocks ranges from 0.4 to 10.5 percent. Values of porosity estimated by this method of analysis for shaley formations are more indicative of total porosity than of effective porosity.
INTRODUCTION
During 1975, the U.S. Geological Survey began the Regional Aquifer Systems Analysis (RASA) program to provide quantitative assessments of regional aquifer systems. A regional aquifer was defined by Bennett (1979, p. 36-42):
A regional aquifer system * * * may be of two general types: it may comprise an extensive set of aquifers and aquitards (confining beds) which are hydraulically connected, or it may represent a set of essentially independent aquifers which share so many common characteristics that they can be studied efficiently in a single exercise.

In anticipation of increasing ground-water use in the Upper Colorado River Basin, the U.S. Geological Survey began a regional aquifer systems analysis (UCRASA) of this area in 1981 (Taylor and others, 1983). Objectives of the UCRASA were to:
1. Identify aquifers and confining layers within the region;2. Determine the geologic, hydrologic, and hydraulic characteristics of
aquifers;3. Determine the geochemical characteristics of ground water in these
aquifers;4. Analyze the regional flow system; and5. Estimate the water-supply capability of the major aquifers.
In order to estimate the hydraulic characteristics of aquifers for use in flow-system analysis and subsequent development of simulation models that could be used to estimate the hydrologic effects of potential ground-water development, borehole geophysical logs were analyzed to estimate porosity in selected Paleozoic aquifers. This report is an expanded version of a paper published in American Water Resources Association monograph number 14; titled "Geophysically Determined Porosity of Paleozoic rocks in the Upper Colorado River Basin" (Wetherbee and Van Liew, 1988).
Purpose and Scope
This report presents the results of borehole geophysical-log analysis for the UCRASA, which includes parts of Colorado, Utah, Wyoming, and Arizona. Porosity values in this report will be used to estimate hydraulic properties of aquifers in the study area. The study area is the Upper Colorado River Basin above Lees Ferry, Ariz. The basin is in western Colorado, eastern Utah, southwestern Wyoming, northeastern Arizona, and northwestern New Mexico. The basin has an area of about 113,500 mi 2 , but approximately 14,600 mi 2 of the upper part of the San Juan basin in southwestern Colorado and northwestern New Mexico has been excluded from this study and is part of a separate RASA program (fig. 1).
Regional aquifers comprised of sandstone, limestone, dolomite, and conglomerate of Paleozoic age were selected for porosity analysis. Known confining or semiconfining rocks, such as shale and evaporite deposits, were not analyzed. Data for this report were obtained from the Petrowell Libraries of the Petroleum Information Corporation 1 and included borehole geophysical logs of oil-and-gas exploratory boreholes, formation records, and laboratory analyses of borehole core samples. Data from 99 formation intervals in 63 boreholes were available for analysis in the Upper Colorado River Basin.
^se of company or brand names in this report is for identification pur poses only and does not constitute endorsement by the U.S. Geological Survey,

110
43
BOUNDARY OF STUDY AREA
BOUNDARY OF STUDY AREA
EXPLANATION
AREA WHERE PALEOZOIC ROCKS ARE ABSENT
25 50 75 100 MILESt _____
0 25 50 75 100 KILOMETERS
Figure 1. Location of the study area and areal extent of Paleozoic rocks in the Upper Colorado River Basin [modified from King and Beikman (1974) and Rocky Mountain Association of Geologists (1972)].
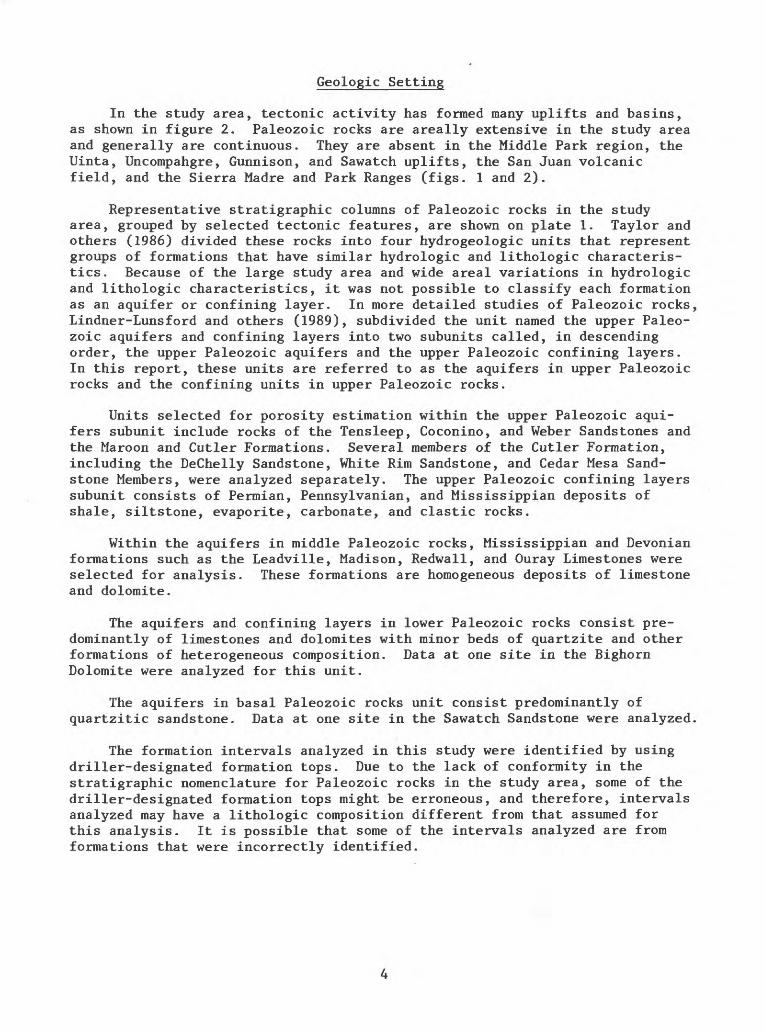
Geologic Setting
In the study area, tectonic activity has formed many uplifts and basins, as shown in figure 2. Paleozoic rocks are areally extensive in the study area and generally are continuous. They are absent in the Middle Park region, the Uinta, Uncompahgre, Gunnison, and Sawatch uplifts, the San Juan volcanic field, and the Sierra Madre and Park Ranges (figs. 1 and 2).
Representative stratigraphic columns of Paleozoic rocks in the study area, grouped by selected tectonic features, are shown on plate 1. Taylor and others (1986) divided these rocks into four hydrogeologic units that represent groups of formations that have similar hydrologic and lithologic characteris tics. Because of the large study area and wide areal variations in hydrologic and lithologic characteristics, it was not possible to classify each formation as an aquifer or confining layer. In more detailed studies of Paleozoic rocks, Lindner-Lunsford and others (1989), subdivided the unit named the upper Paleo zoic aquifers and confining layers into two subunits called, in descending order, the upper Paleozoic aquifers and the upper Paleozoic confining layers. In this report, these units are referred to as the aquifers in upper Paleozoic rocks and the confining units in upper Paleozoic rocks.
Units selected for porosity estimation within the upper Paleozoic aqui fers subunit include rocks of the Tensleep, Coconino, and Weber Sandstones and the Maroon and Cutler Formations. Several members of the Cutler Formation, including the DeChelly Sandstone, White Rim Sandstone, and Cedar Mesa Sand stone Members, were analyzed separately. The upper Paleozoic confining layers subunit consists of Permian, Pennsylvanian, and Mississippian deposits of shale, siltstone, evaporite, carbonate, and clastic rocks.
Within the aquifers in middle Paleozoic rocks, Mississippian and Devonian formations such as the Leadville, Madison, Redwall, and Ouray Limestones were selected for analysis. These formations are homogeneous deposits of limestone and dolomite.
The aquifers and confining layers in lower Paleozoic rocks consist pre dominantly of limestones and dolomites with minor beds of quartzite and other formations of heterogeneous composition. Data at one site in the Bighorn Dolomite were analyzed for this unit.
The aquifers in basal Paleozoic rocks unit consist predominantly of quartzitic sandstone. Data at one site in the Sawatch Sandstone were analyzed.
The formation intervals analyzed in this study were identified by using driller-designated formation tops. Due to the lack of conformity in the stratigraphic nomenclature for Paleozoic rocks in the study area, some of the driller-designated formation tops might be erroneous, and therefore, intervals analyzed may have a lithologic composition different from that assumed for this analysis. It is possible that some of the intervals analyzed are from formations that were incorrectly identified.

110°
43
OVERTHRUST BELT
42
BOUNDARY OF STUDY AREA
ECHO CLIFFS UPLIFT
SAN JUANUPLIFT
BOUNDARY OF STUDY AREA
GUNNISON UPLIFT
SAN JUAN VOLCANIC FIELD
UPLIFT
0 25 50 75 100 KILOMETERS
Figure 2, --Principal tectonic features of the Upper Colorado River Basin [modified from Taylor and others (1986)].

METHODS OF ESTIMATING POROSITY FROM ANALYSIS OF GEOPHYSICAL LOGS
Quantitative estimates of porosity can be obtained from the analysis of each of three types of geophysical logs. Porosity can be estimated from the sonic log by using theoretical equations, from the neutron log by using an empirical approach, and from the bulk-density log by a method that uses ele ments of the empirical approach and the theoretical equations. Bredehoeft (1964) developed an empirical relation of porosity to permeability for the Tensleep Sandstone within the Bighorn Basin, Wyo., using porosity values estimated from sonic and neutron geophysical logs. Each type of logging tool measures a physical property that can be related to formation porosity; porosity is not measured directly by any of the three types of logging tools. Thus, different assumptions are inherent in each method used to estimate porosity from each of the three types of logs.
The sonic log records the transit time of an acoustic pulse traveling from a sonic generator in the logging tool, through the formation, and back to a receiver in the tool. In clean, consolidated formations that have uniformly distributed intergranular pores, transit time is a linear function of porosity, according to the time-average equation (Keys and MacCary, 1971; Schlumberger Limited, 1972):
At, -At . . = log matrix x (1)
"sonic At,., . , -At . . fluid matrix
where 0 . = porosity, in percent, as estimated from the sonic log; sonic * J y * ' 6JAt, = transit time of the formation that is recorded on the sonic
1°8 ilog;At . . = transit time of the pure rock matrix; and matrix r 'At_, . , = transit time of the interstitial fluid,
fluid
Although the time-average equation is valid for any consistent system of units, transit times usually are expressed in units of microseconds per foot.
The time-average equation basically states that At, is the sum of the
time the sonic wave takes to travel through the solid part of the formation(At . . ) and the time the sonic wave takes to travel through the inter-
matrix 6stitial fluid (At,., . ,). To estimate porosity from the sonic log, one must
assume a value for At . . and At-., .,, l then read the value for At, frommatrix fluid 7 log
the sonic log. For this report, At,., . , is assumed to be 189 (Js/ft, a com
monly assumed value for ground water, and At . . was estimated for each 3 6 J matrixformation based on lithologic information.
In neutron logging, high-energy neutrons are continuously emitted from a radioactive source in the logging tool. These neutrons collide with the nuclei of the formation rock and the interstitial fluid. With each collision, a neutron loses some of its energy. The amount of energy lost is inversely

proportional to the mass of the nucleus with which the neutron collides. The nuclei of formation rock have a much greater mass than neutrons, and thus neutrons lose little energy in collisions with these nuclei. Conversely, the mass of hydrogen atoms, which are present in interstitial water, are almost equal to the mass of neutrons, and thus neutrons lose much more energy in collisions with these nuclei. Within a few microseconds, the neutrons that have collided with hydrogen atoms have been slowed enough by successive col lisions that they diffuse randomly until they are captured by the nuclei of atoms such as chlorine, hydrogen, and silicon. The capturing nucleus then emits a high-energy gamma ray of capture (Schlumberger Limited, 1972).
A detector in the neutron-logging tool records the count rate of either the gamma rays of capture or the neutrons themselves that are scattered back to the tool, depending on the type of neutron-logging tool. Thus, (1) The count rate of the gamma rays of capture measured by the one type of tool is assumed to be directly proportional to the hydrogen content of the formation interval being examined, or the count rate of neutrons measured by the other type of tool is assumed to be inversely proportional to the hydrogen content of the formation interval being examined; and (2) the formation porosity is assumed to be directly proportional to the hydrogen content of the formation interval. Neutron-logging tools are calibrated in limestone pits of known porosity, and "limestone porosity" is recorded directly on the neutron log. If a neutron log that was calibrated for limestone was used for a sandstone formation, an empirical correction was applied (Herst and Nelson, 1985, fig. 10-4C, p. 397) where:
Neutron-log sandstone porosity(2)
= neutron-log limestone porosity + 3 percent
The bulk-density log records the intensity of gamma radiation that orig inates from a radioactive source in the logging tool and is attenuated and scattered back to a detector in the logging tool by the formation. The gamma rays emitted from the logging tool collide with electrons in the formation. At each collision, a gamma ray loses some of its energy to the electron. The number of collisions is related directly to the number of electrons in the formation. Therefore, the intensity of gamma radiation measured by the log ging tool is a measure of the electron density of the formation, which is assumed to be proportional to the bulk density of the formation. Bulk-density- logging tools are calibrated in much the same way as neutron-logging tools. Once the electron density of the formation is calibrated to the bulk density of the formation, the following equation can be used to estimate porosity from the bulk-density log:
' Pbulk, density
where 0, . = porosity, in percent, as estimated from the bulk-density enS1 y log;
p ,_ . = the density of the pure rock matrix; matrix J * 'p. ... = the density of the formation that is recorded on the bulk- Kbulk j -^ i j density log; and
p_, . , = the density of the interstitial fluid.
Equation (3) is valid for any consistent system of units; however, densities usually are expressed in grams per cubic centimeter.
To estimate porosity from the bulk-density log, one must assume a valuefor p . . and p,.., . ,, then read the value for p, ,. from the bulk-density ^matrix rfluid' Kbulk 3log. For this report, pf1 . , is assumed to be 1.00 g/cm3 , the density of
water at 25 °C and 1 atm pressure. Although these exact conditions rarely exist in formation water, this parameter value gives reasonably accurateresults. The parameter p ,_ . was estimated for each formation based on-I-4-u -I £ 4.- 'matrix lithologic information.
For this study, the porosity analysis was not done unless all three types of logs were available, because: (1) Minimal lithologic information was avail able for individual boreholes that were examined, and (2) different assump tions are inherent in the method of analysis for each type of log. Relations of porosity estimations to depth were compared for each of the three methods. Departures from conditions requisite for porosity estimation by each method were identified by the characteristic response of each log to the departure from ideal conditions.
The most common departure from ideal conditions was the presence of shale in the formation rock, which is a common occurrence in the clastic sedimentary deposits of the Upper Colorado River Basin. The neutron log, which indirectly measures the hydrogen content in the formation, is affected the most, because shales commonly contain much adhered water. The sonic and bulk-density logs, which require an assumption of transit time and density of the rock matrix in order to estimate porosity, also are affected by the presence of shale. In such instances, the natural-gamma log is useful in providing supplemental information. The natural-gamma log records naturally occurring gamma radia tion emitted by the formation near the borehole. In sedimentary formations, the natural-gamma log commonly indicates the shale content of the formation, because sandstone, limestone, and dolomite usually have small concentrations of radioactive isotopes, whereas shale usually contains much larger concen trations of radioactive isotopes, mostly the radioactive potassium-40 isotope (Keys and MacCary, 1971).
Logs from borehole 44, which penetrates the Weber Sandstone of Pennsyl- vanian age, illustrate the usefulness of the natural-gamma log as an aid in determining lithology (fig. 3). At depths of about 3,330, 3,355, and 3,380 ft, the neutron log and the natural-gamma log each have a deflection or "spike" toward the right, indicating that shale was penetrated. When the neutron log and the natural-gamma log had positive deflections at the same depth, the porosity value obtained from the neutron log was considered invalid and was not used in this porosity analysis; however, no accounting was made for inter stitial shale. For this reason, porosity values obtained from the neutron log in shaley formations are more indicative of the total porosity, including the percent pore volume that contains adhered water, rather than the effective porosity, which is the porosity value that most often is used to estimate hydraulic properties of aquifers.

3,300NATURAL-GAMMA LOG GEOPHYSICAL-POROSITY LOGS
3,325 -
LLJ O <U- DCD C/3Q 3,350 -
LUQ 3,375 -
3,400
BULK-DENSITY LOG
SONIC LOG
NEUTRON LOG
'//////////, SHALE
45 75 105 135 165 0
AMERICAN PETROLEUM INSTITUTE UNITS
10 15 20 25
POROSITY, IN PERCENT
Figure 3.--Natural-gamma log and porosity estimated from sonic, neutron, and bulk-density logs showing response to shale lenses [modified from Wetherbee and Van Liew, 1988, p. 166].
Formation intervals in which natural gas was present were identified by the characteristic response of the neutron and bulk-density logs. The density of gases is small compared to that of liquids and solids, and the bulk-density- log analysis, which assumes only liquid water and solid rock matrix, erro neously interprets the small density of gas as due to water-filled porosity. Therefore, the porosity value estimated from the bulk-density log in the pres ence of natural gas will be larger than the actual porosity. Conversely, the porosity value estimated from the neutron log in the presence of natural gas will be smaller than the actual porosity, because the hydrogen density of gas is less than that of water. The opposite response of these two logs is known as the "football effect" (Brock, 1986, p. 93) and is used to indicate the pres ence of natural gas (fig. 4). Porosity values for formation intervals that displayed the football effect were considered invalid and were not recorded.

6,025
LU LU
LU O
1LU CD
t
6,125
6,225
6,325
6,425
BULK-DENSITY LOG
SONIC LOG
'//////////, roOTBALLEFFECT
10 15 20 25 30 35
POROSITY, IN PERCENT
40 45 50
Figure 4.--Relation of depth below land surface to porosity from geophysical logs, showing response to presence of natural gas [modified from Wetherbee and Van Liew, 1988, p. 166].
Fractures were identified by the characteristic response of the three porosity logs and the caliper log. The porosity from the bulk-density log deflects in a positive direction in response to a fracture because of the relatively large volume of water in the fracture compared to porosity from interstitial water content elsewhere on the log. The neutron log also deflects in a positive direction due to the large volume of water. The sonic log, however, responds differently to the fracture. The sonic-logging tool records the first acoustic pulse to travel through the formation to a receiver in the tool. Since the acoustic pulse travels faster through the solid for mation than through the water-filled fracture, the first pulse to arrive at the receiver will have traveled through the solid .formation around the frac ture rather than through the fracture. Therefore, the recorded transit time does not indicate the presence of the fracture (Brock, 1986). The caliper
10
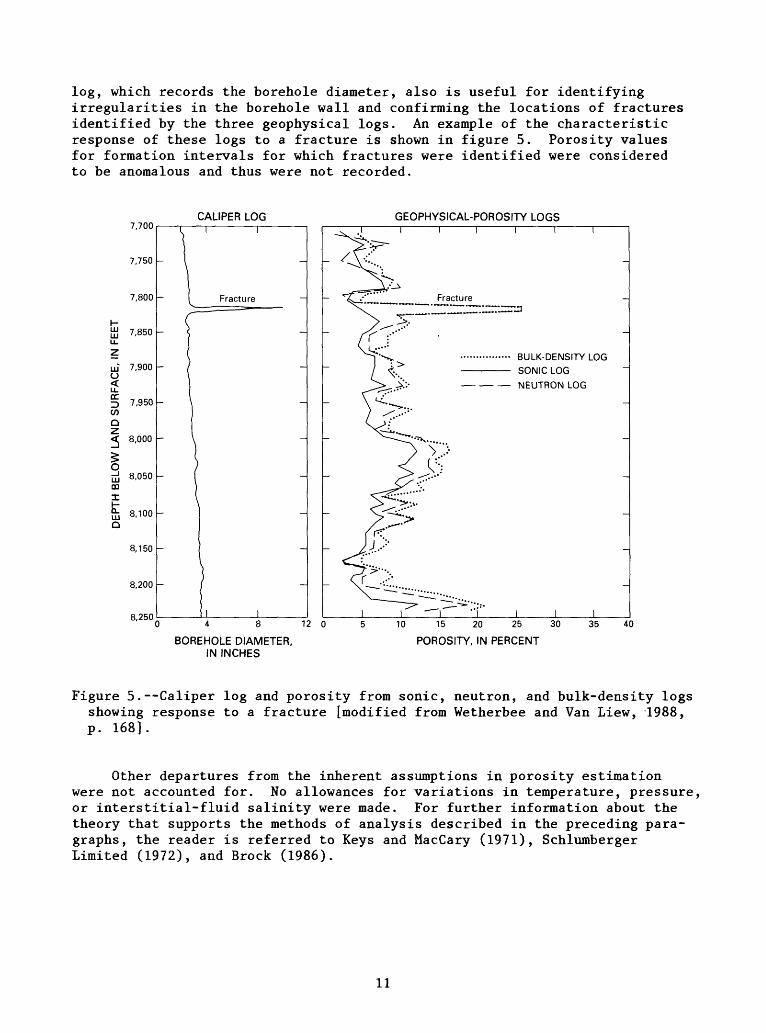
log, which records the borehole diameter, also is useful for identifying irregularities in the borehole wall and confirming the locations of fractures identified by the three geophysical logs. An example of the characteristic response of these logs to a fracture is shown in figure 5. Porosity values for formation intervals for which fractures were identified were considered to be anomalous and thus were not recorded.
7,700
7,750
7,800
7,850
w 7,900 O
CALIPER LOG GEOPHYSICAL-POROSITY LOGS
7,950CO Q Z < 8,000
quJ 8,050 00I
gj 8,100 Q
8,200
8,250
BULK-DENSITY LOG
SONIC LOG
NEUTRON LOG
12 0
BOREHOLE DIAMETER, IN INCHES
10 15 20 25
POROSITY, IN PERCENT
30 35 40
Figure 5.--Caliper log and porosity from sonic, neutron, and bulk-density logs showing response to a fracture [modified from Wetherbee and Van Liew, 1988, p. 168].
Other departures from the inherent assumptions in porosity estimation were not accounted for. No allowances for variations in temperature, pressure, or interstitial-fluid salinity were made. For further information about the theory that supports the methods of analysis described in the preceding para graphs, the reader is referred to Keys and MacCary (1971), Schlumberger Limited (1972), and Brock (1986).
11

In the absence of detailed lithologic information, matrix parameters for the geophysical-porosity analysis were selected based on: (1) General litho logic type, (2) the value that made all three geophysical-log-porosity values converge, and (3) the value that resulted in agreement between the geophysi- cally estimated porosity and the porosity from core analysis. The matrix parameters used for sonic-log and bulk-density-log analysis are listed in table 1. In order to determine matrix parameters that resulted in agreement between geophysically estimated porosity and porosity from core analysis, data from borehole geophysical logs of oil-and-gas exploratory boreholes and from laboratory analysis of borehole core samples taken at 1-ft intervals were obtained from the Petrowell Libraries of the Petroleum Information Corporation for 19 formation intervals in 17 boreholes that penetrate aquifers of Paleo zoic age. For each formation interval, average values of At, and p, _, were
obtained from the sonic and bulk-density logs at 1-ft intervals, matrix param eters were assumed, and porosity values were calculated for each log at 1-ft intervals and plotted with depth*below land surface. Empirical corrections for lithology were applied to porosity values estimated from the neutron log where needed (eq. 2), and neutron-log porosity also was plotted with depth below land surface. The laboratory core-porosity values then were compared with these geophysical-porosity values. Depth corrections were made in some instances, by comparing qualitative changes in the relations of porosity to depth.
Table 1. Summary of matrix parameters used for porosity estimation
_ , Sonic-log matrix Bulk-density log matrix. . transit time, At . . density, p . matrix matrix "matrix
(microseconds per foot) (grams per cubic centimeter)
Sandstone 53.3 or 51.3 2.68 Limestone andDolomite 43.5 or 47.5 2.71 or 2.87
An example of the comparison of geophysically estimated porosity and laboratory core porosity using different values for At . is shown in
figure 6. For this example, At . . was chosen to be 51.3 ps/ft, because e ^ * matrix r
porosity estimated with this parameter better approximates the laboratorycore porosity than the At . . value of 55.6 ps/ft. Ultimately, this anal-
e J matrixysis led to assignment of specific At . . and p . . values for individual J &r matrix "matrixformations. These matrix parameter assignments are listed in table 2.
12

3,200
O < u_DCD (O O
gULJm
3,205
3,210
3,215
3,220
POROSITY ESTIMATED FROM LABORATORY ANALYSIS OF CORE SAMPLES
POROSITY ESTIMATED FROM THE SONIC LOG, ASSUMING A TRANSIT TIME FOR THE MATRIX OF 55.6 MICROSECONDS PER FOOT
POROSITY FROM THE SONIC LOG, ASSUMING A TRANSIT TIME FOR THE MATRIX OF 51.3 MICROSECONDS PER FOOT
0 10 15 20 25 30 35
POROSITYJN PERCENT
40 45 50
Figure 6.--Variation of porosity with depth from the sonic log and fromlaboratory analysis of core samples [modified from Wetherbee and Van Liew, 1988, p. 164].
Once the matrix parameters for each formation were selected and it was determined that there was a general correspondence between the variability of geophysically estimated porosity and the variability of laboratory core poros ity, porosity was estimated for boreholes in which all three geophysical logs, but for which no laboratory analyses of cores were available. Data from 99 formation intervals in 63 boreholes were available for analysis. For this phase of the analysis, representative values of At, and p, _, were selected
by eye from the sonic and bulk-density logs at 10-ft intervals, matrix param eters established in the comparison of geophysically estimated porosity with laboratory core analysis were used, and an estimated porosity value for each log was calculated for each 10-ft interval and plotted with depth below land surface.
13
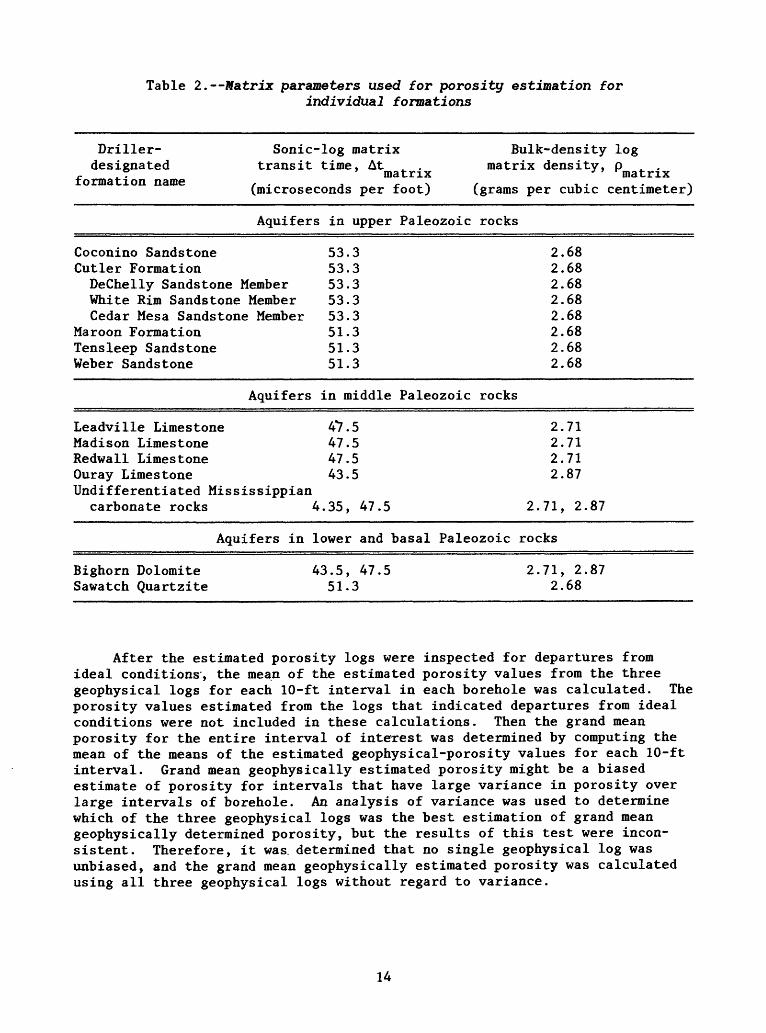
Table 2.--Matrix parameters used for porosity estimation forindividual formations
Driller- Sonic-log matrix Bulk-density logdesignated transit time, At . . matrix density, p . .,. .? matrix *' 'matrixformation name ,. , £ ^\ / ^ *. * \(microseconds per foot) (grams per cubic centimeter)
Aquifers in upper Paleozoic rocks
Coconino SandstoneCutler FormationDeChelly Sandstone Member White Rim Sandstone MemberCedar Mesa Sandstone Member
Maroon FormationTensleep Sandstone Weber Sandstone
53.353.353.3 53.353.351.351.3 51.3
2.682.682.68 2.682.682.682.68 2.68
Aquifers in middle Paleozoic rocks
Leadville Limestone 4*7.5Madison Limestone 47.5Redwall Limestone 47.5Our ay Limestone 43.5Undifferentiated Mississippian
carbonate rocks 4.35, 47.5
2.712.712.712.87
2.71, 2.87
Aquifers in lower and basal Paleozoic rocks
Bighorn Dolomite 43.5, 47.5 2.71, 2.87 Sawatch Quartzite 51.3 2.68
After the estimated porosity logs were inspected for departures from ideal conditions, the mean of the estimated porosity values from the three geophysical logs for each 10-ft interval in each borehole was calculated. The porosity values estimated from the logs that indicated departures from ideal conditions were not included in these calculations. Then the grand mean porosity for the entire interval of interest was determined by computing the mean of the means of the estimated geophysical-porosity values for each 10-ft interval. Grand mean geophysically estimated porosity might be a biased estimate of porosity for intervals that have large variance in porosity over large intervals of borehole. An analysis of variance was used to determine which of the three geophysical logs was the best estimation of grand mean geophysically determined porosity, but the results of this test were incon sistent. Therefore, it was. determined that no single geophysical log was unbiased, and the grand mean geophysically estimated porosity was calculated using all three geophysical logs without regard to variance.
14

RESULTS OF GEOPHYSICALLY ESTIMATED POROSITY ANALYSIS
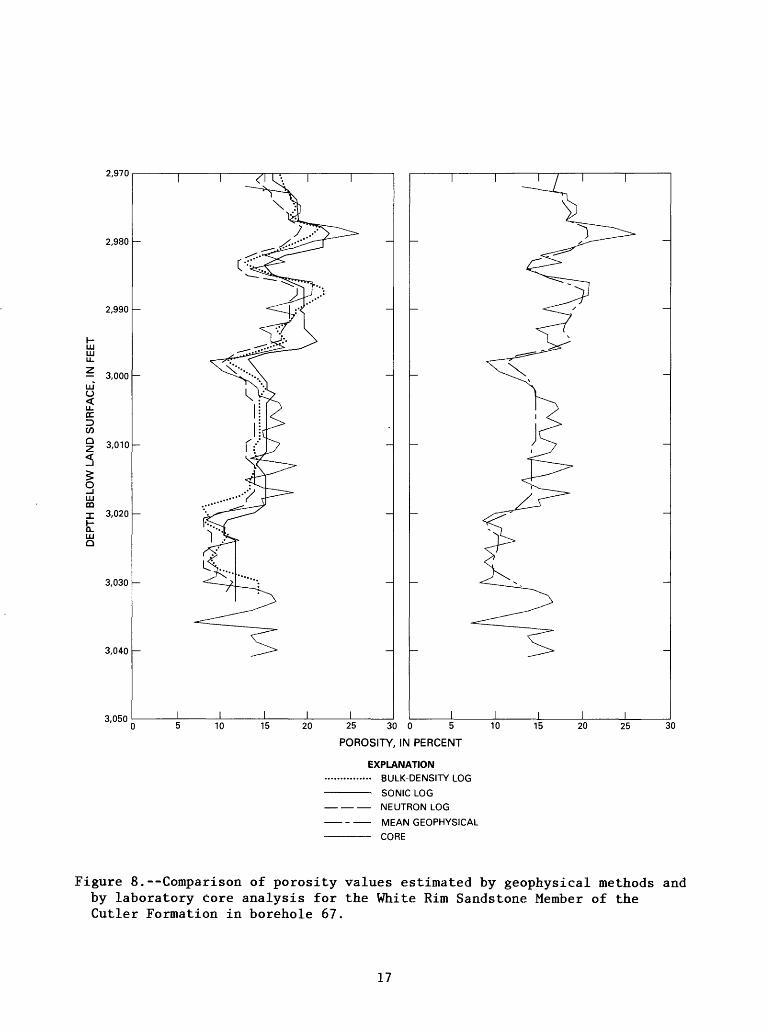
Eighty boreholes were selected for estimation of porosity by geophysical methods. These boreholes were assigned serial numbers for identification purposes. The locations of the 17 boreholes for which porosity estimated by geophysical methods was compared to laboratory determinations of porosity from core samples are shown in figure 7. Mean porosity values estimated from geophysical logs did not compare exactly with porosity values determined from laboratory analyses of core samples, but a general correspondence was evident. Differences in some intervals can be attributed to limitations of logging devices and methods. Geophysical logs measure a physical property of the formation and borehole fluid within the radius of investigation of the logging device as it moves up the borehole. The radius of investigation of the sonic, neutron, and bulk-density logs varies from about 0.5 to about 3.5 ft (Keys and MacCary, 1971). Furthermore, the response of the neutron and bulk-density logs is statistical in nature. The detectors in these logging tools count neutrons or gamma rays that are scattered back to the tool from the formation. The counts are averaged over a selected interval of time, known as the time constant. Therefore, the response on the logs from which porosity is calcu lated is dependent on the time constant and the rate at which the tool moves up the borehole, which is known as the logging speed. Laboratory core analy ses were done on samples of core that were, at most, only a few inches long and taken at 1-ft intervals. Because of the smaller sample volume, porosity determined from core samples plotted with depth often varied more than geo physically estimated porosity, which tends to average porosity over a larger sample volume. An example of this phenomenon is shown in figure 8, especially in the interval from 3,000 to 3,030 ft.
Other factors also affect the comparison between geophysically estimated and laboratory core-porosity values. Often, cores are altered by the coring process. Furthermore, in-situ pressures are relieved when the core is extracted, and the core samples expand and cool. In fact, an argument can be made that geophysical-log data yield a better over-all representation of porosity than most laboratory core analyses, because of the inherent varia bility of most geologic formations and the small sample provided by individual cores (F.L. Paillet, U.S. Geological Survey, written commun., 1987). A comparison of porosity estimated by geophysical methods and by laboratory core analyses for various formations is shown in figures 8 through 14.
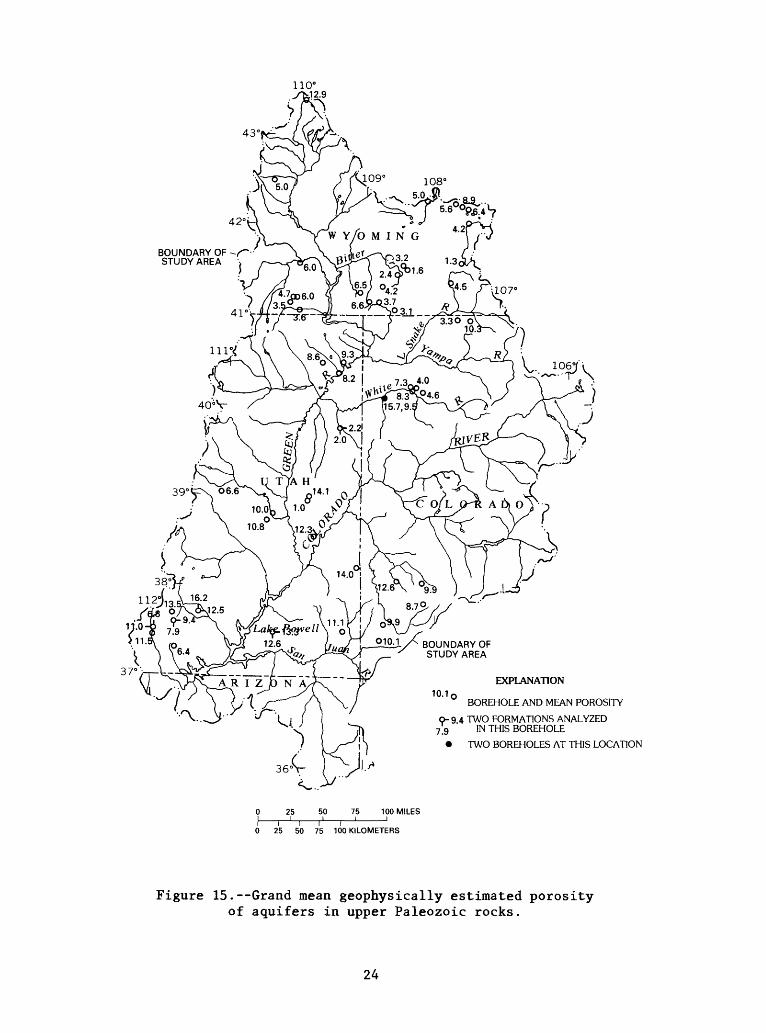
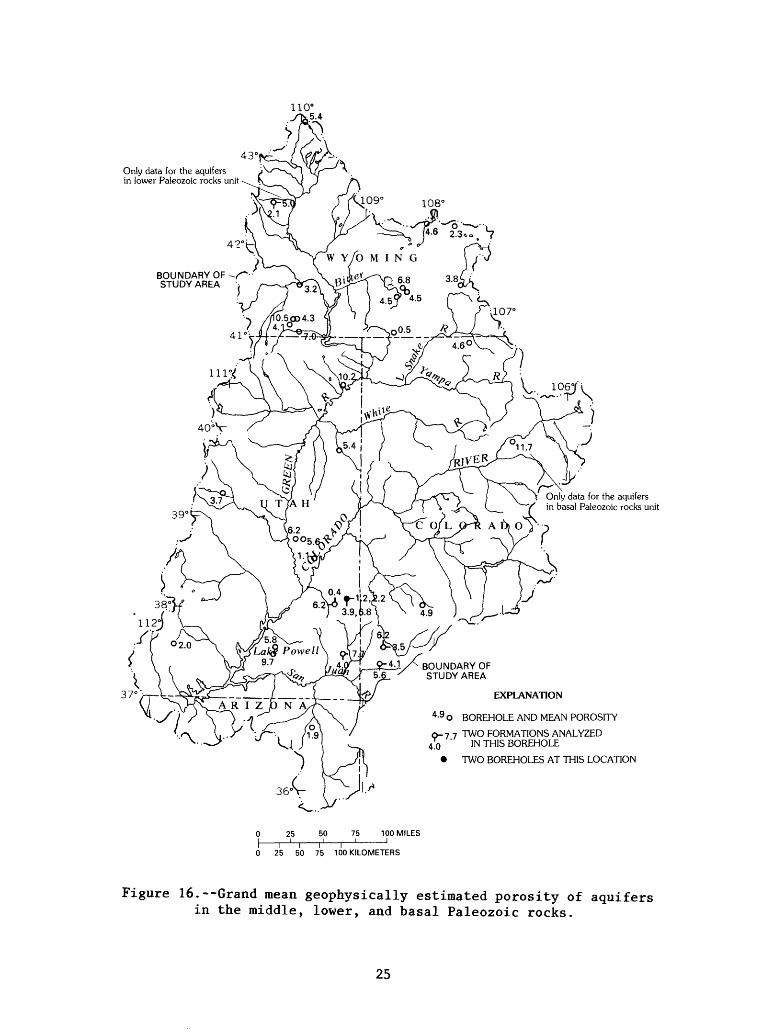
The locations of the 63 boreholes for which all three geophysical logs, but for which no laboratory core-porosity analyses were available, are shown on plates 2 and 3. The grand mean geophysically estimated porosity values for boreholes that penetrate the aquifers in upper Paleozoic rocks are shown at the location of the boreholes in figure 15; the grand mean geophysically esti mated porosity values for aquifers in the middle, lower, and basal Paleozoic rocks are shown at the location of the boreholes in figure 16. Due to the limited radius of investigation of the geophysical logs compared to the dis tances between boreholes that were analyzed and to variations of porosity in a vertical profile, grand mean porosity values were not contoured. Boreholes 45 and 46 (pi. 2), which are too close together to plot separately, have grand mean porosity values of 15.7 and 9.5 percent, respectively (fig. 15).
15

110°
43
BOUNDARY OF STUDY ARE A
BOUNDARY OF STUDY AREA
EXPLANATION
026 BOREHOLE AND NUMBER
25 50 75 100 MILES
0 25 50 75 100 KILOMETERS
Figure 7. Locations of boreholes used for comparison of geophysical- porosity and laboratory core-porosity values.
16
O
2,970
2,980
2,990
= 3,000
05
3,010
OLU CD X 3,020
tLUQ
3,030
3,040
3,050
i r
10 15 20 25 30 0 5
POROSITY, IN PERCENT
EXPLANATION ............... BULK-DENSITY LOG
SONIC LOG
10 15 20 25 30
NEUTRON LOG
- MEAN GEOPHYSICAL
Figure 8.--Comparison of porosity values estimated by geophysical methods and by laboratory Core analysis for the White Rim Sandstone Member of the Cutler Formation in borehole 67.
17

6,150
6,200
6,250
6,300
LJJ LL-
z01O
O
1ILJJ CO
UJ 6,350 O
6,400
6,45010 15 20 25 0 5
POROSITY, IN PERCENT
EXPLANATION ............... BULK-DENSITY LOG
SONIC LOG
10 15 20 25
NEUTRON LOG
- MEAN GEOPHYSICAL
Figure 9. Comparison of porosity values estimated by geophysical methods and by laboratory core analysis for the Weber Sandstone in borehole 44.
18

13,680
13,690
LLJ IIIu. 13,700
toQ 13,710
gLLJm
13,720tu Q
13,730
13,74010 15 20 0 5
POROSITY, IN PERCENT
EXPLANATION ............... BULK-DENSITY LOG
SONIC LOG
10 15 20
NEUTRON LOG
- MEAN GEOPHYSICAL CORE
Figure 10. Comparison of porosity values estimated by geophysical methods and by laboratory core analysis for the Tensleep Sandstone in borehole 17.
19

13,800
13,820 -
14,00015 20 0 5
POROSITY, IN PERCENT
EXPLANATION ............... BULK-DENSITY LOG
SONIC LOG
NEUTRON LOG
- MEAN GEOPHYSICAL CORE
10 15 20
Figure 11. Comparison of porosity values estimated by geophysical methods and by laboratory core analysis for the Tensleep Sandstone in borehole 21.
20

14,275
14,300 -
14,50015 0
POROSITY, IN PERCENT
EXPLANATION .......... BULK-DENSITY LOG
SONIC LOG
NEUTRON LOG
- MEAN GEOPHYSICAL CORE
10 15
Figure 12.--Comparison of porosity values estimated by geophysical methods and by laboratory core analysis for the Tensleep Sandstone in borehole 20.
21
6,300
6,650,10 15 20 25 0 5
POROSITY, IN PERCENT
EXPLANATION ........... BULK-DENSITY LOG
- SONIC LOG
- NEUTRON LOG
- - MEAN GEOPHYSICAL
10 15 20 25
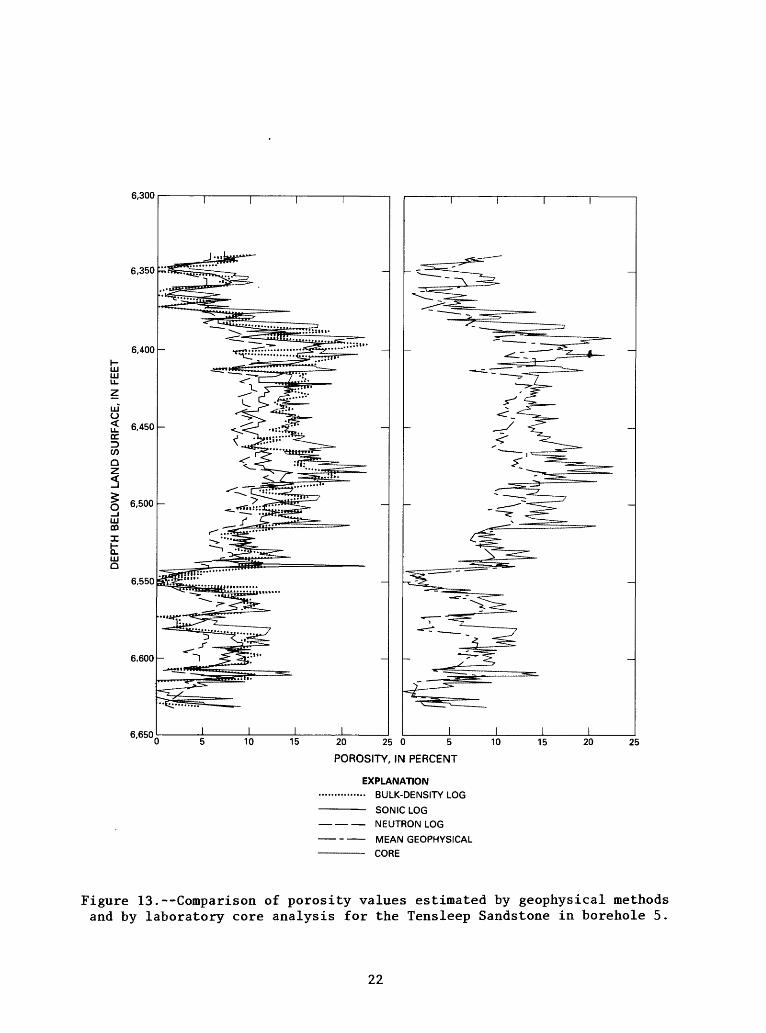
Figure 13.--Comparison of porosity values estimated by geophysical methods and by laboratory core analysis for the Tensleep Sandstone in borehole 5.
22

7,700
8,000 15 20 0 5
POROSITY, IN PERCENT
EXPLANATION ............... BULK-DENSITY LOG
SONIC LOG
NEUTRON LOG
_ MEAN GEOPHYSICAL
___ CORE
Figure 14.--Comparison of porosity values estimated by geophysical methods and by laboratory core analysis for the Leadville Limestone in borehole 76.
23
43
BOUNDARY OF ~v STUDY ARE A '-
W^.S
BOUNDARY OF STUDY AREA
EXPLANATION10.1ft
BOREHOLE AND MEAN POROSITY
0-94 TWO FORMATIONS ANALYZED 7.9 IN THIS BOREHOLE
TWO
inis Dv^ttcnv^un
BOREHOLES AT THIS LOCATION
25 50 75 100 MILESI I I I I
0 25 50 75 100 KILOMETERS
Figure 15. Grand mean geophysically estimated porosity of aquifers in upper Paleozoic rocks.
24
110°
43Only data for the aquifers in lower Paleozoic rocks unit
42
BOUNDARY OF STUDY AREA
BOUNDARY OF STUDY AREA
?* Only data for the aquifers in basal Paleozoic rocks unit
EXPLANATION
4-9 O BOREHOLE AND MEAN POROSITY
0-77 TWO FORMATIONS ANALYZED 4T0 ' IN THIS BOREHOLE
TWO BOREHOLES AT THIS LOCATION
25 50 75 100 MILES
0 25 50 75 100 KILOMETERS
Figure 16.--Grand mean geophysically estimated porosity of aquifers in the middle, lower, and basal Paleozoic rocks.
25

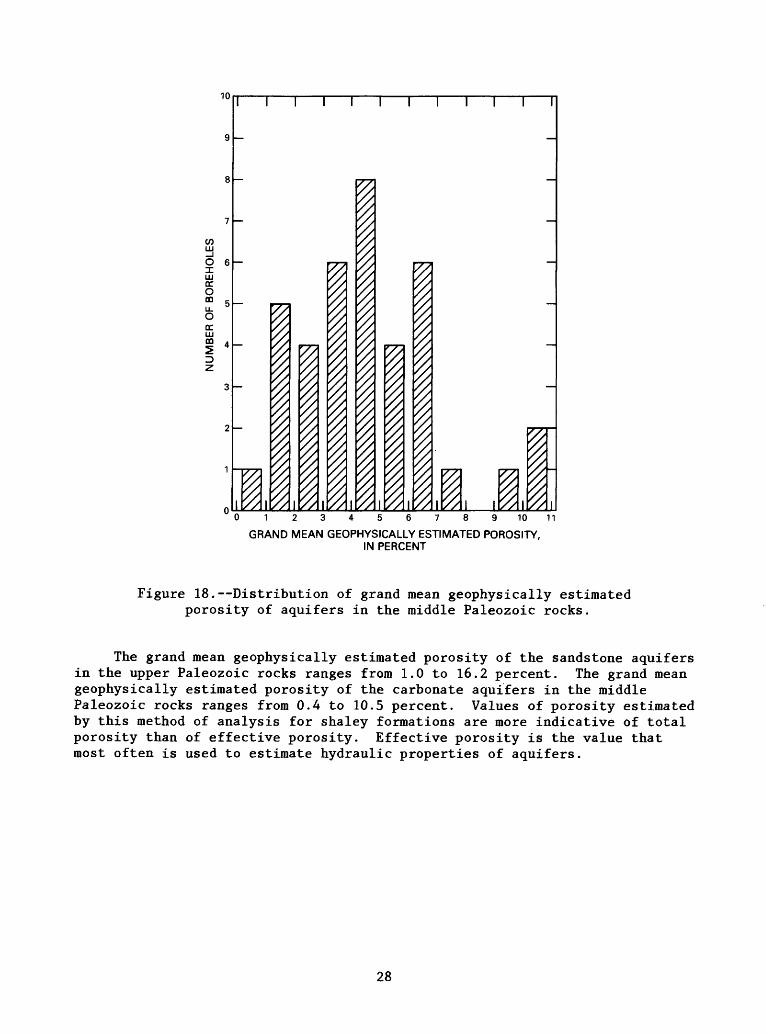
The ranges of grand mean geophysically estimated porosity values for each hydrogeologic unit or subunit are listed in table 3. The distribution of grand mean geophysically estimated porosity for the sandstone aquifers in the upper Paleozoic rocks is shown in figure 17. The distribution of grand mean geophysically estimated porosity for the carbonate aquifers in the middle Paleozoic rocks is shown in figure 18. Values of porosity estimated by this method of analysis for shaley intervals probably are larger than the actual porosity values.
Table 3. Ranges of grand mean geophysically estimated porosity values
Hydrogeologic unit
General lithologic
type
Range of grand mean geophysically estimated porosity
(percent)
Number of formation intervals analyzed
Aquifers inupper Paleozoic
rocks
Aquifers inmiddle Paleozoic
rocks
Aquifers inlower Paleozoic
rocks
Aquifers inbasal Paleozoic
rocks
Sandstone
Limestone and dolomite
Limestone and dolomite
Quartzite
1.0 to 16.2
0.4 to 10.5
5.0
11.7
59
38
Because the porosity values obtained herein are to be used to estimate hydraulic characteristics of the aquifers in Paleozoic rocks for use in flow- system analysis, grand mean porosity values for large intervals may be mis leading. A large percentage of the total ground-water flow may occur within relatively small intervals of high porosity and hydraulic conductivity. Therefore, the distribution of porosity estimated from each geophysical log throughout the interval of interest for each of the 99 formation intervals that were analyzed is shown on plates 2 and 3.
SUMMARY
As part of the Regional Aquifer Systems Analysis of the Upper Colorado River Basin, the porosity in selected Paleozoic rocks was estimated from borehole geophysical logs of oil-and-gas exploratory boreholes. Assumptions were made concerning the geophysical properties of selected sandstone, limestone, and dolomite rocks in order to calculate porosity from sonic,
26

10
I 5
1
-
-
JJ!1̂
\
\
i1
1
I%K
\\i
\
\ I
\
\
jiii
\
\^
i
i
ji
\
\
\i
i
i
ii'^
^
\
\
^ I^
i i i i i
-
-
^ ^y/^/ 7̂ / 7̂
1 2 3 4 5 6 7 8 9 10 11 12 13 14 15
GRAND MEAN GEOPHYSiCALLY ESTIMATED POROSITY, IN PERCENT
16 17
Figure 17. Distribution of grand mean geophysically estimated porosity of aquifers in the upper Paleozoic rocks.
neutron, and bulk-density logs. Departures from conditions requisite for porosity estimation from each type of log were identified by the character istic response of each log to the departure from ideal conditions. The most common departure from ideal conditions was the presence of shale in the formation rock. Formation intervals containing natural gas and fractured intervals also were identified. Intervals containing shale lenses, natural gas, and fractures were discarded from the analysis; however, no accounting was made for interstitial shale.
Geophysically estimated porosity values were compared with laboratory porosity values of core samples from 19 formation intervals in 17 boreholes, and a general correspondence was established. Porosity then was calculated from the sonic, neutron, and bulk-density logs from 99 formation intervals in 63 boreholes for which all 3 geophysical logs had been run, but for which no laboratory core analysis had been done. The mean value of porosity from the three geophysical logs for each 10-foot interval was calculated, and the grand mean porosity for each formation of interest in each borehole was calculated from the mean porosity values from the 10-foot intervals.
27
COLLJ
OX LLJDC O CD
1
-
I 1
i I\ I*i?/
\
\
\>ftl
\
\
?,
\
\
Iii
\ \ \
-
iv vA~\ // 1 U//\//\
123
GRAND MEAN
10 11
GEOPHYSICALLY ESTIMATED POROSITY, IN PERCENT
Figure 18. Distribution of grand mean geophysically estimated porosity of aquifers in the middle Paleozoic rocks.
The grand mean geophysically estimated porosity of the sandstone aquifers in the upper Paleozoic rocks ranges from 1.0 to 16.2 percent. The grand mean geophysically estimated porosity of the carbonate aquifers in the middle Paleozoic rocks ranges from 0.4 to 10.5 percent. Values of porosity estimated by this method of analysis for shaley formations are more indicative of total porosity than of effective porosity. Effective porosity is the value that most often is used to estimate hydraulic properties of aquifers.
28

SELECTED REFERENCES
Baars, D.L., 1962, Permian System of Colorado Plateau: American Associationof Petroleum Geologists Bulletin, v. 46, no. 2, p. 149-218.
Bennett, G.D., 1979, Regional ground-water systems analysis, in WaterSpectrum: U.S. Army Corps of Engineers, v. 2, no. 4, p. 36-42.
Bredehoeft, J.D., 1964, Variation of permeability in the Tensleep Sandstone inthe Bighorn Basin, Wyoming, as interpreted from core analyses andgeophysical logs: U.S. Geological Survey Professional Paper 501-D,p. D166-D170.
Brock, J.G., 1986, Applied open-hole log analysis: Houston, Texas, GulfPublishing Co., 284 p.
Grose, L.T., 1972, Tectonics, in Geologic atlas of the Rocky Mountain region:Denver, Rocky Mountain Association of Geologists, p. 35-44.
Herst, J.R., and Nelson, P.H., 1985, Well logging for physical properties,New York, McGraw Hill, 571 p.
Hintze, Lehi, 1973, Geologic history of Utah: Prove, Utah, Brigham YoungUniversity Geology Studies, v. 20, pt. 3, 181 p.
Imlay, R.W., 1980, Jurassic Paleobiology of the conterminous United States inits continental setting: U.S. Geological Survey Professional Paper1062, 134 p.
Kent, H.C., and Porter, K.W., eds., 1980, Colorado Geology: Denver, RockyMountain Association of Geologists, 258 p.
Keys, S.K., and MacCary, L.M., 1971, Application of borehole geophysics towater-resources investigations: U.S. Geological Survey Techniques ofWater-Resources Investigations, bk. 2, chap. El, 126 p.
King, P.B., and Beikman, H.M., 1974 (1975), Geologic map of the United States,exclusive of Alaska and Hawaii: U.S. Geological Survey Special GeologicMap, 3 sheets, scale 1:2,500,000.
Knight, R.L., and Cooper, J.C., 1955, Suggested changes in Devonianterminology of the four corners area, in Geology of parts of Paradox,Black Meas, and San Juan basins: Durango, Colo., Four Corners GeologicalSociety 1st Field Conference Guidebook, p. 56-58.
Lindner-Lunsford, J.B., Kimball, B.A., Chafin, D.T., and Bryant, C.G., 1989,Hydrogeology of aquifers of Paleozoic age, Upper Colorado RiverBasin excluding the San Juan Basin in Colorado, Utah, Wyoming, andArizona: U.S. Geological Survey Hydrologic Investigations Atlas HA-702,scale various, 2 sheets.
Lines, G.C., and Glass, W.R., 1975, Water resources of the thrust belt ofwestern Wyoming: U.S. Geological Survey Hydrologic Investigations AtlasHA-539, 3 sheets, scale 1:250,000.
Love, J.D., and Christiansen, A.C., 1980, Preliminary correlation ofstratigraphic units used on 1° x 2° geologic quadrangle maps of Wyoming,in Stratigraphy of Wyoming: Casper, Wyoming Geological Association,p. 279-282.
MacLachlan, M.E., 1981, Stratigraphic correlation chart for western Coloradoand northwestern New Mexico: Socorro, New Mexico Geological Society 32ndField Conference Guidebook, p. 75-79.
_____1987, General geology of the Piceance basin, in Taylor, 0.J., compiler,oil shale, water resources, and valuable minerals of the Piceance basin,Colorado The challenge and choices of development: U.S. GeologicalSurvey Professional Paper 1310, p. 7-15.
29
Molenaar, C.M., and Halvorsen, D.U., 1969, Nomenclature chart of the GrandCanyon and adjacent areas, in Geology and natural history of the 5thfield conference, Powell centennial river expedition Geology and naturalhistory of the Grand Canyon region: Durango, Colo., Four CornersGeological Society, p. 68.
O'Sullivan, R.B., 1978, Stratigraphic sections of Middle Jurassic San RafaelGroup from Lohali point, Arizona, to Bluff, Utah: U.S. Geological SurveyOil and Gas Chart OC-102.
___1980, Stratigraphic sections of Middle Jurassic San Rafael Group fromWilson arch to Bluff in southeastern Utah: U.S. Geological Survey Oiland Gas Chart OC-102.
____1981, Stratigraphic sections of some Jurassic rocks from near Moab, Utah,to Slick Rock, Colorado: U.S. Geological Survey Oil and Gas ChartOC-107.
Pipiringos, G.N., and Imlay, R.W., 1979, Lithology and subdivisions of theJurassic Stump Formation in southeastern Idaho and adjoining areas: U.S.Geological Survey Professional Paper 1035-C, 25 p.
Pipiringos, G.N., and O'Sullivan, R.B., 1978, Principal unconformities inTriassic and Jurassic rocks, Western Interior United States Apreliminary survey: U.S. Geological Survey Professional Paper 1035-A,29 p.
Rocky Mountain Association of Geologists, 1972, Geologic Atlas of the RockyMountain region: Denver, 331 p.
Schlumberger Limited, 1972, Log interpretation, Volume 1 Principles: NewYork, Schlumberger Limited, 113 p.
Taylor, 0.J., Hood, J.W., and Zimmerman, E.A., 1983, Plan of study for theregional aquifer systems analysis of the Upper Colorado River Basin inColorado, Utah, Wyoming, and Arizona: U.S. Geological SurveyWater-Resources Investigations Report 83-4184, 23 p.
____1986, Hydrogeologic framework of the Upper Colorado River Basin inColorado, Utah, Wyoming, and Arizona: U.S. Geological Survey HydrologicInvestigations Map HA-687.
Wengerd, S.A., and Strickland, J.W., 1954, Pennsylvanian stratigraphy ofParadox Salt Basin, Four Corners region, Colorado and Utah: AmericanAssociation of Petroleum Geologists Bulletin, v. 38, no. 10,p. 2157-2199, Correction, v. 39, no. 2, p. 259, 1955.
Wetherbee, G.A., and Van Liew, W.P., 1988, Geophysically determined porosityof Paleozoic rocks in the Upper Colorado River Basin, in McLean, J.S.,and Johnson, A.I., eds., Regional aquifer systems of the United States,Aquifers of the western mountain area: American Water ResourcesAssociation monograph no. 14, p. 161-169.
30
*U.S. GOVERNMENT PRINTING OFFICE 1991-0*73-207/50005