geomorphic monitoring of the patapsco river following the
TRANSCRIPT

Geomorphic Monitoring of the Patapsco River Following the Removal of the Simkins Dam, Patapsco River,
Maryland
Graham C. Boardman
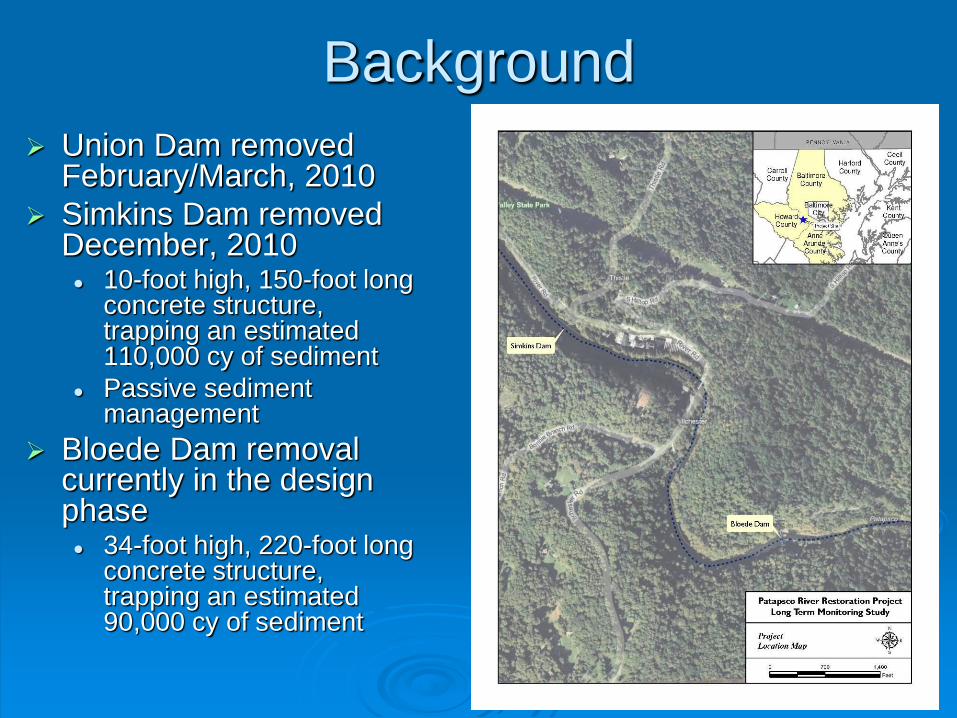
Background
Union Dam removed February/March, 2010
Simkins Dam removed December, 2010 10-foot high, 150-foot long
concrete structure, trapping an estimated 110,000 cy of sediment
Passive sediment management
Bloede Dam removal currently in the design phase 34-foot high, 220-foot long
concrete structure, trapping an estimated 90,000 cy of sediment

Morphometric Monitoring Tools
31 Cross Sections 2 Reference Reach
Sections
2 Union Dam Sections
63,750 feet, 12 Miles
5 Digital Elevation Models (12,900 lf, 2.4 Miles)
Facies and Site Mapping
Grain Size Analysis
>100 Permanent Photo Monitoring Sites
Bathymetric Survey
Goals Track sediment transport
from the Simkins Dam
Determine areas of erosion and deposition
Provide data for the adaptive management plan
Confirm simulations provided by the DREAM-1 model
Provide a tool to assist in public relations and aid future efforts
Three year monitoring effort including two surveys per year with one event driven survey

Simkins Dam

Bloede Dam
Approximately 4350 feet downstream of the Simkins Dam

Google Earth Photos
103 Benchmarked Photo Monitoring Sites including camera height and bearing

Storm Events- Elkridge Gage
5010 cfs 3/10/11
3270 cfs 3/28/11
2500 cfs 7/25/11
2500 cfs 4/28/11
Approximately 3.5 river miles downstream of Simkins Dam
USGS 01589035 PATAPSCO RIVER NEAR ELKRIDGE, MD
10
100
1000
10000
10/1
/2010
10/3
1/2
010
11/3
0/2
010
12/3
0/2
010
1/2
9/2
011
2/2
8/2
011
3/3
0/2
011
4/2
9/2
011
5/2
9/2
011
6/2
8/2
011
7/2
8/2
011
8/2
7/2
011
9/2
6/2
011
10/2
6/2
011
Provisional Data Subject to Revision
Dis
ch
arg
e,
cu
bic
feet
per
seco
nd
9/8/11 TS Lee, Recorded as 16,600 cfs at Hollofield Gage
2300 cfs 4/17/11
2300 cfs 4/13/11
1600 cfs 3/7/11
Dam Removal Hurricane Irene/TS Lee

Sediment Dispersal
Post Removal 2/13/11

Sediment Dispersal
Before Removal 5/24/10
Approximately 2400 feet
Downstream of the Simkins
Dam

Sediment Wedge
Post
Removal
6/10/11

Pre-Removal Fall 2010
Post-Removal Spring 2011
Bed Composition Changes

Sediment Dispersal
Post Removal 4/11/11

RS 63600- 1000’ US of Simkins Dam
885.37 SF Net Cut
RS 63200- 600’ US of Simkins Dam
858.26 SF Net Cut

Channel downcutting
and widening in
Simkins
Impoundment

RS 59800- 2800’ DS of Simkins Dam
1500’US of Bloede Dam
443.44 SF Net Fill
RS 58500- 4100’ DS of Simkins Dam
200’ US of Bloede Dam 450.91 SF Net Fill BUT Cut Post Storms

Simkins DEM
41,799 CY of net scour
Pre-Removal to 4/14/11

Bloede DEM
24,980 CY of net deposition
Pre-Removal to 4/14/11

Volumetric Channel Changes (using Post Removal Survey: Pre Irene/Lee)
Simkins 58400 60100 75901 -41,799 -45,217
September
2010 and
April 2011
Bloede 62650 66300 38236 24,980 28,710
September
2010 and
April 2011
DEM 1 48100 49150 19689 1,301 1,495
October 2010
and April
2011
DEM 2 42800 46700 71513 -115 -132
October 2010
and April
2011
DEM 3 37600 39000 36440 1,472 1,692
October 2010
and April
2011
Survey Dates
Net
Cut/Fill
TONS
Station ToDEM AreaStation
From
Area
SY
Net
Cut/Fill
CY
Simkins Impoundment Estimate Pre-Removal- 110,000 cy

Erosion and Deposition at Sections
Erosion/Depostion
-2750
-1750
-750
250
1250
2250
69
800
68
450
66
400
65
250
63
600
63
200
62
250
60
200
59
800
58
500
58
000
56
100
54
100
51
400
48
175
44
475
44
600
43
900
42
250
40
400
39
750
38
400
37
500
35
250
33
400
31
350
30
100
29
250
Cu
bic
Feet
Pre to Post Removal (3/2011) Pre to Truncated (Spring 2011) Pre to Storms (Later Summer 2011)
Simkins Dam Bloede Dam Gun Road
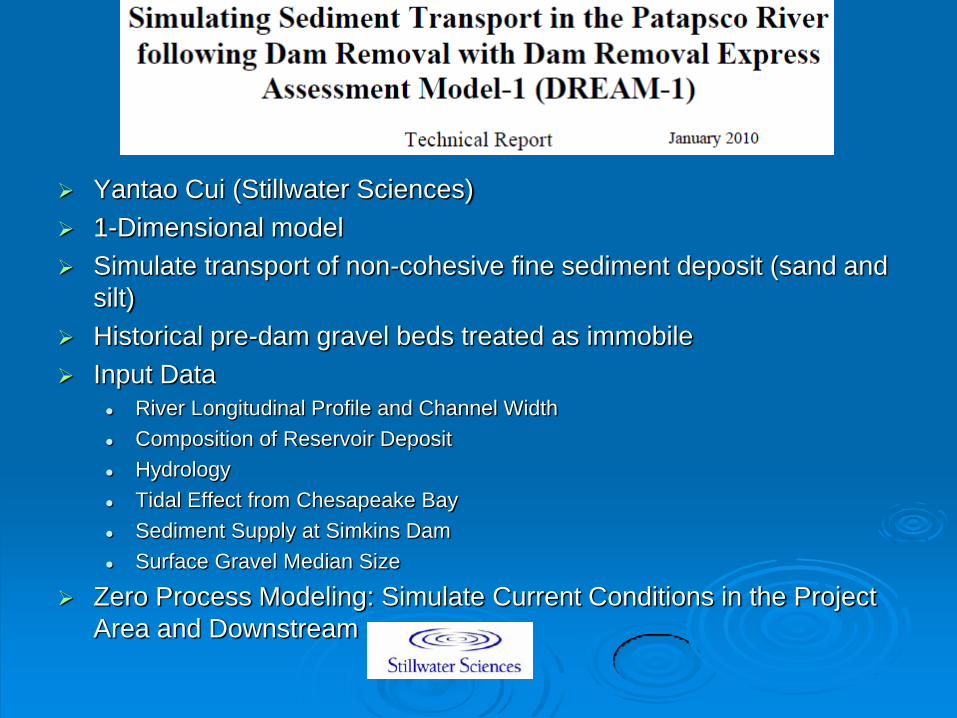
Yantao Cui (Stillwater Sciences)
1-Dimensional model
Simulate transport of non-cohesive fine sediment deposit (sand and
silt)
Historical pre-dam gravel beds treated as immobile
Input Data
River Longitudinal Profile and Channel Width
Composition of Reservoir Deposit
Hydrology
Tidal Effect from Chesapeake Bay
Sediment Supply at Simkins Dam
Surface Gravel Median Size
Zero Process Modeling: Simulate Current Conditions in the Project
Area and Downstream
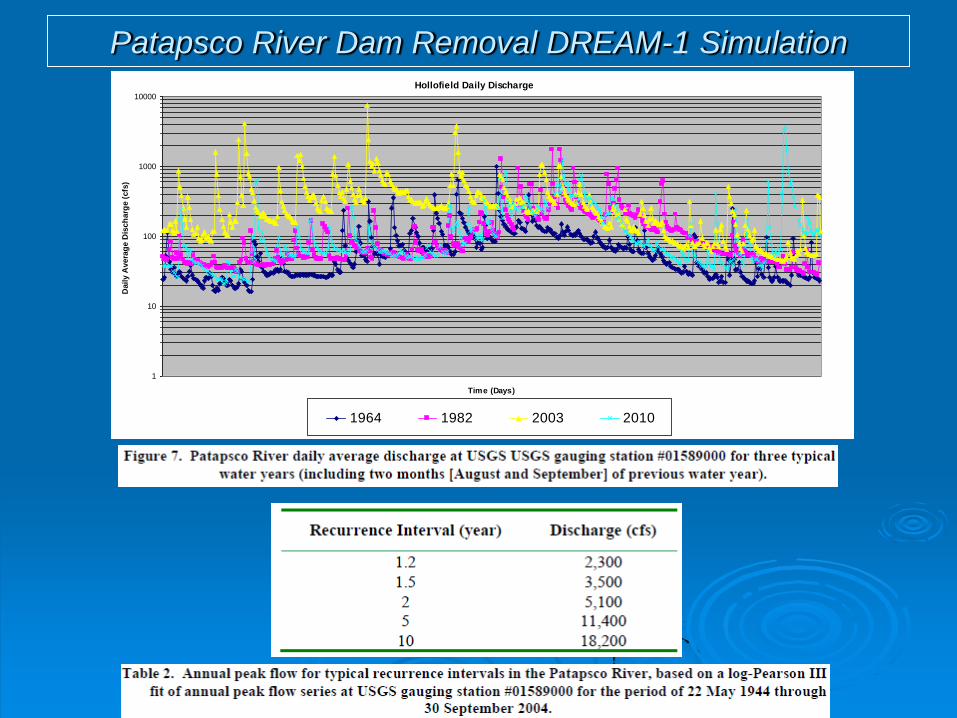
Patapsco River Dam Removal DREAM-1 Simulation Hollofield Daily Discharge
1
10
100
1000
10000
Time (Days)
Daily A
vera
ge D
isch
arg
e (
cfs
)
1964 1982 2003 2010

<-- Direction Of Flow
-10
-8
-6
-4
-2
0
2
4
6
8
10
56000 58000 60000 62000 64000 66000River Station (ft)
Be
d E
leva
tio
n C
han
ge (
ft)
Post Dam - Day 100 Post Dam - Day 150 Sediment Transport - Day 84
Sediment Transport - Day 364 Post Dam - Day 262
Run 2 – Average Hydrologic Year
Patapsco River Dam Removal
DREAM-1 Simulation
Simkins Dam
Bloede Dam

CONCLUSIONS Monitoring is to continue- Fall 2011 Complete-
Next Spring 2012
Work to complete Sediment Budget- Input? Gaps?
Bloede Dam Removal design is underway
Data/Analysis to be published and data eventually public

Questions?
Photo: Nick Nelson Photo: Charlie Wallis