geometry of patchy snowcovers · geometry of ablating snowpacks shook et al. (1993) applied image...
TRANSCRIPT
For presentation at the Joint Meeting - EasternfWestern Snow Conference, Quebec City, June 8- 1 1, 1993, and publication in the Proceedings of the Meeting.
GEOMETRY OF PATCHY SNOWCOVERS
IC Shook', D.M. Gmy2 and XW. Pomemy3
': Graduate Student, and 'Chairman, Division of Hydrology and Department of Agricultural and Bioresource Engineering, University of Saskatchewan, Saskatoon, Saskatchewan, S7N O W 0
Research Scientist, National Hydrology Research Institute, Environment Canada, 1 1 Innovation Boulevard, Saskatoon, Saskatchewan, S7N 3H5
ABSTRACT
The influence of the spatial variation in snowcover water equivalent on areal snow-cover depletion and the geometry of snow patches that form during ablation of shallow, seasonal snowcovers in open environments is discussed. A simplified ablation simulation is used to demon- strate that the fractal structure of the snowcover water equivalent causes soil and snow patches to possess fractal characteristics. This program is a distributed, grid-square model that uses a syntheti- cally-generated snowcover and includes an algorithm for approximating the effects of local advection on melt. Fractal dimension(s) of snow patches produced by the model are shown to agree closely with the dimensions of natural ablated snowcovers determined from analyses of aerial photographs.
Information on the temporal variation in snow-covered area of watershed during melt is requisite for accurate predictions of runoff. In open environments, the extent of the gross area of a watershed that is snow-covered affects runoff pri- marily in two ways: (a) it influences the melt rate, because patches of bare ground affect the energy balance of the snow field, and (b) it governs the contributing area of runoff. The highest rate of meltwater production on a watershed will occur when the product of the average melt rate and snow-covered area is a maximum.
Large areas of bare ground within a snow field
significantly alter its energy balance. Bare ground, having a lower albedo than snow, absorbs larger amounts of solar radiation and heats more quickly. Local advection of energy from the bare patches and the turbulent transfer of latent and sensible heat to adjacent snow surfaces increase the melt rate. Melting due to advection is most noticeable along the edges of snow patches. Small snow patches are dominated by turbulent melt throughout the season, or until they disappear; larger snow fields are domi- nated by radiation melt early in the season and turbulent melt late in the season as they decrease in area.
For a specific melt rate, less meltwater is gener- ated over a watershed when it is partly snow- covered than if completely-covered. Erickson et al. (1978) reported strong correlations between daily snowmelt runoff, mean daily air temperature and extent of snowcover on small watersheds in the Canadian prairies. Martinec and Rango (1986). warn against compensating a meltwater difference that arises from erroneous snowcover information by "optimizing" the melt factor used to calculate snowmelt.
Geometry of Ablating Snowpacks Shook et al. (1993) applied image analyses to
aerial photographs taken during snowmelt on two small watersheds: one located in the Canadian Prairies, the other in the alpine region of the Austrian Alps. They found that the soil and snow patches that form during ablation behave as fractal objects. That is, their perimeter-area and area-fre- quency characteristics can be described by power equations (Mandelbrot, 1983):
Perimete~Arer Relationship D?
P = kA1 , and
where P = perimeter, k = constant, A = area, and D, = fractal dimension (values
of D, > 1.0).
KoGak's Law KorEak's law is a rule of thumb that has been
found to apply to many fractal systems. The law states that the areas of natural fractal objects will follow a hyperbolic size distribution, i.e.,
-
where F(A) = fraction of the number of objects with a size equal to or greater than area, A,
c = the area of the smallest resolution cell, and
D, = fractal dimension.
D, indexes the degree of concentration of area. A small value indicates that most of the area is con- centrated in only a few objects; a large value indi- cates a more uniform distribution of areas.
On the basis of their findings Shook et al. (1993) concluded: (a) soil and snow patches have the same fractal dimension, and (b) snow patches are not random and their size distribution is predict- able. When the fractal dimension is known, the relative frequency and perimeter length of patches of specific size can be estimated by Eqs. 1 and 2. This information is required for assessing the influ- ence of advective energy transfers on melting of patchy snowcovers.
Areal Depletion Curves An areal-depletion curve is often used to correct
quantities of melt and runoff, calculated assuming complete snowcover on a basin, for the fraction of the basin area that is snow-covered. Because areal- depletion is strongly affected by the structure (depth and spatial distribution) of the snowcover water equivalent, S W , numerous studies have used this parameter as the basis for modelling the pro- cess (e.g., U.S. Army Corps of Engineers, 1956; Anderson, 1973; Martinec, 1985). Once the relation between the areal extent and the areal water equiv- alent of snowcover is known, the fraction of a basin
that is snow-covered is approximated from esti- mates of the amount of melt.
Dunne and Leopold (1978), Ferguson (1984). Buttle and McDonnell, (1987) and Donald (1992). apply one-dimensional melt rates to the distribution of S W to model the areal extent of snowcover on a basin at various stages of melt. A depletion curve developed in this manner does not include the effects of: (a) local advection on melt, (b) changes in the geometry of the soil and snow patches on the advective component, (c) changes in the albedo of snow due to metamorphism, or (d) changes to the energetics of snowmelt due to the penetration of solar radiation through snow to the underlying ground.
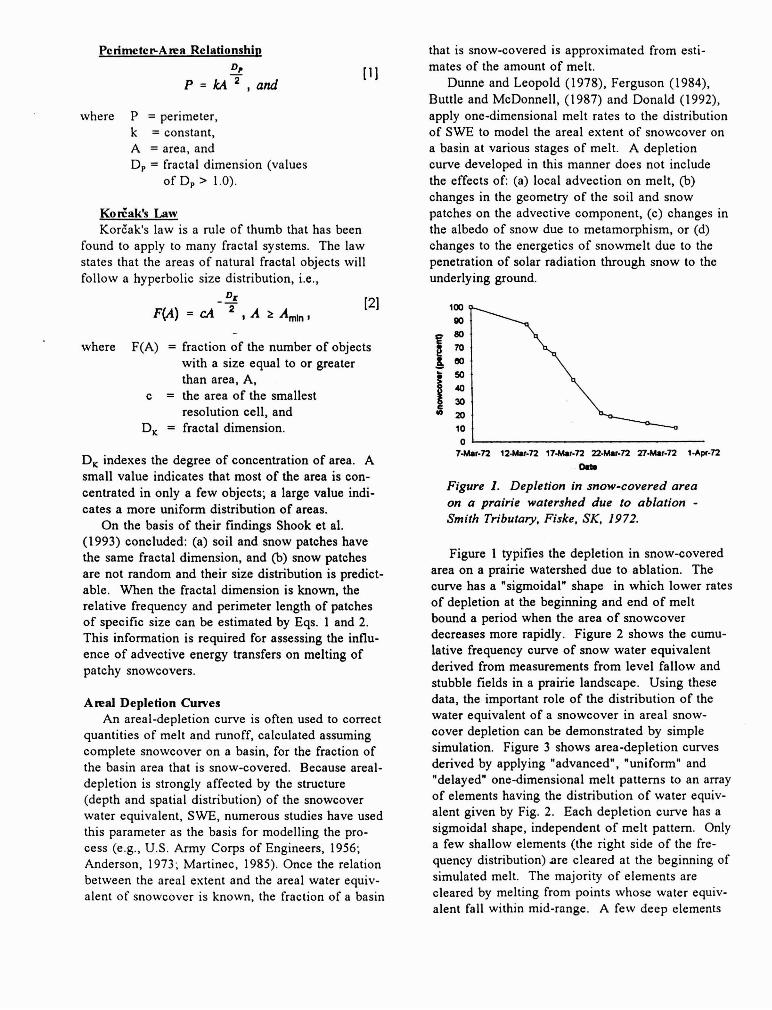
Figure I . Depletion in snow-covered area on a prairie watershed due to ablation - Smith Tributary. Fiske, SK. 1972.
Figure 1 typifies the depletion in snow-covered area on a prairie watershed due to ablation. The curve has a "sigrnoidal" shape in which lower rates of depletion at the beginning and end of melt bound a period when the area of snowcover decreases more rapidly. Figure 2 shows the cumu- lative frequency curve of snow water equivalent derived from measurements from level fallow and stubble fields in a prairie landscape. Using these data, the important role of the distribution of the water equivalent of a snowcover in areal snow- cover depletion can be demonstrated by simple simulation. Figure 3 shows area-depletion curves derived by applying "advanced", "uniform" and "delayed" one-dimensional melt patterns to an array of elements having the distribution of water equiv- alent given by Fig. 2. Each depletion curve has a sigmoidal shape, independent of melt pattern. Only a few shallow elements (the right side of the fre- quency distribution) are cleared at the beginning of simulated melt. The majority of elements are cleared by melting from points whose water equiv- alent fall within mid-mnge. A few deep elements
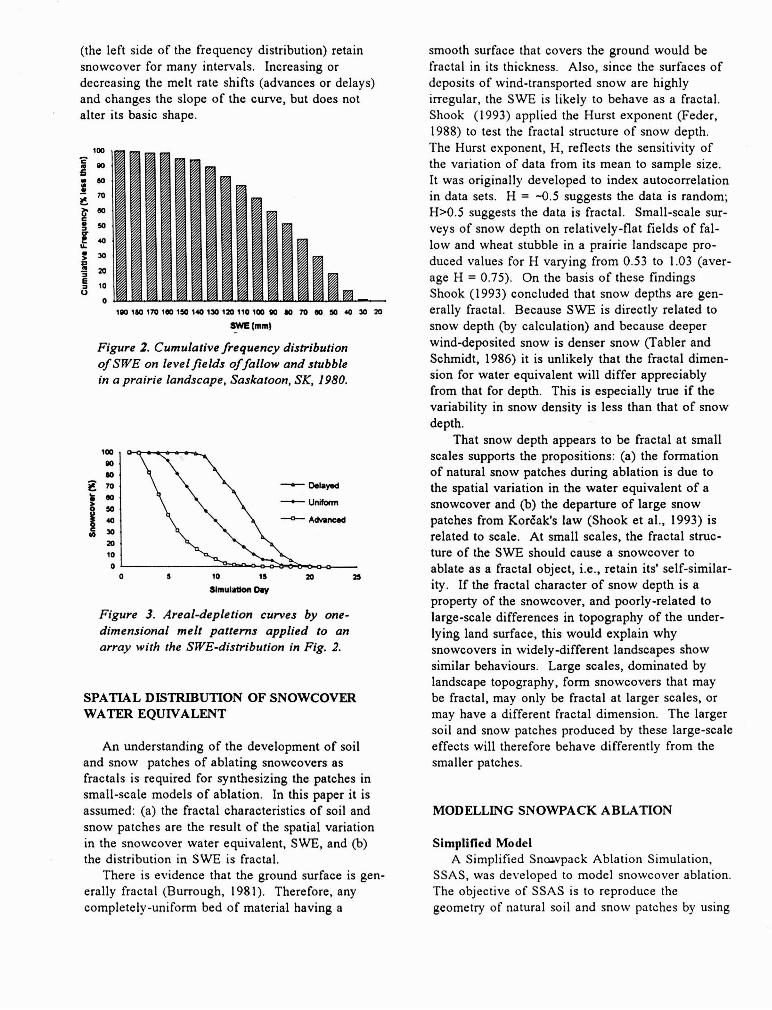
(the left side of the frequency distribution) retain snowcover for many intervals. Increasing or decreasing the melt rate shifts (advances or delays) and changes the slope of the curve, but does not alter its basic shape.
- loo
C ; - m E P m a 5a
2 a Y.
f = f: ' j M
9 10 0
0
Figure 2. Cumulative frequency distribution of SWE on level fields of fallow and stubble in a prairie landscape, Saskatoon, SK, 1980.
loo m M
270
t m !: V)
m 10
0
Figure 3. Areal-depletion curves by one- dimensional melt patterns applied to an array with the SWE-distn'bution in Fig. 2.
SPATIAL DISTRIBUTION OF SNOWCOVER WATER EQUIVALENT
An understanding of the development of soil and snow patches of ablating snowcovers as fractals is required for synthesizing the patches in small-scale models of ablation. In this paper it is assumed: (a) the fractal characteristics of soil and snow patches are the result of the spatial variation in the snowcover water equivalent, SWE, and (b) the distribution in SWE is fractal.
There is evidence that the ground surface is gen- erally fractal (Burrough, 198 1). Therefore, any completely-uniform bed of material having a
smooth surface that covers the ground would be fractal in its thickness. Also, since the surfaces of deposits of wind-transported snow are highly irregular, the SWE is likely to behave as a fractal. Shook (1993) applied the Hurst exponent (Feder, 1988) to test the fractal structure of snow depth. The Hurst exponent, H, reflects the sensitivity of the variation of data from its mean to sample size. It was originally developed to index autocorrelation in data sets. H = -0.5 suggests the data is random; H>0.5 suggests the data is fractal. Small-scale sur- veys of snow depth on relatively-flat fields of fal- low and wheat stubble in a prairie landscape pro- duced values for H varying from 0.53 to 1.03 (aver- age H = 0.75). On the basis of these findings Shook (1993) concluded that snow depths are gen- erally fractal. Because SWE is directly related to snow depth (by calculation) and because deeper wind-deposited snow is denser snow (Tabler and Schmidt, 1986) it is unlikely that the fractal dimen- sion for water equivalent will differ appreciably from that for depth. This is especially true if the variability in snow density is less than that of snow depth.
That snow depth appears to be fractal at small scales supports the propositions: (a) the formation of natural snow patches during ablation is due to the spatial variation in the water equivalent of a snowcover and (b) the departure of large snow patches from KorEak's law (Shook et al., 1993) is related to scale. At small scales, the fractal struc- ture of the SWE should cause a snowcover to ablate as a fractal object, i.e., retain its' self-similar- ity. If the fractal character of snow depth is a property of the snowcover, and poorly-related to large-scale differences in topography of the under- lying land surface, this would explain why snowcovers in widely-different landscapes show similar behaviours. Large scales, dominated by landscape topography, form snowcovers that may be fractal, may only be fractal at larger scales, or may have a different fractal dimension. The larger soil and snow patches produced by these large-scale effects will therefore behave differently from the smaller patches.
MODELLING SNOWPACK ABLATION
Simplified Model A Simplified Sncwpack Ablation Simulation.
SSAS, was developed to model snowcover ablation. The objective of SSAS is to reproduce the geometry of natural soil and snow patches by using
approximations of the actual energy transfer func- tions.
SSAS is a distributed, grid-square model. Each element in the grid is assigned a predetermined depth and density of snow. Melt fluxes are applied to a model snowpack to cause melting. As areas of bare ground appear, some of the solar energy they absorb is transferred to the atmosphere. As the air moves downwind over fetches of bare soil, addi- tional amounts of energy are transferred until the air reaches the upwind edges of patches of snow. At the leading edges of snow, the direction of the turbulent energy transfers is reversed and heat is added to the snow patches. Because the system incorporates the areal distribution of snowmelt, SSAS is a three dimensional model.
SSAS Algorithms No scales are used in SSAS because: (a) SSAS
is intended to establish the viability of a particular type of modelling and does not represent any par- ticular location; (b) the ablation process appears to be fractal over a large range of scales, therefore the program should be valid for a wide range in size; and (c) the program is intended to produce fractal results, therefore the introduction of artificial char- acteristic lengths is generally to be avoided.
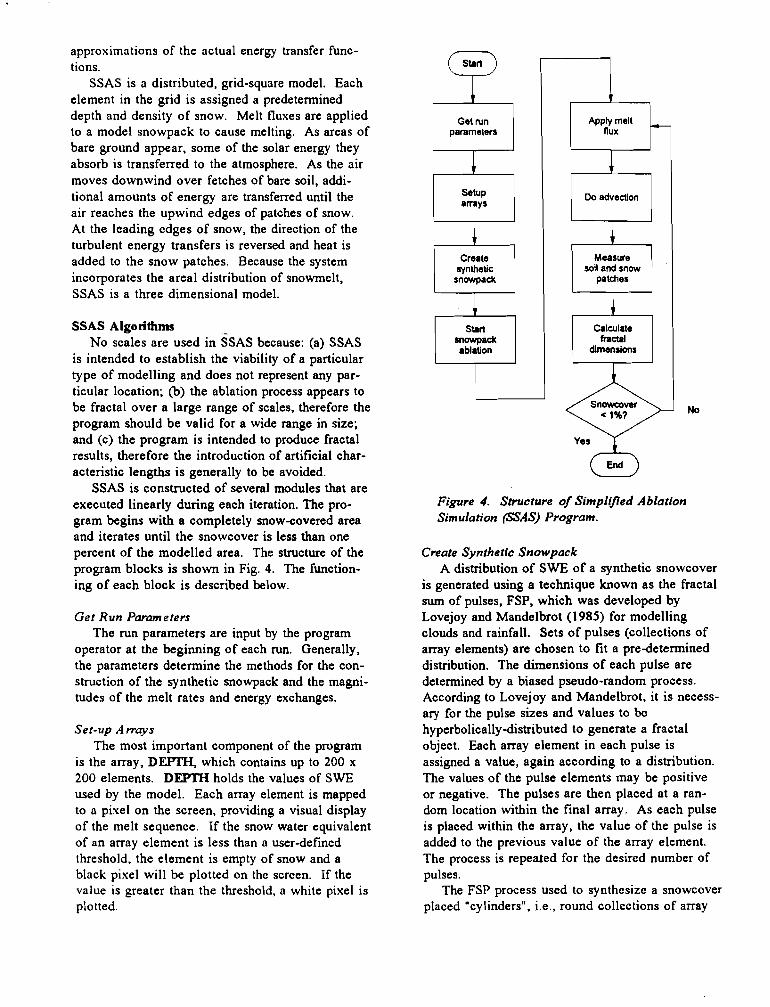
SSAS is constructed of several modules that are executed linearly during each iteration. The pro- gram begins with a completely snow-covered area and iterates until the snowcover is less than one percent of the modelled area. The structure of the program blocks is shown in Fig. 4. The function- ing of each block is described below.
Get Run Parameters The run parameters are input by the program
operator at the beginning of each run. Generally, the parameters determine the methods for the con- struction of the synthetic snowpack and the magni- tudes of the melt rates and energy exchanges.
Set-up A mays The most important component of the program
is the array, DEFTH, which contains up to 200 x 200 elements. DEPTH holds the values of SWE used by the model. Each array element is mapped to a pixel on the screen, providing a visual display of the melt sequence. If the snow water equivalent of an array element is less than a user-defined threshold. the element is empty of snow and a black pixel will be plotted on the screen. If the value is greater than the threshold, a white pixel is plotted.
Get run parameters 1 I I " p ~ ~ " h
arrays Do advection
synthetic soil and snow snowpack
mowpack ablation dimensions
Figure 4. Structure of Simplified Ablation Simulation (SSAS) Program.
Create Synthetic Snowpack A distribution of SWE of a synthetic snowcover
is generated using a technique known as the fractal sum of pulses. FSP, which was developed by Lovejoy and Mandelbrot (1985) for modelling clouds and rainfall. Sets of pulses (collections of array elements) are chosen to fit a predetermined distribution. The dimensions of each pulse are determined by a biased pseudo-random process. According to Lovejoy and Mandelbrot, it is necess- ary for the pulse sizes and values to be hyperbolically-distributed to generate a fractal object. Each array element in each pulse is assigned a value, again according to a distribution. The values of the pulse elements may be positive or negative. The pulses are then placed at a ran- dom location within the final array. As each pulse is placed within the array, the value of the pulse is added to the previous value of the array element. The process is repeated for the desired number of pulses.
The FSP process used to synthesize a snowcover placed "cylinders", i.e., round collections of array
elements, in the array. Shook (1993) gives a pro- gram listing for this algorithm. Several parameters are requested from the user to generate the FSP surface. They include: the number of circular pulses, the maximum pulse radius permitted, the exponent for the hyperbolic diameter and depth relationships and the cylinder aspect ratio (of cylin- der height to radius). As demonstrated in later discussions, snowpacks generated by this procedure possess fractal properties.
Start Snowpack Ablation Snowpack ablation is an iterative process. In
each iteration the simulated snowpack is subjected to melt fluxes and the resulting soil and snow patches are measured. No attempt is made to measure the soil patches until at least 1% of the model area is snow-free. -
Apply Melt Flux The melt flux is assumed constant for each time
step. A constant "depthw of melt (input by the user) is subtracted from all elements whose "depth" is greater than zero, at each iteration of the pro- gram.
Do Advection If the SWE of an element is zero, it is assumed
that a portion of the energy flux it receives will be used as sensible heat, which in turn, will be trans- ported downwind by the atmosphere and advected to an adjacent snow patch. The amount of energy available for local advection is simulated by multi- plying the melt flux by a user-specified factor. Only part of this energy is transferred and the frac- tion is specified by the user in terms of the number of array elements that are designated as required for the transfer of the total energy available for advection from one element. That is, if the user specifies 5 elements as the length required to effect the transfer of 100% of the energy available, then each bare element will contribute 115 of its avail- able supply. Therefore, the longer the fetch (up to the maximum specified by the user), the greater the quantity of energy advected. The simulated energy transfer is linear, whereas the actual process is non- linear (Weisman. 1977).
SSAS assumes that wind occurs only in the direction of the four main compass points. In each time step, the wind direction is constant and air moves once across the array. This may cause a characteristic length in that the time step is related by the wind velocity to the travel distance.
When the simulated wind reaches an array
element containing snow, the energy contained in the air is transferred to the snowpack and reduces its water equivalent by a corresponding amount of melt. Advective energy is distributed uniformly over the snow fetch.
Measure Soil and Snow Patches The primary output of SSAS is the display of
the array DEPTH that is mapped to the screen. Displaying the appearance of the snowpack pro- vides the operator a visual display by which to judge the realism of the simulation. Analysis of the patch geometry requires the measurements of the perimeters and areas of the patches and the calcula- tion of the fractal dimensions, Dp and D,.
The perimeter of each patch is measured with a "bugw, a small array (2x2 elements) that "walks" around the outside of the patch by examining the geometry of the edge of the patch. The principle of using a bug to trace an irregular outline is well- known in image processing applications (Rosenfeld and Kak, 1982). As the bug walks around the edge of the patch, it counts the number of elements in the patch perimeter and the location of each edge element. When the bug returns to its original start- ing point, the tracing of the patch is complete.
Measuring the area involves determinations of the maximum and minimum array columns of each array line of the patch. The area of the patch is determined by counting the number of patch elements on each line between the maximum and minimum array columns.
Calculate Fmctal Dim ensions The patch perimeters and areas are stored in
separate arrays as they are determined. When all patches have been found, the fractal dimensions, Dp and D,, are calculated. The perimeter, area and F(A) are transformed into their logarithmic values and least-squares lines fitted to the transformed data following procedures described by Press et al. (1986).
The iterations of snow ablation are repeated until 99% of the model area is snow-free. This threshold was set to prevent errors that would have been generated if the program had tried to measure non-existent snow patches.
RESULTS OF ABLATION SIMULATION
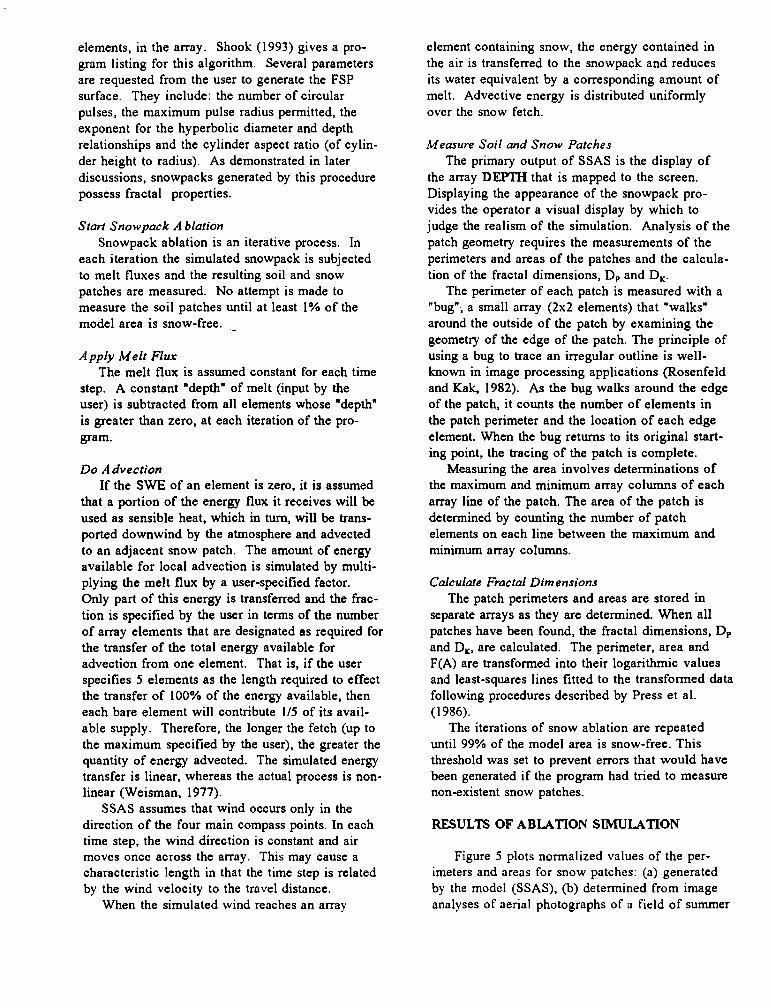
Figure 5 plots normalized values of the per- imeters and areas for snow patches: (a) generated by the model (SSAS), (b) determined from image analyses of aerial photographs of a field of summer
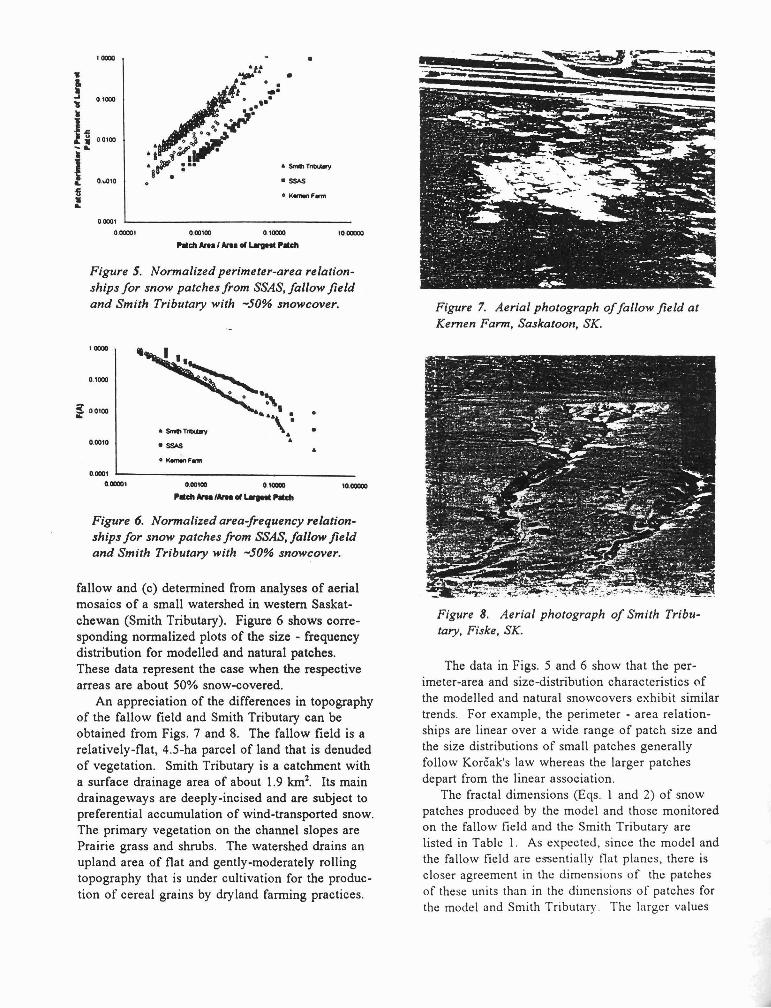
Figure 5. Normalized perimeter-area relation- ships for snow patches from SSAS, fallow field and Smith Tributary with -50% snowcover.
fallow and (c) determined from analyses of aerial mosaics of a small watershed in western Saskat- chewan (Smith Tributary). Figure 6 shows corre- sponding normalized plots of the size - frequency distribution for modelled and natural patches. These data represent the case when the respective arreas are about 50% snow-covered.
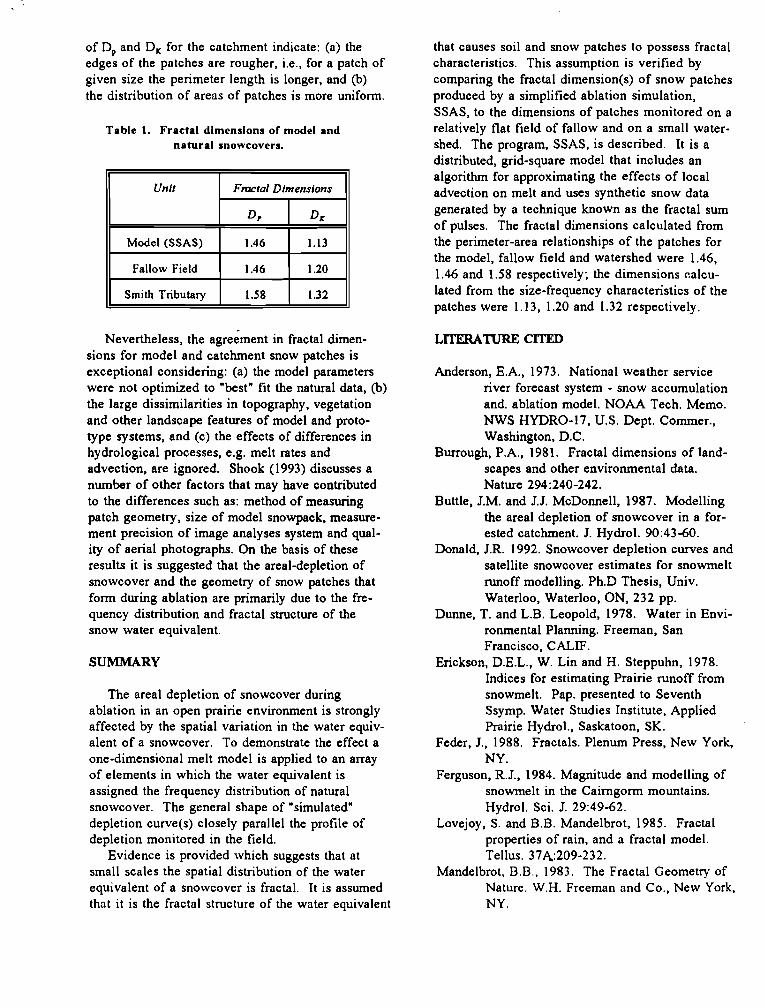
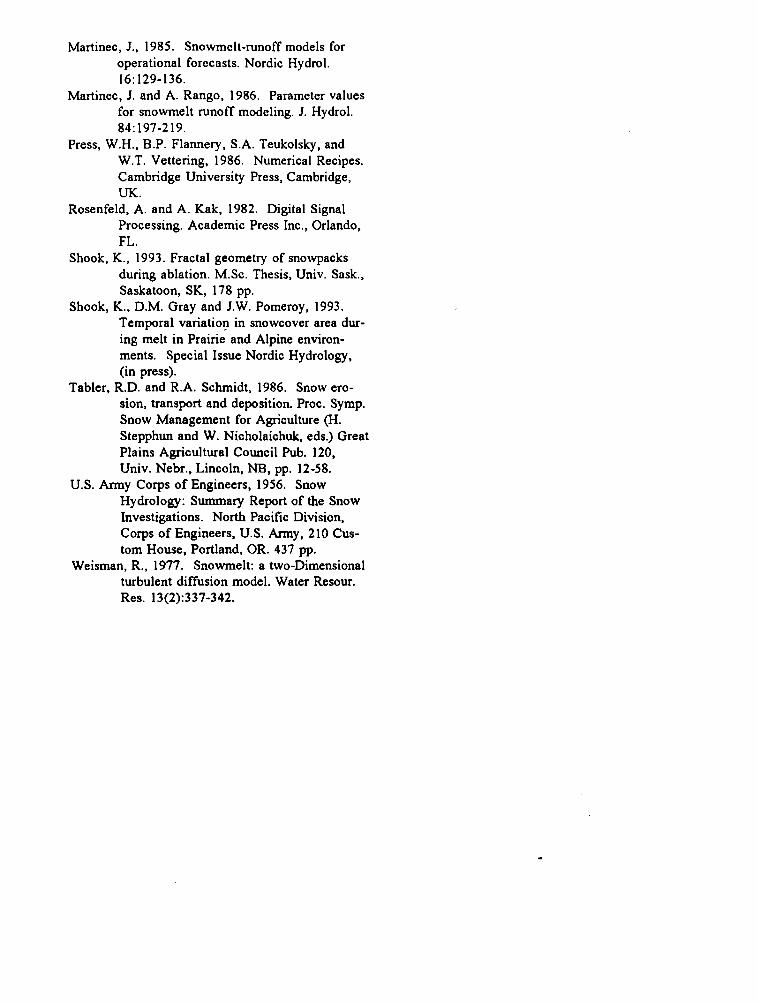
An appreciation of the differences in topography of the fallow field and Smith Tributary can be obtained from Figs. 7 and 8. The fallow field is a relatively-flat, 4.5-ha parcel of land that is denuded of vegetation. Smith Tributary is a catchment with a surface drainage area of about 1.9 km2. Its main drainageways are deeply-incised and are subject to preferential accumulation of wind-transported snow. The primary vegetation on the channel slopes are Prairie grass and shrubs. The watershed drains an upland area of flat and gently-moderately rolling topography that is under cultivation for the produc- tion of cereal grains by dryland farming practices.
Figure 7. Aerial photograph of fallow jield at Kernen Farm, Saskatoon, SK.
Figure 6. Normalized area-frequency relation- ships for snow patches from SSAS, fallow field and Smith Tributary with -50% snowcover.
Figure 8. Aerial photograph of Smith Tribu- tary, Fiske, SK.
The data in Figs. 5 and 6 show that the per- imeter-area and size-distribution characteristics of the modelled and natural snowcovers exhibit similar trends. For example, the perimeter - area relation- ships are linear over a wide range of patch size and the size distributions of small patches generally follow KorZak's law whereas the larger patches depart from the linear association.
The fractal dimensions (Eqs. 1 and 2) of snow patches produced by the model and those monitored on the fallow field and the Smith Tributary are listed in Table 1. As expected, since the model and the fallow field are essentially flat planes, there is closer agreement in the dimensions of the patches of these units than in the dimensions of patches for the model and Smith Tributary. The larger values
of D, and D, for the catchment indicate: (a) the edges of the patches are rougher, i.e., for a patch of given size the perimeter length is longer, and (b) the distribution of areas of patches is more uniform.
Table 1. Fractal dimensions of model and natural snowcovers.
Fmctal Dimensions
Model (SSAS)
Fallow Field
Smith Tributary
Nevertheless, the agreement in fractal dimen- sions for model and catchment snow patches is exceptional considering: (a) the model parameters were not optimized to "best" fit the natural data, (b) the large dissimilarities in topography, vegetation and other landscape features of model and proto- type systems, and (c) the effects of differences in hydrological processes, e.g. melt rates and advection. are ignored. Shook (1993) discusses a number of other factors that may have contributed to the differences such as: method of measuring patch geometry, size of model snowpack, measure- ment precision of image analyses system and qual- ity of aerial photographs. On the basis of these results it is suggested that the areal-depletion of snowcover and the geometry of snow patches that form during ablation are primarily due to the fre- quency distribution and fractal structure of the snow water equivalent.
SUMMARY
The areal depletion of snowcover during ablation in an open prairie environment is strongly affected by the spatial variation in the water equiv- alent of a snowcover. To demonstrate the effect a one-dimensional melt model is applied to an array of elements in which the water equivalent is assigned the frequency distribution of natural snowcover. The general shape of "simulated" depletion curve(s) closely parallel the profile of depletion monitored in the field.
Evidence is provided which suggests that at small scales the spatial distribution of the water equivalent of a snowcover is fractal. It is assumed that it is the fractal structure of the water equivalent
that causes soil and snow patches to possess fractal characteristics. This assumption is verified by comparing the fractal dimension(s) of snow patches produced by a simplified ablation simulation, SSAS, to the dimensions of patches monitored on a relatively flat field of fallow and on a small water- shed. The program, SSAS, is described. It is a distributed, grid-square model that includes an algorithm for approximating the effects of local advection on melt and uses synthetic snow data generated by a technique known as the fractal sum of pulses. The fractal dimensions calculated from the perimeter-area relationships of the patches for the model, fallow field and watershed were 1.46, 1.46 and 1.58 respectively; the dimensions calcu- lated from the size-frequency characteristics of the patches were 1.13, 1.20 and 1.32 respectively.
Anderson, E.A., 1973. National weather service river forecast system - snow accumulation and, ablation model. NOAA Tech. Memo. NWS HYDRO-17, U.S. Dept. Commer., Washington, D.C.
Burrough, P.A., 1981. Fractal dimensions of land- scapes and other environmental data. Nature 294:240-242.
Buttle, J.M. and J.J. McDonnell, 1987. Modelling the areal depletion of snowcover in a for- ested catchment. J. Hydrol. 90:43-60.
Donald, J.R. 1992. Snowcover depletion curves and satellite snowcover estimates for snowmelt runoff modelling. Ph.D Thesis, Univ. Waterloo, Waterloo, ON, 232 pp.
Dunne, T. and L.B. Leopold, 1978. Water in Envi- ronmental Planning. Freeman, San Francisco, CALIF.
Erickson, D.E.L., W. Lin and H. Steppuhn, 1978. Indices for estimating Prairie runoff from snowmelt. Pap. presented to Seventh Ssymp. Water Studies Institute. Applied Prairie Hydrol., Saskatoon, SK.
Feder, J., 1988. Fractals. Plerium Press, New York, NY.
Ferguson, R.J., 1984. Magnitude and modelling of snowmelt in the Caimgoxm mountains. Hydrol. Sci. J. 29:49-62.
Lovejoy, S. and B.B. Mandelbrot, 1985. Fractal properties of rain, and a fractal model. Tellus. 374:209-232.
Mandelbrot, B.B., 1983. The Fractal Geometry of Nature. W.H. Freeman and Co., New York. NY.
Martinec, J., 1985. Snowmelt-runoff models for operational forecasts. Nordic Hydrol. 16: 129-136.
Martinec, J. and A. Rango. 1986. Parameter values for snowmelt runoff modeling. J. Hydrol. 84: 197-2 19.
Press, W.H., B.P. Flannery, S.A. Teukolsky, and W.T. Vettering. 1986. Numerical Recipes. Cambridge University Press. Cambridge, UK.
Rosenfeld, A. and A. Kak, 1982. Digital Signal Processing. Academic Press Inc., Orlando, FL.
Shook, K., 1993. Fractal geometry of snowpacks during ablation. M.Sc. Thesis, Univ. Sask.. Saskatoon, SK, 178 pp.
Shook, K., D.M. Gray and J.W. Pomeroy, 1993. Temporal variation in snowcover area dur- ing melt in Prairie and Alpine environ- ments. Special Issue Nordic Hydrology, (in press).
Tabler, R.D. and R.A. Schmidt, 1986. Snow ero- sion, transport and deposition. Proc. Symp. Snow Management for Agriculture (H. Stepphun and W. Nicholaichuk, eds.) Great Plains Agricultural Council Pub. 120, Univ. Nebr., Lincoln, NB, pp. 12-58.
U.S. Army Corps of Engineers, 1956. Snow Hydrology: Summary Report of the Snow Investigations. North Pacific Division, Corps of Engineers, U.S. Army, 210 Cus- tom House, Portland. OR. 437 pp.
Weisman. R.. 1977. Snowmelt: a two-Dimensional turbulent diffusion model. Water Resour. Res. 13(2):337-342.