geometry and loading condition on fatigue strength
TRANSCRIPT

metals
Article
A Method for Predicting the Effects of SpecimenGeometry and Loading Condition on Fatigue Strength
Chengqi Sun 1,2,* and Qingyuan Song 1,2
1 State Key Laboratory of Nonlinear Mechanics, Institute of Mechanics, Chinese Academy of Sciences,Beijing 100190, China; [email protected]
2 School of Engineering Sciences, University of Chinese Academy of Sciences, Beijing 100049, China* Correspondence: [email protected]; Tel.: +86-10-8254-3968
Received: 19 September 2018; Accepted: 8 October 2018; Published: 10 October 2018�����������������
Abstract: Specimen geometry and loading condition usually have a great influence on the fatiguestrength of metallic materials, which is an important issue in evaluating the reliability of componentparts. In this paper, a rotating bending fatigue test is performed at first on an hourglass specimen anda notch specimen of a high strength titanium alloy. Experimental results indicate that, in terms oflocal stress, the notch specimen endures higher fatigue strength in comparison with the hourglassspecimen due to its relatively smaller control volume. Then, a probabilistic control volume methodis proposed for correlating the effects of specimen geometry and loading condition on the fatiguestrength based on Weibull distribution and the concept of control volume. A simple formula isobtained for the fatigue strength in relation to control volumes, in which the parameter is the shapeparameter of Weibull distribution of fatigue strength. The predicted results are in good agreementwith the present experimental data for high strength titanium alloy and the data for the high strengthsteel and the full scale EA4T axle in the literature.
Keywords: notch effect; size effect; loading condition; fatigue strength; control volume; titanium alloy
1. Introduction
The effects of specimen size, notch geometry, and loading condition on fatigue behavior of metallicmaterials are important topics in the fatigue research field, which is of great importance in evaluatingthe fatigue strength of structure components.
Much research has been carried out on the effects of specimen geometry and loading conditionon fatigue behavior of metallic materials [1–8]. For example, Furuya [9] investigated the effect ofspecimen size on the very high cycle fatigue behavior of high strength steels, and showed that largespecimens endured lower fatigue strengths due to the appearance of larger inclusions in controlvolumes (risk volumes). Kuguel [10] introduced a highly stressed volume method for predicting thefatigue strength of notched specimens. In this method, the fatigue notch factor Kf and the elastic stressconcentration factor Kt were correlated by Kf/Kt = (Vn/Vs)a, where Vn and Vs were volumes (the regionno less than 95% of the maximum stress) for the notched and smooth specimens, respectively, and awas a material constant determined by fitting the fatigue strength and the highly stressed volume.Lin & Lee [11] studied the effect of highly stressed volume on the fatigue strength of austemperedductile irons under rotating bending and axial loading fatigue tests, and showed that the highlystressed volume method was able to predict the effects of notch and loading condition on fatiguestrength. Leitner et al. [12] investigated the statistical size effects on the fatigue strength of notchedelectroslag remelted 50CrMo4 steel components under uniaxial and multi-axial loadings. It wasindicated that the highly stressed surface concept might be preferably applied in case of surface failuremodes, while for the highly stressed volume concept, an upper threshold value was needed in advance
Metals 2018, 8, 811; doi:10.3390/met8100811 www.mdpi.com/journal/metals
Metals 2018, 8, 811 2 of 13
in order to obtain a proper fatigue strength assessment. Lanning et al. [13] investigated the effect ofnotch on high cycle fatigue strength of a Ti-6Al-4V alloy based on the weakest-link model. Bažant andNovák [14] developed a probabilistic nonlocal theory for quasibrittle fracture initiation and specimensize effect, in which the failure probability at a material point was assumed to be a power function ofthe average stress in the neighborhood. Makkonen [15] proposed a method for predicting the statisticalsize effect in the fatigue limit of steels based on the hypothesis that a specimen under cyclic loadingcould form a sample of initial cracks and the larger specimen had the larger sample of initial cracks.Susmel & Taylor [16] extended the critical distance theory for predicting the fatigue life of notchedcomponents in medium cycle fatigue regime. Notably, the results of Härkegård & Halleraker [17]indicated that the Weibull weakest-link method and the highly stressed volume method gave betterpredictions than the Neuber’s and Peterson’s, the peak stress, and the critical distance methods.
In this paper, the effects of specimen geometry and loading condition on the fatigue strength ofmetallic materials are investigated based on the statistical theory and the concept of control volume(i.e., the highly stressed volume). A rotating bending fatigue test is at first performed for the effect ofnotch on the fatigue behavior of a high strength titanium alloy. Then, a method is proposed for theeffects of specimen geometry and loading condition on the fatigue strength based on the statisticaltheory and the concept of control volume. The predicted results are compared with the presentexperimental data and the data in literature. The difference is also discussed for the proposed method,the highly stressed volume method, and the Weibull weakest-link method.
NomenclatureA parameter V volumea parameter VA control volume of specimen AB parameter VB control volume of specimen BF(x) Weibull distribution function VC control volume of referring specimen Ch thickness x depth from the surfacek shape parameter of Weibull distribution χ′ relative stress gradientKt stress concentration factor γ location parameter of Weibull distributionN number of cycles to failure λ scale parameter of Weibull distributionN0 number of cycles at the knee point σ stressNf number of cycles to failure σa stress amplitudeNk number of cycles to failure, k = 1, 2, . . . , n σA fatigue strength of specimen AN′k a given number of cycles to failure σB fatigue strength of specimen Bn number of specimens σC fatigue strength of referring specimen CnA integer part of VA/VC σ(x) maximum principle stress in depth xnB integer part of VB/VC σk fatigue strength, k = 1, 2, . . . , nR stress ratio σ′k fatigue strengthSA control surface of specimen A σmax maximum principle stress at the surfaceSB control surface of specimen B
2. Experimental Material and Method
The material tested is a high strength titanium alloy Ti-6Al-2Sn-2Zr-3Mo-X. The tensile strengthis 1072 MPa, and the yield strength is 978 MPa. Two kinds of specimens are tested, as shown inFigure 1. One is the hourglass specimen, and the other the notch specimen. Before the fatigue test,the surface of the test section is ground and polished to eliminate the machine scratches. The elasticstress concentration factor Kt is obtained by the finite element analysis, which is defined as theratio of the maximum principal stress at the notch root to that of the smallest cross section area insmooth specimen (i.e., nominal stress). The local stress with depth under bending load for both thespecimen types is shown in Figure 2. The relative stress gradient χ′ at the surface is calculated byχ′ = |dσ(x)/dx|/σmax [12,17], where σ(x) denotes the maximum principle stress in depth x from thesurface of the notch root or the smallest cross section of the specimen, and σmax denotes the maximum

Metals 2018, 8, 811 3 of 13
principle stress at the surface. The values of χ′ at the surface for both the specimen types are calculatedfrom a fourth order polynomial fit of the stress σ(x) and the depth x in Figure 2, which are 0.83 mm−1
for the hourglass specimen and 2.01 mm−1 for the notch specimen, respectively.
Metals 2018, 8, x FOR PEER REVIEW 3 of 14
max' d ( ) / d /x x = [12,17], where σ(x) denotes the maximum principle stress in depth x from the
surface of the notch root or the smallest cross section of the specimen, and σmax denotes the maximum
principle stress at the surface. The values of χ′ at the surface for both the specimen types are calculated
from a fourth order polynomial fit of the stress σ(x) and the depth x in Figure 2, which are 0.83 mm−1
for the hourglass specimen and 2.01 mm−1 for the notch specimen, respectively.
Figure 1. Shape and dimension (in mm) of fatigue specimens. (a) Hourglass specimen with Kt = 1.07;
(b) Notch specimen with Kt = 1.43.
Figure 2. Normalized maximum principle stress with depth from the surface of notch root or the
smallest cross section of the specimen.
The fatigue test is conducted on a YRB200 rotating bending machine (Yamamoto Metal Technos
Co., LTD., Osaka, Japan) at room temperature. The frequency is 50 Hz and the stress ratio R is −1. The
fracture surfaces are observed by the JSM-IT300 scanning electron microscope (SEM) (JEOL, Tokyo,
Japan).
3. Experimental Results and Analysis
The stress-life (S-N) data of the two kinds of specimens are shown in Figure 3. It is seen that the
notch has an important influence on the fatigue strength. For the same fatigue life, the notch specimen
endures the higher local stress amplitude than that of the hourglass specimen, as shown in Figure 3b.
This might be due to the fact that the control volume (the region subjected to no less than 90% of the
Figure 1. Shape and dimension (in mm) of fatigue specimens. (a) Hourglass specimen with Kt = 1.07;(b) Notch specimen with Kt = 1.43.
Metals 2018, 8, x FOR PEER REVIEW 3 of 14
max' d ( ) / d /x x = [12,17], where σ(x) denotes the maximum principle stress in depth x from the
surface of the notch root or the smallest cross section of the specimen, and σmax denotes the maximum
principle stress at the surface. The values of χ′ at the surface for both the specimen types are calculated
from a fourth order polynomial fit of the stress σ(x) and the depth x in Figure 2, which are 0.83 mm−1
for the hourglass specimen and 2.01 mm−1 for the notch specimen, respectively.
Figure 1. Shape and dimension (in mm) of fatigue specimens. (a) Hourglass specimen with Kt = 1.07;
(b) Notch specimen with Kt = 1.43.
Figure 2. Normalized maximum principle stress with depth from the surface of notch root or the
smallest cross section of the specimen.
The fatigue test is conducted on a YRB200 rotating bending machine (Yamamoto Metal Technos
Co., LTD., Osaka, Japan) at room temperature. The frequency is 50 Hz and the stress ratio R is −1. The
fracture surfaces are observed by the JSM-IT300 scanning electron microscope (SEM) (JEOL, Tokyo,
Japan).
3. Experimental Results and Analysis
The stress-life (S-N) data of the two kinds of specimens are shown in Figure 3. It is seen that the
notch has an important influence on the fatigue strength. For the same fatigue life, the notch specimen
endures the higher local stress amplitude than that of the hourglass specimen, as shown in Figure 3b.
This might be due to the fact that the control volume (the region subjected to no less than 90% of the
Figure 2. Normalized maximum principle stress with depth from the surface of notch root or thesmallest cross section of the specimen.
The fatigue test is conducted on a YRB200 rotating bending machine (Yamamoto Metal TechnosCo., LTD., Osaka, Japan) at room temperature. The frequency is 50 Hz and the stress ratio R is −1.The fracture surfaces are observed by the JSM-IT300 scanning electron microscope (SEM) (JEOL,Tokyo, Japan).
3. Experimental Results and Analysis
The stress-life (S-N) data of the two kinds of specimens are shown in Figure 3. It is seen that thenotch has an important influence on the fatigue strength. For the same fatigue life, the notch specimenendures the higher local stress amplitude than that of the hourglass specimen, as shown in Figure 3b.This might be due to the fact that the control volume (the region subjected to no less than 90% of themaximum principal stress [17–19] of the specimen) of the notch specimen is relative smaller than thatof the hourglass specimen, which reduces the possibility of fatigue failure of the notch specimens.
Metals 2018, 8, 811 4 of 13
Metals 2018, 8, x FOR PEER REVIEW 4 of 14
maximum principal stress [17–19] of the specimen) of the notch specimen is relative smaller than that
of the hourglass specimen, which reduces the possibility of fatigue failure of the notch specimens.
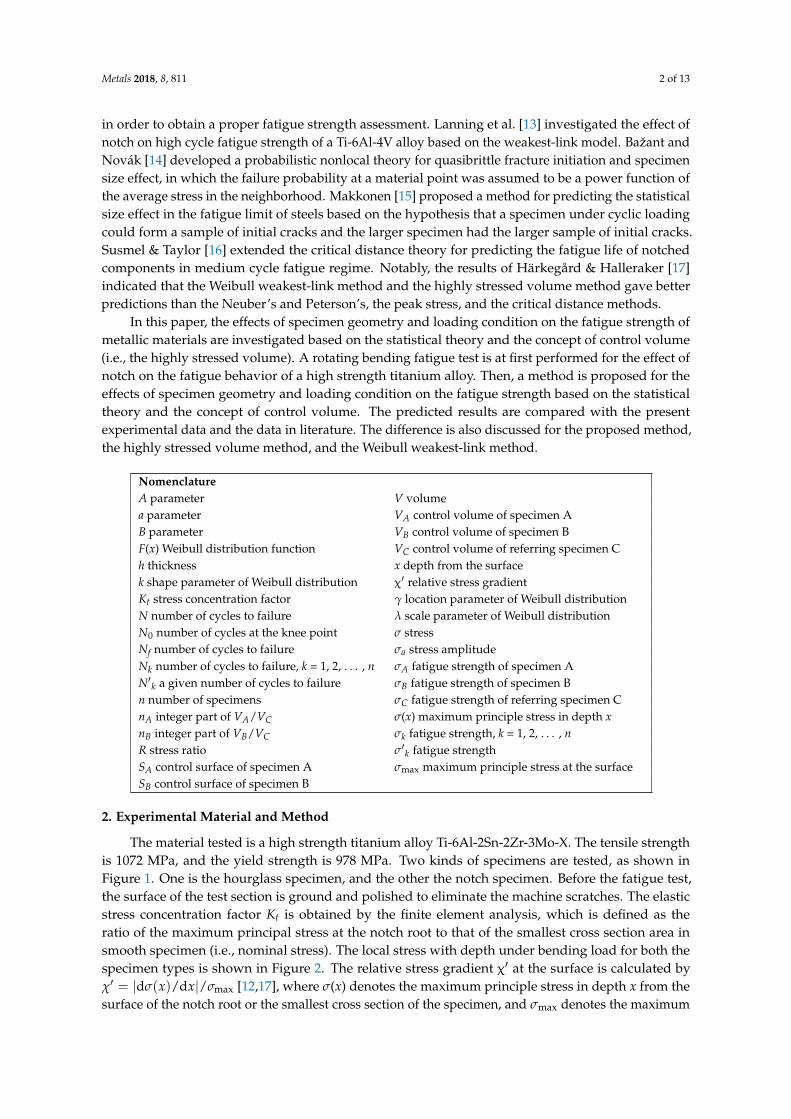
Figure 3. S-N data of hourglass and notch specimens. (a) Nominal stress amplitude versus fatigue life;
(b) Local stress amplitude versus fatigue life, in which the solid curve, dashed curve, and the dot and
dash curve denote the predicted S-N curves at 50%, 5% and 95% survival probabilities, respectively.
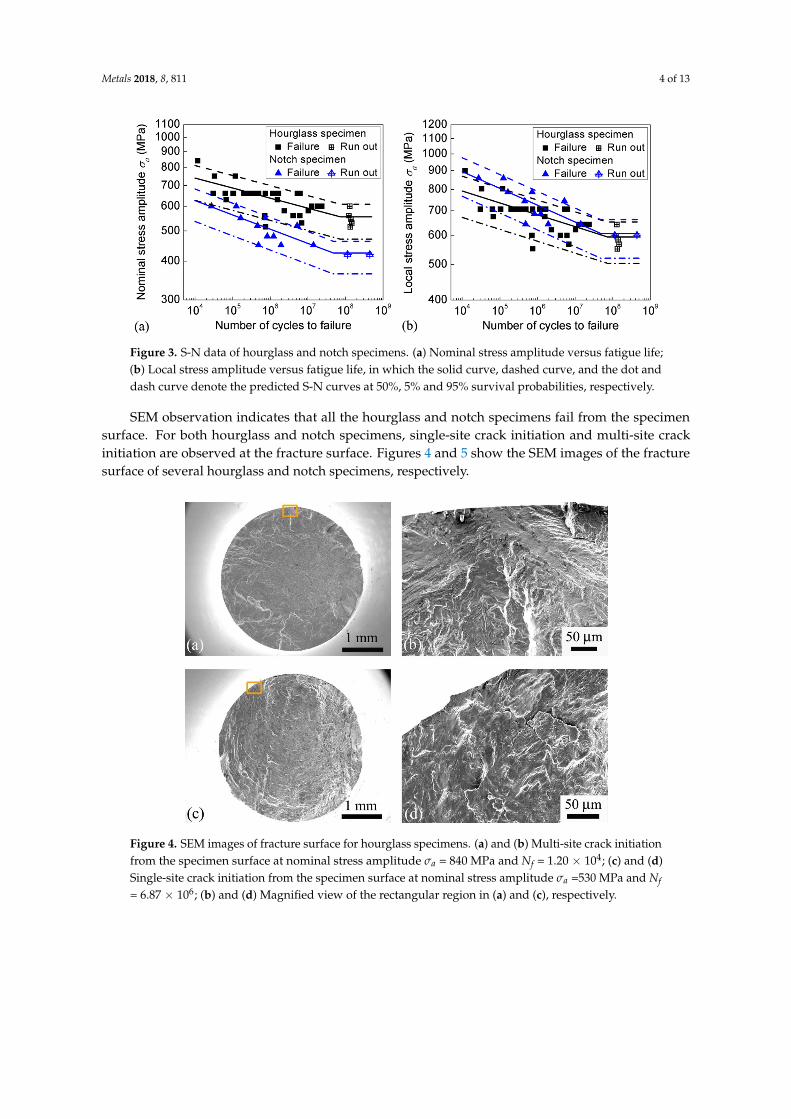
SEM observation indicates that all the hourglass and notch specimens fail from the specimen
surface. For both hourglass and notch specimens, single-site crack initiation and multi-site crack
initiation are observed at the fracture surface. Figures 4 and 5 show the SEM images of the fracture
surface of several hourglass and notch specimens, respectively.
Figure 4. SEM images of fracture surface for hourglass specimens. (a) and (b) Multi-site crack
initiation from the specimen surface at nominal stress amplitude σa = 840 MPa and Nf = 1.20 × 10⁴; (c)
and (d) Single-site crack initiation from the specimen surface at nominal stress amplitude σa =530 MPa
and Nf = 6.87 × 10⁶; (b) and (d) Magnified view of the rectangular region in (a) and (c), respectively.
Figure 3. S-N data of hourglass and notch specimens. (a) Nominal stress amplitude versus fatigue life;(b) Local stress amplitude versus fatigue life, in which the solid curve, dashed curve, and the dot anddash curve denote the predicted S-N curves at 50%, 5% and 95% survival probabilities, respectively.
SEM observation indicates that all the hourglass and notch specimens fail from the specimensurface. For both hourglass and notch specimens, single-site crack initiation and multi-site crackinitiation are observed at the fracture surface. Figures 4 and 5 show the SEM images of the fracturesurface of several hourglass and notch specimens, respectively.
Metals 2018, 8, x FOR PEER REVIEW 4 of 14
maximum principal stress [17–19] of the specimen) of the notch specimen is relative smaller than that
of the hourglass specimen, which reduces the possibility of fatigue failure of the notch specimens.
Figure 3. S-N data of hourglass and notch specimens. (a) Nominal stress amplitude versus fatigue life;
(b) Local stress amplitude versus fatigue life, in which the solid curve, dashed curve, and the dot and
dash curve denote the predicted S-N curves at 50%, 5% and 95% survival probabilities, respectively.
SEM observation indicates that all the hourglass and notch specimens fail from the specimen
surface. For both hourglass and notch specimens, single-site crack initiation and multi-site crack
initiation are observed at the fracture surface. Figures 4 and 5 show the SEM images of the fracture
surface of several hourglass and notch specimens, respectively.
Figure 4. SEM images of fracture surface for hourglass specimens. (a) and (b) Multi-site crack
initiation from the specimen surface at nominal stress amplitude σa = 840 MPa and Nf = 1.20 × 10⁴; (c)
and (d) Single-site crack initiation from the specimen surface at nominal stress amplitude σa =530 MPa
and Nf = 6.87 × 10⁶; (b) and (d) Magnified view of the rectangular region in (a) and (c), respectively.
Figure 4. SEM images of fracture surface for hourglass specimens. (a) and (b) Multi-site crack initiationfrom the specimen surface at nominal stress amplitude σa = 840 MPa and Nf = 1.20 × 10⁴; (c) and (d)Single-site crack initiation from the specimen surface at nominal stress amplitude σa =530 MPa and Nf
= 6.87 × 10⁶; (b) and (d) Magnified view of the rectangular region in (a) and (c), respectively.

Metals 2018, 8, 811 5 of 13
Metals 2018, 8, x FOR PEER REVIEW 5 of 14
Figure 5. SEM images of fracture surface for notch specimens. (a) and (b) Multi-site crack initiation
from the specimen surface at nominal stress amplitude σa = 550 MPa and Nf = 1.64 × 10⁵; (c) and (d)
Single-site crack initiation from the specimen surface at nominal stress amplitude σa = 520 MPa and
Nf = 5.21 × 10⁶; (b) and (d) Magnified view of the rectangular region in (a) and (c), respectively.
4. A Method for Effects of Specimen Geometry and Loading Condition on Fatigue Strength
4.1. Method Construction
Considering that the fatigue crack generally initiates at the weakest spot in the most highly
stressed region (i.e. the control volume) of specimens or components [17,18], it could be assumed that
the fatigue strength is dominated by this stress region. So, a normal specimen A is seen to be
composed of a number of reference specimen Cs with very small control volume under the same
production procedure through control volume and the fatigue strength of specimen A at a certain
fatigue life is taken as the minimum value of the fatigue strength among nA specimen C under the
same fatigue life similar to the Weibull weakest-link method, where nA is an integer part of the ratio
of VA/VC, VA and VC are control volumes for specimen A and specimen C, respectively.
Further, it is assumed that the fatigue strength C of the referring specimen C under a certain
fatigue life follows Weibull distribution, i.e.
1 0( )
0 0
k
C
x
e xF x
x
− −
− =
(1)
where 0 is the scale parameter, 0k is the shape parameter and 0 is the location
parameter.
Thus, the cumulative distribution function of the fatigue strength A for specimen A under the
same fatigue life satisfies
Figure 5. SEM images of fracture surface for notch specimens. (a) and (b) Multi-site crack initiationfrom the specimen surface at nominal stress amplitude σa = 550 MPa and Nf = 1.64 × 10⁵; (c) and (d)Single-site crack initiation from the specimen surface at nominal stress amplitude σa = 520 MPa and Nf
= 5.21 × 10⁶; (b) and (d) Magnified view of the rectangular region in (a) and (c), respectively.
4. A Method for Effects of Specimen Geometry and Loading Condition on Fatigue Strength
4.1. Method Construction
Considering that the fatigue crack generally initiates at the weakest spot in the most highlystressed region (i.e., the control volume) of specimens or components [17,18], it could be assumed thatthe fatigue strength is dominated by this stress region. So, a normal specimen A is seen to be composedof a number of reference specimen Cs with very small control volume under the same productionprocedure through control volume and the fatigue strength of specimen A at a certain fatigue life istaken as the minimum value of the fatigue strength among nA specimen C under the same fatigue lifesimilar to the Weibull weakest-link method, where nA is an integer part of the ratio of VA/VC, VA andVC are control volumes for specimen A and specimen C, respectively.
Further, it is assumed that the fatigue strength σC of the referring specimen C under a certainfatigue life follows Weibull distribution, i.e.,
FσC (x) =
{1− e−(
x−γλ )
kx ≥ 0
0 x < 0(1)
where λ > 0 is the scale parameter, k > 0 is the shape parameter and γ ≥ 0 is the location parameter.Thus, the cumulative distribution function of the fatigue strength σA for specimen A under the
same fatigue life satisfies
FσA(x) = P{σA ≤ x}= P{min{σC,1, σC,2, · · · , σC,nA} ≤ x}= 1− P{σC,1 > x}P{σC,2 > x} · · · P{σC,nA > x}= 1− [1− FσC (x)]nA
=
1− e−( x−γ
λn−1/kA
)k
x ≥ 00 x < 0
(2)

Metals 2018, 8, 811 6 of 13
From Equations (1) and (2), at the same survival probability, we have
1− e−( σA−γ
λn−1/kA
)k
= 1− e−(σC−γ
λ )k
(3)
From Equation (3), the fatigue strength of specimen A and that of specimen C at the same survivalprobability satisfy
σA − γ
σC − γ= n
− 1k
A (4)
Similarly, for the specimen B with control volume VB, the fatigue strength σB and that of thereferring specimen C at the same survival probability satisfy
σB − γ
σC − γ= n
− 1k
B (5)
where nB is an integer part of VB/VC presenting the ratio of the control volume of specimen B to thatof specimen C.
Considering that the control volume of the referring specimen C is assumed to be very small (e.g.,0.1 mm3, 0.01 mm3), we have
nA =VAVC
and nB =VBVC
(6)
From Equations (4)–(6), we have the relation for the fatigue strength of specimens with differentcontrol volumes at the same survival probability, i.e.,
σA − γ
σB − γ=
(VAVB
)− 1k
(7)
For the surface induced fatigue failure, it might be more appropriate to take the critical part ofthe specimen surface (i.e., control surface) with a certain thickness h (e.g., the magnitude of severalgrains) [19]. In this case, Equation (7) becomes
σA − γ
σB − γ=
(SASB
)− 1k
(8)
where SA and SB denote the control surface of specimen A and specimen B, respectively.As a special case, for the two-parameter Weibull distribution, i.e., the location parameter γ = 0,
Equations (7) and (8) change to
σAσB
=
(VAVB
)− 1k
(9)
σAσB
=
(SASB
)− 1k
(10)
4.2. Analysis and Discussion
From Equation (1), the scatter of fatigue strength decreases with decreasing the scale parameter λ
for the same shape parameter k. To predict the fatigue strength of the large specimen through that ofthe small specimen, we have nA > 1, i.e., λnA
−1/k < λ in Equation (2). This indicates that the scatterof the fatigue strength for the large specimen is smaller than that for the small specimen.
Further, Equations (7)–(10) indicate that the effects of specimen geometry and loading conditionon the fatigue strength depend not only the control volume ratio, but also the shape parameter kof Weibull distribution for the fatigue strength. Figure 6 shows the relation between the value of(σA − γ)/(σB − γ) and the ratio of control volume VA/VB described in Equation (7) for different shape

Metals 2018, 8, 811 7 of 13
parameter k. It is seen that the value of (σA − γ)/(σB − γ) decreases with increasing the ratio of controlvolume, i.e., the fatigue strength decreases with the increase of control volume. For the same VA/VB,the value of (σA − γ)/(σB − γ) increases with increasing the shape parameter k, i.e., the decreaseof the fatigue strength is reduced with the increase of the shape parameter k. This suggests that theshape parameter k of Weibull distribution of the fatigue strength reflects the degree of influence ofspecimen geometry and loading condition on the fatigue strength. Figure 6 also indicates that thevalue of (σA − γ)/(σB − γ) tends to zero when the control volume tends to infinity, i.e., the fatiguestrength tends to the minimum value γ in Equation (7). This is in agreement with the fact that fatiguestrength cannot decrease infinitely with the increase of the control volume (specimen size).
Metals 2018, 8, x FOR PEER REVIEW 7 of 14
1
kA A
B B
S
S
−
=
(10)
4.2. Analysis and Discussion
From Equation (1), the scatter of fatigue strength decreases with decreasing the scale parameter
λ for the same shape parameter k. To predict the fatigue strength of the large specimen through that
of the small specimen, we have 1An , i.e. 1/k
An − in Equation (2). This indicates that the scatter
of the fatigue strength for the large specimen is smaller than that for the small specimen.
Further, Equations (7)–(10) indicate that the effects of specimen geometry and loading condition
on the fatigue strength depend not only the control volume ratio, but also the shape parameter k of
Weibull distribution for the fatigue strength. Figure 6 shows the relation between the value of (σA −
γ)/(σB − γ) and the ratio of control volume VA/VB described in Equation (7) for different shape
parameter k. It is seen that the value of (σA − γ)/(σB − γ) decreases with increasing the ratio of control
volume, i.e. the fatigue strength decreases with the increase of control volume. For the same VA/VB,
the value of (σA − γ)/(σB − γ) increases with increasing the shape parameter k, i.e. the decrease of the
fatigue strength is reduced with the increase of the shape parameter k. This suggests that the shape
parameter k of Weibull distribution of the fatigue strength reflects the degree of influence of specimen
geometry and loading condition on the fatigue strength. Figure 6 also indicates that the value of (σA
− γ)/(σB − γ) tends to zero when the control volume tends to infinity, i.e. the fatigue strength tends to
the minimum value γ in Equation (7). This is in agreement with the fact that fatigue strength cannot
decrease infinitely with the increase of the control volume (specimen size).
Figure 6. Value of (σA – γ)/(σB – γ) versus VA/VB in Equation (7) at different shape parameter k.
It is noted that the present formula Equation (9) is of the same form as the highly stressed volume
method derived from the empirical equation [10,11,17]. The difference is that the present formula is
derived based on the statistical theory, and the parameter reflecting the effects of specimen geometry
and loading condition could be obtained as the shape parameter of Weibull distribution of the fatigue
strength of specimens, while for the existing highly stressed volume method, the parameter needs to
be determined by fitting the highly stressed volume and the fatigue strength. The present method is
also different from the Weibull weakest-link method. For the Weibull weakest-link method [4,17,20],
the effective stress amplitude is related to the volume V of a component and the stress distribution in
volume V, which needs to make an integral of the stress in volume V, while for the present method
based on the control volume concept, the effective stress amplitude is related to the value of the
highly stressed volume and the maximum stress [17].
Figure 6. Value of (σA − γ)/(σB − γ) versus VA/VB in Equation (7) at different shape parameter k.
It is noted that the present formula Equation (9) is of the same form as the highly stressed volumemethod derived from the empirical equation [10,11,17]. The difference is that the present formula isderived based on the statistical theory, and the parameter reflecting the effects of specimen geometryand loading condition could be obtained as the shape parameter of Weibull distribution of the fatiguestrength of specimens, while for the existing highly stressed volume method, the parameter needs tobe determined by fitting the highly stressed volume and the fatigue strength. The present method isalso different from the Weibull weakest-link method. For the Weibull weakest-link method [4,17,20],the effective stress amplitude is related to the volume V of a component and the stress distribution involume V, which needs to make an integral of the stress in volume V, while for the present methodbased on the control volume concept, the effective stress amplitude is related to the value of the highlystressed volume and the maximum stress [17].
5. Comparison with Experimental Results
5.1. Probabilistic Stress-Life (P-S-N) Curve Prediction
For the application of the proposed method (probabilistic control volume method), we need todetermine the control volume and the shape parameter of Weibull distribution for the fatigue strengthat first. Usually, the fatigue tests are performed for the specimens at different stress levels, and there arenot enough fatigue strength data at the same fatigue life for statistical analysis. In this case, the bilinearmodel for the S-N curve is considered [21,22], i.e.,
log10 σ =
{a log10 N + A, N < N0
B, N ≥ N0(11)
Metals 2018, 8, 811 8 of 13
where a, A and B are constants, N0 is the number of cycles at the knee point of the curve.Equation (11) could be written as
log10 σ =
{a(log10 N − log10 N0) + B, N < N0
B, N ≥ N0(12)
where the values of a, B and N0 could be obtained by iterative calculation to minimize the value of thefollowing equation
∑Nk<N0
[log10 σk − a log10(Nk/N0)− B]2 + ∑Nk≥N0
(log10 σk − B)2 (13)
where σk is the fatigue strength, Nk is the associated fatigue life, k = 1, 2, . . . , n, and n is the number ofspecimens used for analysis.
By using Equation (12), the fatigue strength σk at an arbitrary fatigue life Nk could be transformedto the fatigue strength σ′k at a given fatigue life N′k, i.e.,
log10 σ′k =
a log10N′kNk
+ log10 σk, Nk < N0
a log10N′kN0
+ log10 σk, Nk ≥ N0for N′k < N0 (14)
or
log10 σ′k =
{a log10
N0Nk
+ log10 σk, Nk < N0
log10 σk, Nk ≥ N0for N′k ≥ N0 (15)
Then, the distribution form of the fatigue strength at different fatigue lifetimes could be analyzedand the P-S-N curve is determined.
5.2. Comparison with Present Experimental Data
A comparison of the predicted P-S-N curves with the present experimental data for the hourglassspecimen and the notch specimen is shown in Figure 3, in which a = −0.0323, B = 2.740 and N0 =7.24 × 10⁷ for the hourglass specimen and a = −0.0458, B = 2.623 and N0 = 4.79 × 10⁷ for the notchspecimen in Figure 3a, a = −0.0323, B = 2.769 and N0 = 7.24 × 10⁷ for the hourglass specimen and a =−0.0458, B = 2.779 and N0 = 4.79 × 10⁷ for the notch specimen in Figure 3b. Here, the two-parameterWeibull distribution is assumed for the fatigue strength. The scale parameter and the shape parameterare obtained via Matlab software version 7.8.0 (MathWorks, Inc., Novi, Michigan, MI, USA). It isseen that the predicted 50% survival probability curve is, in general, in the middle of the scatteredexperimental data, and almost all the experimental data are within the predicted 95% and 5% survivalprobability curves, indicating that the predicted P-S-N curves accord with the experimental data.
Considering that all the specimens fail from the surface for the present titanium alloy, the presentmethod with control surface (i.e., Equation (10)) is used for the effect of notch on the fatigue strength.The control surface is taken as the region subjected to no less than 90% of the maximum principalstress [17–19] and calculated by finite element analysis, which is 18.78 mm2 for the hourglass specimenand 4.49 mm2 for the notch specimen.
Figure 7 shows a comparison of the predicted P-S-N curves with the present experimental datafor the notch specimen by using the fatigue strength data of the hourglass specimen. It is seen that thepredicted P-S-N curves accord with the experimental data.

Metals 2018, 8, 811 9 of 13
Metals 2018, 8, x FOR PEER REVIEW 9 of 14
USA). It is seen that the predicted 50% survival probability curve is, in general, in the middle of the
scattered experimental data, and almost all the experimental data are within the predicted 95% and
5% survival probability curves, indicating that the predicted P-S-N curves accord with the
experimental data.
Considering that all the specimens fail from the surface for the present titanium alloy, the present
method with control surface (i.e. Equation (10)) is used for the effect of notch on the fatigue strength.
The control surface is taken as the region subjected to no less than 90% of the maximum principal
stress [17–19] and calculated by finite element analysis, which is 18.78 mm2 for the hourglass
specimen and 4.49 mm2 for the notch specimen.
Figure 7 shows a comparison of the predicted P-S-N curves with the present experimental data
for the notch specimen by using the fatigue strength data of the hourglass specimen. It is seen that
the predicted P-S-N curves accord with the experimental data.
Figure 7. Comparison of predicted P-S-N curves with present experimental data for the notch
specimen by using the fatigue strength data of the hourglass specimen
5.3. Comparison with Experimental Data of a High Strength Steel
Figure 8 shows the comparison of the predicted P-S-N curves with the experimental data of the
hourglass specimen with Ф 3 mm in the minimum gauge section for a high strength steel JIS-SCM440
under ultrasonic fatigue test in literature [23], in which a = −0.0483, B = 2.895 and N0 = 8.71 × 10⁷. Figure
8 shows a good agreement for the predicted P-S-N curves with the experimental data.
Figure 7. Comparison of predicted P-S-N curves with present experimental data for the notch specimenby using the fatigue strength data of the hourglass specimen.
5.3. Comparison with Experimental Data of a High Strength Steel
Figure 8 shows the comparison of the predicted P-S-N curves with the experimental data of thehourglass specimen with φ 3 mm in the minimum gauge section for a high strength steel JIS-SCM440under ultrasonic fatigue test in literature [23], in which a = −0.0483, B = 2.895 and N0 = 8.71 × 10⁷.Figure 8 shows a good agreement for the predicted P-S-N curves with the experimental data.Metals 2018, 8, x FOR PEER REVIEW 10 of 14
Figure 8. Comparison of predicted P-S-N curves with experimental data for a high strength steel JIS-
SCM440 in literature [23].
The comparison of the predicted P-S-N curves with experimental data for the effect of specimen
size on the fatigue strength is shown in Figure 9, in which the experimental data of the hourglass
specimen with Ф 3 mm in the minimum gauge section is used to predict the fatigue strength of the
hourglass specimen with Ф 7 mm in the minimum gauge section and the dogbone specimen with Ф
8 × 10 mm in straight section. The control volume (the region no less than 90% of the maximum stress)
is used on account of the fact that all the specimens fail from the interior [23], which is 33 mm3 for the
hourglass specimen with Ф 3 mm in the minimum gauge section, 254 mm3 for the hourglass
specimen with Ф 7 mm in the minimum gauge section, and 781 mm3 for the dogbone specimen with
Ф 8 × 10 mm in straight section as given in literature [23]. It is seen in Figure 9 that the predicted P-S-
N curves for the effect of specimen size on the fatigue strength are in good agreement with the
experimental data.
Figure 9. Comparison of predicted P-S-N curves with experimental data in literature [23] by using the
fatigue strength data from the hourglass specimen with Ф 3 mm in the minimum gauge section. (a)
Comparison for the hourglass specimen with Ф 7 mm in the minimum gauge section; (b) Comparison
for the dogbone specimen with Ф 8 × 10 mm in straight section.
5.4. Comparison with Experimental Data of Full Scale Axles
Figure 8. Comparison of predicted P-S-N curves with experimental data for a high strength steelJIS-SCM440 in literature [23].
The comparison of the predicted P-S-N curves with experimental data for the effect of specimensize on the fatigue strength is shown in Figure 9, in which the experimental data of the hourglassspecimen with φ 3 mm in the minimum gauge section is used to predict the fatigue strength of thehourglass specimen with φ 7 mm in the minimum gauge section and the dogbone specimen withφ 8 × 10 mm in straight section. The control volume (the region no less than 90% of the maximumstress) is used on account of the fact that all the specimens fail from the interior [23], which is 33 mm3
for the hourglass specimen with φ 3 mm in the minimum gauge section, 254 mm3 for the hourglassspecimen with φ 7 mm in the minimum gauge section, and 781 mm3 for the dogbone specimen with

Metals 2018, 8, 811 10 of 13
φ 8 × 10 mm in straight section as given in literature [23]. It is seen in Figure 9 that the predictedP-S-N curves for the effect of specimen size on the fatigue strength are in good agreement with theexperimental data.
Metals 2018, 8, x FOR PEER REVIEW 10 of 14
Figure 8. Comparison of predicted P-S-N curves with experimental data for a high strength steel JIS-
SCM440 in literature [23].
The comparison of the predicted P-S-N curves with experimental data for the effect of specimen
size on the fatigue strength is shown in Figure 9, in which the experimental data of the hourglass
specimen with Ф 3 mm in the minimum gauge section is used to predict the fatigue strength of the
hourglass specimen with Ф 7 mm in the minimum gauge section and the dogbone specimen with Ф
8 × 10 mm in straight section. The control volume (the region no less than 90% of the maximum stress)
is used on account of the fact that all the specimens fail from the interior [23], which is 33 mm3 for the
hourglass specimen with Ф 3 mm in the minimum gauge section, 254 mm3 for the hourglass
specimen with Ф 7 mm in the minimum gauge section, and 781 mm3 for the dogbone specimen with
Ф 8 × 10 mm in straight section as given in literature [23]. It is seen in Figure 9 that the predicted P-S-
N curves for the effect of specimen size on the fatigue strength are in good agreement with the
experimental data.
Figure 9. Comparison of predicted P-S-N curves with experimental data in literature [23] by using the
fatigue strength data from the hourglass specimen with Ф 3 mm in the minimum gauge section. (a)
Comparison for the hourglass specimen with Ф 7 mm in the minimum gauge section; (b) Comparison
for the dogbone specimen with Ф 8 × 10 mm in straight section.
5.4. Comparison with Experimental Data of Full Scale Axles
Figure 9. Comparison of predicted P-S-N curves with experimental data in literature [23] by usingthe fatigue strength data from the hourglass specimen with φ 3 mm in the minimum gauge section.(a) Comparison for the hourglass specimen with φ 7 mm in the minimum gauge section; (b) Comparisonfor the dogbone specimen with φ 8 × 10 mm in straight section.
5.4. Comparison with Experimental Data of Full Scale Axles
For a further validation of the proposed probabilistic control volume method, it is used to predictthe fatigue strength of the full scale EA4T axles by using the fatigue strength data tested for smallspecimens in literature.
Figure 10 shows a comparison of the predicted P-S-N curves with the experimental data for thesmall specimen in literature [24], in which a = −0.0487, B = 2.572 and N0 = 1.66 × 10⁶. It is seen that,the predicted 50% survival probability curve is generally in the middle of the scattered experimentaldata, and most of the experimental data are within the predicted 95% and 5% survival probabilitycurves, indicating that the predicted P-S-N curves accord well with the experimental data.
Metals 2018, 8, x FOR PEER REVIEW 11 of 14
For a further validation of the proposed probabilistic control volume method, it is used to predict
the fatigue strength of the full scale EA4T axles by using the fatigue strength data tested for small
specimens in literature.
Figure 10 shows a comparison of the predicted P-S-N curves with the experimental data for the
small specimen in literature [24], in which a = −0.0487, B = 2.572 and N0 = 1.66 × 10⁶. It is seen that, the
predicted 50% survival probability curve is generally in the middle of the scattered experimental
data, and most of the experimental data are within the predicted 95% and 5% survival probability
curves, indicating that the predicted P-S-N curves accord well with the experimental data.
Figure 11 shows the comparison of the predicted P-S-N curves with the experimental data of the
full scale EA4T axles [24] by using the fatigue strength data of the small specimen [24]. Here, the
control surface is considered, which is 9656.84 mm2 for the full scale axle and 227.85 mm2 for the small
specimen. The shape and dimension of the full-scale axle is according to work by Cervello [25], which
has the same transition geometry as drawing A1 and subjects to rotating bending loading type. The
small specimen is according to work by Filippini et al. [26], which has the same test section and
subjects to axial loading. The Young’s modulus is 206 GPa and Poisson’s ratio is 0.29 in the
calculation. It is seen from Figure 11 that the predicted P-S-N curves for the effects of specimen
geometry and loading condition on the fatigue strength accord with the experimental data. In
particular, the predicted fatigue strength at 50% survival probability is 328 MPa, which is in good
agreement with the average free body fatigue strength (limit) 307 MPa of the full scale axle with
standard surface finishing by the stair-case method [25], the relative error of the former to the latter
is 6.8%.
It is noted that for the fatigue failure of materials dominated by the multiple crack propagation
with mutual interactions and coalescences, the large specimen might endure longer crack
propagation life than that of the small specimen [6]. In this case, the present method is invalid for the
effects of specimen geometry and loading condition on the fatigue strength.
Figure 10. Comparison of predicted P-S-N curves with experimental data for the small specimen in
literature [24].
Figure 10. Comparison of predicted P-S-N curves with experimental data for the small specimen inliterature [24].

Metals 2018, 8, 811 11 of 13
Figure 11 shows the comparison of the predicted P-S-N curves with the experimental data ofthe full scale EA4T axles [24] by using the fatigue strength data of the small specimen [24]. Here,the control surface is considered, which is 9656.84 mm2 for the full scale axle and 227.85 mm2 for thesmall specimen. The shape and dimension of the full-scale axle is according to work by Cervello [25],which has the same transition geometry as drawing A1 and subjects to rotating bending loading type.The small specimen is according to work by Filippini et al. [26], which has the same test section andsubjects to axial loading. The Young’s modulus is 206 GPa and Poisson’s ratio is 0.29 in the calculation.It is seen from Figure 11 that the predicted P-S-N curves for the effects of specimen geometry andloading condition on the fatigue strength accord with the experimental data. In particular, the predictedfatigue strength at 50% survival probability is 328 MPa, which is in good agreement with the averagefree body fatigue strength (limit) 307 MPa of the full scale axle with standard surface finishing by thestair-case method [25], the relative error of the former to the latter is 6.8%.Metals 2018, 8, x FOR PEER REVIEW 12 of 14
Figure 11. Comparison of predicted P-S-N curves with experimental data of full scale EA4T axles [24]
by using the fatigue strength data from the small specimen [24].
6. Conclusions
In this paper, the effect of notch on the fatigue behavior of a high strength titanium alloy Ti-6Al-
2Sn-2Zr-3Mo-X is studied at first by rotating bending fatigue test. It indicates that the notch has
important influence on the fatigue strength but no influence on the crack initiation mechanism.
Compared with the hourglass specimen, the notch specimen shows the higher local fatigue strength
at the same fatigue life.
Then, a probabilistic control volume method is developed for the effects of specimen geometry
and loading condition on the fatigue strength based on the statistical theory and the concept of control
volume. By assuming that a normal specimen is seen composed of a number of referring specimens
through control volume and that the fatigue strength of the referring specimen follows Weibull
distribution, a simple formula is obtained for correlating the fatigue strength of specimens with
different control volumes, i.e. (σA − γ)/(σB − γ) = (VA/VB)−1/k, where σ denotes the fatigue strength, V
denotes the control volume (e.g. the region no less than 90% of the maximum principal stress), γ and
k denote the location parameter and shape parameter of Weibull distribution of the fatigue strength,
respectively, and subscripts A and B denote the quantities for specimens A and B, respectively.
The predicted results for the effect of specimen geometry on the fatigue strength accord with the
present experimental data for a titanium alloy Ti-6Al-2Sn-2Zr-3Mo-X and the data for a high strength
steel JIS-SCM440 in literature. The method is further used to predict the fatigue strength of full scale
EA4T axles by using the fatigue strength data tested for small specimens in literature. The predicted
fatigue strength at 50% survival probability is in good agreement with the average fatigue strength
of the full scale axle by the stair-case method, the relative error of which is 6.8%.
The paper also indicates that for the surface induced fatigue failure, it might be appropriate to
use the control surface with a certain thickness in the control volume method, while for the interior
induced fatigue failure, the control volume might be more applicable.
Author Contributions: conceptualization, C.S.; methodology, C.S.; investigation, C.S.; formal analysis, C.S. and
Q.S.; writing—original draft preparation, C.S. and Q.S.; writing—review and editing, C.S. and Q.S.; supervision,
C.S.; funding acquisition, C.S.
Funding: This research was funded by the National Key Research and Development Program of China “Genera
Design, Construction and Sea Trial of Full Ocean Deep Manned Submersible”, grant number 2016YFC0300600
and the Strategic Priority Research Program of the Chinese Academy of Sciences, grant numbers XDB22040503,
XDB22020201, XDB22020200.
Conflicts of Interest: The authors declare no conflict of interest.
Figure 11. Comparison of predicted P-S-N curves with experimental data of full scale EA4T axles [24]by using the fatigue strength data from the small specimen [24].
It is noted that for the fatigue failure of materials dominated by the multiple crack propagationwith mutual interactions and coalescences, the large specimen might endure longer crack propagationlife than that of the small specimen [6]. In this case, the present method is invalid for the effects ofspecimen geometry and loading condition on the fatigue strength.
6. Conclusions
In this paper, the effect of notch on the fatigue behavior of a high strength titanium alloyTi-6Al-2Sn-2Zr-3Mo-X is studied at first by rotating bending fatigue test. It indicates that the notchhas important influence on the fatigue strength but no influence on the crack initiation mechanism.Compared with the hourglass specimen, the notch specimen shows the higher local fatigue strength atthe same fatigue life.
Then, a probabilistic control volume method is developed for the effects of specimen geometryand loading condition on the fatigue strength based on the statistical theory and the concept ofcontrol volume. By assuming that a normal specimen is seen composed of a number of referringspecimens through control volume and that the fatigue strength of the referring specimen followsWeibull distribution, a simple formula is obtained for correlating the fatigue strength of specimens withdifferent control volumes, i.e., (σA − γ)/(σB − γ) = (VA/VB)−1/k, where σ denotes the fatigue strength,V denotes the control volume (e.g., the region no less than 90% of the maximum principal stress), γ and

Metals 2018, 8, 811 12 of 13
k denote the location parameter and shape parameter of Weibull distribution of the fatigue strength,respectively, and subscripts A and B denote the quantities for specimens A and B, respectively.
The predicted results for the effect of specimen geometry on the fatigue strength accord with thepresent experimental data for a titanium alloy Ti-6Al-2Sn-2Zr-3Mo-X and the data for a high strengthsteel JIS-SCM440 in literature. The method is further used to predict the fatigue strength of full scaleEA4T axles by using the fatigue strength data tested for small specimens in literature. The predictedfatigue strength at 50% survival probability is in good agreement with the average fatigue strength ofthe full scale axle by the stair-case method, the relative error of which is 6.8%.
The paper also indicates that for the surface induced fatigue failure, it might be appropriate touse the control surface with a certain thickness in the control volume method, while for the interiorinduced fatigue failure, the control volume might be more applicable.
Author Contributions: Conceptualization, C.S.; methodology, C.S.; investigation, C.S.; formal analysis, C.S. andQ.S.; writing—original draft preparation, C.S. and Q.S.; writing—review and editing, C.S. and Q.S.; supervision,C.S.; funding acquisition, C.S.
Funding: This research was funded by the National Key Research and Development Program of China “GeneraDesign, Construction and Sea Trial of Full Ocean Deep Manned Submersible”, grant number 2016YFC0300600and the Strategic Priority Research Program of the Chinese Academy of Sciences, grant numbers XDB22040503,XDB22020201, XDB22020200.
Conflicts of Interest: The authors declare no conflict of interest.
References
1. Beretta, S.; Ghidini, A.; Lombardo, F. Fracture mechanics and scale effects in the fatigue of railway axles.Eng. Fract. Mech. 2005, 72, 195–208. [CrossRef]
2. Nakajima, M.; Tokaji, K.; Itoga, H.; Shimizu, T. Effect of loading condition on very high cycle fatigue behaviorin a high strength steel. Int. J. Fatigue 2010, 32, 475–480. [CrossRef]
3. Akiniwa, Y.; Miyamoto, N.; Tsuru, H.; Tanaka, K. Notch effect on fatigue strength reduction of bearing steelin the very high cycle regime. Int. J. Fatigue 2006, 28, 1555–1565. [CrossRef]
4. Wormsen, A.; Sjödin, B.; Härkegård, G.; Fjeldstad, A. Non-local stress approach for fatigue assessment basedon weakest-link theory and statistics of extremes. Fatigue Fract. Eng. Mater. Struct. 2007, 30, 1214–1227.[CrossRef]
5. Findley, W.N. Research note: an explanation of size effect in fatigue of metals. J. Mech. Eng. Sci. 1972, 14,424–425. [CrossRef]
6. Zhu, S.P.; Foletti, S.; Beretta, S. Evaluation of size effect on strain-controlled fatigue behavior of a quench andtempered rotor steel: Experimental and numerical study. Mater. Sci. Eng. A 2018, 735, 423–435. [CrossRef]
7. Diemar, A.; Thumser, R.; Bergmann, J.W. Determination of local characteristics for the application of theWeakest-Link Model. Materialwiss. Werkstofftech. 2005, 36, 204–210. [CrossRef]
8. Leitner, M.; Garb, C.; Remes, H.; Stoschka, M. Microporosity and statistical size effect on the fatigue strengthof cast aluminium alloys EN AC-45500 and 46200. Mater. Sci. Eng. A 2017, 707, 567–575. [CrossRef]
9. Furuya, Y. Specimen size effects on gigacycle fatigue properties of high-strength steel under ultrasonicfatigue testing. Scr. Mater. 2008, 58, 1014–1017. [CrossRef]
10. Kuguel, R.A. A relation between theoretical stress concentration factor and fatigue notch factor deducedfrom the concept of highly stressed volume. ASTM Proc. 1961, 61, 732–748.
11. Lin, C.K.; Lee, W.J. Effects of highly stressed volume on fatigue strength of austempered ductile irons.Int. J. Fatigue 1998, 20, 301–307. [CrossRef]
12. Leitner, M.; Vormwald, M.; Remes, H. Statistical size effect on multiaxial fatigue strength of notched steelcomponents. Int. J. Fatigue 2017, 104, 322–333. [CrossRef]
13. Lanning, D.B.; Nicholas, T.; Palazotto, A. HCF notch predictions based on weakest-link failure models.Int. J. Fatigue 2003, 25, 835–841. [CrossRef]
14. Bažant, Z.P.; Novák, D. Probabilistic nonlocal theory for quasibrittle fracture initiation and size effect. I:theory. J. Eng. Mech. 2000, 126, 166–174. [CrossRef]
15. Makkonen, M. Statistical size effect in the fatigue limit of steel. Int. J. Fatigue 2001, 23, 395–402. [CrossRef]

Metals 2018, 8, 811 13 of 13
16. Susmel, L.; Taylor, D. A novel formulation of the theory of critical distances to estimate lifetime of notchedcomponents in the medium-cycle fatigue regime. Fatigue Fract. Eng. Mater. Struct. 2007, 30, 567–581.[CrossRef]
17. Härkegård, G.; Halleraker, G. Assessment of methods for prediction of notch and size effects at the fatiguelimit based on test data by Böhm and Magin. Int. J. Fatigue 2010, 32, 1701–1709. [CrossRef]
18. Murakami, Y. Metal Fatigue: Effects of Small Defects and Nonmetallic Inclusions; Elsevier Science Ltd.: Oxford,UK, 2002; pp. 333–336.
19. Sun, C.; Zhang, X.; Liu, X.; Hong, Y. Effects of specimen size on fatigue life of metallic materials in high-cycleand very-high-cycle fatigue regimes. Fatigue Fract. Eng. Mater. Struct. 2016, 39, 770–779. [CrossRef]
20. Hertel, O.; Vormwald, M. Statistical and geometrical size effects in notched members based on weakest-linkand short-crack modelling. Eng. Fract. Mech. 2012, 95, 72–83. [CrossRef]
21. Hanaki, S.; Yamashita, M.; Uchida, H.; Zako, M. On stochastic evaluation of S–N data based on fatiguestrength distribution. Int. J. Fatigue 2010, 32, 605–609. [CrossRef]
22. Pollak, R.D.; Palazotto, A.N. A comparison of maximum likelihood models for fatigue strengthcharacterization in materials exhibiting a fatigue limit. Probabilist. Eng. Mech. 2009, 24, 236–241. [CrossRef]
23. Furuya, Y. Size effects in gigacycle fatigue of high strength steel under ultrasonic fatigue testing. Procedia Eng.2010, 2, 485–490. [CrossRef]
24. Beretta, S.; Regazzi, D. Probabilistic fatigue assessment for railway axles and derivation of a simple formatfor damage calculations. Int. J. Fatigue 2016, 86, 13–23. [CrossRef]
25. Cervello, S. Fatigue properties of railway axles: New results of full-scale specimens from Euraxles project.Int. J. Fatigue 2016, 86, 2–12. [CrossRef]
26. Filippini, M.; Luke, M.; Varfolomeev, I.; Regazzi, D.; Beretta, S. Fatigue strength assessment of railway axlesconsidering small-scale tests and damage calculations. Procedia Struct. Integrity 2017, 4, 11–18. [CrossRef]
© 2018 by the authors. Licensee MDPI, Basel, Switzerland. This article is an open accessarticle distributed under the terms and conditions of the Creative Commons Attribution(CC BY) license (http://creativecommons.org/licenses/by/4.0/).