geological, soil and rock mass evaluation for risk ... · geological, soil and rock mass ... the...
TRANSCRIPT

265 Middle East Journal of Applied Sciences, 3(4): 265-276, 2013 ISSN: 2077-4613
Corresponding Author: Ahmed. M. Saad, Geology Department, Faculty of Science, Al-Azhar University
Geological, Soil and Rock Mass Evaluation for Risk Assessment of Badr City, Egypt
Ahmed M. Saad Geology Department, Faculty of Science, Al-Azhar University
ABSTRACT
A feasibility study using engineering geology and geotechnical conditions of the rocks and soils to evaluate the different foundation beds for Badr City was done. Before the construction activities start, engi-neering geological and geotechnical investigations has to be carried out remove to establish which zones in the area are suitable for safe and also in order to define the specifications of each region and the best use of it. It aims also at providing an alternative solution for the expected concerned problems of these shallow facies. From these facies clay layer which has an obvious dangerous effect on the building construction and on any other establishments should be determined. The X-ray diffraction reveal that the most predominant minerals are kaolinite, montmorillonite and illite types. The present studies indicated that liquid limit ranges from 49 to 175 %, the plastic limit ranges between 20 and 42 % and the shrinkage limit ranges between 9.88 and 13.3 %. The values of the free swelling of the studied samples are ranging between 98 and 180 %. The swelling pressure ranges from 3 to 6.2 Kg / cm2. Claystone of the study area can be classified as inorganic clay of high and extremely high plastic soil. Key words: Engineering Geology, Liquid Limit, Badr City, Swelling Pressure, Soils.
Introduction Badr City is one of the new cities in Egypt. The city was designed to supply work opportunities and services for over one million habitants. The study area is defined by the following co-ordinates. Latitudes 300630 and 30°0930 N and longitudes 31°41 and 31°45 E .The area is approximately 56. km2 and located at north of Cairo-Suez road between Km 46 and Km 56 from Cairo along this road, and the south of Cairo-Suez railway, and considered as a part of Cairo-Suez district. (Fig.1). It is about 170 to 250 m. above sea level. The Southern part of the area is a wide plain drainged generally into a north to northwest direction by several water trends that start from the south, southwest and southeast. The newly urbanized area north east of the greater Cairo witnessed a vast extension in the urban settlements during the last two decades (Zaki et al., 2011). The engineering features of soil are a function of its moisture content, structure, mineralogical composition and the subsequent stress history. The research work involved a number of fieldworks rock and disturbed soil samples were collected and analyzed for various index and engineering parameters. The laboratory experiments which were carried out on these samples are: grain size analysis (20 samples), Atterberg limits (13 samples), X-Ray analysis to clay minerals (6 samples), free Swell testing (13 samples) and consolidation tests (7 samples). The soil and rock mass of the City were classified on the basis of their engineering behavior according to Unified Soil Classification Systems (USCS) and classification proposed by International Association of Engineering Geologists (IAEG, 1981).
Fig. 1: Location map of Badr City.

266 Middle East J. Appl. Sci.., 4(3): 265-276, 2013
Multi-temporal Landsat imagery (Landsat Thematic Mapper (TM) 1987, Landsat Enhanced Thematic Mapper (ETM) 2000 and Landsat 8 (2012), with a spatial resolution of 30 meters (Fig.2), indicate the rapid urban development in the study area. This necessitates a comprehensive understanding of the geotechnical properties of the foundation beds in the newly developed areas surrounding the Greater Cairo including Badr City.
Fig. 2: Multi-temporal Landsat data showing axes of urban development around Badr City. Experimental Work: Samples were selected thoroughly to cover the different rock types and features present in each area to assist in defining the specifications of the region and propose the best solution or how to treat with its defects program is designed to serve the aim of this research. The laboratory tests were selected to obtain the required physical and mechanical properties of the rocks and soils to evaluate the different foundation beds for Badr City. The tests on rocks include: petrography (5 samples), rock quality designation (R.Q.D) (10 samples) and uniaxial compressive strength (U.C.S) (10 samples) were prepared representing the encountered lithologies. The laboratory experiments which were carried out on soils are: grain size analysis (20 samples), Atterberg limits (13 samples), X-Ray analysis to clay minerals (6 samples), Free Swell testing (13 samples) and consolidation tests (7 samples).

267 Middle East J. Appl. Sci.., 4(3): 265-276, 2013
Three oriented particle amounts were prepared from the pure clay fraction (< 2 µm) and X-rayed for the semi quantitative identification of clay minerals using Phillips X- ray diffractometer, model PW-15018. They were prepared by pipetting of the clay suspension on glass slides. One of these amounts was suggested to X-ray in its original state (untreated). The second were X-rayed after saturation with ethylene glycol (glycolated) and the third after heating at 550˚C for two hours (heated). Geologic Setting: The geology of the study area has been discussed by Sukri et al. (1971). The marine Miocene sedimentary rocks of the area under consideration are covered by younger section of sands gravel's, which are unconformable covered by Pliocene sediments (Fig.3).
Fig. 3: Geological map of the study area after Shukri et al. (1971). Oligocene Deposits: The base of the Oligocene overlies Upper Eocene sediments unconformably. This relation is also known everywhere in the Cairo – Suez district. The Oligocene sediments consist of varicoloured sands and sandstones. The sandstone is medium – hard and even occasionally quartzite. Flint gravels are present, which at the first sight, seem to be concentrated at the upper top of the section. But this concentration is due to removal of the sand matrix by erosion. Evidence of marked solidification is manifested in the presence of solidified wood and quartzite '' dykes ''. The thickness of the Oligocene section could not be measured, firstly because the base is not exposed and secondly, the fact at no dip or strike could be determined owing to the lack of bedding. In some localities between Cairo and Suez, basalt lies on top of the Oligocene sediments and is overlain by the marine Miocene deposits. Miocene Deposits: A: - Marine Miocene: The marine Miocene sediments occupy northern part of the mapped area. These are represented by sandy limestone and limestone with few sandstone, which tend to a pound towards the bottom with some conglomerates. The section is generally yellowish and is rich in – macrofossils. Three main lithologic units were recognized in the marine Miocene section. They are arranged from base to top as the following: Unit "A": This unit ranges in thickness from about 10 m in western part of mapped area to about 25 m in the east. It is generally composed of yellowish brown and is predominantly sandy facies. This unit lies unconformably over the underlying Oligocene gravels. However, the Oligocene Miocene contact is not easily defined at some localities, where it is masked by gravel wash from the Oligocene.

268 Middle East J. Appl. Sci.., 4(3): 265-276, 2013
Unit '' B '': It ranges from about 12 m, in the west to about 28 m in the east. It is generally yellowish and consists mainly of intercalation of sandy limestone, marl and shale. Unit '' C '': This Unit ranges from about 15 m in the west to about 18 m in the east. It is mainly composed of limestone riched in “Oysters”, with the dominant algae. On the other hand, the uppermost beds are formed of yellowish sandy limestone. The marine Miocene shows a marked thickening east direction towards the Gulf of Suez. However, the vertical variation in sedimentation, as evidenced by the occurrence of sandstone intercalation, suggests oscillation of the sea bottom at that time. B: - Non Marine Miocene Deposits: The non-marine Miocene sediments are recorded in the form of sands, grits and gravels. It overlies unconformably by Oligocene sediments (Fig.3). The non-marine Miocene sands are characterized by dark in color than Oligocene one due to high concentration of heavy minerals. The most different foundation beds of Badr City usually sited on limestone bedrocks that have encountered the problem of fracturing or sited on clay which reported construction damage due to swelling process, (Fig. 4).
Fig. 4: Showing some field outcrop of claystone beds (4B, 4C&4D), Sandy limestone bed (4A), Failure of
roads (4E) and water flow under foundation beds (4F. (4F).

269 Middle East J. Appl. Sci.., 4(3): 265-276, 2013
Petrography and Rock Strength: Composite rock is defined as rock mass which constitutes of more than one type of rock in a rock mass (Mohamed, 2004) Most of these rock masses are of sedimentary to meta-sedimentary formations and the geological sedimentation process produced an interbedded profile of different rocks, one being weaker than the other. To accomplish this study more than 10 thin sections were prepared representing the encountered lithologies. The uniaxial compressive strength (U.C.S) of the different facies were determined and the samples were prepared according to (ISRM, 2007). The petrographical analysis of Badr City indicated the presence of five carbonates microfacies association. These are as follows: Sandy Algal Dolo Biomicrosparite (Packstone): This microfacies consists of fine to coarse, sub-angular to subrounded detrital quartz grains (30 – 40%), Algae shell fragments (15%) commonly scattered throughout a mosaic, dolomitic matrix. The amount of the dolomite crystals varies from place to place ranging in size from microcrystalline to mesocrystalline dolomite. The dolomite crystals of both sizes are euhedral to subhedral and rhombic (Fig.5A&5B). The material strength was estimated in the field (R.Q.D) and laboratory (U.C.S). The rock quality values of these facies ranging between 10 -15 % and the unconfined compressive strength ranging between 20 – 27 Kg /cm2. Sandy Dolomitized Biomicrite (Packstone): Sandy dolomitized biomicrite microfacies consist of detrital quartz (30%) with shell fragments embedded in microcrystalline calcareous matrix. The quartz grains are coarse to medium grained, most grains are monocrystalline partially polycrystalline with normal and wave extinction, few grains are elongated shape, moderately sorted to illsorted and some quartz grains are fractured due to pressure (Fig.5C&5D). The rock quality values of these facies ranging between 15-25 % and the unconfined compressive strength ranging between 40 – 95 Kg / cm2.
Fig. 5: Photomicrograph showing Sandy Algal Dolo Biomicrosparite 5A&5B, Sandy Dolomitized Biomicrite 5C&5D
270 Middle East J. Appl. Sci.., 4(3): 265-276, 2013
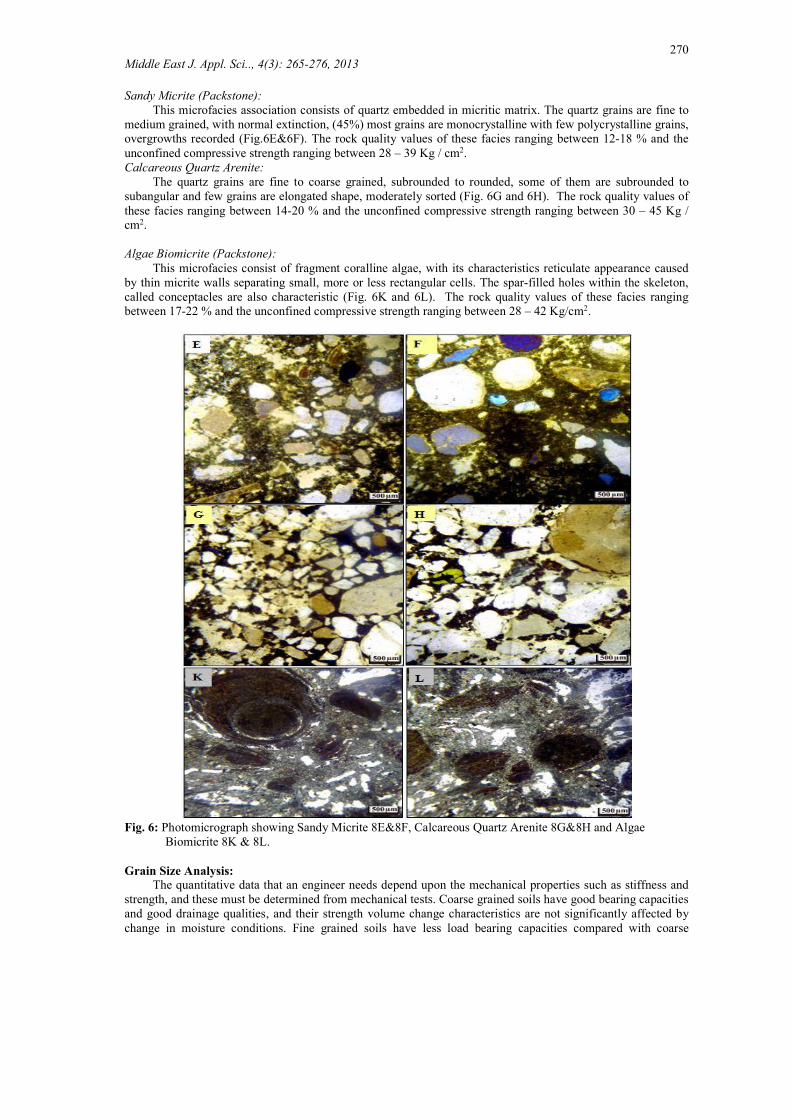
Sandy Micrite (Packstone): This microfacies association consists of quartz embedded in micritic matrix. The quartz grains are fine to medium grained, with normal extinction, (45%) most grains are monocrystalline with few polycrystalline grains, overgrowths recorded (Fig.6E&6F). The rock quality values of these facies ranging between 12-18 % and the unconfined compressive strength ranging between 28 – 39 Kg / cm2. Calcareous Quartz Arenite: The quartz grains are fine to coarse grained, subrounded to rounded, some of them are subrounded to subangular and few grains are elongated shape, moderately sorted (Fig. 6G and 6H). The rock quality values of these facies ranging between 14-20 % and the unconfined compressive strength ranging between 30 – 45 Kg / cm2. Algae Biomicrite (Packstone): This microfacies consist of fragment coralline algae, with its characteristics reticulate appearance caused by thin micrite walls separating small, more or less rectangular cells. The spar-filled holes within the skeleton, called conceptacles are also characteristic (Fig. 6K and 6L). The rock quality values of these facies ranging between 17-22 % and the unconfined compressive strength ranging between 28 – 42 Kg/cm2.
Fig. 6: Photomicrograph showing Sandy Micrite 8E&8F, Calcareous Quartz Arenite 8G&8H and Algae Biomicrite 8K & 8L. Grain Size Analysis: The quantitative data that an engineer needs depend upon the mechanical properties such as stiffness and strength, and these must be determined from mechanical tests. Coarse grained soils have good bearing capacities and good drainage qualities, and their strength volume change characteristics are not significantly affected by change in moisture conditions. Fine grained soils have less load bearing capacities compared with coarse

271 Middle East J. Appl. Sci.., 4(3): 265-276, 2013
grained. The results of the mechanical analysis are tabulated in table (1) and the data are represented in cumulative curves (Fig. 7). Table 1: Grain size data of the studied samples at Badr City.
Mathematical Values Use as Principle for Classification of Soil
Weight Retained
Sam
ple
No.
S.C
S.K
K.C
U.C
C.C
D60
D50
D30
D25
D10
< 0
.063
0.12
5 -0
.063
0.25
-0.
125
0.5
- 0.
25
1 -
0.5
2 –
1
4-
2
1.64 1.57 0.19 4.28 1.1 1.2 0.85 0.61 0.55 0.28 1.4 7.3 11.3 37.4 21.6 15.9 5.1 1.1
3.16 2.14 0.27 5.18 0.6 0.83 0.54 0.28 0.25 0.16 4.8 23.2 19.5 15.2 10.3 18.4 8.6 2.1
1.76 1.03 0.27 3.68 1.17 0.92 0.78 0.52 0.45 0.25 2.4 7.6 17.1 35.6 27.4 7.1 2.9 3.1
1.71 1.09 0.17 4.37 1.03 1.4 1.0 0.68 0.61 0.32 3.2 4.3 9/2 33.5 28 19.7 2.1 4.1
1.64 0.79 0.27 5.9 1.14 2.95 2.4 1.3 1.3 0.5 2.1 3.1 4.7 9.1 21.1 49.5 10.4 7.1
1.36 0.90 0.24 5.72 2.95 3.55 3.3 2.55 2.3 0.62 1.1 2.2 5 4.3 8.4 64.3 14.7 11.1
1.53 0.73 0.19 3.29 2.42 0.28 0.34 0.24 0.19 0.08 18.7 12.6 45.7 16.1 4.9 0.8 0.2 13.1
2.09 0.96 0.22 2.93 0.73 0.22 0.17 0.11 0.08 0.07 37.7 27.3 19.5 8.4 4.1 2.2 0.8 14.1
3.05 0.74 0.30 10.6 0.49 1.8 1.1 0.39 0.31 0.17 4.0 15.1 17.3 13.2 13.5 28.1 8.9 15.1
2.31 1.26 0.20 5.33 0.75 0.48 0.33 0.18 0.16 0.09 18.7 22.1 20.2 15.0 17.7 8.1 0.3 16.1
2.14 0.76 0.25 12.6 2.35 1.9 1.6 0.82 0.65 0.15 2.5 7.1 10.4 15.3 25.1 29.7 10.1 20.1
1.93 1.53 0.16 3.77 1.05 0.34 0.25 0.18 0.16 0.09 15.8 35.0 21.1 13.9 9.8 3.1 2.1 21.1
1.87 1.30 0.14 2.42 0.75 0.17 0.14 0.09 0.08 0.07 47.9 21.8 17,8 9.4 3.1 0.0 0.0 22.1
3.07 0.45 0.33 14 0.73 2.1 1.6 0.48 0.35 0.15 7.9 10.1 13.2 11.2 15.9 31.7 9.9 23.1
1.63 0.66 0.29 3.78 0.49 1.4 1.2 0.7 0.6 0.37 1.7 1.2 13.6 30.5 41.5 8.2 2.42 24.1
1.58 1.08 0.28 2.73 1.01 0.95 0.85 0.62 0.56 0.4 1.2 1.1 15.9 41.5 31.9 6.1 3.5 25.1
1.73 0.63 0.26 4.37 0.94 1.4 1.2 0.65 0.55 0.32 2.4 1.6 18.1 22.1 41.2 12.8 1.8 26.1
1.22 0.98 0.1 1.53 0.92 0.4 0.37 0.31 0.3 0.26 1.6 1.7 80.1 6.3 4.2 3.7 1.8 27.1
2.40 1.51 0.26 6.12 0.42 1.9 0.88 0.5 0.45 0.31 1.5 1.3 26.3 24.4 27.6 11.8 7.1 28.1
1.65 0.62 0.2 5.13 0.73 1.5 1.3 0.72 0.62 0.37 0.6 0.7 17.5 23.1 39.7 14.9 3.5 29.1
Abbreviations C.C = Coefficient of Curvature U.C = Uniformity of Coefficient K.C = Kurtosis of Coefficient S.C = Sorting Coefficient SK.C = Skweness of Coefficient
Fig. 7: Grain size distribution curves of studied area (4A, 4B, 4C, 4d and 4E).
272 Middle East J. Appl. Sci.., 4(3): 265-276, 2013
Parameters Obtained from Grain Size Distribution Curve: 1- Uniformity Coefficient U.C (measure of the particle size range) U.C is also called Hazen Coefficient
U.C = D60/D10 U.C < 5 --Very Uniform, U.C = 5 -- Medium Uniform, U.C >5 --No uniform 2- Coefficient of Gradation or Coefficient of Curvature C.C (Measure of the shape of the particle size curve) C.C = (D30)2 / D60 x D10 C.C from 1 to 3 --- well graded 3- Coefficient of Permeability = C.k (D10)2 m/sec
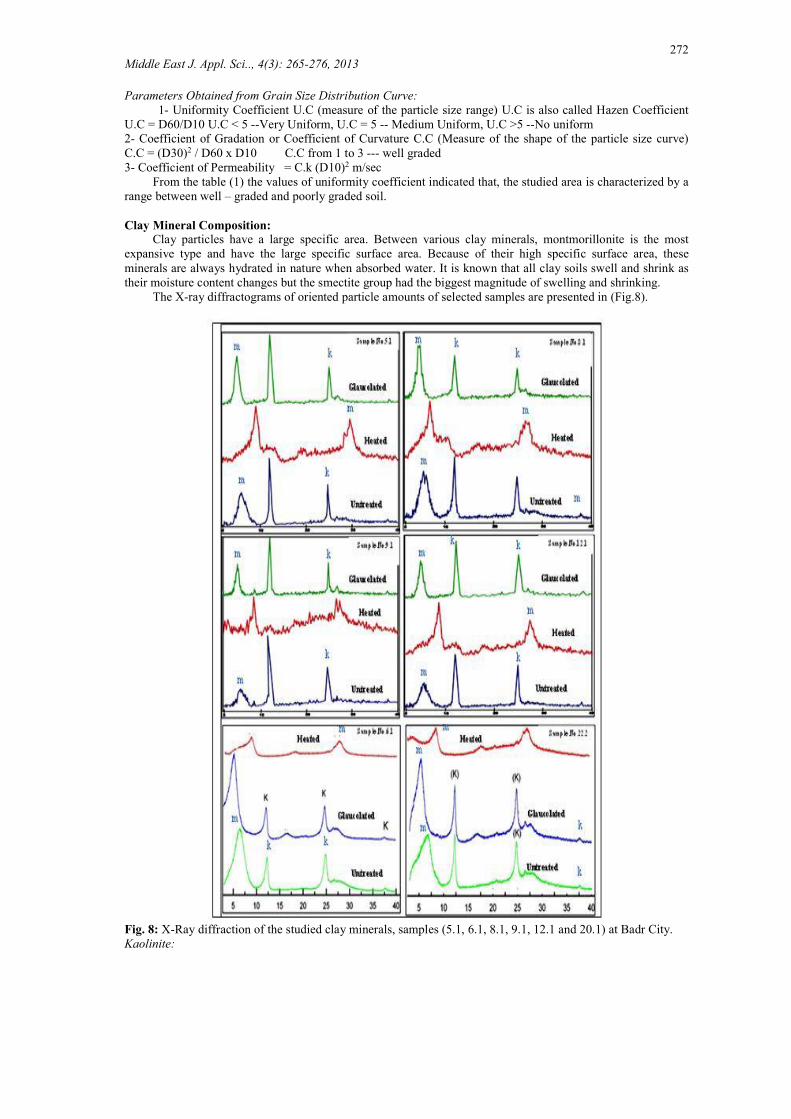
From the table (1) the values of uniformity coefficient indicated that, the studied area is characterized by a range between well – graded and poorly graded soil. Clay Mineral Composition: Clay particles have a large specific area. Between various clay minerals, montmorillonite is the most expansive type and have the large specific surface area. Because of their high specific surface area, these minerals are always hydrated in nature when absorbed water. It is known that all clay soils swell and shrink as their moisture content changes but the smectite group had the biggest magnitude of swelling and shrinking. The X-ray diffractograms of oriented particle amounts of selected samples are presented in (Fig.8).
Fig. 8: X-Ray diffraction of the studied clay minerals, samples (5.1, 6.1, 8.1, 9.1, 12.1 and 20.1) at Badr City. Kaolinite:

273 Middle East J. Appl. Sci.., 4(3): 265-276, 2013
Kaolinite, Al4 Si4O10 (OH) 8 is composed of a single tetrahedral and a single Alumina octahedral sheet
combined in units. Kaolinite is the most predominant mineral of abundance in the studied clay samples (63.92%). Montmorillonite: It is the most common mineral of the montmorillonite group, which has important base exchange properties and is built up of 3 layer units comprising two Silicon layer separated by an Aluminum layer. The montmorillonite is the second mineral in the studied samples (29.38 %). Illite: Illite is characterized by a series of weak broad peaks of lines 9.9A, 4.44A and 3.35A that are not appreciable affected by glycolation or heat treatment. It is similar in many respects to white mica, but has less potassium and more water in its composition. It has a much lower base exchange capacity than smectite. Illite consists of repeated layers of one alumina sheet sandwiched by two silicate sheets. Illite is the third mineral in the studied samples (6.7 %). Geotechnical Properties of Clay: The majority of laboratory tests on clays are: initial water content, specific gravity, atterberg limits, consistency indices, chemical analysis and swelling pressure. Atterberg Limits of Fine Soil: Atterberg limits are empirically developed but widely used procedures for establishing and describing the consistency of soil. The engineering properties (uses) of fine grained soils are, generally, related to these index properties. The more plastic a soil means the more compressible, higher shrinkage-swell potential and the lower is its permeability will be (Abramson et al., 1996). Plastic index is important in classifying fine-grained soils and is fundamental to the Casagrande plasticity chart. Liquid Limit (L.L): The results of the liquid limit of studied samples are given in Table (2). Results of the liquid limit range between 49 to 175 %. Plastic Limit (P.L.): The results of the plastic limit of studied samples are given in Table (2).The values of the plastic limit range between 20 to 42%. Shrinkage Limit (S.L.): The results of this test are given in Table (2).The values of this limit range between 9.88 to 13.3%. Table 2: Atterberg limits of the studied claystone samples.
Sample No. Specific
Gravity(GS) Liquid Limit
(L.L.) Plastic limit (P.L.)
Plasticity Index
Free Swell Shrinkage
Limit(S.L.) 5.1 2.08 104 33 71 160 12.7 6.1 2.66 120 42 78 170 13.11 7.2 2.31 84 32 52 100 13.3 8.1 2.66 49 20 29 110 12.08 9.1 2.13 75 27 48 180 11.13
12.1 1.79 175 37 138 120 10.75 13.2 2.14 96 29 67 95 11.7 14.2 2.17 102 28 74 130 12.3 15.2 2.11 104 30 74 135 10.45 18.1 2.15 109 30 79 140 11.17 20.2 2.29 71 28 43 107 9.88 22.2 2.02 84 28 56 98 10.7 23.2 2.12 88 29 59 110 11.11
Swelling Potential of Clays: Expansive soil can be identified either indirectly or directly in the laboratory. Indirect Identification of Expansive Soil: The indirect methods include mineralogical analysis free swell, colloid content, plasticity index and activity. Clay mineralogy is also the dominant factor in controlling the plasticity of clay soil. Based on the X-ray diffraction examination clay mineralogical are kaolinite, montmorillonite and illite. The free swell tests consists of placing a known volume of dry soil in water and noting the swelled volume after the material settles, without

274 Middle East J. Appl. Sci.., 4(3): 265-276, 2013
any surcharge to the bottom of a graduated cylinder. The difference between the final and initial volume, expressed as a percentage of initial volume is the free swell value. According to Bell (1983), soils having free swell value as high as 100% can cause considerable damage to lightly loaded structures, and soils having free swell value below 50% seldom exhibit appreciable volume change even under very light loadings. The values of the free swelling of the studied samples are given in Table 2 and range between 98 to 180 %. All samples have free swell of greater 50%. Hence, considerable attention should be given in foundation design even for light structures on such soils because their value shows expansiveness property. Direct Identification of Expansive Soil: The direct methods for the identification of expansive soils are more reliable and depend on the use of several types of swelling apparatus (Ohri, (2003). The swelling pressure values of the selected examined samples determined from this test are given in Table 3. The final swelling percentage is drawn versus the vertical applied pressure, as shown in (Figs 9 and 10). The results of swelling pressure differentiated because of clay type, for example sample No. (8.1) by using X-ray analysis, the percentage of montomorollonite increased. It is swell pressure equal 6.2 Kg/cm2. While the sample No. (22.2) consists of kaolinite and illite with low montomorollonite. It is swell pressure equal 3 Kg/cm2. Table 3: Swelling pressure Values of some Claystone Samples Obtained by Oedometer Test.
Sample No. Mineralogical Composition Swelling pressure kg/cm2 5.1 Kaolinite and Montmorilonite 4.4 6.1 Kaolinite and Montmorilonite 4.9 8.1 Kaolinite and Montmorilonite 6.2 9.1 Kaolinite, Montmorilonite and illite 3.1
12.1 Kaolinite and Montmorilonite 5.5 22.2 Kaolinite and illite 3 23.2 Kaolinite and illite 3.4
Fig. 9: Relationship between swelling percent and applied pressure (sample No. 5.1). Classification of Engineering Properties of Soil: Approximate assessment of the engineering properties of soils can be obtained from the index properties after appropriate classification is made. From geotechnical or engineering geological point of view, the classification of soil may be done with the objective of finding the suitability of the soil for construction or foundations. By using plasticity chart according to Casagrand, (1948) (Fig.11) shows the claystone of study area can be classified as inorganic clay of high and extremely high plastic soil.

275 Middle East J. Appl. Sci.., 4(3): 265-276, 2013
Fig. 10: Relationship between swelling percent and applied pressure (Samples No. 6.1, 8.1, 9.1, 12.1, 22.1 and 23.2).
Fig. 11: Shows that, the claystones of study area can be classified as inorganic clay of very high to extremely high plastic soil.
276 Middle East J. Appl. Sci.., 4(3): 265-276, 2013
Conclusion Sedimentological studies of Badr City dealt with grain-size analysis, X-ray diffraction and thin section studies. The results of grain size analysis proved that, the studied area is characterized by a range between well – graded and poorly graded soil. The distribution curves are generally of fine to coarse skewed and leptokurtic to mesokurtic. The petrographical analysis of Badr City indicated the presence of five carbonates microfacies association (sandy algal dolo biomicrosparite, sandy dolomitized biomicrite, sandy micrite, calcareous quartz arenite and - algae biomicrite).The claystone mainly consists of kaolinite, montmorillonite and illite types and classified as inorganic clay of high and extremely high plastic soil.
Recommendations The different foundation beds of Badr City from the foundation point of view divided into four types (sandy soil, sand and gravels soil, clay soil and rocky soil (sandstone or sandy limestone). The first and second types of soil are suitable for direct foundation above them, because they have got high foundation strength. The third type is not allowed to direct foundation on it because of its high swelling properties. Moreover, expansive soils in the City were found to cause failure of roads and buildings. It is very necessary to remove and should be replaced by a soil of clean sand taken from another spots to be distributed under the foundation. The fourth type of soil is suitable for direct foundation that and it is necessary to be sure that there are no fractures of clays. In case the thickness of the rock above the clay bed equal three times or more the thickness of clay bed, it is recommended to establish foundation on it. But if the thickness of rock less than three the thickness of clay bed should be treated for clay bed before foundation on it.
References Abramson, L.W., J.S. Lee, S. Sharma, G.M. Boyce, 1996. Slope Stability and Stabilization Methods. John
Wiley and Sons, Inc., New York, 629. Bell, F.G., 1983. Fundamentals of Engineering Geology. Butterworth and Co. Ltd., London, 648. Bell, F.G., 2000. Engineering Properties of Soils and Rocks, 4th Ed., Blackwell Science, Oxford, 482. Brown (Ed.), ISRM Suggested Methods. Pergamon Press, Oxford, 113–116, 135–140. Casagrande, A., 1948. Classification and Identification of Soils, Am. Soc. Civ. Civ. Eng. Trans, 113: 901-930. IAEG, 1981. Rock and Soil Description and Classification for Engineering Geological Mapping: Report by
IAEG Commission on Engineering Geological Mapping. Bull. Int. Assoc. Eng. Geol., 24: 235-274. ISRM, 2007. The Complete ISRM Suggested Methods for Rock Characterization Testing and Monitoring:
1974-2006. In: Ulusay, Hudson (Eds.) Suggested Methods Prepared by the Commission Testing Methods, Int. Soc. Rock Mech. ISRM Turkish National Group, Turkey. p.628.
Mohamed, Z., A.G. Rafeek and I. Komoo, 2006. Laboratory Design Assessment of Weak Rocks. Al-Jazari International Journal of Civil Engineering, FEC, UiTM, 1(1): 47- 58.
Ohri, M.L., 2003. Swelling Pressure of Clays and Its Control. International Conference on Problematic Soils, Nottingham, United Kingdom, 427-433.
Rafat Zaki, Abotalib Zaki and Saad Ahmed, 2011. Land Use and Land Cover Changes in Arid Region: The Case New Urbanized Zone, Northeast Cairo, Egypt. Journal of Geographic Information System, 3.173-194.
Shukri, N.M., M.K. El Ayouty and M.B. Marcos, 1971. Geology of Dar El Baida, Cairo-Suez District, Annuals of the Geophysics Survey of Egypt, 1: 44-51.