geographic erences entially preve re ss es in rural and s preventable readmissions in three types of...
TRANSCRIPT
G eographic Differences in Potentially Preventable Readmission Rates in Rural and Urban Hospitals Marilyn G. Klug, PhD Alana Knudson, PhD Kyle Muus, PhD Center for Rural Health The University of North Dakota November 2010 Support for this report was provided by the Office of Rural Health Policy, Health Resources and Services Administration, PHS Grant No. 5U1CRH03717.

Upper M idwest Rural H ealth Research Center F inal Report #12
Acknowledgements
The authors would like to acknowledge the representatives of the following organizations who provided valuable input to this study: Faith M. Asper, MHS, Research Data Assistance Center, who provided us with invaluable assistance in identifying providers as PPS or CAH in the MedPAR Data set; and Nicole Pape, Center for Rural Health, UND, for her assistance in graphic design.

Upper M idwest Rural H ealth Research Center F inal Report #12
i
Table of Contents
Executive Summary .....................................................................................................................ii Introduction and Purpose of the Study.........................................................................................1 Methods........................................................................................................................................2 Results ..........................................................................................................................................4 Conclusions ................................................................................................................................19 References ..................................................................................................................................22 Appendices Appendix A: 3M Potentially Preventable Readmission (PPR) Software ......................27 Appendix B: General Demographics of Hospitals Treating Patients
with 30-Day PPRs ....................................................................................28 Appendix C: Average Severity Scores of Urban PPS, Rural PPS, and
CAH Hospitals with 30-, 60-, and 90-Day PPRs by Division .................32 Appendix D: Severity-Adjusted Average Hospital 60- and 90-Day PPR Rates
for Urban PPS, Rural PPS and CAH Hospitals by Division....................36

Upper M idwest Rural H ealth Research Center F inal Report #12
ii
Executive Summary Introduction and Purpose of the Study Potentially preventable hospital readmissions (PPRs) among Medicare patients are examples of inefficiencies in the health care system. Policymakers are considering efforts to measure and publicly report preventable readmission rates and target hospitals with high rates for improvement by means of payment policy and technical assistance. To help inform the policy debate about readmissions of rural patients, this study estimated PPRs in three types of acute care hospitals: urban prospective payment system (PPS) hospitals, rural PPS hospitals and Critical Access Hospitals (CAHs). The study sought to answer two specific questions:
Are the adjusted-PPR rates of rural PPS hospitals and CAHs significantly different from the rates of urban PPS hospitals?
Do differences in demographics or severity of patients in these hospitals affect the PPR
rates? M ethods This study estimates Medicare readmission rates in rural and urban U.S. acute-care hospitals for each of four common health conditions. Medicare Provider Analysis and Review (MedPAR) data from the years 2004 2007 were analyzed. We used 3M Potentially Preventable
admissions. The initial hospitals where patients were admitted were grouped into three categories: urban Prospective Payment System (PPS) hospitals, rural PPS hospitals, and Critical Access Hospitals (CAHs), and by U.S. census divisions. Readmission rates, adjusted for illness severity, were calculated at 30-, 60-, and 90-day periods for each of the four most common diseases treated in rural hospitals: congestive heart failure (CHF), bacterial pneumonia, chronic obstructive pulmonary disease (COPD), and kidney or urinary tract infection (KI/UTI). Results Significant differences in readmission rates were found between PPS hospitals, CAHs, and urban PPS hospitals, both nationwide and within census divisions. However, these differences varied by disease and division. Moreover, in instances where rural PPS hospitals had significantly higher or lower rates than urban hospitals within a census division, CAHs often did not have similar differences. Overall, adjusted CAH rates were significantly lower than urban rates for three of the four diseases (for KI/UTI, the exception, CAH rates were significantly higher). National rural PPS rates did not differ significantly from urban PPS rates at 30 days, although differences in pneumonia and KI/UTI appeared with longer time frames. Both national and regional (census division) disease-specific PPRs vary. National CHF and COPD readmission rates are consistently higher than pneumonia and KI/UTI rates. The

Upper M idwest Rural H ealth Research Center F inal Report #12
iii
variation within a disease across census division is remarkable. For example, the South Atlantic PPR rate for COPD readmissions exceeds 200 per 1,000; in contrast, the Pacific rate is under 120 (both 30-day, severity-adjusted). Nationally, rural PPS hospital rates varied little from urban rates; however, every census division had at least one disease-specific rural PPS rate that varied significantly from urban rates. National readmission rates for CAHs were lower than rural or urban PPS hospital rates for CHF, pneumonia, and COPD. CAHs displayed considerable regional variation by disease: more than half of the census divisions had statistically significant variation (high or low) in CAH readmissions for pneumonia, COPD, and KI/UTI. The absolute differences in PPR rates between urban hospitals, rural PPS hospitals, and CAHs became more pronounced as the discharge-to-readmission time interval increased from 30 days to 90 days. However, the pattern of differences was usually the same for diseases and divisions regardless of the time to readmission. Our major finding was that location clearly influences readmission rates among hospital types and across diseases. In the New England, Middle Atlantic, East North Central and Pacific divisions, rural PPS hospitals and CAHs usually had significantly lower readmission rates than urban hospitals. In contrast, most rural PPS and CAH readmission rates were significantly higher than urban rates in the southern areas of the country (i.e., East South Central and West South Central divisions) and in the Mountain Division. Only the West North Central Division had rural readmission rates that were consistently similar to urban rates. Conclusions Though we found that analyzing potentially preventable readmission rates across different lengths of time to readmission (30, 60, and 90 days) did not alter results greatly, separating rural PPS hospitals and CAHs from urban PPS hospitals and grouping hospitals by census division definitely contribute toward developing a more complete picture of Medicare readmissions for the four health conditions included in this study. Our analyses demonstrated that grouping rural and urban hospitals together in readmission studies can mask important variations. Our study also documented the importance of looking separately at rural PPS hospitals and CAHs, since their PPR rates can vary significantly from each other by disease and region. A more useful approach would be to examine severity-adjusted rates by type of hospital and by region (census division, state, or other geographic area). That combination will provide the fullest picture and, potentially, a baseline against which the impact of future PPR improvement efforts can be assessed. The health disparities among southern Medicare patients (especially in the East South Central and West South Central divisions) merit additional research to examine how the relatively high readmission rates for rural PPS hospitals and CAHs can be improved. Likewise, it could also be beneficial to examine rural PPS hospitals and CAHs in the northeastern areas (Mid-Atlantic and New England) and in the west (Pacific), to determine whether in-hospital care, out-of-hospital care, or other controllable factors may contribute to the relatively low readmission rates in those areas.
Upper M idwest Rural H ealth Research Center F inal Report #12
1
Introduction Current health care reform efforts seek to decrease the costs of care and increase efficiencies (White House, 2009). These goals can be achieved in part through removing waste and improving quality and efficiency in the health care system, including Medicare. Potentially preventable hospital readmissions among Medicare patients are examples of such inefficiencies and are currently targeted for closer examination and scrutiny across the country (Benbassat and Taragin, 2000; Goldfield et al., 2008). Hospital readmissions may indicate one or a combination of factors: poor in-hospital care, insufficient discharge planning, uncoordinated transition care or inadequate post-discharge and follow-up care or both (Marcantonio et al., 1999; McAlister, Lawson, Teo, and Armstrong, 2001; Hunt, Baker, Chin, et al., 2002; Medicare Payment Advisory Commission [MedPAC], 2007). A national 30-day Medicare hospital readmission rate of 17.6% was reported in 2007, using 2005 data; 76% of those readmissions were identified as potentially preventable (MedPAC 2007). Thus potentially preventable readmissions (PPRs) represent a major opportunity for improving quality and decreasing costs. Health care spending associated with PPRs has been estimated between $12 billion and $17.4 billion per year (MedPAC, 2007; Jencks, Williams, and Coleman, 2009). Policymakers are considering efforts to (a) measure and publicly report preventable readmission rates and (b) target hospitals with high rates for improvement by means of payment policy and technical assistance. Florida has begun to report hospital-level potentially preventable readmission rates for all patients for acute myocardial infarction (AMI), heart failure, and pneumonia (Goldfield et al., 2008). In June 2009, CMS added 30-day, risk-adjusted, all-cause readmission rates for the same three medical conditions to the publicly reported quality indicators on the Hospital Compare website (CMS, 2009). Given that rural hospitals have disproportionately high Medicare patient volumes, future policies related to preventable-readmission reporting and payment could have a substantial impact on the rural health care system. Currently, little or no information is available on the prevalence of potentially preventable readmissions among rural Medicare patients. Examining such information could help policymakers develop and implement appropriate readmission-based policies. Policies that take into account germane local and regional factors are more likely to achieve their desired outcomes in both rural and urban areas (e.g., improved quality, reduced costs, and greater efficiency). Purpose of this Study To help inform the policy debate about readmissions of rural patients, this study estimated potentially preventable readmissions in three types of acute-care hospitals: urban PPS hospitals, rural PPS hospitals, and Critical Access Hospitals (CAHs). The study sought to answer two specific questions: Are the adjusted PPR rates of rural PPS hospitals and CAHs significantly different from the
rates of urban PPS hospitals?

Upper M idwest Rural H ealth Research Center F inal Report #12
2
Do differences in demographics or severity of patients in these hospitals affect the PPR rates?
We chose to examine readmission rates for the four diseases with the highest prevalence of rural admissions: congestive heart failure (CHF), bacterial pneumonia, chronic obstructive pulmonary disease (COPD), and kidney infection/urinary tract infection (KI/UTI). CHF is the most common diagnosis among hospitalized Medicare patients (CMS, 2006) and
has been associated with six-month hospital all-cause readmission rates of more than 40 percent (Krumholz et al., 1997).
Pneumonia was the second most common reason for hospitalization among Medicare patients
in 2007 (HCUPnet, 2009). It is a designated ambulatory care sensitive condition (i.e., a health condition for which timely access to outpatient primary care can decrease the need for inpatient hospitalizations; Agency for Healthcare Research and Quality [AHRQ], 2001).
COPD is one of the leading causes of morbidity and mortality worldwide (World Health
Organization, 2009). National health survey data have indicated that about 24 million Americans have COPD (Centers for Disease Control and Prevention, 2009).
UTIs are the second most common type of infection in the body (National Kidney and
Urologic Diseases Information Clearinghouse, 2005). Risk factors include aging and having diabetes, kidney stones, or other chronic illnesses (Mayo Clinic, 2009a). Kidney infection is a specific type of UTI that generally begins in the urethra or bladder and travels up into the kidneys (Mayo Clinic, 2009b).
M ethods This study employed the 3M Health Information Systems reventable Readmissions (PPR) software model. This model identifies potentially preventable readmissions using state- and federal-level hospital data sets. Based on an extensive review of the existing permutations of diagnoses for index hospitalizations and readmissions, the 3M analytic model determines the likelihood that a given readmission diagnosis is related to the index hospitalization and thus potentially preventable (MedPAC, 2007). (See Appendix A for additional information regarding the 3M PPR software.) In 2007, the 3M model was used to calculate preventable readmission rates in the Medicare population for MedPAC. This method was also used by the State of Florida to calculate preventable readmissions rates within its hospitals across all payers (Florida Center for Health Information, 2007). We used four years of Medicare Provider and Analysis Review (MedPAR) data (2004 through 2007) to estimate PPRs at 30-, 60-, and 90-day intervals using the 3M PPR program, and SAS v9.2. MedPAR data were matched with corresponding Medicare denominator files to obtain demographic information. The Medicare beneficiaries in the study included older adults (age 65 and older) and disabled beneficiaries under the age of 65. Patients with inpatient visits in each

Upper M idwest Rural H ealth Research Center F inal Report #12
3
state were combined with out-of-state inpatient visits to identify all visits by patients to hospitals in all states. The 3M program was used on this combined data to generate files that identified PPRs for patients. The 3M generated PPR data was also combined with files containing information on rurality (defined by linking hospital zip codes to rural-urban commuting area codes) and Critical Access Hospital (CAH) status of each hospital used by patients. Dates of when a hospital became or ceased to be a CAH were used to signify CAH status at date of admission for the patient. Hospitals were grouped into three cohorts: urban prospective payment system (PPS), rural PPS, and CAH. Initial hospitals were defined as ones where a patient had an admission for a defined disease (CHF, pneumonia, COPD, or KI/UTI) that may have led to a readmission for reasons that were clinically related to that disease. These diseases were the four most common inpatient diagnoses for rural hospitals. CHF, pneumonia, and COPD were also the three most common diagnoses for urban hospitals, while KI/UTI was sixth most common for urban hospitals. The observations used were patient visits to an initial hospital that did or did not lead to a readmission within the designated time span (i.e. 30, 60, or 90 days). Readmissions to hospitals that were different than the initial hospitals (regardless of state) were included. Readmissions for
diagnoses or conditions during their initial admissions were excluded. Patients who died were also excluded. Transfers were not considered as separate visits. Further details on the algorithm used by the 3M program to determine PPRs can be found in Goldfield et al. (2008). The number of valid visits to an initial hospital that did result in a readmission relative to the number of valid visits that did not result in a readmission was used to estimate PPR rates. States were grouped into nine census divisions for analysis. Hospitals were categorized into
not have been located in the same division. The U.S. Census (2009) definitions for region and division were used to categorize states into nine census divisions and four census regions (see Table 1). Table 1. C ensus Divisions Used for PPR Analysis Northeast Region New England Division: Maine, New Hampshire, Vermont, Massachusetts, Rhode Island, Connecticut Middle A tlantic Division: New York, New Jersey, Pennsylvania Midwest Region East North C entral Division: Ohio, Indiana, Illinois, Michigan, Wisconsin W est North C entral Division: Minnesota, Iowa, Missouri, North Dakota, South Dakota, Nebraska, Kansas South Region South A tlantic Division: Delaware, Maryland, District of Columbia, Virginia, West Virginia, North Carolina, South Carolina, Georgia, Florida East South C entral Division: Kentucky, Tennessee, Alabama, Mississippi W est South C entral Division: Arkansas, Louisiana, Oklahoma, Texas West Region Mountain Division: Montana, Idaho, Wyoming, Colorado, New Mexico, Arizona, Utah, Nevada Pacific Division: Washington, Oregon, California, Alaska, Hawaii

Upper M idwest Rural H ealth Research Center F inal Report #12
4
Sever ity Variables A health condition severity score was calculated for each Medicare patient based on information from the initial hospitalization, including age, gender, race, comorbidity score (a scale unique to each disease created from odds ratios of Elixhauser-defined comorbidities), emergency room visit (yes or no), intensive care unit visit (yes or no), length of stay (LOS), total charges per day, surgical procedure performed (yes or no), and discharge destination (home/regular or other), using logistic regressions. Severity scores were estimated uniquely for each disease and days-to- readmission combination. The data were aggregated by hospital. For each hospital the PPR rate was estimated. Individual data about each hospital included average demographics and severity (average percentage under 65 years old, over 74 years old, male, white, destination home, destination home health care, destination skilled nursing facility, destination swing bed, average age, comorbidity score, severity score, LOS, and cost per day). Cohorts of hospitals were based on census division and type of hospital (urban PPS, rural PPS, or CAH) for each of the four diseases and three time periods. Statistical Analysis Average severity scores of hospitals for each disease/division/time were compared between hospital types using one-rates for each hospital were adjusted by breaking the severity score into five levels and adjusting rural PPS and CAH rates according to the distribution they would have had if their severity would have matched urban rates. The distribution of the severity score for adjusting was done separately for each disease, time to readmission, and division. Both unadjusted and adjusted average PPR rates of rural hospitals were compared to rates of the urban hospitals, using independent t-tests. As the validity of the 3M PPR algorithm has been established by MedPAC (2008) and Goldfield et al. (2008), only PPRs in urban, rural PPS, and rural CAH hospitals for the four diseases were studied. This allowed for a direct comparison of readmissions among these three hospital types, disregarding readmissions not related to initial admissions. Results This section presents the major findings from our statistical analyses. To provide context for these findings, we first summarize potentially preventable readmissions of Medicare patients for each diagnosis in the three types of hospitals in the 2004 2007 period. Second, the PPR results related to patient attributes (gender, race, and age) are presented. Finally, we describe and interpret the potential hospital attributes that could explain variation among PPR statistics for these four diagnoses.

Upper M idwest Rural H ealth Research Center F inal Report #12
5
Hospitals Used by M edicare Patients for Potentially Preventable Readmissions Table 2 shows the nationwide distribution of inpatient facilities used by Medicare patients with congestive heart failure (CHF), pneumonia, chronic obstructive pulmonary disease (COPD), or kidney infection/urinary tract infection (KI/UTI) who had potentially preventable readmissions at 30, 60, and 90 days. The distribution of hospitals in which PPRs occurred was fairly consistent across these four diseases: Urban PPS hospitals accounted for about 47% of all hospitals with PPRs among Medicare patients. Rural hospitals accounted for 53%, with rural PPS hospitals composing 31% and CAHs composing the remaining 22% of hospitals. Hospital usage by type of hospital varied slightly but not significantly across these diseases. The variation in volume of readmissions for these four diseases merits attention. CHF and pneumonia both account for about six million readmissions in this four-year data set. That is approximately double the volume of patients readmitted for COPD (three million). Rehospitalizations for KI/UTI are least frequent (slightly more than two million patients). Table 2. Number , Percentage and Type of Hospitals Used by M edicare Patients with C H F , Pneumonia, C OPD , and K I/ U T I for 30-, 60-, and 90-Day Potentially Preventable Readmissions Patients Hospitals Urban PPS Rural PPS CAH N N N (%) N (%) N (%) CHF
30 Day 2,300,332 5,854 2,745 (46.89) 1,817 (31.03) 1,292 (22.07) 60 Day 1,993,936 5,821 2,735 (46.98) 1,795 (30.83) 1,291 (22.17) 90 Day 1,803,001 5,798 2,725 (46.99) 1,783 (30.75) 1,290 (22.24)
Pneumonia 30 Day 2,149,464 6,018 2,778 (46.16) 1,940 (32.23) 1,300 (21.60) 60 Day 1,966,404 5,999 2,772 (46.20) 1,927 (32.12) 1,300 (21.67) 90 Day 1,838,628 5,981 2,766 (46.24) 1,915 (32.01) 1,300 (21.73)
COPD 30 Day 1,154,920 5,823 2,794 (47.98) 1,736 (29.81) 1,293 (22.20) 60 Day 1,017,998 5,805 2,786 (47.99) 1,727 (29.75) 1,292 (22.25) 90 Day 925,732 5,796 2,778 (47.92) 1,726 (29.77) 1,292 (22.29)
KI/UTI 30 Day 838,129 5,557 2,598 (46.75) 1,669 (30.03) 1,290 (23.21) 60 Day 748,180 5,535 2,588 (46.75) 1,657 (29.93) 1,290 (23.30) 90 Day 689,300 5,515 2,850 (46.78) 1,648 (29.88) 1,287 (23.33)
Upper M idwest Rural H ealth Research Center F inal Report #12
6
Patient Demographics Figures 1 to 3 show the distribution of gender, race, and age, respectively, for 30-day PPRs for each disease. Males represent slightly less than 50% of Medicare patients with 30-day PPRs for three of the four diseases: CHF, pneumonia, and COPD (Figure 1). The most striking urbanrural disparity involves COPD: urban PPS hospitals had a significantly lower percentage of males admitted than did rural PPS hospitals, and PPS hospitals had a significantly lower percentage of males readmitted than CAHs did. This contrasts with the CHF profile, in which urban PPS hospitals had a significantly higher percentage of males than in either type of rural hospital. The male and female percentages readmitted for pneumonia varied only slightly across the three hospital types. Females make up approximately three quarters of the patients readmitted for kidney infection/urinary tract infection. The percentage of males readmitted for KI/UTI at CAHs was significantly higher than the percentage readmitted at either urban or rural PPS hospitals. Figure 2 summarizes the racial and ethnic makeup of Medicare patients who had PPRs for the four diseases. The current Medicare population is predominantly white, and the readmission data show a high percentage of white patients across all four diseases and all three hospital settings. Average percentages range from about 80 percent (urban PPS hospitals) to 90 percent (CAHs), regardless of disease. Urban PPS hospitals had the most diverse populations, regardless of disease. As Figure 2 documents, all pairs of urban PPS hospitals, rural PPS hospitals, and rural CAHs are significantly different for all diseases. Average age, displayed in Figure 3, shows numerous significant differences. All pairs of urban PPS hospitals, rural PPS hospitals, and CAHs vary significantly for three of the four diseases: CHF, pneumonia, and KI/UTI. For each of those diagnoses, the urban PPS hospitals have the youngest patients, and the CAHs have the oldest patients, on average. COPD shows a distinct pattern. It has a markedly lower average age compared to the other three diseases, and that low age persists across all three hospital types. The average age among COPD patients did not differ significantly between urban and rural PPS hospitals. However, the CAH patients readmitted for COPD were significantly older, on average. Nearly identical patterns were found for 60- and 90-day PPRs for the four diseases, thus those data are not shown.

Upper M idwest Rural H ealth Research Center F inal Report #12
7
F igure 1
0
5
10
15
20
25
30
35
40
45
50
CHF BP COPD UTI
Urban PPS Rural PPS Rural CAH
Average Percentage Male in Urban PPS, Rural PPS, and Rural CAH Hospitals with Patients who had 30-Day PPR for CHF, BP, COPD, and UTI
Avg%Male
N = 5,854 N = 6,018 N = 5,823 N = 5,557
* **
*
*
* Significantly different from other rurality designations within the disease.
F igure 2
0
10
20
30
40
50
60
70
80
90
100
CHF BP COPD UTI
Urban PPS Rural PPS Rural CAH
Average Percentage White in Urban PPS, Rural PPS, and Rural CAH Hospitals with Patients who had 30-Day PPR for CHF, BP, COPD, and UTI
Avg%White
N = 5,854 N = 6,018 N = 5,823 N = 5,557
* All pairs of Urban PPS, Rural PPS, and Rural CAH significantly different for all diseases.

Upper M idwest Rural H ealth Research Center F inal Report #12
8
F igure 3
68
70
72
74
76
78
80
CHF BP COPD UTI
Urban PPS Rural PPS Rural CAH
Average Age in Urban PPS, Rural PPS, and Rural CAH Hospitals with Patients Who Had 30-Day PPR for CHF, BP, COPD, and UTI
AvgAge
N= 5,854 N= 6,018 N= 5,823 N= 5,557+ All pairs of Urban PPS, Rural PPS, and Rural CAH significantly different for all diseasesexcept for Urban and Rural PPS, COPD.
+ +
Patient Demographic Variations by Census Divisions Our analyses of patient variables included an assessment by census division of the demographics of hospitals treating Medicare patients with potentially preventable readmissions for the four diseases being studied. Tables B-1 through B-4 in Appendix B show the demographic characteristics of Medicare patients at initial visit by census division and by PPR days for CHF, pneumonia, COPD, and KI/UTI respectively. Geographic differences exist among the nine census divisions. Hospitals in the Mountain Division have a high average percentage of males most often for each disease, while the East South Central had the lowest percentage of males. Elsewhere, gender distributions vary. For all diseases, the West North Central, New England, and East North Central divisions have the highest average percentage of whites (fewest minorities), while the Pacific, West South Central, and South Atlantic have the lowest percentage of whites. Average age of patients in each hospital follows a similar pattern to race. The divisions with older or younger patients are also the divisions with more or less average percentages of white patients respectively. The average percentage under 65 or 75 and older varies more. For example, though the East South Central Division is not the youngest in terms of average age, it has the lowest average percentage of patients 75 and older for all four diseases.

Upper M idwest Rural H ealth Research Center F inal Report #12
9
Hospital Types and Sever ity How do other hospital attributes affect PPRs for these four diseases? We examined the distribution of hospital types, unadjusted-severity scores by division and rurality, and nationwide severity-adjusted PPR rates for 30-, 60- and 90-day PPRs. Finally, we examined adjusted-PPR rates by disease, hospital type, and geographic division, using 30-, 60- and 90-day time frames. The remainder of this section presents findings from these analyses. Distribution of Hospital Types by Census Division Figure 4 shows the distribution of hospitals by type for 30-day congestive heart failure readmissions in each census division. Figure 4 starts on the left with the highest percentage of rural hospitals (rural PPS or CAHs) and orders the remaining divisions in decreasing order of rural hospital prevalence from left to right. Thus the West North Central Division (far left) has the highest percentage of rural hospitals (about 80%) and the Mid-Atlantic Division (far right) has the lowest percentage (about 25%). The distribution of rural PPS hospitals and CAHs is not uniform across geographic regions. As Figure 4 depicts, most of the rural hospitals in the West North Central and Mountain divisions are CAHs. In contrast, the East South Central Division, which has the second highest percentage of rural hospitals, has one of the smallest percentages (about 12%) of CAHs. The percentage of rural PPS hospitals also varies greatly, from a low of less than 20% in the Pacific Division to a high of nearly 50% in the East South Central Division. The geographic distribution of the three types of hospitals is nearly identical for the other three diseases and other PPR days; thus those data are not shown.
F igure 4
Distribution of Hospital Type by Census Division for CHF PPR 30 days
N = 882 508 458 916 901 809 241 641 498
0%
10%
20%
30%
40%
50%
60%
70%
80%
90%
100%
W. N.Central
E. S.Central
Mountain W. S.Central
E. N.Central
S.Atlantic
NewEngland
Pacific MidAtlantic
Rural PPS Rural CAH Urban PPS
Upper M idwest Rural H ealth Research Center F inal Report #12
10
Unadjusted Severity Scores by Division and Rurality
We found significant differences in unadjusted severity scores, both across census divisions and among hospital types within census divisions. The average severity scores for hospitals according to disease, division, PPR days, and hospital rurality are shown in Tables 1 4 in Appendix C. Each table displays results for one disease. Within each table, the census divisions are ordered in descending order of mean rural PPS severity score for 30-day PPRs. The Mid-Atlantic and New England divisions consistently had the highest rural severity scores for all diseases, all PPR days. The Pacific, West North Central, and Mountain divisions had consistently low severity scores for three of the four diseases: CHF, pneumonia and KI/UTI. COPD presents a different picture: West North Central and Mountain divisions had low severity scores, but West South Central, East South Central, and South Atlantic rural PPS scores were all lower than Pacific scores. For nearly all scores in CHF, pneumonia, and COPD, urban PPS hospitals had significantly higher severity of patients on average than rural PPS hospitals or CAHs. In a few instances, rural PPS hospitals and CAHs did not have significantly different severity scores. (This usually occurred for 60- and 90-day PPRs, and in the divisions of Mid-Atlantic and New England, which have the fewest CAHs.) Kidney/urinary tract infection (Table 4, Appendix C) showed a more mixed picture. In East South Central and West North Central divisions, 60 and 90 days, the average urban PPS severity scores were not significantly different from rural PPS scores. Severity-Adjusted PPR Rates, Nationwide Average 30-, 60-, and 90-day PPRs per 1,000 patients for each hospital were estimated within each division for CHF, pneumonia, COPD, and KI/UTI. Average rates for rural PPS hospitals and CAHs were compared to urban hospitals. These rates were then adjusted for severity and again compared to urban rates. Figures 5 7 display the national results. Figure 5 shows the urban PPS hospital rates, unadjusted- and adjusted-rural-PPS rates, and unadjusted- and adjusted-CAH rates for 30-day PPRs, respectively. Figures 6 and 7 depict the comparable rates for 60-day and 90-day PPRs.
Upper M idwest Rural H ealth Research Center F inal Report #12
11
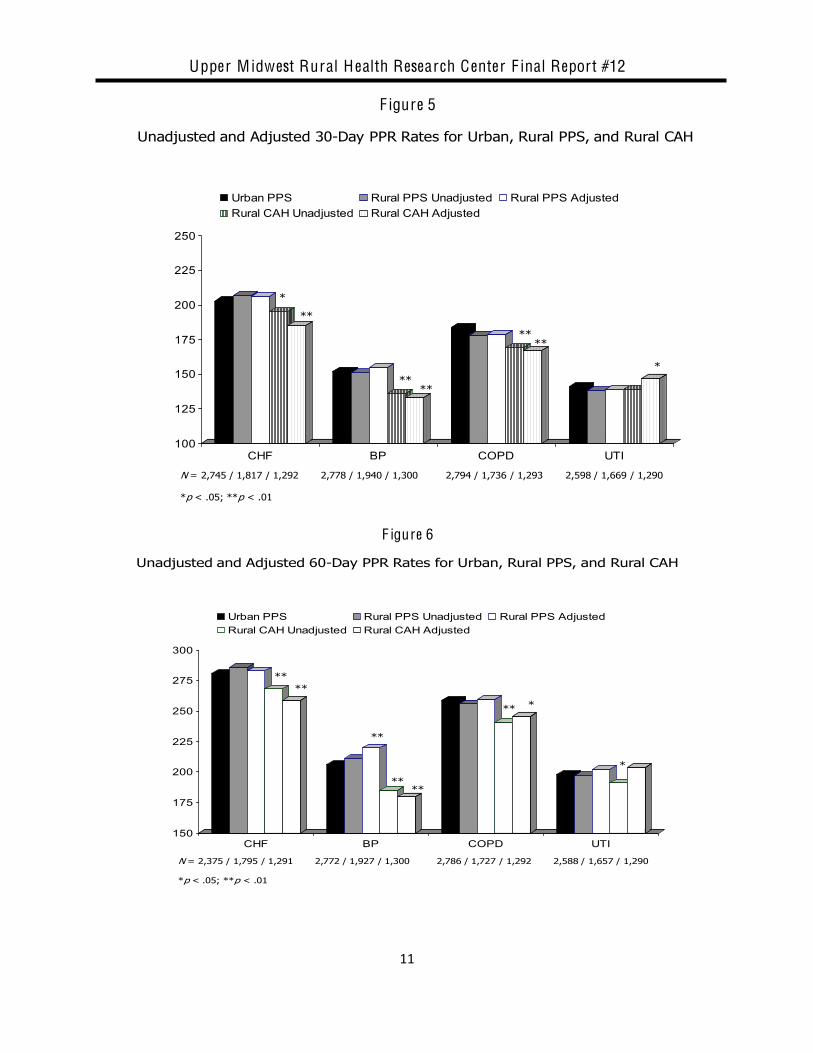
F igure 5
100
125
150
175
200
225
250
CHF BP COPD UTI
Urban PPS Rural PPS Unadjusted Rural PPS AdjustedRural CAH Unadjusted Rural CAH Adjusted
Unadjusted and Adjusted 30-Day PPR Rates for Urban, Rural PPS, and Rural CAH
*
**
****
****
*
N = 2,745 / 1,817 / 1,292
*p < .05;; **p < .01
2,778 / 1,940 / 1,300 2,794 / 1,736 / 1,293 2,598 / 1,669 / 1,290
F igure 6
150
175
200
225
250
275
300
CHF BP COPD UTI
Urban PPS Rural PPS Unadjusted Rural PPS AdjustedRural CAH Unadjusted Rural CAH Adjusted
Unadjusted and Adjusted 60-Day PPR Rates for Urban, Rural PPS, and Rural CAH
****
**
**
***
N = 2,375 / 1,795 / 1,291
*p < .05;; **p < .01
2,772 / 1,927 / 1,300 2,786 / 1,727 / 1,292 2,588 / 1,657 / 1,290
**
*

Upper M idwest Rural H ealth Research Center F inal Report #12
12
F igure 7
200
225
250
275
300
325
350
CHF BP COPD UTI
Urban PPS Rural PPS Unadjusted Rural PPS AdjustedRural CAH Unadjusted Rural CAH Adjusted
Unadjusted and Adjusted 90-Day PPR Rates for Urban, Rural PPS, and Rural CAH
*
****
**
** **
*
N = 2,725 / 1,783 / 1,290
*p < .05;; **p < .01
2,766 / 1,915 / 1,300 2,778 / 1,726 / 1,292 2,580 / 1,648 / 1,287
*
** *
CHF and COPD have the highest rates of readmission across all three hospital types and for all three readmission time frames. For both CHF and COPD, rates increase by about 75 people per 1,000 between 30- and 60-day readmission, and by about 50 people per 1,000 between 60- and 90-day readmission. Pneumonia rates increase by about 50 people per 1,000 from 30-day to 60- day and between 60-day and 90-day readmissions. KI/UTI rates increase about 50 people per 1,000 between 30 and 60 days, and 25 people between 60 and 90 days. In Figure 5, the 30-day rural PPS hospital adjusted rates (black) do not differ significantly from the urban PPS rates. However, the CAH adjusted rates (dark stripe) are significantly lower for all four diseases. Figure 6 (60-day rates) shows that the adjusted rural PPS hospital rate for pneumonia is significantly higher than the urban PPS pneumonia rate. The adjusted rural PPS hospital rates for the other three diseases are very similar to urban PPS rates. Severity-adjusted CAH rates for KI/UTI are not significantly different from urban rates; however, the adjusted- CHF, pneumonia, and COPD rates for CAHs are significantly lower than the rates for their urban counterparts. Figure 7 displays the 90-day rates. Once again, rurality makes a difference, but not always in the same direction. Adjusted 90-day rural PPS rates for both pneumonia and KI/UTI are significantly higher than urban PPS rates for those diseases. CAH rates mirror the pattern displayed in 60-day results: they are significantly lower for CHF, pneumonia, and COPD, although not for KI/UTI.

Upper M idwest Rural H ealth Research Center F inal Report #12
13
Severity-adjusted Rates, Geographic Variation by Disease
Congestive H eart Failure. Table 3 shows adjusted 30-day PPR rates for CHF, by census division.1 The census divisions at the top have adjusted rural rates (rural PPS hospitals or CAHs or both) that are significantly higher than urban rates. The divisions in the middle do not differ significantly. The divisions at the bottom have adjusted rural rates that are significantly lower than urban rates. As the key to the table shows, statistical significance varies from p < .05 to p < .01, with several comparisons in the latter category.
Table 3. Congestive H eart Failure: Sever ity-Adjusted Average Hospital 30-Day PPR Rates per 1,000 Admissions for Rural PPS Hospitals and C A Hs Compared to Urban PPS Hospitals by Census Division
Census Division Urban PPS Hospitals Rural PPS Hospitals C ritical Access
Hospitals East South Central 188 222** 218** South Atlantic 211 239** 196 West South Central 202 223* 209 West North Central 186 209 174 New England 195 170 182 Mountain 185 156 172 Mid-Atlantic 209 209 196 Pacific 195 163* 148** East North Central 216 173** 196* * Differences with urban PPS hospitals are significant at p < .05 **Differences with urban PPS hospitals are significant at p < .01 When rural rates were adjusted for severity, both PPS and CAHs in the East South Central Division were significantly higher than urban rates. In the South Atlantic and West South Central, this same pattern was true for rural PPS hospitals, but not for CAHs. Four geographic divisions of the country showed no significant difference between adjusted 30-day rural rates and urban rates: West North Central, New England, and Mountain, and Mid-Atlantic. (The Mountain and Mid-Atlantic CAHs did have significantly lower adjusted 60- or 90-day or both CAH rates, which are not shown.) Both the Pacific and the East North Central divisions had rural PPS and CAH rates that were significantly lower than urban rates after adjusting for severity.
Pneumonia. Table 4 presents the comparable severity-adjusted data for pneumonia. The adjusted pneumonia readmission rates are more mixed. The East South Central, West South Central, and Mountain divisions each have a significantly higher rural rate in one but not both rural hospital types. (Note that 90-day results showed statistical significance for both rural hospital types in both South Central divisions.)
1 See Appendix D for comparable tables with 60- and 90-day severity-adjusted PPR rates by condition and census division

Upper M idwest Rural H ealth Research Center F inal Report #12
14
The bottom of Table 4 shows the most consistent results. The Pacific, Mid-Atlantic, and New England divisions all had 30-day rural PPS hospital and CAH rates that were significantly lower than urban PPS hospitals in those regions, when adjusted for severity. Table 4. Pneumonia: Sever ity-Adjusted Average Hospital 30-Day PPR Rates per 1,000 Admissions for Rural PPS Hospitals and C A Hs Compared to Urban PPS Hospitals by Census Division
Census Division Urban PPS Hospitals Rural PPS Hospitals C ritical Access
Hospitals West South Central 150 187** 144 East South Central 155 168 181* Mountain 130 180** 139 West North Central 137 141 125 East North Central 153 155 184** South Atlantic 148 159 155 Pacific 151 125* 107** Mid-Atlantic 170 117** 152* New England 158 107** 129**
* Differences with urban PPS hospitals are significant at p < .05 **Differences with urban PPS hospitals are significant at p < .01
C OPD . Severity-adjusted PPR rates for COPD (Table 5) present a very different picture. Rural PPS hospital rates differed significantly from urban rates in only one division: Mid-Atlantic. In contrast, CAHs in six of the nine divisions had statistically significant differences when adjusted data were used. Adjusted CAH rates in the South Atlantic and Mountain divisions were significantly higher than urban PPS hospitals; CAH rates in Pacific, East North Central, New England, and Mid-Atlantic divisions were all significantly lower than urban rates.
Table 5. Chronic O bstructive Pulmonary Disease: Sever ity Adjusted Average Hospital 30-Day PPR Rates per 1,000 Admissions for Rural PPS Hospitals and C A Hs Compared to Urban PPS Hospitals by Census Division
Census Division Urban PPS Hospitals Rural PPS Hospitals
C ritical Access Hospitals
South Atlantic 183 204 213** Mountain 148 147 213** East South Central 182 180 183 West South Central 186 195 192 West North Central 167 174 156 Pacific 176 153 109** East North Central 192 198 166** New England 175 166 155* Mid-Atlantic 211 175** 183*
* Differences with urban PPS hospitals are significant at p < .05 **Differences with urban PPS hospitals are significant at p < .01

Upper M idwest Rural H ealth Research Center F inal Report #12
15
Urinary T ract/ K idney Infection. Similar to CHF and pneumonia rates, the adjusted 30-day KI/UTI rates (Table 6) show a broad range of differences between rural and urban rates on both ends of the spectrum. Two divisions have significantly higher rural PPS and CAH rates when adjusted for severity. One division (Mountain) has higher CAH rates, but not rural PPS rates. On the other end, in New England and Mid-Atlantic divisions, both rural PPS and CAH rates are significantly lower when adjusted for severity.
Table 6. K idney Infection/Urinary T ract Infection: Sever ity-Adjusted Average Hospital 30-Day PPR Rates per 1,000 Admissions for Rural PPS Hospitals and C A Hs Compared to Urban PPS Hospitals by Census Division.
Census Division Urban PPS Hospitals
Rural PPS Hospitals C ritical Access Hospitals
East South Central 136 164** 186** West South Central 139 161* 177** Mountain 110 119 166** Pacific 135 114 138 South Atlantic 151 143 142 West North Central 139 118* 149 East North Central 142 134 133 New England 139 107** 110** Mid-Atlantic 154 133* 135*
* Differences with urban PPS hospitals are significant at p < .05 **Differences with urban PPS hospitals are significant at p < .01 Summary of PPR Variation by Geography and Rurality Table 7 summarizes the statistically significant differences in adjusted 30-day PPR rates by hospital type and census division for the four diseases. This table provides a visual synopsis of the marked differences in adjusted rates among census divisions. It also shows the considerable variation across census divisions for a specific disease. In addition, Table 14 enables comparisons of the rural PPS and CAH outcomes. Differences among Census Divisions Striking differences are evident. The Mid-Atlantic Division and East South Central Division represent opposite ends: Six of the eight 30-day rates are significantly lower in the Mid-Atlantic Division, and no rates are significantly higher. Conversely, the East South Central Division has no significantly lower 30-day rates and five rates that are significantly higher, as compared to urban hospitals. It is also important to note the divisions with very little significant variation. Two of the nine divisions had fewer than three statistically significant results: the West North Central Division has one lower result and no higher results; and the South Atlantic Division has two higher results and no lower results. Even the divisions with multiple significant outcomes have at least two categories with no significant 30-day differences.

Upper M idwest Rural H ealth Research Center F inal Report #12
16
Differences among Diseases Table 7 facilitates disease-specific comparisons across census divisions. In treating CHF, no statistically significant differences were evident in four of the nine census divisions. In two divisions, both rural PPS hospitals and CAHs had lower adjusted PPRs. Higher rural PPRs were found in three divisions. The other three diseases all have significantly lower adjusted rural PPRs in three or four census divisions. Pneumonia PPRs are significantly lower for both rural hospital types in three divisions. COPD readmissions have the least variation: five lower rural rates and only two higher rural rates out of 18 possible (9 divisions × 2 rural hospital types = 18). Rates for KI/UTI show the most dramatic variation. Two divisions have significantly lower adjusted rates for both rural hospital types; two divisions have significantly higher adjusted rates for both rural hospital types; and three divisions show no significant differences. The remaining two divisions each have one significant difference. Table 7. Summary of Significant Differences in Severity-Adjusted 30-Day PPR Rates, by Hospital Type and Census Division
Census Division Summary of Significant Differences Compared to Urban PPS Rates
Congestive H eart
Failure
Pneumonia
C OPD
K idney/Urinary T ract Infection
Rural PPS
C A H
Rural PPS
C A H
Rural PPS
C A H
Rural PPS
C A H
Mid-Atlantic: 6 Lower, 0 Higher
L L L L L L
New England: 5 Lower, 0 Higher
L
L
L
L
L
Pacific: 5 Lower, 0 Higher
L
L
L
L
L
East North Central: 3 Lower, 1 Higher
L
L
H
L
West North Central: 1 Lower, 0 Higher
L
South Atlantic: 0 Lower, 2 Higher
H
H
Mountain: 0 Lower, 3 Higher
H
H
H
West South Central: 0 Lower, 4 Higher
H
H
H
H
East South Central: 0 Lower, 5 Higher
H
H
H
H
H
Totals 2 Lower;
3 Higher
2 Lower;
1 Higher
3 Lower;
2 Higher
3 Lower;
2 Higher
1 Lower;
0 Higher
4 Lower;
2 Higher
3 Lower;
2 Higher
2 Lower;
3 Higher

Upper M idwest Rural H ealth Research Center F inal Report #12
17
Comparisons between Rural PPS Hospitals and CAHs Rural PPS hospital and CAH 30-day adjusted rates tended to be similar, especially for significantly low findings. The low findings for CHF, pneumonia, and KI/UTI are consistent across rural PPS hospitals and CAHs. The high findings are consistent for KI/UTI, but not at all for the other three diseases. COPD shows the largest disparity among significant findings: Rural PPS hospital rates for COPD are significantly different in only one of nine census divisions. Critical Access Hospitals have significantly different COPD PPR rates in six of the nine divisions: In four divisions, CAH rates are significantly low, and in two divisions those rates are significantly high. Overall Geographic Trends To help discern broader geographic trends, 30-day adjusted PPR results are depicted graphically in Figures 8 to 11 for CHF, COPD, KI/UTI, and pneumonia, respectively. On each map, census
or both have higher 30-day
PPS hospitals or CAHs or both have lower adjusted PPR rates than urban PPS hospitals. In the unmarked census regions, PPR rates for rural PPS hospitals and CAHs were not significantly different than those of urban PPS hospitals. F igure 8. Significant Differences in C H F 30-Day Adjusted PPR Rates for C A Hs, Rural PPS, and Urban PPS Hospitals

Upper M idwest Rural H ealth Research Center F inal Report #12
18
F igure 9. Significant Differences in Pneumonia Adjusted 30-Day PPR Rates for C A Hs, Rural PPS, and Urban PPS Hospitals
F igure 10. Significant Differences in C OPD 30-Day Adjusted PPR Rates for C A Hs, Rural PPS, and Urban PPS Hospitals

Upper M idwest Rural H ealth Research Center F inal Report #12
19
F igure 11. Significant Differences in K idney/Urinary T ract Infection 30-Day Adjusted PPR Rates for C A Hs, Rural PPS, and Urban PPS Hospitals
Conclusions This study addressed two main research questions: (1) Are the adjusted PPR rates of rural PPS hospitals and CAHs significantly different from the rates of urban PPS hospitals? and (2) Do differences in demographics or severity of patients in these hospitals affect the PPR rates? Adjusted PPR Rate Differences among Hospital Types Adjusted PPR rates vary among hospital types, both rural versus urban, and within the two rural hospital types (PPS and CAH). These variations are often at statistically significant levels, but are not all in one direction. Urban PPS rates can be higher or lower than rural PPS, depending on diagnosis and days to readmission. While CAH rates are typically lower than both urban and rural PPS hospitals, this is not uniformly the case. Influence of Diagnosis on PPR Rate in Hospital Types Each of the four diagnoses studied shows a distinct readmission pattern across the three hospital types. Readmission patterns were different not only between urban and rural PPS hospitals but also between rural PPS hospitals and CAHs. CAHs had significantly lower 30-day readmission rates for CHF, pneumonia, and COPD than did urban and rural PPS hospitals. However, adjusted 30-day KI/UTI readmissions were significantly higher for CAHs than for urban hospitals or rural

Upper M idwest Rural H ealth Research Center F inal Report #12
20
PPS hospitals. Given that UTI is the fourth most common diagnosis for rural hospital admissions, it is important to further research this difference. Rural PPS hospitals tended to have readmission patterns similar to urban PPS hospitals, especially in the 30-day time period. Rural PPS hospitals have slightly higher readmission rates for CHF and pneumonia, although the differences in the 30-day results are not significant. Pneumonia readmissions at the 60-day and 90-day level are both significantly higher in rural PPS hospitals than in urban hospitals or CAHs. COPD results are very similar for urban and rural PPS hospitals across all three time frames. KI/UTI 30- and 60-day results are similar for rural and urban PPS hospitals; however the 90-day KI/UTI adjusted readmissions rate for rural PPS hospitals is significantly higher than either urban or CAH rates. Influence of Differences in Demographics and Sever ity on PPR Rates The adjustments for severity are important for two reasons. They change the results, sometimes at significant levels. Perhaps more germane, severity-adjusted data allow the results to be used with more confidence by hospital administrators, policymakers, and others. Influence of Geography In the process of answering the two primary research questions, we documented a third important factor in PPR rates. After adjusting for severity, it appears clear that geographic location interacts both with hospital types and diagnoses to create readmission patterns that vary markedly by census division. Overall, rural PPS hospitals and CAHs located in the New England, Mid-Atlantic, East North Central, and Pacific census divisions tended to have significantly lower readmission rates than urban hospitals. In contrast, several rural PPS and CAH readmission rates were significantly higher than urban rates in the three southern divisions of the country and in the Mountain Division. T ime Interval This study employed three discharge-to-readmission time intervals (30-, 60- and 90-day). Recent studies have used the 30-day interval when measuring readmissions, presumably due to the belief among researchers and policymakers that readmissions within a shorter time frame are more
, and thus perhaps better represent indicators of potentially poor quality of care (Goldfield et al., 2008). The results of our study indicate that, although readmission rates increased as time intervals increased, pneumonia was the only disease in which the patterns of readmission rates within divisions and hospital types varied significantly across the different time intervals. Thus, while 60- and 90-day data may be useful to specific hospitals or groups of hospitals, 30-day readmission rates can be considered useful proxies for 60- and 90-day PPR rates, at least from the standpoint of national and regional policy and planning.

Upper M idwest Rural H ealth Research Center F inal Report #12
21
Possible Causes of Geographic Variation in PPRs among Hospital Types Some of the geographic differences may be caused by the prevalence of rural PPS hospitals and CAHs in these divisions. For example, the Northeast and Pacific areas have the lowest percentage of rural PPS hospitals and CAHs. The West North Central Division, which has the greatest percentage of CAHs, has rural readmission rates that are most similar to urban readmission rates. Although the PPR rates were adjusted for demographics and severity, we may not have been able to adjust for all differences because of race and rurality. The higher rates of tobacco use in the southeastern states coupled with race and other rurality factors (Stevens et al., 2003) may have a long-term detrimental impact on the health of this population even after individuals have improved access to health care through Medicare. Other research links rurality and race to health outcomes (Hartley, 2004). Rural white older adults often experience better health than their non-white older adult counterparts owing to such factors as higher rates of health insurance coverage prior to Medicare eligibility, higher educational attainment, and increased income. L imitations This study is based on administrative data and on a limited number of diseases. Other factors
actors contribute to reduced readmissions. Such factors could include specific indicators of inpatient care quality, discharge planning, care coordination, home support, patient compliance, and patient self-care. Directions for Future Research Our analyses demonstrated that grouping rural and urban hospitals together in readmission studies can mask important variations. Our study also documented the importance of looking separately at rural PPS hospitals and CAHs since their PPR rates can vary significantly from each other by disease and region. A more useful approach is to examine severity-adjusted rates by type of hospital and by region (census division, state, or other geographic area). This combination provides the fullest picture and a baseline against which the impact of future PPR improvement efforts can be assessed. The health disparities among southern Medicare patients (especially in the East South Central and West South Central divisions) merit additional research to examine how the relatively high readmission rates for rural PPS hospitals and CAHs can be improved. Likewise, it could also be beneficial to examine rural PPS hospitals and CAHs in the northeastern areas (Mid-Atlantic and New England) and in the far west (Pacific), to determine whether in-hospital care, out-of-hospital care, or other controllable factors may contribute to the relatively low readmission rates in those areas.
Upper M idwest Rural H ealth Research Center F inal Report #12
22
References American Lung Association. (2008). Chronic obstructive pulmonary disease. Retrieved from http://www.lungusa.org/atf/cf/%7B7a8d42c2-fcca-4604-8ade-7f5d5e762256%7D/ALA_LDD08_COPD_FINAL.PDF Benbassat, J., & Taragin, M. (2000). Hospital readmissions as a measure of quality of health care. Archives of Internal Medicine, 160, 1074 1081. Cantor, J., Schoen, C., Belloff, D., How, S., & McCarthy, D. (2007, June). Aiming higher: results from a state scorecard on health system performance. The Commonwealth Fund Commission on a High Performance Health System. Centers for Disease Control and Prevention, Division of Adult and Community Health. (2009). Chronic obstructive pulmonary disease. Retrieved from http://www.cdc.gov/copd/copdfaq.htm Chae, C., Pfeffer, M., Glynn, R., Mitchell, G., Taylor, J., & Hennekens, C. (1999). Increased pulse pressure and risk of heart failure in the elderly. Journal of the American Medical Association. 281, 634 639. Chen, Y., Vaccarino, V., Williams, C., Butler, J., Berkman, L., & Krumholz, H. (1999). Risk factors for heart failure in the elderly: A prospective community-based study. American Journal of Medicine, 106, 605 612. Connors, A., Dawson, N., Thomas, C., et al. (1996). Outcomes following acute exacerbation of severe chronic obstructive lung disease. American Journal of Respiratory and Critical Care Medicine, 154, 959 967. Doescher, M., Jackson, J., Jerant, A., & Hart, L. (2006). Prevalence and trends in smoking: A national rural study. Journal of Rural Health, 22, 112 118. Fisher, E., Wennberg, D., Stukel, T., Gottlieb, D., Lucas, F., & Pinder, E. (2003). The implications of regional variations in Medicare spending, part 1: The content, quality, and accessibility of care. Annals of Internal Medicine, 138, 273 287. Florida Center for Health Information and Policy Analysis. (2007). transparency initiative 3M Preventable Hospital Readmission Partnership eet. Florida: Author. Goldfield, N., McCullough, E., Hughes, J., Tang, A., Eastman, B., Rawlins, L., & Averill, R. (2008). Identifying potentially preventable readmissions. Health Care F inance Review, 30, 7591. Gottdiener, J., Arnold, A., Aurigemma, G., Polak, J., Tracy, R., Kitzman, D., . . . Boineau, R. (2000). Predictors of congestive heart failure in the elderly: The cardiovascular health study. Journal of the American College of Cardiology, 35, 1628 1637.

Upper M idwest Rural H ealth Research Center F inal Report #12
23
Hartley, D. (2004). Rural health disparities, population health, and rural culture. American Journal of Public Health, 94, 1675 1678. He, J., Ogden, L., Bazzano, L., Vupputuri, S., Loria, C., & Whelton, P. (2001). Risk factors for congestive heart failure in U.S. men and women: NHANES I epidemiologic follow-up study. Archives of Internal Medicine, 161, 996 1002. Hunt, S., Baker, D., Chin, M., et al. (2002). ACC/AHA guidelines for the evaluation and management of chronic heart failure in the adult. Journal of Heart and Lung Transplantation, 21, 189 203. Jencks, S., Williams M., & Coleman, E. (2009). Rehospitalizations among patients in the Medicare fee-for-service program. New England Journal of Medicine , 360, 1418 1428. Kannel, W., & Belanger, A. (1991). Epidemiology of heart failure. American Heart Journal, 121, 951 957. Kannel, W. , R., Silbershatz, H., Belanger, A., Wilson, P., & Levy, D. (1999). Profile for estimating risk of heart failure. Archives of Internal Medicine, 159, 1197 1204. Kenchaiah, S., Evans, J., Levy, D. Wilson, P., Benjamin, E., Larson, M., Kannel, W., & Vasan, R. (2002). Obesity and the risk of heart failure. New England Journal of Medicine, 347, 305313. Kenchaiah, S., Narula, J., & Vasan, R. (2004). Risk factors for heart failure. The Medical Clinics of North America, 88, 1145 1172. Krumholz, H., Parent, E., Tu, N., Vaccarino, V., Wang, Y., Radford, M., & Hennen, J. (1997). Readmission after hospitalization for congestive heart failure among Medicare beneficiaries. Archives of Internal Medicine, 157, 99 104. Laditka, J. (2003). Hazards of hospitalization for ambulatory care sensitive conditions among older women: Evidence of greater risks for African Americans and Hispanics. Medical Care Research and Review, 60, 468 495. Levy, D., Kenchaiah, S., Larson, M., Benjamin, E., Kupka, M., Ho, K., Murabito, J., & Vasan, R. (2002). Long-term trends in the incidence of and survival with heart failure. New England Journal of Medicine, 347, 1397 1402. Marcantonio, E., McKean, S., Goldfinger, M., Kleefield, S., Yurkofsky, M., & Brennan, T. (1999). Factors associated with unplanned hospital readmission among patients 65 years of age and older in a Medicare managed care plan. American Journal of Medicine, 107, 13 17. Mayo Clinic. (2009). Urinary tract infection. Retrieved from http://www.mayoclinic.com/health/urinary-tract-infection/DS00286

Upper M idwest Rural H ealth Research Center F inal Report #12
24
Mayo Clinic. (2009). Kidney infection. Retrieved from http://www.mayoclinic.com/health/kidney-infection/DS00593 McAlister, F., Lawson, F., Teo, K., & Armstrong, P. (2001). A systematic review of randomized trials of disease management programs in heart failure. American Journal of Medicine, 110, 378384. McCall, N., Brody, E., Mobley, L., & Subramanian, S. (2004, June). Investigation of increasing rates of hospitalizations for ambulatory sensitive conditions among Medicare F ee-for-Service beneficiaries. Retrieved from http://www.cms.hhs.gov/Reports/Downloads/McCall_2004_3.pdf Medicare. Medicare eligibility tool. (2009, August 5). Retrieved from http://www.medicare.gov/MedicareEligibility/Home.asp?dest=NAV|Home|GeneralEnrollment#TabTop Medicare Payment Advisory Commission (MedPAC). (2007, June). Report to Congress: Promoting greater efficiency in Medicare. Washington, DC: MedPAC. Medicare Payment Advisory Commission (MedPAC). (2008, September). Report to Congress: Reforming the delivery system. Washington, DC: MedPAC. National Kidney and Urologic Diseases Information Clearinghouse NKUDIC. (2005). Retrieved from http://kidney.niddk.nih.gov/Kudiseases/pubs/utiadult/ North Carolina Rural Health Research and Policy Analysis Center. (2004). Location of critical access hospitals. Retrieved from http://www.flexmonitoring.org/documents/CAH113004.pdf Ricketts, T., Randolph, R., Howard, H., et al. (2001). Hospitalization rates as indicators of access to primary care. Health Place, 7, 27 38. Rosamond, W., Flegal, K., Friday, G., Furie, K., Go, A., Greenlund, K., . . . Hong, Y. (2007). Heart disease and stroke statistics: 2007 update: a report from the American Heart Association Statistics Committee and Stroke Statistics Subcommittee. Circulation, 115, e69 e171. Rural Assistance Center. (2009, November 2). Critical access hospital information guide. Retrieved from http://www.raconline.org/info_guides/hospitals/cahfaq.php#benefits Schocken, D., Benjamin, E., Fonarow, G., Krumholz, H., Levy, D., Mensah, G., . . . Hong, Y. (2008). Prevention of heart failure. Circulation, 117, 2544 2565. Seemungal, T., Donaldson, G., Bhowmik, A., et al. (2000). Time course and recovery of exacerbations in patients with chronic obstructive pulmonary disease. American Journal of Respiratory and Critical Care Medicine , 161, 1608 1613.

Upper M idwest Rural H ealth Research Center F inal Report #12
25
Seemungal, T., Donaldson, G., Paul, E., et al. (1998). Effect of exacerbation on quality of life in patients with chronic obstructive pulmonary disease. American Journal of Respiratory and Critical Care Medicine, 157, 1418 1422. Schappert, S., & Rechtsteiner, E. (2008). Ambulatory medical care utilization estimates for 2006. (National health statistics reports, No. 8). Hyattsville, MD: National Center for Health Statistics. Siafakas, N., Vermeire, P., Pride, N., et al. (1995). Optimal assessment and management of chronic obstructive pulmonary disease (COPD). The European Respiratory Journal, 8, 1398420. Stevens, S., Colwell, B., & Hutchison, L. (2003). Tobacco use in rural areas: A literature review. Rural healthy people 2010: A companion document to healthy people 2010. Volume 2. College Station, TX: The Texas A&M University System Health Science Center, School of Rural Public Health, Southwest Rural Health Research Center. U.S. Census Bureau. (2009). Census regions and divisions of the United States. Retrieved from http://www.census.gov/geo/www/us_regdiv.pdf U.S. Department of Health and Human Services, Agency for Healthcare Research and Quality. (2001). AHRQ quality indicators Guide to prevention quality indicators: Hospital admission for ambulatory care sensitive conditions (AHRQ Publication No. 02-R0203). Rockville, MD: Author. U.S. Department of Health and Human Services, Agency for Healthcare Research and Quality. Healthcare Cost and Utilization Project (HCUPnet). (2009, September 13) National and regional estimates on hospital use for all patients from the HCUP nationwide inpatient sample (NIS). Retrieved from http://hcup.ahrq.gov/HcupNet.asp?Id=2496BDF1ED5C5CBE&Form=SelPat&JS=&Action=%3E%3ENext%3E%3E&_InPatChar=Yes&_InHospChar=Yes&_PatChar=AGE. U.S. Department of Health and Human Services, Centers for Medicare and Medicaid Services (CMS). (2006). Medicare enrollment-all beneficiaries: As of July 2006. Retrieved from http://www.cms.hhs.gov/MedicareEnRpts/Downloads/06All.pdf U.S. Department of Health and Human Services, CMS Office of Public Affairs. (2009, July 9). CMS expands information for . Fact sheet. Washington, DC: Author. U.S. Department of Health and Human Services, National Institutes of Health. National Heart Lung and Blood Institute. (2007, June). Morbidity and mortality: 2007 chartbook on cardiovascular, lung and blood diseases. Washington, DC: Author. White House. (2009). The agenda health care. Retrieved from http://www.whitehouse.gov/agenda/health_care/

Upper M idwest Rural H ealth Research Center F inal Report #12
26
World Health Organization. (2008). The global burden of disease: 2004 update. Retrieved from http://www.who.int/healthinfo/global_burden_disease/2004_report_update/ en/

Upper M idwest Rural H ealth Research Center F inal Report #12
27
Appendix A : 3M Potentially Preventable Readmission (PPR) software The 3M Potentially Preventable Readmission (PPR) software offers specific advantages when estimating readmissions. First, it identifies clinically related readmissions using diagnoses and procedures performed to assign an APR-DRG for the admission. If the APR-DRG of an admission does not match that of the previous admission, it is not considered a clinically related readmission. This excludes admissions where a person may have first been hospitalized for a disease such as diabetes, but then was hospitalized for a car accident. They may still have diabetes as a secondary diagnosis, but the program identifies that diabetes is not the reason for admission and a different APR-DRG is assigned. The software can also identify if the admission is caused by an underlying disease even if another diagnosis or procedure is listed. Second, the PPR software identifies chains or a series of readmissions. If a patient is repeatedly readmitted to a hospital within a given time period, that is considered one event or a chain of admissions. For example, if a person is readmitted 10 days following an initial admission, then again 14 days later, then 19 days later, then 32 days later, these form a chain of three admissions with one initial admission with a 30-day PPR, two readmissions in the chain, and one lone admission. This avoids counting an extra readmission when it was still related to just one initial admission. If this were for a 60-day PPR, there would be one chain with four admissions. The third way the PPR software controls for readmissions is to exclude types of admissions that are not true readmissions. These include admissions for trauma, cancer, burns, obstetrics, where the person had left against medical advice, or admissions to non-acute care facilities. If the patient is transferred or dies, the admission is also excluded. This avoids counting preventable type admissions, such as accidents, or counting admissions twice, such as when a transfer occurs (only the receiving hospital is counted), or counting admissions where it is impossible for the person to be readmitted, such as when they died at initial admission. The 3M PPR program is also versatile for the user. The number of days to readmission is selected by the programmer. The user can also specify types of hospitals to be excluded. Data files into the program and output files are easily formatted and useable. The 3M program also provides information about the admission in the output, including the type of admission, the placement in the readmission chain, and the number of chains per patient.
Upper M idwest Rural H ealth Research Center F inal Report #12
28
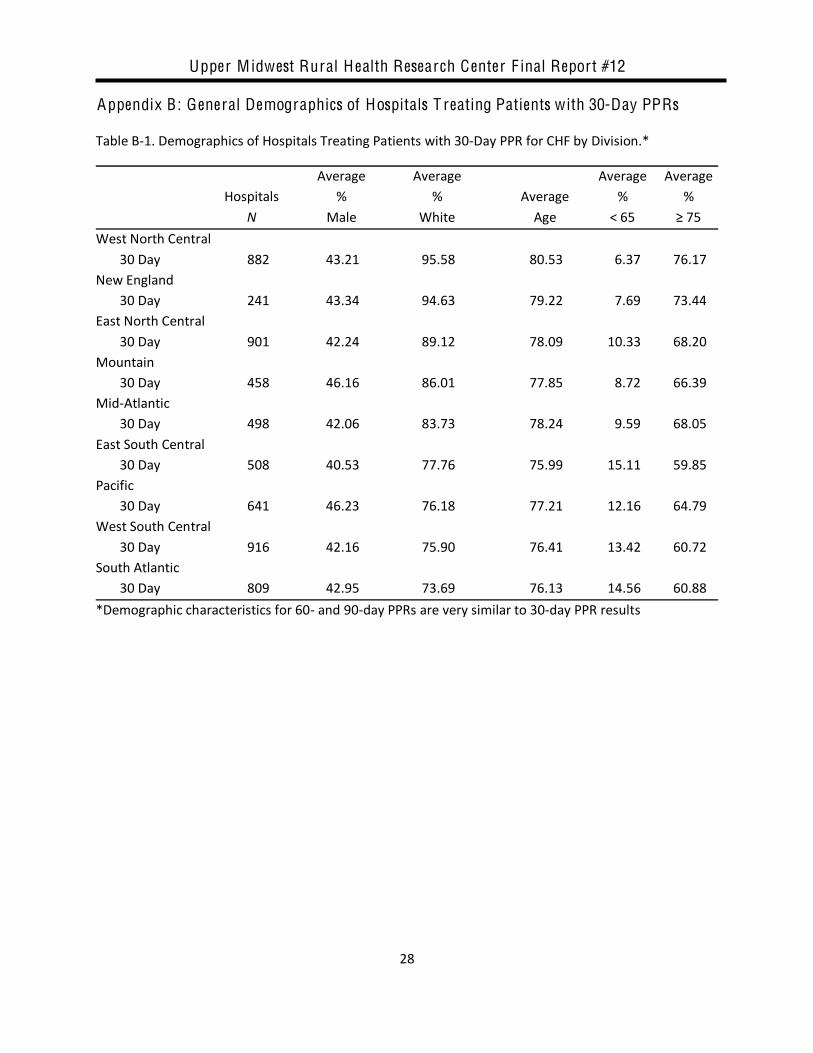
Appendix B: General Demographics of Hospitals T reating Patients with 30-Day PPRs Table B-‐1. Demographics of Hospitals Treating Patients with 30-‐Day PPR for CHF by Division.* Average Average Average Average Hospitals % % Average % % N Male White Age < 65 75 West North Central
30 Day 882 43.21 95.58 80.53 6.37 76.17 New England
30 Day 241 43.34 94.63 79.22 7.69 73.44 East North Central
30 Day 901 42.24 89.12 78.09 10.33 68.20 Mountain
30 Day 458 46.16 86.01 77.85 8.72 66.39 Mid-‐Atlantic
30 Day 498 42.06 83.73 78.24 9.59 68.05 East South Central
30 Day 508 40.53 77.76 75.99 15.11 59.85 Pacific
30 Day 641 46.23 76.18 77.21 12.16 64.79 West South Central
30 Day 916 42.16 75.90 76.41 13.42 60.72 South Atlantic
30 Day 809 42.95 73.69 76.13 14.56 60.88 *Demographic characteristics for 60-‐ and 90-‐day PPRs are very similar to 30-‐day PPR results

Upper M idwest Rural H ealth Research Center F inal Report #12
29
Table B-‐2. Demographics of Hospitals Treating Patients with 30-‐Day PPR for Pneumonia by Division.* Average Average Average Average Hospitals % % Average % % N Male White Age < 65 75 West North Central
30 Day 942 47.11 95.79 78.82 9.28 70.42 New England
30 Day 249 46.95 96.07 77.36 11.39 65.73 East North Central
30 Day 925 45.43 90.79 76.56 12.89 63.58 Mountain
30 Day 476 50.15 86.39 75.89 13.56 59.73 Mid-‐Atlantic
30 Day 502 45.26 85.73 76.84 12.88 64.61 East South Central
30 Day 518 42.60 84.70 74.16 18.02 54.28 Pacific
30 Day 658 47.42 78.29 76.22 14.42 62.48 West South Central
30 Day 922 43.10 82.69 75.88 13.85 59.56 South Atlantic
30 Day 826 44.87 80.88 75.07 16.21 58.49 *Demographic characteristics for 60-‐ and 90-‐day PPRs are very similar to 30-‐day PPR results
Upper M idwest Rural H ealth Research Center F inal Report #12
30
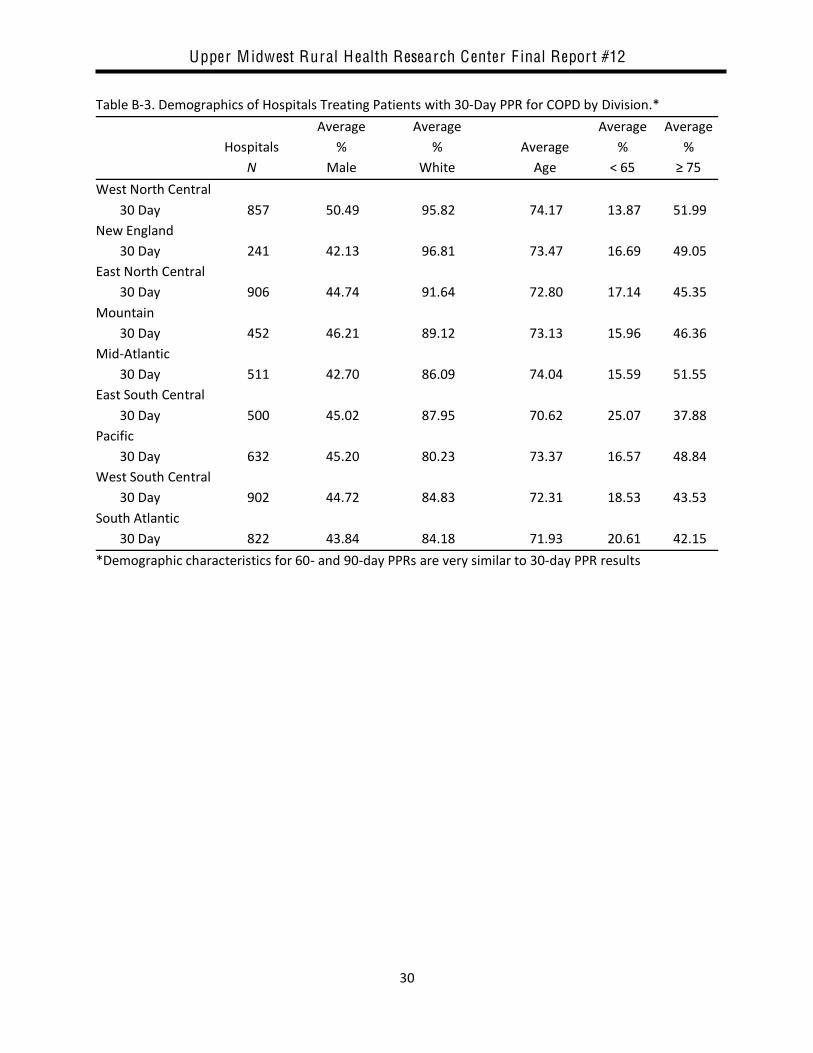
Table B-‐3. Demographics of Hospitals Treating Patients with 30-‐Day PPR for COPD by Division.* Average Average Average Average Hospitals % % Average % % N Male White Age < 65 75 West North Central
30 Day 857 50.49 95.82 74.17 13.87 51.99 New England
30 Day 241 42.13 96.81 73.47 16.69 49.05 East North Central
30 Day 906 44.74 91.64 72.80 17.14 45.35 Mountain
30 Day 452 46.21 89.12 73.13 15.96 46.36 Mid-‐Atlantic
30 Day 511 42.70 86.09 74.04 15.59 51.55 East South Central
30 Day 500 45.02 87.95 70.62 25.07 37.88 Pacific
30 Day 632 45.20 80.23 73.37 16.57 48.84 West South Central
30 Day 902 44.72 84.83 72.31 18.53 43.53 South Atlantic
30 Day 822 43.84 84.18 71.93 20.61 42.15 *Demographic characteristics for 60-‐ and 90-‐day PPRs are very similar to 30-‐day PPR results

Upper M idwest Rural H ealth Research Center F inal Report #12
31
Table B-‐4. Demographics of Hospitals Treating Patients with 30-‐Day PPR for UTI by Division.* Average Average Average Average Hospitals % % Average % % N Male White Age < 65 75 West North Central
30 Day 824 31.89 95.03 78.79 10.26 72.35 New England
30 Day 227 32.64 96.47 78.56 11.12 72.37 East North Central
30 Day 853 30.13 90.42 77.88 11.38 69.63 Mountain
30 Day 425 31.31 85.34 76.43 12.60 64.88 Mid-‐Atlantic
30 Day 472 30.97 84.85 78.09 11.56 70.49 East South Central
30 Day 488 25.10 82.12 76.15 15.54 63.70 Pacific
30 Day 618 31.00 77.95 76.59 14.22 65.75 West South Central
30 Day 874 29.40 78.31 77.34 12.25 66.69 South Atlantic
30 Day 776 28.63 77.77 77.23 12.66 67.23 *Demographic characteristics for 60-‐ and 90-‐day PPRs are very similar to 30-‐day PPR results

Upper M idwest Rural H ealth Research Center F inal Report #12
32
Appendix C : Average Sever ity Scores of Urban PPS, Rural PPS, and C A H hospitals with 30-, 60-, and 90-Day PPRs by division. Table C-‐1. Congestive Heart Failure: Average Severity Scores of Urban PPS, Rural PPS, and CAH Hospitals with 30-‐, 60-‐, and 90-‐Day PPR by Division. Region Urban PPS Rural PPS CAH
Days N Mean (SD) N Mean (SD) N Mean (SD) New England 30 Days 143 .774 (.090) 59 .730 (.102) 39 .668 (.073) 60 Days* 142 .880 (.198) 59 .787 (.099) 39 .718 (.072) 90 Days* 142 .844 (.213) 59 .750 (.096) 39 .692 (.066)
Mid-‐Atlantic 30 Days 372 .758 (.087) 99 .727 (.070) 27 .654 (.082) 60 Days 372 .888 (.200) 99 .784 (.066) 27 .700 (.078) 90 Days* 371 .852 (.202) 99 .746 (.064) 27 .671 (.076)
South Atlantic 30 Days 460 .750 (.102) 249 .686 (.117) 100 .610 (.095) 60 Days 457 .875 (.236) 245 .778 (.134) 100 .690 (.084) 90 Days 456 .838 (.239) 244 .747 (.139) 100 .668 (.081)
East South Central 30 Days 174 .717 (.097) 255 .681 (.100) 79 .628 (.078) 60 Days 173 .847 (.188) 253 .772 (.145) 79 .703 (.068) 90 Days 173 .811 (.188) 252 .739 (.153) 79 .677 (.069)
East North Central 30 Days 430 .750 (.108) 257 .681 (.103) 214 .622 (.070) 60 Days 430 .870 (.248) 255 .746 (.103) 214 .688 (.058) 90 Days 428 .832 (.249) 252 .714 (.097) 214 .665 (.055)
West South Central 30 Days 423 .724 (.124) 330 .673 (.120) 163 .599 (.100) 60 Days 421 .913 (.266) 326 .784 (.221) 163 .678 (.084) 90 Days 419 .882 (.271) 324 .749 (.211) 163 .656 (.080)
Pacific 30 Days 417 .713 (.120) 117 .657 (.122) 107 .590 (.089) 60 Days 416 .812 (.170) 115 .739 (.159) 107 .661 (.088) 90 Days 414 .777 (.165) 115 .707 (.159) 106 .640 (.092)
West North Central 30 Days 153 .709 (.095) 314 .634 (.136) 415 .590 (.081) 60 Days 153 .815 (.224) 308 .732 (.152) 415 .665 (.072) 90 Days 152 .775 (.218) 305 .706 (.149) 415 .644 (.071)
Mountain 30 Days 173 .714 (.118) 137 .620 (.112) 148 .565 (.090) 60 Days 171 .850 (.314) 135 .696 (.115) 147 .635 (.080) 90 Days 170 .800 (.266) 133 .668 (.114) 147 .612 (.079)
* Rural PPS and CAH mean severity scores not significantly different; all others different (p < .05)

Upper M idwest Rural H ealth Research Center F inal Report #12
33
Table C-‐2. Pneumonia: Average Severity Scores of Urban PPS, Rural PPS, and CAH Hospitals with 30-‐, 60-‐, and 90-‐Day PPR by Division. Region Urban PPS Rural PPS CAH
Days N Mean (SD) N Mean (SD) N Mean (SD) Mid-‐Atlantic 30 Days 371 .932 (.204) 104 .810 (.156) 27 .687 (.112) 60 Days 371 1.013 (.215) 104 .897 (.153) 27 .775 (.115) 90 Days 370 1.003 (.211) 102 .894 (.146) 27 .778 (.115)
New England 30 Days 150 .919 (.164) 60 .791 (.149) 39 .691 (.083) 60 Days 150 1.006 (.176) 60 .880 (.163) 39 .788 (.083) 90 Days* 149 .997 (.175) 59 .876 (.159) 39 .798 (.086)
West South Central 30 Days 422 .953 (.325) 336 .759 (.242) 164 .648 (.110) 60 Days 419 1.042 (.340) 334 .840 (.250) 164 .732 (.115) 90 Days 416 1.032 (.331) 334 .841 (.249) 164 .740 (.115)
East North Central 30 Days 432 .905 (.251) 278 .753 (.155) 215 .667 (.084) 60 Days 432 .992 (.262) 276 .841 (.159) 215 .759 (.085) 90 Days 432 .986 (.263) 276 .843 (.160) 215 .771 (.084)
South Atlantic 30 Days 468 .890 (.216) 257 .753 (.131) 101 .633 (.101) 60 Days 468 .977 (.237) 256 .837 (.135) 101 .719 (.108) 90 Days 468 .971 (.235) 253 .833 (.132) 101 .726 (.106)
East South Central 30 Days 178 .867 (.253) 261 .748 (.167) 79 .643 (.089) 60 Days 177 .953 (.256) 259 .836 (.183) 79 .727 (.090) 90 Days 176 .950 (.258) 259 .832 (.183) 79 .731 (.089)
Pacific 30 Days 423 .877 (.220) 126 .706 (.157) 109 .599 (.110) 60 Days 422 .962 (.225) 125 .796 (.149) 109 .689 (.114) 90 Days 422 .959 (.222) 125 .798 (.146) 109 .704 (.116)
West North Central 30 Days 158 .848 (.245) 368 .691 (.182) 416 .641 (.093) 60 Days 158 .932 (.254) 365 .782 (.183) 416 .735 (.097) 90 Days 158 .929 (.250) 359 .791 (.184) 416 .749 (.097)
Mountain 30 Days 176 .860 (.332) 150 .656 (.171) 150 .579 (.107) 60 Days 175 .952 (.347) 148 .746 (.175) 150 .669 (.113) 90 Days 175 .947 (.340) 148 .750 (.176) 150 .680 (.112)
* Rural PPS and CAH mean severity scores not significantly different; all others different (p < .05)
Upper M idwest Rural H ealth Research Center F inal Report #12
34
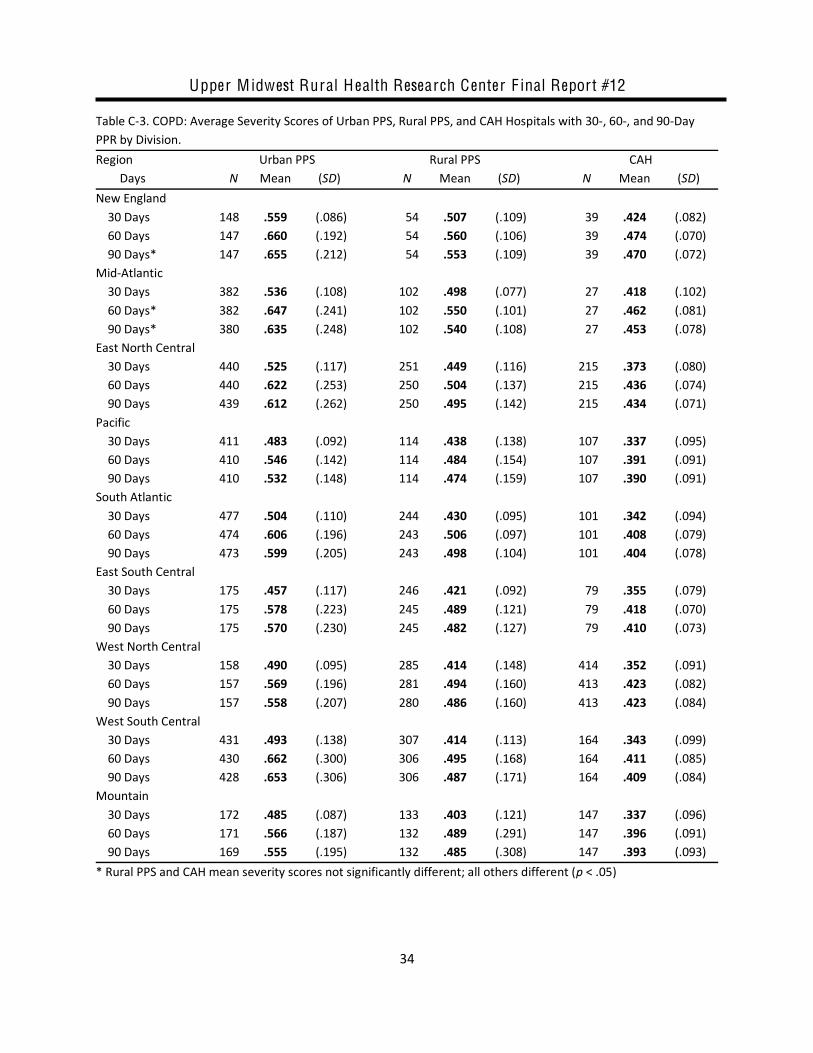
Table C-‐3. COPD: Average Severity Scores of Urban PPS, Rural PPS, and CAH Hospitals with 30-‐, 60-‐, and 90-‐Day PPR by Division. Region Urban PPS Rural PPS CAH
Days N Mean (SD) N Mean (SD) N Mean (SD) New England 30 Days 148 .559 (.086) 54 .507 (.109) 39 .424 (.082) 60 Days 147 .660 (.192) 54 .560 (.106) 39 .474 (.070) 90 Days* 147 .655 (.212) 54 .553 (.109) 39 .470 (.072)
Mid-‐Atlantic 30 Days 382 .536 (.108) 102 .498 (.077) 27 .418 (.102) 60 Days* 382 .647 (.241) 102 .550 (.101) 27 .462 (.081) 90 Days* 380 .635 (.248) 102 .540 (.108) 27 .453 (.078)
East North Central 30 Days 440 .525 (.117) 251 .449 (.116) 215 .373 (.080) 60 Days 440 .622 (.253) 250 .504 (.137) 215 .436 (.074) 90 Days 439 .612 (.262) 250 .495 (.142) 215 .434 (.071)
Pacific 30 Days 411 .483 (.092) 114 .438 (.138) 107 .337 (.095) 60 Days 410 .546 (.142) 114 .484 (.154) 107 .391 (.091) 90 Days 410 .532 (.148) 114 .474 (.159) 107 .390 (.091)
South Atlantic 30 Days 477 .504 (.110) 244 .430 (.095) 101 .342 (.094) 60 Days 474 .606 (.196) 243 .506 (.097) 101 .408 (.079) 90 Days 473 .599 (.205) 243 .498 (.104) 101 .404 (.078)
East South Central 30 Days 175 .457 (.117) 246 .421 (.092) 79 .355 (.079) 60 Days 175 .578 (.223) 245 .489 (.121) 79 .418 (.070) 90 Days 175 .570 (.230) 245 .482 (.127) 79 .410 (.073)
West North Central 30 Days 158 .490 (.095) 285 .414 (.148) 414 .352 (.091) 60 Days 157 .569 (.196) 281 .494 (.160) 413 .423 (.082) 90 Days 157 .558 (.207) 280 .486 (.160) 413 .423 (.084)
West South Central 30 Days 431 .493 (.138) 307 .414 (.113) 164 .343 (.099) 60 Days 430 .662 (.300) 306 .495 (.168) 164 .411 (.085) 90 Days 428 .653 (.306) 306 .487 (.171) 164 .409 (.084)
Mountain 30 Days 172 .485 (.087) 133 .403 (.121) 147 .337 (.096) 60 Days 171 .566 (.187) 132 .489 (.291) 147 .396 (.091) 90 Days 169 .555 (.195) 132 .485 (.308) 147 .393 (.093)
* Rural PPS and CAH mean severity scores not significantly different; all others different (p < .05)

Upper M idwest Rural H ealth Research Center F inal Report #12
35
Table C-‐4. UTI: Average Severity Scores of Urban PPS, Rural PPS, and CAH Hospitals with 30-‐, 60-‐, and 90-‐Day PPR by Division. Region Urban PPS Rural PPS CAH
Days N Mean (SD) N Mean (SD) N Mean (SD) West South Central 30 Days 402 .871 (.333) 308 .749 (.207) 164 .642 (.110) 60 Days 397 .937 (.365) 307 .812 (.223) 164 .704 (.132) 90 Days 394 .905 (.361) 305 .792 (.224) 163 .710 (.133)
Mid-‐Atlantic 30 Days 348 .806 (.153) 97 .735 (.086) 27 .661 (.095) 60 Days* 348 .869 (.169) 95 .788 (.104) 27 .711 (.106) 90 Days* 348 .835 (.173) 95 .758 (.105) 27 .714 (.113)
East South Central 30 Days 159 .756 (.117) 250 .721 (.149) 79 .667 (.075) 60 Days 158 .810 (.125) 249 .783 (.162) 79 .733 (.092) 90 Days* 157 .783 (.137) 246 .757 (.161) 79 .735 (.099)
South Atlantic 30 Days 438 .775 (.153) 237 .721 (.105) 101 .659 (.088) 60 Days 437 .835 (.171) 237 .778 (.120) 101 .723 (.099) 90 Days* 434 .803 (.171) 237 .755 (.124) 101 .728 (.097)
New England 30 Days* 138 .800 (.246) 50 .707 (.102) 39 .654 (.082) 60 Days* 138 .872 (.265) 50 .772 (.124) 39 .711 (.101) 90 Days* 138 .853 (.269) 50 .751 (.134) 39 .739 (.108)
East North Central 30 Days 400 .768 (.166) 239 .685 (.121) 214 .651 (.079) 60 Days* 400 .827 (.180) 237 .740 (.136) 214 .707 (.086) 90 Days* 400 .800 (.196) 235 .719 (.137) 214 .725 (.090)
West North Central 30 Days 148 .714 (.115) 263 .659 (.138) 413 .599 (.091) 60 Days 147 .765 (.116) 258 .719 (.165) 413 .655 (.106) 90 Days 147 .745 (.120) 256 .713 (.168) 413 .681 (.113)
Pacific 30 Days 408 .744 (.135) 103 .640 (.129) 107 .588 (.090) 60 Days 408 .800 (.153) 103 .683 (.141) 107 .633 (.107) 90 Days* 407 .770 (.154) 103 .659 (.142) 106 .645 (.103)
Mountain 30 Days 157 .695 (.096) 122 .593 (.108) 146 .560 (.102) 60 Days* 155 .747 (.117) 121 .632 (.125) 146 .601 (.118) 90 Days* 155 .719 (.134) 121 .613 (.122) 145 .602 (.127)
*Rural PPS and CAH; Urban PPS and Rural PPS scores not different; all others different (p < .05)

Upper M idwest Rural H ealth Research Center F inal Report #12
36
Appendix D: Sever ity-Adjusted Average Hospital 60- and 90-Day PPR Rates for Urban PPS, Rural PPS and C A H Hospitals by Division Table D-‐1. Severity-‐Adjusted Average Hospital 60-‐ and 90-‐Day PPR Rates per 1,000 CHF Admissions for Rural PPS Hospitals and CAHs Compared to Urban PPS Hospitals by Census Division Census Division Urban PPS Rural PPS CAHs
Days Adjusted (Unadjusted) Adjusted (Unadjusted) East South Central 60 Days 263 319** (309)** 307** (302)** 90 Days 323 362** (361)** 362** (357)*
South Atlantic 60 Days 286 330** (293) 286 (297) 90 Days 336 397** (358)* 333 (346)
West South Central 60 Days 288 292 (310) 300 (300) 90 Days 344 371* (373)* 330 (350)
West North Central 60 Days 260 282 (291)* 263 (262) 90 Days 305 327 (335)* 315 (310)
New England 60 Days 277 261 (274) 268 (258) 90 Days 327 305 (322) 308 (303)
Mountain 60 Days 254 246 (252) 220* (248) 90 Days 284 291 (290) 267 (289)
Mid-‐Atlantic 60 Days 299 291 (288) 269* (271)* 90 Days 350 335 (334) 307** (309)**
Pacific 60 Days 268 215** (235)* 212** (247) 90 Days 309 254** (274)* 302 (302)
East North Central 60 Days 290 254** (262)* 260** (260)** 90 Days 335 307* (318) 305** (304)**
*p < .05; **p < .01

Upper M idwest Rural H ealth Research Center F inal Report #12
37
Table D-‐2. Severity-‐Adjusted Average Hospital 60-‐ and 90-‐Day PPR Rates per 1,000 Pneumonia Admissions for Rural PPS and CAHs Compared to Urban PPS Hospitals by Census Division Region Urban PPS Rural PPS CAH
Days Adjusted (Unadjusted) Adjusted (Unadjusted) West South Central 60 Days 209 247** (227) 198 (198) 90 Days 243 296** (274)* 211** (234)
East South Central 60 Days 201 242** (234)* 241** (220) 90 Days 245 289** (278)* 288** (264)
Mountain 60 Days 187 231* (187) 193 (171) 90 Days 212 251* (215) 206 (196)
West North Central 60 Days 193 220* (208) 173* (180) 90 Days 241 261 (246) 212* (215)*
East North Central 60 Days 206 223 (206) 199 (183)* 90 Days 240 243 (238) 240 (218)**
South Atlantic 60 Days 198 207 (211) 211 (210) 90 Days 239 231 (243) 255 (241)
Pacific 60 Days 203 182 (184) 151** (161)** 90 Days 239 219 (217) 196** (186)**
Mid-‐Atlantic 60 Days 227 197* (211) 204* (199)* 90 Days 266 268 (249) 248 (237)*
New England 60 Days 212 151** (165)* 181* (182)* 90 Days 235 236 (223) 214* (213)*
*p < .05; **p < .01

Upper M idwest Rural H ealth Research Center F inal Report #12
38
Table D-‐3. Severity-‐Adjusted Average Hospital 60-‐ and 90-‐Day PPR Rates per 1,000 COPD Admissions for Rural PPS and CAH Compared to Urban PPS by Census Division Census Division Urban PPS Rural PPS CAH
Days Adjusted (Unadjusted) Adjusted (Unadjusted) South Atlantic 60 Days 251 306** (281)* 253 (247) 90 Days 295 353** (325)* 297 (292)
Mountain 60 Days 212 222 (227) 272** (241)* 90 Days 242 265 (272) 302** (278)*
East South Central 60 Days 257 268 (261) 263 (257) 90 Days 304 317 (309) 312 (317)
West South Central 60 Days 263 277 (261) 254 (249) 90 Days 310 324 (313) 297 (296)
West North Central 60 Days 246 256 (252) 251 (240) 90 Days 286 314 (308) 286 (286)
Pacific 60 Days 250 235 (241) 190** (221)* 90 Days 295 286 (284) 246** (271)
East North Central 60 Days 268 258 (251) 234** (238)** 90 Days 311 304 (295) 265** (285)*
New England 60 Days 257 226* (220)* 225** (223)** 90 Days 308 259** (254)** 273** (272)**
Mid-‐Atlantic 60 Days 289 231** (258)* 261* (255)* 90 Days 330 280** (304)* 300* (291)*
*p < .05; **p < .01

Upper M idwest Rural H ealth Research Center F inal Report #12
39
Table D-‐4. Severity-‐Adjusted Average Hospital 60-‐ and 90-‐Day PPR rates per 1,000 UTI Admissions for Rural PPS Hospitals and CAHs Compared to Urban PPS Hospitals by Census Division. Census Division Urban PPS Rural PPS CAH
Days Adjusted (Unadjusted) Adjusted (Unadjusted) East South Central 60 Days 193 224** (220)** 261** (253)** 90 Days 225 258** (255)** 293** (289)**
West South Central 60 Days 214 224 (223) 244** (223) 90 Days 242 276** (268)* 284** (264)*
Mountain 60 Days 152 168 (156) 197** (182)* 90 Days 187 205 (187) 179 (200)
Pacific 60 Days 186 160 (171) 177 (180) 90 Days 221 220 (206) 199 (204)
South Atlantic 60 Days 203 207 (209) 184* (200) 90 Days 236 242 (245) 228 (237)
West North Central 60 Days 192 185 (177) 204 (175)* 90 Days 217 226 (220) 218 (208)
East North Central 60 Days 195 206 (184) 202 (188) 90 Days 229 225 (218) 233 (222)
New England 60 Days 208 209 (208) 150** (174)* 90 Days 247 238 (246) 214* (220)
Mid-‐Atlantic 60 Days 212 183** (188)** 130** (185)* 90 Days 243 219** (221)** 221 (212)*
*p < .05; **p < .01