geographic description and analysis of factors affecting
TRANSCRIPT
Geographic Description and Analysis of Factors
Affecting the Demand for, and Supply of General
Practice Services in New Zealand
A thesis
submitted in fulfilment
of the requirements for the degree
of
Bachelor of Medical Science with Honours
at
The University of Otago
by
Ursula Poole
2014
ii
Table of Contents Table of Figures ........................................................................................................................ vi
List of Tables ........................................................................................................................... vii
Acknowledgements ................................................................................................................ viii
Abstract ..................................................................................................................................... ix
Abbreviations ............................................................................................................................. x
Definition of Terms................................................................................................................... xi
1 Introduction ........................................................................................................................ 1
1.1 Crisis in GP supply ...................................................................................................... 1
1.2 International GP shortages .......................................................................................... 3
1.3 Definitions of Accessibility to Healthcare .................................................................. 4
1.3.1 Health Inequities Due to Poor Accessibility ........................................................ 6
1.4 Barriers to Accessibility .............................................................................................. 7
1.4.1 Functional Barriers ............................................................................................... 7
1.4.2 Financial Barriers ................................................................................................. 8
1.4.3 Cultural and Information Barriers ........................................................................ 8
1.4.4 Geographical Barriers .......................................................................................... 9
1.5 GIS and Primary Care Research .................................................................................. 9
1.6 Research Objectives .................................................................................................. 11
1.7 Thesis Structure ......................................................................................................... 12
2 Primary Care: Definition, Challenges and Solutions ....................................................... 14
2.1 International Definitions of Primary Health Care ..................................................... 14
2.2 Primary Health Care in New Zealand ....................................................................... 16
2.2.1 The Primary Health Care Strategy ..................................................................... 16
2.2.2 Effects of the PHCS ........................................................................................... 19
2.2.3 Future Challenges for NZ Primary Health Care ................................................ 19
2.3 Measurement of GP supply ....................................................................................... 20

iii
2.4 Workforce issues affecting GP supply ...................................................................... 21
2.4.1 Profession/Speciality Imbalances ...................................................................... 21
2.4.2 Gender Imbalances and the Increasing Feminisation of the GP workforce ....... 22
2.4.3 Geographic Imbalances and the Rural GP Workforce ....................................... 23
2.4.4 Role of nurses in rural primary care practice ..................................................... 25
2.4.5 E-health technologies ......................................................................................... 25
2.4.6 International Medical Graduates ........................................................................ 26
2.4.7 Māori and Pacific Health Workforce Development .......................................... 27
2.5 Medical Education and Training Capacity of General Practices .............................. 29
2.5.1 Teaching Practices and Increased Student Numbers ......................................... 29
2.5.2 Medical Student Perceptions of General Practice .............................................. 31
2.5.3 Medical School Social Accountability ............................................................... 33
2.6 Definitions of Need for Health Care ......................................................................... 34
3 GIS and Primary Care Research ...................................................................................... 38
3.1 Definition of GIS ....................................................................................................... 38
3.2 GIS Uses in the Geography of Health ....................................................................... 38
3.2.1 Examples of Web-Based GIS applications in Health ........................................ 40
3.3 International GIS applications in Primary Care ........................................................ 41
3.3.1 International Examples of Mixed Methods in Primary Care Research Using GIS
42
3.4 GIS Primary Health Applications in NZ ................................................................... 43
3.5 Barriers to Use of GIS in Health Settings ................................................................. 46
4 Methods............................................................................................................................ 48
4.1 Mixed Methods Design ............................................................................................. 48
4.2 Ethical Considerations ............................................................................................... 49
4.3 Participants ................................................................................................................ 50
4.4 Data collection ........................................................................................................... 50

iv
4.5 Geospatial analyses: Quantitative data ...................................................................... 50
4.5.1 Geocoding .......................................................................................................... 51
4.5.2 Census Meshblocks ............................................................................................ 51
4.5.3 General Practices ............................................................................................... 52
4.5.4 Teaching Practices ............................................................................................. 54
4.5.5 Medical Student Origin ...................................................................................... 54
4.6 Qualitative data ......................................................................................................... 54
5 Results .............................................................................................................................. 55
5.1 Quantitative Geospatial results.................................................................................. 55
5.1.1 General Practices ............................................................................................... 58
5.1.2 Teaching Practices ............................................................................................. 66
5.1.3 Medical Student Origin ...................................................................................... 71
5.2 Qualitative results ...................................................................................................... 74
5.2.1 Difficulties with context, language and inputting data ...................................... 74
5.2.2 Concerns over anonymity and information privacy in geotechnologies ........... 76
6 Discussion ........................................................................................................................ 78
6.1 General Practices ....................................................................................................... 78
6.1.1 Limitations ......................................................................................................... 79
6.1.2 Research Implications ........................................................................................ 81
6.2 Teaching Practices ..................................................................................................... 81
6.2.1 Limitations ......................................................................................................... 82
6.2.2 Research Implications ........................................................................................ 82
6.3 Medical Student Origin ............................................................................................. 83
6.3.1 Ethnicity ............................................................................................................. 83
6.3.2 NZDep Scores .................................................................................................... 83
6.3.3 Research Implications ........................................................................................ 84
6.3.4 Limitations ......................................................................................................... 85
v
6.4 Feasibility of GIS in Primary Care Research ............................................................ 86
Bibliography ............................................................................................................................ 88
Appendix A ............................................................................................................................ 107
Appendix B ............................................................................................................................ 108

Table of Figures
Figure 2.1: Structure of Primary Health Care in NZ .............................................................. 17
Figure 2.2: Deprivation Variables in the NZDep Score 2013 ................................................ 36
Figure 4.1: Action Research Spiral ......................................................................................... 49
Figure 5.1: Population density of NZ: 2013 Census Data ....................................................... 56
Figure 5.2: NZDep Scores 2013 by meshblock ....................................................................... 57
Figure 5.3: Thirty minute service areas around all NZ general practices ................................ 59
Figure 5.4: Average number of General Practices in the South Island per NZDep Score 2013
.................................................................................................................................................. 60
Figure 5.5: Density of General Practices over NZ ................................................................... 62
Figure 5.6: Density of General Practices over the Greater Auckland Area ............................. 63
Figure 5.7: Location of General Practices in Counties Manukau DHB with the highest
deprivation scores and population density as represented by meshblocks .............................. 65
Figure 5.8: University of Otago Teaching Practices with NZDep Score 2013 ....................... 66
Figure 5.9: Teaching Practice Locations for the University of Otago Schools of Medicine 2014
within each DHB ...................................................................................................................... 67
Figure 5.10: Teaching Practices in the Dunedin urban centre compared to high deprivation
areas ......................................................................................................................................... 69
Figure 5.11: Teaching Practices in the Porirua region compared to high deprivation areas ... 70
Figure 5.12: Percentage of 2nd year medical students from NZDep Scored areas compared to
NZ 18-24 year olds .................................................................................................................. 71
Figure 5.13: Ethnic Origin of 2nd Year Medical Students ...................................................... 72
Figure 5.14: Ratio of Medical Students Admitted compared to the 18-24 year old population
resident within the DHB boundary with the DHB FTE GP ratio ............................................ 73

vii
List of Tables
Table 1: Percentage of General Practices per DHB that trained 4th-5th year medical students
in 2014 from the University of Otago Medical Schools .......................................................... 68
viii
Acknowledgements
For this project to be successful many people were involved, particularly during the data
gathering phase.
Thanks firstly to the staff of the Dunedin General Practice and Rural Health Department for
being so accommodating and helpful with all manner of requests. In particular I would like to
thank Associate Professor Chyrs Jaye, Jessica Young, Jo-Ann Bremner, Graham Arnold and
Tony Egan.
The following people were extremely helpful in supplying me with their respective teaching
practice datasets. This project would have been a lot less rich without the inclusion of this.
From the Dunedin School I would like to thank Frances Dawson, Dr Jim Ross and Janine
Lucas. From the Christchurch School I would like to thank Dr Ben Hudson, Dr Lynette
Murdoch and Trish Clements and from the Wellington School I would like to thank Ingrid
Dainty, Jo Meaclem, Associate Professor Sue Pullon, Dr Lynn McBain and Katarina Kontopos.
I was very grateful to be able to fulfil the third research objective of mapping the geographical
origin of medical students. For this to be possible I owe much gratitude to Beth Stephenson,
Tony Zaharic, Andrea Howard, David Thomson and Tracey Neville from the University of
Otago, and to Professor Philippa Poole, Associate Professor Warwick Bagg and Ian Wood from
the Faculty of Medical and Health Sciences at the University of Auckland.
Much thanks also to Professor Peter Crampton for supplying me with the NZDep score
breakdowns for age categories; this was much appreciated.
I was lucky enough to have the technical support of two GIS specialists from the University of
Otago School of Planning, Bevan Pelvin and Dr Tony Moore. Bevan assisted me with getting
to grips with the software through online tutorials, without these I would have made much
slower progress this year. Dr Tony Moore was an immense help during the analysis phase of
the project when I had the data in the GIS but wasn’t sure on how best to analyse and visualise
what I had. A huge thanks to both of them for their patience and help throughout this year.
And finally a huge thank you to my two supervisors, Dr Martyn Williamson and Dr Alison
Belton; your interest in the thesis topic made this year incredibly enjoyable, so many thanks to
you all!

ix
Abstract
General Practitioner (GP) shortages are an international problem. NZ is simultaneously
experiencing an increase in GP demand due to a rising chronic health burden and a decrease in
GP supply due to problems with recruitment, retention and retirement. This study used a mixed
methods research methodology, mixing qualitative Action Research principles with
quantitative analysis. These methods were applied to data collected on the location of 1064
general practices, 186 teaching practices and 495 medical students’ origin in order to determine
the feasibility of utilising GIS technology in primary care research. This geographic data was
combined with demographic data from the 2013 census in a GIS database to analyse for factors
related to need and supply of general practice services. The network analysis has produced the
most current and up-to-date picture of general practice accessibility in New Zealand. The data
resulting from these analysis comprises of general practices or ‘points of supply’, linked to
thirty-minute service area polygons containing 2013 census demographic information
including the NZDep Score. This method has shown that physical accessibility to general
practices varies considerably throughout New Zealand but that inaccessibility in the South
Island of NZ is related more to rurality than socio-economic disadvantage. Urbanisation of
both population and health services is having a marked effect upon accessibility for rural
regions. However the presence of clinics in rural areas is reducing the shortage of medical
services and increasing the access of these populations to health professionals. The analysis of
the teaching practice data showed that practices that are located within moderately to high
deprivation areas were more likely to have trained students in 2014. This may have beneficial
effects on GP shortages in high need areas as positive training exposure is linked to a higher
likelihood of selecting General Practice as a speciality. The geographical origin of students is
also associated with future career choices. This study found that the medical students were
more likely to originate from the least deprived regions of NZ so exposure to high need
communities is particularly important. GIS has much to offer primary care research, however
its’ most effective use relies on an understanding of the software, its application to the NZ
context and potential access to a specialist for assistance with data analysis.
x
Abbreviations
DHB- District Health Board
FTE- Full-time Equivalent
GIS- Geographic Information System
GPs – General practitioners
HWNZ – Health Workforce New Zealand
IMG- International Medical Graduate
LINZ- Land Information New Zealand
MOH – Ministry of Health
NP- Nurse Practitioner
NZ – New Zealand
NZDep - New Zealand Deprivation index
OECD- Organisation of Economic Co-operation and Development
PGY1, PGY2 – Postgraduate Year 1, Postgraduate Year 2
PHCS- Primary Health Care Strategy
PHO- Primary Health Organisation
RNS- Rural Nurse Specialists
RNZCGP – Royal New Zealand College of General Practitioners
TI- Trainee Intern
WHO- World Health Organisation

xi
Definition of Terms
Attribute- GIS terminology used to describe aspatial information about a geographic feature
that is stored in a table and connected to the feature by a specific identifier
Capitation- model of health care provider payment in which they are paid according to the
number and demographics of the patients enrolled with them
Co-payment- a payment made by the individual at the time of the GP visit to top-up the
government subsidy to the general practice
Fee-for-service- model of health care provider payment in which they are reimbursed for every
procedure/service they provide for a patient
Full Time Equivalent- based on 40 hour working week e.g., one GP working 60 hours is
equivalent to 1.5 FTEs
Geocoding- a GIS process that converts street level address information into specific latitude
and longitude coordinates to the individual household level
International Medical Graduate- doctors who obtained their primary medical qualification in a
country other than New Zealand
Line- GIS terminology used to describe a series of ordered geographic co-ordinates that may
have no area or are too narrow to be shown as an area at a particular scale e.g. land contours,
street centrelines, rivers or country boundary lines
Locums – doctors who work short-term for more than one DHB and who are not permanently
employed by one DHB
NZDep- NZDep2013 combines nine variables from the 2013 census which reflect eight
dimensions of deprivation. NZDep2013 provides a deprivation score for each meshblock in
New Zealand. The NZDep2013 index of deprivation ordinal scale ranges from 1 to 10, where
1 represents the areas with the least deprived scores and 10 the areas with the most deprived
scores.
Point- GIS terminology used to describe an object represented by a single X,Y co-ordinate e.g.
the location of a general practice or an individual’s house
xii
Polygon- GIS terminology used to describe a feature that represents an area. A polygon has
defined boundary lines and an identification point within its boundary
Polyline- GIS terminology used to describe a line that is made up of a series of line segments
Practice nurses (also called primary health care nurses) are registered nurses with particular
expertise in primary health care practices such as screening, health promotion and preventative
care programmes. They are a key part of the primary health care team.
Primary care- level of care provided by health professionals in general practices; is first point
of access and is personalised with continuity of care
Primary health care- philosophy and level of care promoted by WHO that is based on principles
of social justice and equity. It recognises that personal well-being relies on social, economic,
political and environmental factors
Primary Health Care Strategy – fundamental part of the New Zealand Health and Disability
Strategies that details how primary care should be organised and delivered through non-profit
PHOs
Primary Health Organisations – groups of primary health care providers that were established
through the Primary Health Care Strategy
Public health- level of health care focused on the community, on measuring and analysing
disease, and developing interventions to prevent and/or treat illness
Trainee Intern year – final year before graduation that is mostly spent in clinical learning
situations
Vector- GIS terminology used to specify a method used to store spatial data. Vector data
represents lines or arcs that are defined by specific start and end points that meet at nodes.
These points and nodes have precise X,Y co-ordinates attached to them.
Vocational qualification – A qualification from a medical college vocational training
programme that shows the medical field the person is registered in (e.g. general practice, public
health, anaesthesia

1
1 Introduction
In this section, I present the current picture of GP supply and demand in NZ and overseas;
definitions, measurements and barriers to health care accessibility are outlined; and an
overview of the use of Geographic Information Systems (GIS) in primary health care research
is described.
1.1 Crisis in GP supply
New Zealand is experiencing growing health inequity resulting at least partially from specific
populations suffering from poor access to primary care services (1-3). Maori (4-7), low
socioeconomic population groups (4, 8-10) and rural regions (11-14) have a high, yet unmet
demand for health care. In the 12 months from 2011 to 2012, 27% of NZ adults reported an
unmet need for primary health care services due to an inability to get an appointment with 24
hours at their usual medical centre, or not visiting their GP or after-hours medical service due
to the financial cost (4). The level of unmet need was experienced by 35% of adults in the areas
with the most deprived NZDep scores compared with 23% of adults in areas with the least
deprived scores (8).
This demand for health services is predicted to increase as New Zealand’s population grows in
size, as the ‘baby boomer’ generation ages and the burden of disease from obesity and lifestyle
factors escalates (15-17). Two thirds of New Zealand adults have at least one diagnosed chronic
condition or long-time condition (4). These patients with chronic health conditions and those
with a physical disability have reported an inability to access primary healthcare (18-20). Lack
of personal transport can also cause an unmet need for primary health care (21, 22), particularly
among the elderly, Maori, Pacific peoples and those living in highly deprived and rural areas
(4, 23, 24) as they may be dependent upon walking access or public transport that is erratic,
expensive or non-existent, as in many rural and regional NZ towns.
The demand for GPs in NZ is already high; New Zealanders made approximately 12.2 million
visits in 2013 (25). This makes an average of 2.8 visits per head of New Zealand’s 4.4 million
population. In the 2011/2012 NZ Health Survey 79% of adults and 75% of children had visited
a GP over the past year (8). Over 90% of adults aged 65 years and over had visited a GP in the
2011/12 NZ Health Survey (4).
But this actual and anticipated demand is not being met by an increased supply of GPs. In fact,
quite the opposite, as crisis point is being reached in many regions, particularly in rural areas.

2
Nationwide in 2001, there were 83 GPs per 100,000 population but since 2004 this ratio has
dropped and stayed in the low 70s (26). This equates to around 1 GP for every 1400 residents.
The OECD ranked New Zealand third worst in equality of access to general practitioners as
GP services were more likely to be used by people from higher incomes than lower (27). At
2.2 practicing GPs per 1000 population, New Zealand is well below the average of OECD
countries at 3 per 1000 (26). The president of the Royal New Zealand College of General
Practitioners (RNZCGP) stated that the NZ health sector needs approximately 1000 GPs to
fulfil the shortage (28).
The level of service gap varies across NZ District Health Boards (DHBs). The 2012 Health
Workforce survey found that Auckland DHB had a Full-Time Equivalent (FTE) GP per
population ratio of 1:1030, while in neighbouring Counties Manukau, the ratio was 1:1851 (8).
Counties Manukau also has a very young population profile with a disproportionately high
number of Maori and Pacific peoples living in more highly deprived communities compared to
the rest of New Zealand (20). These factors markedly increase their need for primary care
services.
DHB regions with predominately rural population such as Taranaki, Mid Central and the West
Coast experience similarly poor GP service provision. The 2012 survey found that main urban
areas have 342 doctors per 100,000 population compared with just 140 doctors per 100,000 in
rural areas (29). It is likely that these communities have even more inferior GP access than can
be indicated by the use of GP to population ratios because provider to population ratios do not
include measures of travel distance and time (11), nor do they consider the demographics of
the patient population such as a high percentage of elderly people who require more frequent
(30) and longer GP consultations than younger people (26). In addition they assume that
individual GPs have a uniform capacity for patients when this has been shown to vary
according to the gender and age of the GP (26, 31).
In contrast to using ratios, the NZ Medical Training Board models the future medical workforce
supply and population demand through a needs-based framework. The ‘needs’ taken into
consideration include the population demography, epidemiology, standards of care and
provider productivity (32). Using this model, the Board estimates that the health service needs
to redirect a significant proportion of the medical school intakes into general practice in order
to meet the forecasted demand over the next three decades (15).
3
1.2 International GP shortages
This issue is not isolated to New Zealand as health professional and GP shortages are evident
internationally (33, 34). The World Health Organisation (WHO) has estimated that there is a
shortage of 2.3 million doctors, nurses and midwives across 57 countries worldwide (35). The
decline in the USA of primary care physicians (the American equivalent of a General
Practitioner) led to The American College of Physicians stating that “primary care, the
backbone of the nation’s health care system, is at grave risk of collapse” (36). The shortages
of providers in the USA have been especially evident recently due to the introduction of the
Affordable Care Act and the increased patient demand that has resulted from this (37).
The United States designates a ratio of 1:3500 or greater as indicative of a Primary Care Health
Professional Shortage Area (HPSA) (38). It is argued that this ratio does not allow for some
reliance of the medical workforce upon nurse practitioners being available to cover traditional
GP roles (39). Using this ratio, there is currently a shortage of 8200 primary care physicians to
the approximately 65 million Americans who live in HPSA (39, 40). In the USA these areas
have been found to have higher morbidity and mortality than areas with better access to primary
care services (41, 42). Similarly to NZ, this geographical mal-distribution of GPs means there
is a mismatch between both the spatial distribution and the needs of residents, and the health
services available to them.
The UK is facing a similar crisis in the primary care workforce (43-45). Similarly to NZ, the
problems in access to GPs has been partly reflected in increased non-urgent patient
presentations to hospital emergency departments (46) and increased avoidable hospitalisations
(10, 47). The UK’s Department of Health recommended that at least 50% of all medical
students will need to specialise in general practice to address the shortage in primary care
services (48). The UK GP college chair stated that the UK National Health Service (NHS)
required 10,000 more GPs to cope with the increased demand (49). In 2014 the UK GP
Taskforce report recommended that the number of GP trainees must be immediately increased
by 450 a year. This was in order to avoid the imminent crisis in the GP workforce due to
increasing patient demand and issues of recruitment, retention and retirement reducing the GP
supply (50). Worryingly, UK research (51) suggests that the most important influence upon a
GPs’ choice of practice was aversion to practicing in an area of high deprivation and that
without financial incentives GPs would be reluctant to locate in these areas.

4
Research indicates that with an increased ratio of doctors to population there is an increased
use of medical services (52) and reduced maternal and infant mortality (53). This is potentially
especially important for low socio-economic groups as it is less costly both in time and
transport to access care (54). In addition, primary care supply has been linked to a reduced
perception of disease burden in aging populations (55), earlier diagnosis and treatment of
disease and more integrated care between primary and secondary levels of care. Easy
accessibility to, and continuity of care by primary health care providers is associated with better
self-reported general and mental health (56, 57). The 1996 WHO Ljubljana Charter on
reforming health care in Europe stated that European health care systems needed to be oriented
towards primary health care in order to provide patients with better health and quality of life
(58).
1.3 Definitions of Accessibility to Healthcare
The concept of ‘accessibility’ within health care has been notoriously difficult to accurately
describe due to the many factors that affect a population’s accessibility to facilities. So while
Wang (21) states that accessibility is “the relative ease by which services… can be reached
from a given location”. Other researchers have expanded such simplified ideas of accessibility.
Penchansky and Thomas (59) suggested that there are five dimensions to accessibility:
availability, accessibility, accommodation, affordability and acceptability. Availability
assesses whether a population’s healthcare needs are adequately met by the supply of health
services. Accessibility compares the geographic location of the population to any health
facilities. Accommodation examines the fit between the needs of the population and the
services provided. Affordability considers the connections between cost of the health service
and the potential for the patient to be able to pay. Acceptability studies the level of patient
satisfaction with the health services received by them. Availability and accessibility are spatial
in nature so have typically been studied using Geographic Information System (GIS)
technology.
The WHO has stated that equal accessibility and availability of appropriate quality healthcare
is the requisite goal of any country’s health system (60). This is because these factors have a
direct and measurable impact on health outcomes and the experienced disease burden in a
community. Accessibility as defined by the WHO has four dimensions: non-discrimination,
physical accessibility, economical accessibility and information accessibility.
5
Information accessibility acts to overcome issues with poor health literacy as this restricts an
individuals’ ability to obtain and understand health information and make informed health
decisions. Health literacy (HL) is defined as “the degree to which individuals have the capacity
to obtain, process and understand basic health information and services needed to make
appropriate health decisions” (61). Low HL is associated with negative health behaviours, poor
health and socioeconomic disadvantage therefore it is an important contributor to health
inequalities. GPs have an important role to play in addressing these inequalities, particularly
through providing advice on lifestyle modifications to promote better health behaviours (62).
Crucially, HL is a two-way process as a healthcare provider needs to communicate in such a
way to enable the patient to make an informed choice through being health literate (63).
In October 2011 WHO sponsored the World Conference on Social Determinants of Health
which saw a renewed determination by governments to achieve health equity through
accessibility and affordability (64). OECD countries use horizontal equity of access to health
care as a key comparative goal across countries in order to achieve equal access for equal need
(27). However, Goddard and Smith (65) argue that equity of access only considers the supply
of health care providers thereby overlooking the many interactions between supply and
demand. These interactions lead to inequalities in treatment due to the “preferences,
perceptions and prejudices of both the patient and health care provider”.
Goddard and Smith (66) stated that equitable access to health care results from three
contributing factors: population need, health care supply and “realised access”. Population need
could include both clinical measurements of need through the patient’s ‘level of illness’ and
non-clinical factors such as the social circumstances that affect need. Health care supply
included the range, quality, information about, and cost of services available to different
population groups. Realised access characterises the actual use of available services by a
population.
The concept of realised access originally stems from work by Aday and Andersen (67) who
theorised that there were two forms of access: potential and realised. Potential access refers to
the extent a population could utilise existing health services based on characteristics such as
the health service supply and location and the population size and demographics. The
calculation of potential access naturally lends itself to the formulation of ratios of GP to
population size. However these measures disregard the impact of realised access to healthcare
as this is inherently more difficult to measure.
6
Following on from Aday and Andersen’s work, Joseph and Phillips (68) described accessibility
of health services as being either “locational” or “effective”. “Locational” accessibility is
simply how close the health service is to an individual whereas “effective” accessibility relates
to features of the services such as how expensive it is to access and its opening hours. This has
obvious similarities to Aday and Andersen’s concepts of “potential” and “realised” access (67).
Meade and Earickson (69) instead considered that there are four variables that result in access
to health services: service availability; financial means of access; non-discriminatory systems,
services and professionals; and attitude and knowledge of consumers. In this definition Meade
and Earickson attempted to reflect the increasing integration of primary health services that has
enabled care to be delivered by other members of a primary care team such as nurse specialists.
Miller, an American Professor of Health Economics has written about the changes to the
concepts of accessibility through integration of primary care:
As care becomes more clinically integrated access to care measures must take into
consideration proactive secondary preventive care that may involve telephone communication;
non-physician personnel use; and education, involvement and support of patient in self-care
‘services’ that might substitute for specialist visits or hospital stays that are sometimes markers
for access to care (70)
1.3.1 Health Inequities Due to Poor Accessibility
Regardless of the method of definition, access to primary health care is a critical determinant
of population health (71). The health inequalities and problems of access to GPs in NZ’s rural
and more socioeconomically deprived areas appear to illustrate Julian Tudor Hart’s 1971
“inverse care law” (72) which states that:
The availability of good medical care tends to vary inversely with the need for it in the
population served. This operates more completely where medical care is most exposed to
market forces, and less so where such exposure is reduced
Additionally because GPs are the ‘gatekeeper’ to secondary services in the NZ health system,
the reduction in their numbers and geographic mal-distribution has profound implications for
the health of NZ citizens. The WHO has stated that imbalances in health human resources occur
when a health care system is not made up of the appropriate people, at the right amounts and
the right level of use to meet optimal health system goals (52).
7
Social determinants of health and health inequalities such as differences in morbidity, life
expectancy and health care access, result from the socio-political climate in which an individual
lives (73). As Pearce (74) stated, in NZ health inequalities are present “between individuals,
between socio-economic and ethnic groupings of individuals, and between spatial or
geographic groupings of individuals”. Research has found that Māori suffer worse health
outcomes from diseases that have effective preventive treatment available through GPs, such
as asthma (5, 6) and much higher mortality rates from controllable diseases such as diabetes
and ischaemic heart disease (75), illustrating the difficulties Māori experience in both “access
to” and “access through” health care (2). Māori experience approximately ten years lower life
expectancy than non-Māori (3).
It is possible to measure access to primary care services through calculating the number of
‘potentially avoidable hospitalisations’. These hospitalisation events result from conditions
such as asthma or diabetes that could have been successfully treated by a GP but were not (76,
77). Ministry of Health data (76) shows that Māori rates of avoidable hospitalisations were
over 1.5 times higher than those of non-Māori. Rates of avoidable mortality were over 2.5 times
higher for Māori than non-Māori. The cost to New Zealand society for these both economically
and socially is significant (78).
This encapsulates the idea that access is not just the geographical location of facilities but that
access also relates to culture, economic status and resources, language and knowledge of how
the health system operates (79).
1.4 Barriers to Accessibility
Accessibility to primary healthcare was identified in the Declaration of Alma-Ata in 1978 as
being reliant on geographic, financial, cultural and functional factors (80).
1.4.1 Functional Barriers
Functional or organisational barriers result from how a nation’s health system is structured. As
an example of this, this barrier directly affects adolescents as there are few primary health care
youth-specific services targeting this age group and their health concerns (81, 82). These
concerns typically centre around a history of poor communication with GPs, a high need for
confidentiality due to consultations around sexual and mental health issues and a perceived
lack of respect from health providers about teenage health (83). Additionally, young people
aged 15-24 years have reported deferring visits to GPs because of the financial costs acting as
a barrier (18). A trial of a youth-specific service in Tauranga, NZ found that 54% of the

8
adolescents seen were Māori with a high proportion of patients from low socioeconomic
neighbourhoods who were participating in high risk activities including drug and alcohol use.
These highly vulnerable adolescents typically have a high but unmet need for health care yet
through this youth-specific service high proportions of these people were successfully
accessing suitable care (82). This reflects how changes to how a health system is organised can
have positive effects on functional barriers.
1.4.2 Financial Barriers
Financial barriers directly affect an individual’s use of a health system as inequalities in health
care access are greater in countries that have higher co-payments (27). Financial cost has been
cited as a barrier to accessing primary care in NZ by young adults aged 15-24, Māori and
Pacific peoples, people living in areas with the most deprived NZDep scores and with a high
individual level of deprivation, current smokers, people with co-morbid conditions and those
reporting very high levels of psychological distress (18). Financial barriers are a particular
concern in NZ because GPs have retained the right to charge co-payments for care (18).
Deferred access to care can lead to higher rates of emergency visits (42) and preventable
hospitalisations for conditions such as acute rheumatic fever (84) which substantially increases
costs in the publicly funded NZ health care system (85).
1.4.3 Cultural and Information Barriers
Information barriers perpetuate health inequalities as they act to limit people understanding
how to seek care, this particularly affects new migrant population groups who may have higher
health needs (86). In NZ cultural barriers affect Māori and Pacific populations who may have
a preference for receiving care from Māori and Pacific GPs, but are unable to due to the low
numbers of doctors practicing from these groups (87). American research indicates that when
patients have a choice in their selection of a doctor, they are more likely to select doctors that
are from the same ethnic group. In addition, these patients report greater satisfaction with their
doctor (88). Only 2.7% of GPs were Māori and 1.6% were Pacific in the latest GP workforce
survey (26), compared to the percentage of the population who identify themselves as being
Māori in the 2013 census at 14.9% and Pacific at 7.4% (89). This may impair the ability of
these groups being able to access GPs that operate in a culturally safe manner (90). Rural areas
in particular are more likely to be staffed by IMGs (29) but because of their lack of training in
NZ they may not understand the cultural nuances of this country.
9
The 2012/13 NZ Health Survey found that Māori adults and parents of Māori children had the
lowest amount of trust and confidence in their GP of all ethnic groups (8). In a qualitative study
investigating Māori views about health and their experiences of health care it found that
participants’ experienced conflicted relationships with Pākehā doctors. Cram et al. (91)
reported that Māori patients required “persistence and assertiveness… often in the face of
cultural misunderstandings, if good health care was to be obtained from existing systems”.
Cultural safety methods such as working to build rapport with Māori patients before discussing
the presenting problem were reported as crucial in overcoming whakamaa (shyness) and to
enable full disclosure to the consulting doctor.
1.4.4 Geographical Barriers
Geographic imbalances in healthcare access tend to have the greatest impact upon rural and
highly deprived communities. They suffer from the increased “friction of space” (67) that is a
result of the travel time, physical distance and economic resources required to overcome the
distance in order to access primary care services. This has been termed “distance decay” as the
likelihood of a population in need being able to access health care decreases with increasing
travel time and distance (92, 93). So for example, GP consultation rates may decrease as the
distance from the practice increases. A higher travel time is linked with an increased clinical
risk for emergency care as preventative care is less easily available (46).
In the 2006 census more than half of the Māori population (54%) lived in areas ranked in NZ
Deprivation deciles 8 to 10, the most deprived of the index compared to 24% of non-Māori
(94). Additionally, according to the NZ Statistics Urban/Rural Profile categories, 69% of Māori
live in urban areas compared to 76% of non-Māori, indicating that a higher proportion of Māori
are resident in independent urban and rural areas (95). These regions are typically reliant on
residents having personal transport to access GP services as public transport is not available.
Geographic accessibility is usually estimated using GIS as an analytical tool. GIS are able to
bring together spatial and aspatial data from a variety of sources, for example, health, census
and socioeconomic data and integrate these into a common framework for analysis. The
analysis of health accessibility is enhanced by GIS as they can include the impact of variables
such as the number of available GPs, and travel time to primary care services (96).
1.5 GIS and Primary Care Research
Internationally GIS have been used to integrate and visualise data relating to health services
supply and demand. Primary care uses have commonly focused upon issues of accessibility to
10
and utilisation of healthcare services (96-99). Recent studies in New Zealand, including a pilot
of this proposed study (100) highlighted the potential of GIS to map health care provision and
access (101, 102) against demographic factors that affect demand for services such as ethnicity,
socioeconomic status and age.
However, GIS technology have been under-utilised in New Zealand primary care health
planning. This is surprising given the geographical spread of NZ’s urban and rural communities
which determines the level of accessibility experienced by patients (99). Without the use of
mapping technology, planning for provision of new general practices could remain an arbitrary
process, occurring without consideration of the underlying population needs. Evidence
indicates that the effectiveness of a country’s primary care system relies upon five critical
factors, of which one is that countries that regulate where primary care services are located
through permits and incentives achieve better health outcomes at a lower expense than
countries that do not (103). Luo stated (38) that the first step in creating an accessible and
effective health care system is to identify whether there is a spatial mismatch between the
supply and demand of services.
GIS would be a particularly useful tool to assist planning for medical student training in general
practice, especially because of the increasing student numbers and the capacity constraints this
places upon teaching practices. To overcome the shortages in GP provision, adequate teaching
spaces for both undergraduate and postgraduate students becomes a critical issue. A GIS
combining the geographical spread of all general practices compared to teaching practices
could allow the three Otago schools of medicine and Auckland to visualise their regional
picture of potential teaching capacity.
While research exists on the origin of NZ medical students, it has not been included into a GIS
database and linked to the wider population demographics in a visual format. It is important to
monitor the sociodemographic characteristics of NZ medical school intakes to determine if
secondary and tertiary programmes targeted at under-represented populations are effective in
developing a diverse health workforce (104).
Primary care research in GIS using a mixed methods methodology are rare in primary care.
This is unexpected considering the ability of this research design to combine the
generalisability of quantitative sampling and the interpretative strengths of qualitative methods
(105), and because of the international shift toward attempting to integrate qualitative
understandings and methods within traditionally quantitative, positivist GIS (106). The mixed

11
method studies that do exist have focused upon incorporating GIS technology into healthcare
delivery through 3rd person accounts rather than from a direct 1st person perspective (107, 108).
1.6 Research Objectives
The intent of this concurrent mixed methods study is to explore the feasibility of developing a
GIS database to answer questions on GP supply and demand. In the study, data from varied
sources: the 2013 NZ Census, medical student origin and general practice and teaching practice
locations will be used to measure the relationship between GP supply and demand. At the same
time, the process of developing the GIS database will be explored using qualitative Action
Research principles through a personal journal maintained by the researcher. The reason for
combining both quantitative and qualitative data is to better understand the problem of
developing a GIS database that is capable of answering questions on GP supply and demand.
This project aims:
1. To document the challenges involved with developing a GIS database that will be capable
of fulfilling the following three objectives:
2. To determine whether the quantity and distribution of general practice services in New
Zealand reflect the distribution of demographic factors that influence primary care need
3. To determine whether the distribution of NZ medical students’ home origins reflects the
distribution of demographic factors that influence primary care need
4. To determine whether the distribution of general practices offering undergraduate training
places in New Zealand reflect the distribution of demographic factors that influence primary
care need
This project intends to incorporate qualitative understandings of using GIS as a ‘layperson’.
By this, I mean a person without a tertiary qualification in GIS and with only limited prior use
of the software in order to better understand the hurdles health organisations face in
implementing this technology into their workplaces.
A GIS database that combines the underlying population demographics and where medical
students are receiving general practice training would be invaluable for medical schools to
assist in planning. Currently it is unclear whether students are exposed to training in high need
areas with, for example, high Māori or Pacific populations. Data of this type could be used to
redress any imbalances in training exposure as it will be possible to see regions that would be

12
beneficial for students to have general practice attachments in. It could allow for medical
schools to target capacity building in general practices that are not currently participating in
teaching students but that would offer valuable training experiences due to the population
demographics. If students were to receive training in these areas then it may assist in addressing
future shortages in primary care services and also increase students’ cultural competency in
knowing how to appropriately treat other ethnic groups in a general practice setting.
Currently Māori and Pacific students are under-represented in both medical schools and the
health workforce. This study may identify communities with low medical student recruitment
and that are underserved with high health needs. This data could be used by educators to assist
in forming targeted secondary school student training and recruitment programmes to increase
their representation. The database will facilitate the ongoing monitoring of the impact of any
changes made to address any disparities should they be present.
Long term benefits of this GIS database include the ability to better plan the ideal location for
primary health care provision in regions that are currently underserved but have high health
need. Because maps provide powerful visual statements, this study aims to provide policy
makers with the tools to implement change in how general practices are situated and to target
appropriate interventions to the populations there. In particular, for high need and underserved
populations such as Māori and Pacific peoples, it may assist future health provision planning
to have the location of general practices mapped and linked to the population demographics.
1.7 Thesis Structure
Chapter 2 begins by discussing the international definitions of primary health care and
continues by examining how these definitions have been interpreted and implemented in the
NZ context.
It then goes on in Chapter 3 to consider how GIS have been used in primary care research both
internationally and nationally. Two examples of mixed methods applications of GIS research
are described.
In Chapter 4 I outline the methods that I used to achieve the aims of the study.
Results are presented in Chapter 5. These include data from the geocoding and travel time
models as well as the qualitative results.

13
In Chapter 6 I discuss the findings and implications of the methodological approaches that I
have taken as well as the limitations of the study.

14
2 Primary Care: Definition, Challenges and Solutions
In this chapter I present international and NZ definitions of primary care, the challenges facing
GP supply in NZ and potential solutions.
2.1 International Definitions of Primary Health Care
Primary health care was first defined and launched as the ideal global approach to healthcare
at the landmark 1978 WHO conference in Alma Ata. It was defined as:
Essential health care based on practical, scientifically sound and socially acceptable
methods and technology made universally accessible to individuals and families in the
community through their full participation and at a cost that the community and country can
afford to maintain at every stage of their development in the spirit of self-reliance and self-
determination… It forms an integral part of the country’s health system…and of the social and
economic development of the community. It is the first level of contact of individuals, the family
and community… bringing health care as close as possible to where people live and work, and
constitutes the first element of a continuing health care process(80)
This definition includes the personal, comprehensive, community oriented, equitably
distributed, high quality and cost effective qualities seen essential to the primary health
philosophy of care (109). The principle of ‘health for all’ and access to health care as being
basic human rights were central to the Declaration of Alma Ata. Primary health care was also
prioritised at this conference as it was seen as the most socially just way governments could
achieve health for their people and reduce population health disparities (79). This is because
primary health care achieves more equitable health outcomes and are more cost effective to
society (110, 111).
The American Institute of Medicine has defined primary care as:
the provision of integrated, accessible health care services by clinicians who are
accountable for addressing a large majority of personal health care needs, developing a
sustained partnership with patients, and practicing in the context of family and community
(112)
Barbara Starfield, a prominent American academic on primary care, states that this definition
encompasses the four key attributes of primary care services: “first- contact access for each
new need; long-term person- (not disease) focused care; comprehensive care for most health
15
needs; and coordinated care when it must be sought elsewhere” (42). She has previously
defined it (113) as:
That aspect of a health services system that assures person focused care over time to a
defined population, accessibility to facilitate receipt of care when it is first needed,
comprehensiveness of care in the sense that only rare or unusual manifestations of ill health
are referred elsewhere, and coordination of care such that all facets of care (wherever
received) are integrated
This definition emphasises the ability of primary health care to promote both equity and
resource redistribution (71). In American literature primary care has been described as the
“patient-centred medical home” where patients should be able to access regular care that
displays both family and community orientation, and cultural competence (103). Safran et al.
(114) defined primary health care as having seven key characteristics: access, continuity,
integration, comprehensiveness, ‘whole-person’ orientation, clinical interaction and sustained
clinician-patient relationship.
The importance of the ‘doctor-patient’ relationship to successful primary care is not to be
under-estimated especially with the continuity of care that it potentially offers to a therapeutic
relationship. Agarwal (115) states that this relationship “involves chronologically mapping out
the patient’s life and is dependent upon the continuous contact between patient and doctor”.
This continuity of relationship can improve health outcomes and patient satisfaction as the
consultation time can be used to explore new problems rather than being used to explain a
patient’s medical history to a new doctor. But it is detrimentally affected in many rural regions
such as NZ’s West Coast as its’ GP service is heavily reliant upon locums and IMGs (116).
Haggerty et al. (117) framed five defining attributes central to the care process of primary
health care. They were: clinical practice attributes (e.g., accessibility, comprehensiveness);
structural dimensions (e.g., information management); person-oriented dimensions (e.g.,
respectfulness, cultural competence); community-oriented dimensions (e.g., equity,
community participation); and system performance dimensions (e.g., accountability,
efficiency).
A study of 18 OECD countries by Macinko et al (111) found that the essential features of
primary care systems were: geographical regulation and access; longitudinality (how the health
system performed over time); coordination between primary and secondary care services; and

16
community orientation. OECD countries that had stronger primary care systems demonstrated
improved health outcomes as their populations suffered from lower rates of all-cause mortality
and cause-specific premature mortality from conditions such as pneumonia, heart disease and
stroke. Additional benefits of accessible primary health systems are earlier detection of health
problems and more efficient use of emergency services and secondary and tertiary levels of
care (118).
Primary care differs from secondary health care in that secondary is typically provided by
hospital-based specialists that focus on a particular set of problems so that the care they provide
is more episodic and limited in scope than primary health care providers. Primary care is
intended for first-contact care to enable referrals to be made to secondary care providers (79).
Secondary health care is also more expensive to provide so a properly functioning primary
health care system should be able to reduce the numbers of people seeking secondary care
services (119).
2.2 Primary Health Care in New Zealand
Primary health care and general practice in New Zealand have evolved steadily since the Social
Security Act of 1938. This act aimed to provide universal free health care through self-referral
to general practitioners as part of a national health service, similar to the British model. The
government succeeded in establishing free public hospital and maternity care but the medical
profession resisted full funding of general practice services. ‘Fee-for-service’ subsidies were
instituted where GPs were partially reimbursed for the cost of the consultation through taxes
but they retained the right to influence their income by charging their patients an additional co-
payment (120). In 1972 The Royal New Zealand College of General Practitioners was formed
and in 1996 the Medical Council General Practice Vocational Registration was developed. The
NZ Ministry of Health defines primary care as it “relates to the professional health care
received in the community, usually from a general practitioner (GP) or practice nurse” (121).
2.2.1 The Primary Health Care Strategy
In 2001 the New Zealand Ministry of Health responded to the Alma-Ata Declaration with the
Primary Health Care Strategy (PHCS). The PHCS is a fundamental element of the New
Zealand Health and Disability Strategies (122). The PHCS outlined how primary health care
would be organised and delivered in New Zealand through non-profit non-government Primary
Health Organisations (PHOs). These PHOs are required to have representatives from the
primary care sector, the wider community and Māori. This highlights the importance of

17
community participation as stated in the Declaration of Alma-Ata being upheld in the NZ
Strategy (123).
The strategy’s four main concerns were: differences in the health of different groups of people;
high levels of preventable illness; high levels of preventable hospital admissions; and barriers
to accessing primary health care services. These concerns had partially resulted from the fee-
for-service subsidy barely covering one third of the cost of a consultation by the mid-1980s
causing an increasing level of unmet health need in the community (124).It included three
priority objectives to reduce inequalities that aimed to ensure accessible and appropriate
services for people from low socioeconomic groups, Māori and Pacific peoples (122) and to
avoid issues of overuse, underuse and misuse of health services (125). Funding was targeted
toward reducing the costs of primary care services to improve population health and reduce
health inequalities (126). It was also hoped that better coordination of care between providers
would be achieved (120).
Figure 2.1: Structure of Primary Health Care in NZ (122)
The implementation of the PHCS in 2001 initiated a reorientation of health funding and
structures toward focusing upon the health of populations rather than individuals. This
18
approach ideally leads to a greater emphasis upon population-targeted strategies that promote
health and prevent illness (127). In 2000, District Health Boards (DHBs) were established in
the New Zealand Public Health and Disability Act. DHBs oversee the health of the population
living within their defined geographical boundaries, focusing on hospital, community and
primary care services. There are currently twenty-one DHBs in New Zealand.
DHBs fund primary health care provider networks called Primary Health Organisations
(PHOs). There are currently 32 PHOs (128) which have almost universal affiliation with NZ
General Practices. PHOs are assessed to determine how successful they are at reaching specific
high need clinical objectives such as immunisation rates for children and the elderly, and breast
screening and cervical smear rates. PHOs receive capitation funding from DHBs and the
Ministry of Health (MOH), the level of which depends upon the number and demographic
characteristics of the patients enrolled in the PHO. This funding subsidises the costs of GP
consultation for enrolled patients enabling lower cost access to primary health care services
than the traditional fee-for-service and patient co-payments allowed (129). Capitation funding
also facilitates a ‘needs-based’ formula to take priority so that populations with high needs
receive the most subsidised care (130).
2.2.1.1 Māori Health Providers
In an attempt to meet Māori health needs and overcome issues with inaccessibility (2), Māori
primary care services that are community-governed and not-for-profit were established in the
late 1980s’ (131, 132). These services also represented the government’s commitment to
honour the principles of partnership in the Treaty of Waitangi and enable Māori to become
actively involved in designing and delivering health services that meet their needs. The services
are adaptable, using both mobile and satellite clinics to enable patients to access care.
They act to overcome multiple barriers including: geographical barriers to access; financial
barriers through being free or charging cheaper co-payments; and organisational barriers
through being more flexible with appointments and allowing people to walk-in and be seen
within a day. Another significant barrier overcome by these services are cultural issues through
the employment of Māori staff and providing services in familiar, non-clinical and less
intimidating environments such as on marae (2, 77, 123).
Similar third sector (neither government nor private) services exist to target Pacific populations
in urban settings. These are also effective through offering church-based services (77, 133).
Because of their community orientation these services are able to act as both public and primary

19
health providers at a local level through promoting health and illness prevention practices
(127).
2.2.2 Effects of the PHCS
An analysis of the effects of the PHCS found that fee reduction, has led to increased
consultation rates especially in higher need and higher funded practices (134). The past two
NZ Health Surveys seem to support this as it found that there were no differences in the
proportion of GP visits by level of neighbourhood deprivation and between the proportion of
visits made by Māori and Pacific adults and the national average (4, 8). But considering that
Māori and Pacific people have poorer health statuses than Europeans it may be expected that
adjusted utilisation rates would be higher. This may explain the continuing health disparities
and inequalities in NZ (1).
These disparities may still exist because practices were not legally required to reduce their fees
in response to the increase in government funding. Studies have found that patient co-payment
fees had not reduced by as much as expected (135, 136). In 2011/12 the average cost of a GP
visit in NZ was $32 (4). After-hours GP is more expensive with the average cost to the patient
being $56 (4). Since 2008 children under the age of six have had free GP and after hours visits
which has reduced the level of unmet need in this age group. However cost still acts as a barrier
to older children accessing care as their level of unmet need for primary health care has
increased, particularly in the 10-14 year old age group (8). Current government policy aims to
remedy this disparity in access for older children through extending the provision of free GP
visits to under 13 year olds (137).This is predicted to benefit 400,000 children and reduce the
pressure on hospital emergency departments as children will ideally present to their GP earlier
for preventative treatment.
However, while access to GP visits may have improved there still remains a cost barrier to
filling prescriptions for children in highly deprived areas (8) and for people of Māori and
Pacific ethnicity (18). Geographic barriers rather than cost act as the barrier to accessing
pharmacies for rural residents as a recent NZ study using GIS found that the urbanisation of
the NZ population has been matched by the loss of pharmacies in rural towns (102).
2.2.3 Future Challenges for NZ Primary Health Care
Achieving integration and coordination across all levels of health services is seen as one of the
major challenges of the NZ health care system (120). This challenge has prompted the
government since 2007, to shift the focus of care toward greater use of services that are “closer

20
to home” in primary and community care through their ‘Better, sooner, more convenient”
health model (138 - 140). This model aims to create integrated family health centres that house
a variety of health professionals to enable better community access and better integration from
primary to secondary care services (120).
Increased integration of the primary care workforce aims to ensure that a variety of health team
members are involved in patient care and that some traditionally GP-led tasks are delegated to
practice nurses e.g., immunisations and cervical smears (39). Integration is also hoped to have
a beneficial effect on mental health patients who suffer from poor transitions between primary
and specialist care (141). The Medical Training Board believes that the community care models
and a more cohesive health system with clear system-wide leadership will assist in the
increased retention of New Zealand medical graduates. They hope this will lead to improved
nationwide health care provision (15).
2.3 Measurement of GP supply
GP resource supply is typically measured through the use of GP provider to population ratios.
Section 51 of the Health and Disability Services Act 1993 states NZ’s official GP per
population ratio of 1:1400 as the level for a practitioner to issue a notice to practice in an area
and as the capacity for a full-time work load (142). Attempts have been made to formulate the
ideal ratio for NZ in order to provide a benchmark GP workforce and to measure the level of
service gap, however no agreement has been reached yet (143). The Rural Expert Advisory
Group recommended to the Minster of Health in 2002 that the “alert” level of FTE GP supply
to population should be set at 1:2000 (144). In the 2002 surveys of NZ rural workforce supply,
this level was reached in 32% of rural “Shared Roster Areas” (SRAs) while a ratio of 1:1800
was reached in 56% of SRAs (145). An SRA is an after-hours call roster shared by a group of
GPs for a particular area (146).
Some have argued that GP to population ratios should only serve as a starting point for
understanding workforce distribution as they can be misleading, leading to skewed results in
analysis (33, 147). Errors in ratio calculation can occur through the inclusion or exclusion of
locum GPs or if GPs that work in more than one practice in different geographical areas, which
is especially evident in rural regions, are counted incorrectly (148). Fretter argues (142) that to
derive an accurate estimate of the current NZ GP workforce, the formula should necessarily
include: the number of practicing GPs; numbers of other primary health professionals and their
scope of practice e.g. the number of Nurse Practitioners assisting; and average GP workloads

21
e.g. FTE hours, patient disease burden and utilisation of GP services. These results could then
be combined with the numbers of GPs that are currently in training, being recruited or leaving
the speciality to forecast future workforce supply issues.
The consideration of FTE workload has been an important addition as a standardised unit of
human resources measurement to the traditional ‘headcount’ of GP per population ratio.
However it has the disadvantage of ‘capping’ GPs to a standard full-time level of service of 1.0
FTE. In Australia the Full-time Workload Equivalent (FWE) is used as an alternative
measurement because it allows GPs to work more than a full-time load e.g. if a GP works 50%
more than a standard full-time load then they would be 1.5 FWE rather than 1.0 FTE. This
allows for the inclusion of, and compensation for, GPs working part-time or in casual positions
which is becoming increasingly common in the GP workforce (149).
2.4 Workforce issues affecting GP supply
Zurn et al. (150) argue that health care systems are affected by five different types of
imbalances: profession/speciality imbalances, gender imbalances, geographic imbalances,
institutional and services imbalances, and public/private imbalance. Examples of these
imbalances are all evident in the NZ health workforce, some of which principally impact upon
the GP supply. Those that do will be addressed in the following sections.
2.4.1 Profession/Speciality Imbalances
The inequality in health outcomes between Māori and European and between communities of
different levels of deprivation have not been helped by the changing dynamics of the NZ health
workforce. These are affecting the accessibility and level of GP supply as fewer junior doctors
are choosing to specialise in general practice, particularly in rural areas (14). Clinical specialists
now outnumber GPs in the NZ medical workforce (29). But this growing trend toward medical
specialisation that is not involved in providing primary care, directly conflicts with the aims of
the New Zealand’s Health Strategy.
Countries such as Denmark, Finland, Spain, and United Kingdom whose national health
systems are oriented toward primary care typically have lower morbidity and lower total health
care costs, than countries with a high level of specialisation such as the United States (151,
152). The health of infants and children particularly benefits from a strong primary care system
(152) as it can act to mediate the negative health effects of income inequality and
socioeconomic deprivation (153).

22
New Zealand has a relatively low level of medical generalism and a higher degree of
specialisation, with approximately 4000 of the 10,000 doctors in NZ being generalists (29).
The President of the RNZCGP has stated that the ratio of specialists to generalists should be
50:50 (28). This lack of generalism and the resulting difficulties in accessing appropriate
primary health care may be reflected in our high rates of preventable childhood illnesses such
as rheumatic fever (84).
2.4.2 Gender Imbalances and the Increasing Feminisation of the GP workforce
Of the GPs that are actively practicing in NZ, a growing proportion are nearing retirement (29)
or are reducing their workload (154). The average age of GPs has been steadily increasing over
the past decade reaching 50 years old in the 2012 Medical Workforce Survey (29). In addition,
there are concerns about the increasing feminisation of the remaining GP workforce as female
GPs tend to work a lower average FTE workload than male GPs (29, 155) in their General
Practice role so are viewed as potentially less productive than men (156). Typically women
have different career paths compared to male GPs, particularly in the 35-39 year old age group,
as women tend to take time out from the workforce for family reasons.
Medical school intakes have been predominately female for at least the past two decades (104,
157, 158).These intakes are having flow-on effects in the vocational training choices with 59%
of GP vocational trainees being female in 2012 (29). Previous research has found that women
are more interested in a career in General Practice (159, 160). Currently the percentage of
women in General Practice training in NZ is about the same as the proportion of women
medical students (104). There have been suggestions that the status of the medical profession
may change with an increasingly female workforce (161).
However a recent systematic review of the feminisation of the GP workforce found that while
female GPs self-report fewer work hours and see less patients than male GPs, they spend longer
with individual patients and deal with more presenting problems in a single consultation (162).
The authors of this review concluded that workforce feminisation is likely to have a small
negative effect on GP supply. A 2014 study of Auckland medical students found that both male
and female students valued flexibility in their speciality choice (163). Perhaps the preferences
of generation Y (born 1980-1994) for more flexibility and a better work-life balance could pose
more of a threat to the sustainability of the future workforce than its feminisation (164).

23
2.4.3 Geographic Imbalances and the Rural GP Workforce
NZ rural regions have long suffered from workforce shortages. NZ’s Primary Health Care
Strategy noted that the “misdistribution of workforce is a particular issue for rural areas” and
“the difficulties of attracting and retaining basic health services in rural communities have not
lessened in recent years” (122). The current rural GP workforce consists predominately of men
aged over 40 with many trained overseas, nearing retirement or intending to leave rural practice
(29, 155).
The increasing urbanisation of NZ’s population has caused a parallel urbanisation and
centralisation of health care services increasing the physical distance rural residents must travel
to access health services. However, while rurality does not always lead to disadvantages in
health (165) there is still a high level of service demand in these regions as rurality is often
associated with low socio-economic status and, in New Zealand, Māori ethnicity, which both
affect measures of health and morbidity (95).
In developed countries mortality rates from some types of cancer (for example cervical due to
lower screening rates), suicide due to delayed treatment seeking for mental health issues and
motor vehicle crashes are markedly higher in rural areas than in urban (165). But as Smith et
al states (165) the “health status of any place is a product of more than just location”. They
relate poorer health outcomes to: low socioeconomic status; ethnicity; reduced access to health
services; personality traits such as a higher level of personal risk-taking and stoicism in the
face of adversity; and greater exposure to risks of injury through more challenging
environmental, occupational and transportation situations. They conclude by saying that unless
policies to address rural health and its workforce issues, additionally address the issues
surrounding poverty, racial discrimination and inequality, then the policies will be ineffective.
The challenges that affect rural areas have been listed by the New Zealand Ministry of Health
as:
“large distances and obstructive geographical features that affect ease of
access to health services
small, isolated populations that lead to diseconomies of scale when planning
and funding local health services
24
high levels of deprivation that are a feature of some rural regions and some
rural communities in otherwise more affluent regions which impact on the
health status of the local population and their ability to access services
[a] high concentration of Māori in some regions (e.g., in the Far North and
East Coast of the North Island) [which] present[s] both challenges and
opportunities for the organisation and delivery of culturally appropriate
health services and the reduction of health inequalities
sharp seasonal fluctuations in population numbers experienced by some rural
areas pose workforce difficulties when organising and funding health services
on a population basis”. (144)
The reducing rural workforce means that remaining GPs have a larger and more complex
patient caseload with reduced ability for time-off and increased on-call hours (14, 145, 154,
155, 166). These reasons and others, such as: a preference for urban living, onerous working
conditions and hours, work challenges, diversity of practice, career opportunities, partner
flexibility and preferences, family location and educational opportunities (167) make it difficult
to recruit GPs into rural worksites.
The NZ Rural General Practice Network developed the Rural Ranking Scale (RRS) in the
1990s in order to recognise the more difficult working conditions in rural regions and to
establish a level of rural funding bonus for GPs. Individual practices are allocated a score which
accounts for: costs resulting from travel time to the nearest hospital and nearest GP colleague;
GP-call rostering; trauma-call duties; and peripheral clinic duties (168). If a practice scores
more than 35 points than they are defined as rural. The level of bonus attempts to reflect the
additional skills required by rural GPs due to their geographical distance from secondary care
hospital services (155). Rural GPs are more likely to be involved with acute and emergency
situations while urban GPs are able to take advantage of the many resources available in urban
centres by referring patients on to specialist care.
To address the shortage issues from the level of medical education, various initiatives have
been undertaken. From 2006 both Otago and Auckland medical schools have received extra
funding to provide places for rural origin students. This was in recognition of the international
research that suggests rural origin students are more likely to return to practice in similar areas
(169-172). Also, in 2006 the government allocated additional funding for 30 rural GP trainee

25
placements. Rural GPs have now been registered as a vocational scope of practice which allows
for a dedicated training pathway.
2.4.4 Role of nurses in rural primary care practice
More recently there has been an increase in the number of rural primary health care nurses in
comparison to the number of rural GPs. This allows for some compensation in the reduction of
the rural GP workforce (155). West Coast DHB in particular relies on nurse-led clinics by Rural
Nurse Specialists (RNSs) that work from standing orders of the GP as general practices have
found it difficult to maintain their GP workforce (116, 155).
There has been some debate in NZ over the disciplinary boundaries in primary care duties
between health professionals such as NPs and GPs that has slowed the broadening of scope of
some professions (173, 174). This is partially due to the NZ government having been risk
averse in legally allowing other health professionals to provide such services, especially
prescribing medications (175). This is changing however as by 2014 it becomes a Nursing
Council New Zealand (NCNZ) requirement that all NPs are qualified to prescribe (176). Both
international (177, 178) and national (179) evidence suggests that better population health
outcomes and more cost-effective care are associated with the number of nurses per population,
particularly NPs. This has been called the “Nurse Dose” concept (180, 181). This relationship
would be crucial to exploit in NZ because nurses are the largest group of regulated health
professionals nationally (175). Nurse practitioners in particular may increasingly fill the
shortage of GPs in coping with the massive increase in the burden of chronic disease from
cardiovascular disease and diabetes (39).
2.4.5 E-health technologies
E-health is viewed as having the ability to address the challenges in maintaining adequate
quality healthcare services in rural and remote areas by bridging the service gap (182). The NZ
Ministry of Health stated that it is able to “link specialist services, the health care team and the
rural patient to provide enhanced quality services close to where the patient lives” (183). It can
increase access to specialist expertise through reducing travel costs which could lead to
improved management of rapidly changing illness conditions (184). It also allows for rural GPs
to participate in continuing professional development opportunities through videoconferencing
(183). This increased contact could potentially reduce the isolation that forces some GPs to
consider relocating to urban practices (184).

26
However researchers (182) have stressed the importance of focusing upon the community need
for the technology rather than just implementing it because it is available. This is because it
needs to have community support and the clinical willingness to learn the technology. A recent
literature review found that e-health is safe, effective and reliable for patient interactions and
allowing patients to undergo care while staying in their communities (182). However Agarwal
(115) argues that technologies allowing remote consultations challenge the idea that a GP is an
indispensable member of a community who understands and has knowledge about the local
environment. In order to compensate for the GP potentially losing intimate knowledge of the
local community contexts, Agarwal maintains that there needs to be increased inter-
professional teamwork with clinic staff on site to assist these GPs in their understanding.
Unfortunately, it appears that the highly deprived rural communities that would be most likely
to benefit from e-health technology due to poor community resource access (23) are also the
least likely to have access to the internet (185). Access to the internet has become a proxy for
having the opportunity to participate and have choices for daily living in society. This is shown
by the inclusion of access to the internet as a measure in the NZ Deprivation Score (186). In
addition e-health requires a certain level of health literacy and self-management of health in
the individual.
2.4.6 International Medical Graduates
The shortfall of GPs nationwide and in rural areas in particular, is increasingly being filled by
locums and International Medical Graduates (IMGs). The 2012 workforce survey found that
54% of rural doctors were IMGs versus 38.7% in urban centres. IMGs comprise 41.4% of the
entire medical workforce in NZ and 43.7% of this are GPs (29). An OECD report in 2008 found
that New Zealand (46.9%) and Australia (42.9%) had the largest proportion of IMGs of all the
OECD countries. At that time, for every doctor trained in NZ that lived overseas, there were
two doctors living in NZ who were trained overseas (187). By comparison, in 2004 IMGs
accounted for 22.3% of all doctors in Canada but 26.9% of doctors in rural areas, indicating a
similar reliance on IMGs for rural areas in particular (33).
Retention rates show that many IMGs arrive in NZ to fill locum or other short-term positions
rather than intending to stay long-term (29). This, the divergence of the medical workforce
from the ethnic and cultural mix in NZ (15), and the impact upon their home country’s medical
workforce of leaving to practice overseas (188) means that IMGs cannot be a long term solution
27
to the NZ’s GP shortage. In addition, increasing international competition for medical
practitioners means that New Zealand could face difficulties sourcing doctors in the future (15).
The 2010 WHO Global Code of Practice on the International Recruitment of Health Personnel
aimed to highlight the importance of richer countries reducing their recruitment of healthcare
workers from poorer nations that have health workforce shortages as this could worsen access
for needy populations (127). The NZ Medical Training Board has recommended that NZ
should aim for an overall net self-sufficiency in the medical workforce so that the numbers of
medical students trained in NZ are enough to meet the population needs (15).
2.4.7 Māori and Pacific Health Workforce Development
The Health Workforce Advisory Committee (HWAC) has stressed the importance of
increasing Māori and Pacific students studying health sciences, specifically through the use of
role models, encouragement and career promotion to both the students and their whānau (189).
This is crucial as currently many Māori and Pacific students are prevented from entering health
professions as they do not have the necessary secondary school science qualifications in
Chemistry, Physics and Biology. These subjects are a particularly important foundation for the
competitive Health Sciences First Year programme at the University of Otago and the First
Year Biomedical Science courses at the University of Auckland. Students’ marks from the
prescribed papers over the year are collated with their weighted achievement in UMAT
(Undergraduate Medical and Health Sciences Admission Test) and, in the case of Auckland,
an interview, to achieve entry into the 2nd year medical classes.
The latest statistics available from the NZ Ministry of Education’s ‘Education Counts’ website
from 2009 show that only 8.4% of Māori and 7.2% of Pacific Year 13 students participated in
Chemistry and of these, 36% of Māori and 32% of Pacific students attained the NCEA credits.
For NCEA Physics at Year 13 level, 7.8% of Māori and 6.5% of Pacific students participated
in Physics and of these, 38% of Māori and 33% of Pacific students attained the necessary
credits for University Entrance requirements.
These numbers are in comparison to the participation and attainment rates of Asian students in
particular, with 34% participating in Chemistry and 61% attaining the NCEA credits. Thirty-
one percent of Asian Year 13 students participated in Physics with 65% of them attaining
NCEA credits (190). This foundation leads to higher numbers of Asian students attaining
University Entrance. In 2011, 31% of Māori and 26.1% of Pacific Year 13 students attained
University Entrance compared to 54.2% of Asian and 57.3% of European students (191).

28
Preferential entry pathways exist at both Otago and Auckland for students with Māori and
Pacific descent and for those with a rural origin as determined by their home residence and/or
the geographical location of their schooling. The Rural Origins Sub-Category was started in
2003 at Otago. However selection through these pathways relies on having a large enough
group of students with the necessary educational foundations (192).
The University of Otago has initiated various programmes in order to increase the number of
students with the requisite background for tertiary study in the health sciences and their
likelihood of gaining entry into 2nd year professional courses. These include: the Foundation
Year Bridging Programme; the Pacific Foundation Programme to support Pacific students; and
Tū Kahika to prepare Māori students academically (193).
2.4.7.1 Growing Your Own Workforce: Case Study of Counties Manukau DHB
Counties Manukau DHB is taking a unique approach to ‘growing’ their own workforce from
their own community as currently the workforce is not reflecting the predominately Māori and
Pacific people the DHB is serving. The vision of “Grow Our Own Workforce” (GOOW) is “to
grow and develop a workforce that serves the health needs of our community with competence
and respect and reflects the diversity of Counties Manukau” (20). Currently 5.7% of their
workforce is Māori and 10.3% is Pacific compared to 16.7% and 21.0% of the population
served by the DHB being of Māori and Pacific ethnicity respectively (194). Due to a rapidly
growing population and predicted GP retirement rates, it is projected that to maintain the
DHB’s current GP to population ratio, an extra 22 new GPs per year are needed for the five
years from 2011 to 2016 (20). Already Counties Manukau has the lowest FTE GP to population
ratio in NZ at 1:1851 (54 per 100,000 population) (29).
Of particular interest in the four-pronged approach that Counties Manukau is taking to increase
workforce supply, are their programmes targeted at secondary schools in South Auckland.
These aim to encourage students to study science subjects and health-related courses with
school career programmes. Three South Auckland schools have formed Health and Science
Academies modelled upon similar ‘pipeline’ approaches in underserved or underrepresented
populations in the USA (195). Students selected for the academy have an individualised study
plan with health science subjects predominating. This is supported by study skills and exam
practice sessions, first aid training and work site visits to hospitals (196).

29
2.5 Medical Education and Training Capacity of General Practices
Training in general practice at all levels, whether undergraduate or postgraduate, necessarily
occurs within a community setting. The Declaration of Alma Ata (80) advocated for
community-based teaching of medicals students away from tertiary care centres as the belief
was that more students would then choose to specialise in primary care, potentially in
communities similar to where they had trained. This idea is supported by the evidence of
students who report positive GP training experiences being more likely to intend to train in
general practice (197-199).
Research into the training capacity of general practices is a growing field (200, 201). This is
because awareness is increasing of the pressure upon both medical schools and existing
teaching practices to provide sufficient General Practice placements for undergraduate medical
students, postgraduate junior doctors (202) and GP registrars. Most of the research up until
very recently has focused upon GP-teachers’ views on the challenges of teaching in general
practice (203, 204) rather than training capacity. However it has already been identified that
there is an inadequate number of training places in General Practices in NZ (15). In addition,
it is currently unclear what the nationwide geographical picture of general practice training is
for NZ medical students and graduates which makes planning for future training capacity
problematic. Both internationally and nationally, this study was unable to find any research
that have utilised the capability of a GIS to visualise the geographical distribution of teaching
practices within a region.
In 2009, the government established Health Workforce New Zealand Board (HWNZ) whose
mandate it is to coordinate the education and training of doctors and other health professionals
(205). This Board aims to centralise the planning and funding of health workforce training to
improve the workforce’s recruitment, training and retention. It could be argued that this
organisation, or something similar, is required to coordinate General Practice placements to
ensure that there are sufficient spaces available.
2.5.1 Teaching Practices and Increased Student Numbers
In the 2009 government budget, there was funding allocated toward a gradual increase in the
number of medical students over the next five years up to a maximum of 200 extra places per
year and an additional 50 new training places for GPs over the 2009-10 year (206). However,
it is acknowledged that any increase in medical student intake numbers places increased
pressure on the General Practices that participate in teaching (200, 204, 207-210). Universities
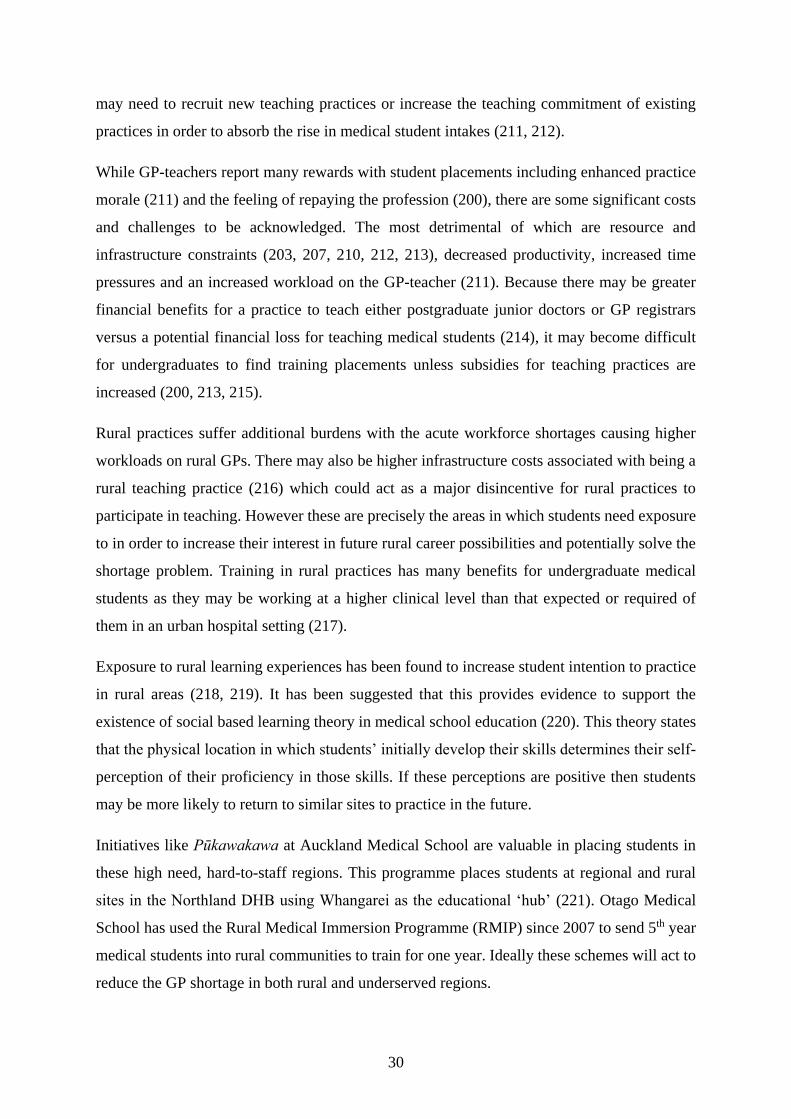
30
may need to recruit new teaching practices or increase the teaching commitment of existing
practices in order to absorb the rise in medical student intakes (211, 212).
While GP-teachers report many rewards with student placements including enhanced practice
morale (211) and the feeling of repaying the profession (200), there are some significant costs
and challenges to be acknowledged. The most detrimental of which are resource and
infrastructure constraints (203, 207, 210, 212, 213), decreased productivity, increased time
pressures and an increased workload on the GP-teacher (211). Because there may be greater
financial benefits for a practice to teach either postgraduate junior doctors or GP registrars
versus a potential financial loss for teaching medical students (214), it may become difficult
for undergraduates to find training placements unless subsidies for teaching practices are
increased (200, 213, 215).
Rural practices suffer additional burdens with the acute workforce shortages causing higher
workloads on rural GPs. There may also be higher infrastructure costs associated with being a
rural teaching practice (216) which could act as a major disincentive for rural practices to
participate in teaching. However these are precisely the areas in which students need exposure
to in order to increase their interest in future rural career possibilities and potentially solve the
shortage problem. Training in rural practices has many benefits for undergraduate medical
students as they may be working at a higher clinical level than that expected or required of
them in an urban hospital setting (217).
Exposure to rural learning experiences has been found to increase student intention to practice
in rural areas (218, 219). It has been suggested that this provides evidence to support the
existence of social based learning theory in medical school education (220). This theory states
that the physical location in which students’ initially develop their skills determines their self-
perception of their proficiency in those skills. If these perceptions are positive then students
may be more likely to return to similar sites to practice in the future.
Initiatives like Pūkawakawa at Auckland Medical School are valuable in placing students in
these high need, hard-to-staff regions. This programme places students at regional and rural
sites in the Northland DHB using Whangarei as the educational ‘hub’ (221). Otago Medical
School has used the Rural Medical Immersion Programme (RMIP) since 2007 to send 5th year
medical students into rural communities to train for one year. Ideally these schemes will act to
reduce the GP shortage in both rural and underserved regions.

31
More recently there have been calls for PGY2 and PGY3s to have rotations in general practice
as already occurs in some rural practices and in the West Coast, Nelson Marlborough,
MidCentral and Counties Manukau DHBs (202). Evidence from the UK suggests that these
rotations expose junior doctors to a wider variety of patients and conditions than hospital
attachments (222). This enables these doctors to have greater responsibility for patient
management while concurrently learning the importance of continuity of care (223, 224). Boyle
et al. (163) argue that without postgraduate placements in general practice there is the risk that
it could be a fall-back option that doctors “end up” (198) in after other specialities are tried, or
because they don’t gain a specialist training position, rather than being confirmed as the
speciality of choice at an earlier stage of training.
2.5.2 Medical Student Perceptions of General Practice
2.5.2.1 Negative Perceptions
Training experiences throughout medical school affect a student’s specialty preference.
Negative attitudes about general practice include the perception that it is “a last resort” (225),
is mundane (226), lacks prestige (227) and less intellectually challenging (228-231) than
specialist practice. This perception is reinforced by the ‘hidden curriculum’ that is perpetuated
by hospital specialists (229). The term ‘hidden curriculum’ has been defined as “the culture,
beliefs and behaviours of a community that are passed to students outside formal course
offerings” (232).
Studies of NZ medical students and recent graduates have found that only 9% (188), 16% (233)
and 30% (163) of them rank General Practice as their first choice of specialty. This is not
peculiar to New Zealand; a 2007 survey of 4th year American medical students at eleven schools
found that only 7% planned a career in primary care (234) and a UK study on recent medical
graduates found that general practice was the first choice of speciality for only 28% (235).
High levels of student loan debt from covering medical school fees also affect a student’s
interest in general practice (188, 233) as GP registrars in New Zealand are paid relatively poorly
compared to other specialty training programmes. By PGY3 25% of registered medical
graduates have left to practice overseas (26) which leaves the NZ medical workforce in a
precarious position of relying on IMGs (187).
Recent discussions between Health Workforce NZ (HWNZ) and PGY1s and PGY2s found that
these graduates were not tempted to enter general practice for several reasons. These included:
the negative perceptions that GPs worked long hours and that they needed to become small

32
business owners, both of which were undesirable; that GPs were poorly paid with less
beneficial terms than if employed by a DHB; that the runs needed for general practice training
entry were prioritised toward those entering specialist training and were often difficult to
achieve e.g., paediatrics; and finally that there were no GP role models within the DHB system
(236).
The lack of a defined pathway for career advancement may also affect both potential junior
doctor recruitment and the retention of mid-career GPs who are becoming dissatisfied with
general practice and wish for more prestige and renewed challenges (237). GPs in the UK that
are able to extend their role through a defined pathway as a GP with a Special Interest (GPwSI)
report increased intellectual stimulation and self-esteem (238).
2.5.2.2 Positive Perceptions and the role of student recruitment
There is a growing body of evidence that indicates that recruitment into general practice is
increased, especially in rural and underserved areas, by selecting students with a rural origin
(159, 218, 239, 240) or with experience living and working in underserved areas (241).
Including rotations in general practice in rural and high need settings also has beneficial effects,
as learning experiences have been found to affect their subsequent choice of specialty (242,
243). Positive perceptions influencing students selecting general practice as a career choice
include the perceived lifestyle and work-life balance (159, 228, 230) and flexible training
requirements (244).
North American studies that have used parental occupation and educational achievements as a
proxy for socioeconomic status have found that medical students with non-physician parents
or parents without postgraduate qualifications are more likely to enter primary care training
(160, 245, 246). In NZ older graduate entrants to medical school (‘Other Category’ at Otago)
are more likely to stay in NZ to practice and to specialise in general practice (247). Māori
students and recent graduates are also likely to be interested and enter into general practice
(248) with a major motivation being able to have a positive impact upon Māori health outcomes
(249). Therefore it is crucial that students from a wide range of backgrounds are recruited into
medical school and that all students have training exposure to high need regions as these actions
could increase the workforce supply to these areas (250-252).
The Medical Training Board argues that medical schools need “to build the confidence of
medical students and doctors in training in the extended significance of general practice in the

33
health service” (15) as many more medical students need to be directed into general practice to
meet the forecasted population demand. They believe that:
“the end purpose of medical training is the development, by design and not good
fortune, of a competent medical workforce: the right number, the right type, in the right
location and providing the right care” (15).
The increased input by HWNZ to promote general practice to graduates and the extra $3.8
million dollar funding the government has allocated toward increasing the number of GP
training places may finally be having a positive effect upon junior doctor career intentions. The
RNZCGP had their largest number of applicants for the 2014/14 GP Education Programme
(GPEP) intake (253).
2.5.3 Medical School Social Accountability
However studies of NZ medical school intakes have found that they are not as diverse as would
be hoped as they do not represent the sociodemographic makeup of NZ society (104). Māori
and Pacific peoples and people from low socioeconomic and rural regions have been
consistently under-represented in comparison to their numbers in the NZ population, while
students of European and Asian background and those from urban areas are over-represented.
Because of the research associating student origin with future place of practice it is essential
that there is a diverse medical student body in order to address workforce shortages in hard-to-
staff areas and to ensure that patients have sufficient choice available to them for health care
services.
Kuczewski and Brubaker (254) stated that creating a diverse medical workforce was an ethical
obligation for medical schools, incorporating the principles of beneficence and social justice
towards underserved communities and patients. They believe that fulfilling this obligation
creates a diverse group of graduates that are “fit for purpose” within the health workforce and
who are more likely to meet the needs of a diverse range of individuals. This has been
recognised by the University of Otago’s Division of Health Sciences which states within their
admissions policy:
Ideally the make-up of health professional classes should be equivalent to holding a
mirror up to society. In order to achieve this we aim to attract and support the most
academically able students from a wide variety of backgrounds. The gender, ethnic,

34
socioeconomic and rural/urban composition of our graduates should, more or less, reflect the
diverse communities in Aotearoa (104)
The WHO defines the social accountability of medical schools as “the obligation to direct their
education, research and service activities towards addressing the priority health concerns of the
community, region and/or nation that they have a mandate to serve” (255). This emphasises
the ability for social accountability to enable medical schools to address issues of equity,
particularly toward those underserved by the current health care system.
In recognition of this, Deans of Medical Schools in Australasia and the Pacific have established
the Medical Deans Social Accountability Coalition (MDSAC). This working group aims to
look at the challenges facing medical schools in being capable of forming “the kind of doctors
required by evolving health systems, and to respond to the health concerns of society” (256).
It could be argued that the kind of doctors currently needed by New Zealand are those that are
intent on training in general practice in order to reduce the critical shortages in this workforce
and because of its’ gatekeeper role. The Medical Training Board also recognises the low
representation of Maori and Pacific people in the health workforce as a priority issue but, they
believe that it needs to be addressed at the secondary school level (15).
In the UK, targeted programmes for underserved communities aim to widen access to medical
careers and overcome the barriers that exist for low socioeconomic students in particular (257).
Gorard et al (258) stated that there are three key barriers which can stop these students from
accessing higher education: situational barriers (cost, time and distance involved with
travelling for educational opportunities); institutional barriers (availability and flexibility of
opportunities offered by the institution); and dispositional barriers (the individual and their own
attitudes and motivations toward education). Medicine suffers from an additional dispositional
barrier of being stereotyped as an elitist profession for white rich men (259) or for the ‘very
brainy’ (189). Various health sciences programmes, both nationally and internationally, and at
the secondary and post-secondary levels, have aimed to overcome these stereotypes and rectify
the ‘leaky pipe’ of the schooling system (193, 196). However, as of yet, no targeted affirmative
action policy exists at either of the NZ medical schools for low socioeconomic students.
2.6 Definitions of Need for Health Care
Definitions of need for health care vary according to the country of enquiry. It has been stated
that that health need is simply an individual’s level of illness and how that illness and its’
required level of care has been perceived by the patient and the health care system (67).

35
However more recent definitions of need have begun to recognise the role of the population
group and the area in which an individual lives in determining, and being capable of
representing, a population’s level of need (65). Researchers have divided these determinants of
health into macro and micro levels. Macro-level health determinants operate at a population
level and include a country’s environment, its’ natural resources and its’ socio-economic
position because these all determine how wealth and health-related resources are distributed.
While at the micro-level, health determinants operate at an individual level and can include
personal income, housing, education, nutrition, alcohol intake, smoking habits and access to
healthcare (127). These health determinants can impact and increase both a population’s and
individual’s level of health need.
Ronald Andersen, an American professor of health services included health need within his
1968 model of factors that determined health service and that could lead to equitable or
inequitable access between individuals. His three factors were predisposing factors (e.g.
ethnicity, age), enabling factors (e.g. financial means, family support) and need. This need can
be both a perceived and an actual, evaluated need for healthcare. Thus need is divided into a
patient’s subjective evaluation of their level of illness as compared to a clinician’s objective
evaluation and measurement of need (260).
In New Zealand it is generally accepted that relative population deprivation, and therefore, by
association, need is covered by the NZ Deprivation Index (NZDep2013) (186) due to the strong
associations between deprivation and morbidity. Nine variables relating to deprivation from
the 2013 census are weighted to form an ordinal scale from 1 to 10, where 1 is the relatively
least deprived and 10 is the most deprived. The score aims to express eight dimensions of
deprivation.
Dimension of deprivation Description of variable (in order of
decreasing weight in the index)
Communication People aged <65 with no access to the
Internet at home
Income People aged 18-64 receiving a means tested
benefit

36
Income People living in equivalised* households
with income below an income threshold
Employment People aged 18-64 unemployed
Qualifications People aged 18-64 without any
qualifications
Owned home
Support
People not living in own home
People aged <65 living in a single parent
family
Living space People living in equivalised* households
below a bedroom occupancy threshold
Transport People with no access to a car
*Equivalisation: methods used to control for household composition
Figure 2.2: Deprivation Variables in the NZDep Score 2013 (186)
However this score has some problems when applied to the study of a communities’ health
need. This is because it neglects to include variables such as age and ethnicity which have a
strong association with higher health need. Therefore it makes it difficult to express the
increased vulnerability to poor primary care access that the very young, the very old and Māori
and Pacific peoples experience. The limitations of the NZDep Score in capturing all the
variables impacting upon health was acknowledged by Brabyn and Barnett (261) who included
measures of age and ethnicity in order to estimate rural community access to GP services.
In addition, because Māori and Pacific peoples are more likely to be socioeconomically
deprived it can be difficult to separate the ethnic inequalities in health from the socioeconomic
inequalities. These inequalities result to some degree, from the inequitable access to resources
(262), including health care facilities and the finances to pay for care. As Blakely et al. (263)
argues: “(i)n terms of the maldistribution of health by ‘deprivation’….we not only require
policies targeted at deprived people/places, but also policies that prevent deprivation in the first
place”. These policies may need to consider the effect of racism upon ethnic inequalities in
health as Māori report the highest prevalence of experiencing racial discrimination. This is

37
associated with lower physical and mental health and increased rates of smoking and
cardiovascular disease (264).
The other main limitation of the NZDep is that the scores apply to areas rather than individual
people and so the score acts as a proxy for reality (186). To overcome this issue, Blakely et al.
(262) combined individual level socio-economic measures with the neighbourhood deprivation
measure of the NZDep score to allow for assessment of study participants’ socioeconomic
position. This is to acknowledge the fact that while area-level deprivation has some important
effects on health, it is not as important as personal socio-economic deprivation effects (263).

38
3 GIS and Primary Care Research
In this chapter, I define a GIS and how they have been used in primary health care research
both internationally and within NZ.
3.1 Definition of GIS
Geographical Information Systems (GIS) are computer-based systems used to store, synthesise,
manipulate, analyse and display data that is connected through shared geographic coordinates.
They allow the user to overlay and integrate spatial, geographical features with aspatial
attributes such as census statistics to form maps according to queries of a database (265). This
enables GIS to act as a decision support system and problem solving tool from the scale of
countries to the scale of neighbourhoods (266). Most users of GIS rely on software packages
such as the ESRI ARCGIS suite, however GIS technology is becoming more accessible
through the development of web-based GIS applications such as Google Maps™/Google
Earth™. These act to democratise map production and the use of online geospatial data, putting
“powerful mapping technologies into the hands of the masses” (267) as they are free open
source software (FOSS); thus acting to counter the criticism that GIS has the potential to
disenfranchise potential users as it requires specialist skills in geography, cartography and data
management (268, 269).
3.2 GIS Uses in the Geography of Health
The study of the geography of health hinges upon the concepts of space and place. The term
‘space’ refers to the geographical position or location of limitations and opportunities that arise
and affect human activities. In contrast, place is a more personal concept that describes the
human significance and social experiences associated with specific ‘space’ locations in
everyday life (270).
The geography of health and GIS technology have been, up until recently, primarily concerned
with space and the geographical coordinates that connect data layers together in order to
identify locations in space. Mohan (270) argues that the goal of health geography is to
“construct accounts of why place matters” to these fields. This is because it is impossible to
separate the personal experience of health care from the place where it is given and received,
and the political and economic processes which govern it. The concept of ‘place’ allows for
patients lived experiences of primary care to be explored in research due to its subjective
qualities (79). Increasingly there is the recognition that GIS can also depict a more qualitative
interpretation of place including the social and political contexts surrounding a space (106).

39
Broadly speaking there are typically two types of GIS applications in health geography: to map
the geography of disease through health outcome and epidemiological data; and to map the
geography of healthcare systems. There are also studies that utilise methods from both of these
applications, for example in relation to planning for healthcare services and assessing
population needs (271). Healthcare systems research focuses on the supply and demand of
medical services. It can focus on specific populations to address issues of health inequality.
GIS have been used internationally to map the geographic location of medical services in
relation to high need population groups to determine accessibility and to aid in the planning of
new services (272-274). Using GIS to visualise spatial equity to health care services is a
powerful way of communicating who has access and who does not. This can be linked to
aspatial datasets in order to display the potential implications of poor access.
The ability of GIS to integrate and display complex data sets means that they have been widely
used in the public health sector. They have been applied to study disease surveillance (275),
neighbourhood health determinants (276) and health service planning. These applications
reflect the ability that GIS have to process both retrospective and real-time data for health
planning, service delivery and health promotion.
However, the use of GIS in primary care is far behind public health (107, 277). This is
unexpected because successful primary care health delivery requires the integration of a variety
of factors that a GIS are capable of displaying. These factors may range from being able to “see
the patient population better” (277) in relation to the spatial distribution of healthcare facilities
to more successfully targeting health interventions for high need communities (273).
There have been criticisms that GIS have the potential to be undemocratic as they require
specialist skills and access to both computers and software to allow usage (268). In developing
countries this may be exacerbated by an inability to access accurate reliable geo-referenced
baseline health data (278). More recent studies, in developing countries (268, 279) in particular,
have focused upon decentralising GIS capabilities to enable communities to visualise and plan
their own health services. Fisher (268) found that low resource community usage of GIS
improved when training exercises used data from regions known to the trainee. Initiatives such
as these may help to overcome any institutional inability or ‘intimidation’ at training in and
implementing GIS databases. However it is essential that users have the skills to critically
evaluate and analyse data and maps otherwise it can be easy to draw the wrong conclusions or
misinterpret analysed data (268).

40
3.2.1 Examples of Web-Based GIS applications in Health
While international interest in GIS appeared to peak in the late 1990s as GIS software became
more affordable and accessible, there has been a recent resurgence of interest as various
agencies are beginning to recognise the mapping potential of GIS and the democratic nature of
the internet for visualising data. The WHO (280) stated that GIS:
Allows policy makers to easily visualise problems in relation to existing health and
social services and the natural environment and so more effectively target resources
(Is an) ideal platform for the convergence of disease- specific information and their
analyses in relation to population settlements, surrounding social and health services
and the natural environment
Following on from this statement, the WHO has developed AccessMod©. This is an interactive
website that uses ESRI ARCGIS technology to model physical accessibility through travel time
to health care and the geographic coverage of health services in developing countries (281).
Providing this accurate baseline georeferenced health service data to developing countries acts
to democratise access to GIS technology for these populations.
In the USA, the Dartmouth Institute for Health Policy and Clinical Review has advocated
through its web-based Dartmouth Atlas of Healthcare, that a geographic focus on health is
crucial for planning and health reforms to enable equity of health care access (282).
Similarly to the above websites, the recently developed Atlas of Healthcare Variation by the
Health Quality and Safety Commission New Zealand, uses interactive mapping technology in
order to display variations in health service use and provision across a number of indicators
including asthma, diabetes and gout. The aim of this Atlas is not to establish an ideal
performance level in these outcomes but rather to “prompt debate and raise
questions…amongst clinicians, users and providers of health services about why any
differences exists, and to stimulate improvement through this debate” (283).
Most recently, this interactive platform has been used to display research on the variation of
medication dispensing for cardiovascular disease (CVD) prevention, maps showing that
particular high-risk groups such as younger people, women and those of Māori and Pacific
ethnicity, were less likely to receive preventative medications. Visualising the data highlighted
the gaps to patients, health providers and health planners enabling improvement to be made in
CVD prevention (284-286).

41
3.3 International GIS applications in Primary Care
Internationally, GIS have had little uptake in the primary care sector despite the growing
research showing its’ potential applications to health care planning in particular (107, 271,
277). Most primary care uses of GIS have been quantitative, focusing upon health care
accessibility and availability (272, 287) as these are spatial in nature (59) so lend themselves
to GIS analysis, particularly in comparing primary care access between high and low
socioeconomic neighbourhoods in urban centres (274, 288) or between urban and rural
communities (33). These studies have been achieved through combining spatial datasets on
general practice locations with aspatial census data. This enables the identification of
underserviced populations and places to be linked to demographic features such as the
socioeconomic status and ethnic groupings of residents. Accessibility studies aim to quantify
the equity of access to primary care services as it was a key principle of the Alma-Ata
Declaration to ensure that facilities were provided because of health need, not because of
individual or social characteristics (79). Equity of access can vary greatly across space.
Studies of spatial accessibility to healthcare providers is a topic of great interest to both health
geographers and primary health care researchers due to concerns about the impacts of inequity
in service provision. Study methods have been broadly categorised into four groups: provider
to population ratios; distance to nearest provider; average distance to a set of providers; and
gravitational models of provider choice (119). Provider to population ratios have inherent
limitations due to being a simple ‘headcount’ ratio of GP supply to population number. Studies
using distance measures to a provider or a set of providers typically rely upon a road network
analysis method using GIS. This method allows for a “relational evaluation” of service supply
to population demand within a specified area so may be preferable to provider to population
ratios (289). Gravitational models study the relations between supply and demand in different
regions and include measures of population, healthcare provider capacity and travel times in a
ratio measure (21).
Recent reviews of GIS methodology have specifically described the Two Step Floating
Catchment Area (2SFCA) method as a sophisticated and popular technique developed by Luo
and Wang (38) to measure GP to population ratios and identify GP workforce shortage areas.
Unique among the modelling methods, it allows for cross-boundary flow of patients (147).
However it does not allow cross-boundary flow of doctors, so doctors within a specified
catchment area may be labelled as accessible to patients, while others outside are labelled as
inaccessible. This is likely to be unrealistic if the catchments were assessed against true patient

42
accessibility (21, 290). Unfortunately few of the studies using this method have been verified
against real-world patient data on GP choice, so most research outcomes have been measures
of potential accessibility rather than realised accessibility (272). One study that did compare
real patient data with GIS measures of accessibility via bus and personal transport, found that
rural areas without public transport also had the highest levels of health need but the poorest
access to GP services (22).
However, using real patient data in GP catchment modelling also has its problems as Allan
(291) argues that studies frequently assume that an individual’s place is the space surrounding
their residential address. He believes that GIS research in primary care needs to reconceptualise
the concept of place and its’ effect on GP catchment modelling. In contrast, Allan believes that
it would be more realistic to view patient access to GPs from a “range of locational concepts”
including a person’s daily activity space. Activity space has been defined as the spaces or areas
within which a person moves or travels through regularly (292). This could affect patient
choice, because, as Wiles and Rosenberg (127) reason, people may choose their GP as they do
any other consumer service, for reasons of convenience. Therefore an individual may choose a
GP because they are “near their homes, where they work, where they or their children go to
school or even in the shopping centres and precincts where they go to buy goods and services”.
3.3.1 International Examples of Mixed Methods in Primary Care Research Using GIS
Mixed method approaches to assessing primary care service provision through GIS are rare
despite the many advantages this methodology could offer primary care research (105). The
principal advantage is the method’s ability to combine the objective analysis of results from
the quantitative experimental methods, with the thematic analysis of the qualitative methods
(293), thus enabling a comprehensive picture of a research problem (294). Creswell et al (295)
recommended that a mixed methods approach be used to “add rigor” to primary care research.
Bazemore (107) used a mixed methods approach to incorporate GIS technology into the clinical
management of deprived urban communities and then qualitatively assessed the clinic leaders
and stakeholders responses to the process. This study identified both enthusiasm and
apprehension about the concept of using GIS to inform clinical decision making. Similarly to
both Boulos (296) and Joyce (297), this study found that time, the potential cost and the
technical expertise needed act to limit the use of GIS in healthcare settings.
In contrast Hawthorne and Kwan (108), used interviews with low-income urban residents to
assess their views of accessibility to health providers and then combined these with a

43
quantitative GIS assessment of distance to healthcare. This study aimed to move the focus away
from a clinical managers’ perception of population need and simplistic measures of geographic
accessibility towards incorporating the experiences and perspectives of affected communities
themselves; thus finding that once their views are included, there is a potential added distance
to access care because not all patients choose to use the closest GP, or they may be unable to
get an appointment because the GP is servicing a large community.
3.4 GIS Primary Health Applications in NZ
Use of GIS in New Zealand primary care planning, monitoring and delivery experienced a
surge of interest in the mid-2000s but has been minimal and sporadic since then. Local research
has focused more on the supply and ‘potential accessibility’ of primary care services rather
than patient demand through utilisation, “realised access” data or qualitative interviews with
patients on their level of use over a period of time. Patient demand has typically been estimated
through practice population characteristics such as GP to population ratio.
Supply of primary care services has been estimated through studies on: primary care access
through travel time (98); distance to closest GP (11, 298); the distribution of medical practices
in Auckland as compared to dental surgeries (299); neighbourhood access to health care
facilities depending on the level socioeconomic disadvantage (74, 300, 301) and urban and
rural settings (23); and the pilot of this study that focused on the use of GIS in rural health
service planning (146). These studies have all attempted to quantify the population catchment
for a general practice service.
Potential accessibility to healthcare has been a key focus area as this varies drastically in NZ
communities and has a direct influence on health inequalities and morbidity (2, 78, 302). There
is an association between greater morbidity and being resident within a highly deprived area.
This greater morbidity leads to a higher need for primary health care services. However
residents in these areas often find it more difficult, for various reasons, to access health care
services than people in more socioeconomically privileged areas.
The multiple definitions of what constitutes accessibility to health care suggest that it could be
a difficult concept to measure quantitatively. Accessibility measurements have varied in these
studies, from using the centre of a census meshblock to the closest GP (98), to a 15km distance
from the central general post office (299). These forms of measurement have attempted to
approximate geographic proximity for the population to a health care facility as a result of
distance or travel time. This is because use of health care facilities tends to decrease as distance

44
and travel time increases. However using aggregated data and area centroids rather than exact
population locations can cause “spatial uncertainty” and misleading results (271). Centroids
are the geometric centre of a polygon and are not based upon the real population distribution
within the polygon area.
Brabyn and Gower (96) compared three GIS methods to model GP access for the NZ
population. These three methods were: GP to population ratio; least cost path analysis (LCPA);
and a Location-Allocation model (LAM). LCPA focused on population-weighted average road
travel time to the nearest GP whereas the LAM allocated neighbouring residents to their nearest
GP until the full-time workload equivalent of 1400 patients per GP was reached. LAM aims to
display spatial imbalances in resource allocation and has a long history of use in health
geography (303). Poor access was defined as a travel time to a GP of more than 30 minutes as
has been used internationally (304). American research has found that a travel time of less than
30 minutes to health care facilities, indicating good accessibility to care, was correlated with
an increase in self-reported good health (57). NZ research into accessibility of hospital care
through GIS modelling used the threshold of one hour to define proximity (305). Because
hospitals provide secondary and tertiary level care, a longer travel distance is more acceptable
than similar distances to GP services.
The Brabyn and Gower study suffers from the limitation of estimating a GP’s practice
population and assuming that patients act through “rational choice” (289), minimising their
travel time by going to their closest GP. This neglects to acknowledge cross-boundary flow of
patients between practices and the true “revealed accessibility” or utilisation, as patients may
travel further than their closest practice to receive their required treatment (108). This crossing
may be due to a deliberate choice for reasons such as, an inability to get an appointment with
the closest GP as they may be serving a large community or the patient may prefer the GP
service in another region due to gender, cultural or other reasons.
Hays et al. (306) found that only 19% of residents in Gisborne, NZ attended their closest
general practice and that prior knowledge of the practice was an important deciding factor. This
finding is supported by international studies on primary care usage. A South African study
(289) found that 44.26% of patients didn’t visit or use their closest facility and in the US one
study found that 32% of survey respondents had bypassed their closest primary care provider
(307). Rosenberg (308) argues that an alternative method to LAM would place patients at the
centre of the analysis with regards to choices and decisions made about their health provider

45
instead of services ‘selecting’ patients as multiple socio-cultural (e.g., community, family) and
political-economic (e.g., government policy) influences affect an individuals’ choice of doctor.
Interestingly, however, in common with Pearce et al (74), the Brabyn and Gower study found
that more deprived regions with higher 2001 NZDep scores were more strongly correlated with
better access to GPs through having shorter travel times to GPs than less deprived regions.
Field et al. (300) also found a positive association between higher levels of access to
community resources and areas of high deprivation and Stangroom et al.’s (141) study on
mental health patients in NZ found that individuals who lived in the most deprived areas visited
their GP more often than those who lived in the least deprived areas.
This suggests that at least for some communities and some health conditions, potential
accessibility does not equal realised accessibility and that other barriers besides geographical,
have a greater impact on access to care. This is supported by data from the 2011/12 New
Zealand Health Survey which found that 27% of adults had an unmet need for primary health
care services in the last 12 months. This unmet need was mainly due to cost and/or an inability
to get an appointment with their usual GP within 24 hours and was more likely to affect Māori,
Pacific peoples and those living in more deprived regions (4). Issues around lack of choice at
their general practice and inability to be seen within a preferred timeframe were reported by
Māori participants as a barrier to access in a qualitative study by Jansen et al. (7). Similar issues
regarding lack of choice were found in Panelli et al.’s (309) study on NZ rural patients’ actual
utilisation of primary care services. Participants expressed concerns about travel time and costs
due to working hours lost in travel and practice co-payments, GP overloading issues and an
inability to see their preferred gender of GP. A recent Australian study on which dimensions
of accessibility were considered most important for rural residents on selecting a GP for routine
health care found that preference for a particular GP and GP availability were more important
than distance to and the cost of the service (310).
Farry et al’s (146) study on rural planning of health services using GIS partially fulfilled the
Ministry of Health’s recommendation (144) that information-gathering and research on the use
of GIS in rural health needs assessment be undertaken. That is because there is a real health
risk to rural New Zealanders through the physical distance they need to overcome to access
care. The concerns around distance and cost to access care for rural populations are worsened
by government agencies being reluctant to examine the issues. Internationally, Taylor et al
(311) have argued that GIS should be used as a tool to plan for future healthcare clinics in order

46
to maximise access to care. This could occur through forming patient catchments based upon
actual travel time measurements in order to minimise travel distance for the majority of people.
Unlike international studies, primary care research in New Zealand using GIS has not, as of
yet, included a mixed methods approach through incorporating the perspectives of study
participants. This means that the picture of GP supply in NZ is incomplete as the focus on
quantitative studies has denied the populations affected by poor primary care services the
ability to express their experiences. Studies such as Brabyn and Gower’s (96) would have been
enriched by the inclusion of a qualitative aspect to determine if patients choose a particular
practice over another and their reasons, if any, for not using the closest practice. Jansen et al.’s
study (7) could have been combined with a quantitative assessment of access to complement
their qualitative findings.
In addition none of the GIS primary care studies undertaken in NZ have incorporated the
perspective of a non-specialist attempting to use GIS software. Considering that much of the
stated reluctance to include GIS in primary care workplaces stems from intimidation at a
perceived skill level required to use the software it is important that this gap in the research is
filled as then other non-specialists may be encouraged at the potential for them to make use of
it. While NZ research appears to be in agreement that GIS provides a powerful method of
visualising health inequality, there seems to be more work needed to convince both the key
stakeholders in health care planning and delivery and general practices to incorporate GIS
technology into workplaces.
3.5 Barriers to Use of GIS in Health Settings
Higgs (278) found that there were behavioural, cultural and organisational factors behind the
slow acceptance of GIS in the UK National Health Service despite there being easy access to
GIS software. The reasons included a lack of spatial data-handling skills and a low level of
awareness of the potential value of GIS in spatially representing population and health-needs
based information. There was the understanding that to implement GIS successfully into the
NHS it needed the appropriate infrastructure including staff, training, resources and a sufficient
budget. Additionally there was the understanding that the GIS application had to fit the needs
and requirements of the users so that its’ use was optimised rather than being tailored to suit
GIS specialists only. This requirement meant that the users needed to be involved in the process
of developing a potential GIS application.

47
Joyce (297) interviewed public health decision-makers to uncover the reasons behind the slow
uptake of GIS in health settings. This study found that while participants valued GIS for its
ability to inform decision making, they expressed concerns about visualised data being
misinterpreted or used inaccurately. In particular participants spoke of the risk of using a partial
view of reality to assume causality (271). This error arises because map interpretation is a
complex process that uses both perceptive and cognitive elements. Map elements such as the
scale of the image, the image chosen and the colours chosen to represent symbols are not
neutral and so can be easily manipulated to reinforce a particular selected message. This can
lead to the “gee whiz” effect, in which GIS are used to create visually striking maps that appear
to show a pattern when in reality no such pattern is evident (312).

48
4 Methods
This section outlines the methods used in this study, including study design, ethical
considerations, data collection, and analysis.
4.1 Mixed Methods Design
The geography of health and software systems used to visualise them, such as GIS, have
traditionally been guided by, and positioned within, the epistemological positivist theoretical
framework. This is because they are believed to depict a quantitative, reductionist, singular
reality. However there is the growing understanding that GIS can visualise and map multiple,
pluralistic realities which are increasingly including qualitative elements (106). Thus research
using GIS is transitioning more toward a post-positivist epistemological worldview. Post-
positivists believe that reality can only be approximated so it accepts the use of multiple
methods in research as a way of capturing as much of reality as possible (313).
Mixed methods methodology is typically conducted within a pragmatic worldview that allows
for a problem centred, “what works” (293) approach to addressing research questions. Mixed
methods research (MMR) appeared to emerge simultaneously within multiple disciplines in the
late 1980s as researchers became aware that combining both qualitative and quantitative data
forms offered the most complete exploration of a research problem (293, 294, 314). It allows
the researcher to merge the exploratory framework of qualitative research with the
confirmatory aims of quantitative methodology (313). It is now considered as one of the three
major research paradigms (315).
This study combines quantitative methodologies with qualitative Action Research thereby
forming a concurrent embedded mixed methods approach to research enquiry. This
‘embedded’ design is led by a primarily quantitative approach and supported by secondary
qualitative methods to expand the breadth and range of inquiry. Integration of the two research
strands will occur in the analysis and discussion.
A pragmatic worldview also underpins Action Research methodology as it generates
knowledge through action and experimentation (316). Action research is research done by an
individual upon their own practice or within the practices of a collective, it is not research done
“on” others (317). It is the research methodology of the “insider”, not that of an “outsider or
spectator” (318). Therefore it allows for a qualitative subjective 1st person account of the
49
process involved in developing the GIS database through its critical and self-critical action-
reflection cycles (318). These cycles of observation, reflection, action, evaluation and
modification enable the transformation and improvement of an individual’s practices leading
to solutions to practical problems (319).
Figure 4.1: Action Research Spiral (317)
Action Research methodological practices arose from social sciences research in the 1940s.
The term first being coined by Kurt Lewin in research on problems within American minority
populations (320). Lewin believed that Action Research acted to help the practitioner or
researcher as it generated knowledge and enabled the researcher to bring change to social
systems which they belonged to. It is predominately used within educational research although
it is increasingly being seen in health care settings.
4.2 Ethical Considerations
Prior to the project commencing, the ethical issues of the research were considered. The
University of Otago Human Ethics Committee (Category A) granted ethical approval of the
project in April 2014 (Ref 14/049) (Appendix A).

50
The Ngāi Tahu Research Consultation Committee at the University of Otago were consulted
regarding the impact of this study on Māori and how the study could best represent the needs
of Māori. It was recommended that the ethnicity of medical students was collected as part of
the analysis on student origin. Their endorsement of the project was received in April 2014.
4.3 Participants
To achieve the three aims of the study there were three broad participant groups:
All NZ general practices that were listed on DHB and PHO websites
All general practices involved in training undergraduate 4th- 6th year medical students
from the three University of Otago Schools of Medicine: Dunedin, Christchurch and
Wellington in 2014
2014 2nd year medical students from Otago and Auckland medical schools
Exclusion criteria were 2nd year international medical students as including their home origin
was beyond the scope of the study.
4.4 Data collection
Address location data on NZ general practices was accessed through DHB and PHO website
listings. Address data on teaching practices was obtained from administrators of the 4th to 6th
year teaching programmes at Dunedin, Christchurch and Wellington Schools of Medicine.
Anonymised address data on 2014 2nd year student origin was obtained from the University of
Otago Planning and Funding Division and the University of Auckland Faculty of Medical and
Health Sciences.
Confidentiality of electronic data within the GIS database was maintained through being
password- protected. The GIS database will continue to be kept securely for an indefinite period
in order to allow future analysis.
A reflective journal was maintained by the researcher to identify key themes emerging through
the development of the GIS database.
4.5 Geospatial analyses: Quantitative data
The LINZ NZ mainland contours file was the initial file downloaded to provide the base map
layer on ArcMap, the ArcGIS 10.2 software platform (Esri, Redlands, CA). The database used
51
the NZGD Transverse Mercator 2000 projected coordinate system. This is the standard
recommended coordinate system for NZ.
4.5.1 Geocoding
Physical address data was spatially located through a process referred to as geocoding using
the Land Information New Zealand (LINZ) NZ Street Address (Electoral) file. The dataset is
released for public use under Creative Commons by LINZ. The geocoding process converts
street level address information into specific latitude and longitude coordinates to the
individual household level. This creates a ‘point’ feature that can be symbolised and identified
on a map. The LINZ Street Address file was developed for electoral purposes so that all address
points that may be used by electors are listed. It locates addresses within a specific meshblock
which is a fundamental requirement of the NZ electoral system (Section 72 Electoral Act 1993).
This allows the address to be matched with 2013 census datasets at the meshblock level for
demographic characteristics such as ethnicity, age, and NZDep score. This file is updated
weekly to enable events such as snap elections to be possible.
It is not possible to geocode P.O Boxes. Addresses that were not in the reference dataset were
geocoded to the closest possible neighbour within the same meshblock. GoogleMaps™ was
used to verify locations of addresses if there were multiple matches, unmatched addresses and
if addresses were matched to the wrong location. Because of this, each geocoded record was
individually checked to ensure it was accurately located as a specific point.
4.5.2 Census Meshblocks
Meshblock boundaries are commonly defined by street centrelines. They are the smallest
geographical unit Statistics NZ collects data on. NZ Statistics and the NZ Deprivation Score
which is derived from census information can only be expressed at the minimum geographic
level of the meshblock. In the 2013 census there were 46,637 meshblock units which varied in
size from small urban blocks to large rural areas. They contained a median of approximately
81 people (321). The NZDep Score aggregates meshblocks so that the score covers an area
containing at least 100 individuals (186). This enables generalisations to be made about an area
but not about an individual.
It is preferable to use meshblock level data over the larger census area unit as larger areal units
cause the ‘scale effect’ through reducing the number of units leading to possible increase in the
measure of association. In addition, the NZDep score becomes less representative of the
52
population measured if a large areal unit is used as it introduces more heterogeneity into the
population (322).
4.5.3 General Practices
4.5.3.1 Service Areas
General practice geocoded addresses were used to calculate service areas of a 30 minute
boundary limit. A service area is an area that covers all the roads that can be reached within a
specified travel time limit of a location. The 30 minute boundary level was selected due to
research indicating that this is the patient “ideal” limit for travel time to access primary health
care (304).
4.5.3.1.1 Creating a Road Network
The first step to create the service areas was to make a road network. A road network is a series
of lines that are connected to form polylines which represent all the roads contained within a
dataset. Every line road segment has specific attributes linked to it such as its length in metres,
the speed limit and the time in minutes that it takes to travel.
To create the road network the Improved NZ road centrelines (August 2011) file was
downloaded from the Koordinates website. This file is based on LINZ data but has been
improved and is updated by Open GPS Maps, an open source data project. The LINZ data file
required some cleaning and inclusion of necessary attribute fields. The cleaning included the
removal of unnecessary line features that would create false and unrealistic travel times such
as district boundary lines, railway tracks and walkways in forest parks. Some unconnected road
line features required digitising through the Editor toolbar to connect them to the existing road
network as they created false gaps in the service area polygons. It was also necessary to add an
attribute related to travel time in minutes by relating the speed limit of the road section to its
length.
4.5.3.1.2 Network Analysis to create Service Areas
The road network was then analysed by the Network Analyst tool on ARCGIS to create service
areas around the geocoded points in the general practice data file. The Network Analyst tool
calculates distances and travel times based on the most direct and shortest route available in
the road network. The analysis produces a polygon shape around each general practice point.
The size of the shape represents the 30 minute travel time toward the general practice. The
shape of general practice service areas can vary depending upon where they are located. In

53
urban areas there are typically multiple overlapping polygons because the density of practices
is higher whereas in rural areas the catchments are non-overlapping as the density of practices
is considerably lower. Service areas created through road network analysis provide a more
accurate model than straight-line or ‘as the crow flies’ catchments based on distance alone.
Using distance alone can give an unrealistic picture due to the travel time obstacles presented
by different topographical features such as mountains.
The service area estimates the geographical catchment of a general practice through travel time.
This geographical catchment was then used to describe the demographic composition of the
patients who have access within a 30 minute travel time to the general practice. This was done
through linking the service area with census demographic characteristics. In order to describe
the demographic details of the service areas it was necessary to use the Union tool on the
service area polygons on ARCGIS. The Union tool divided and delineated the polygons where
they overlapped so that each segment of a polygon had a unique identifier attached to it. This
process created a very large dataset of over 130,000 entries that was too large for the computer
and ARCGIS to work with so a custom script was found by Dr Tony Moore and used to
complete the process. The custom script used the dataset that contained the overlapping
polygons and created a new layer with the overlaps removed so that there were no visible
boundaries between service areas. The tool also added two new fields to the attribute table that
contained the number of overlapping polygons and that identified the number of GPs servicing
each polygon.
This dataset was spatially joined to the NZ Statistics geographic boundary file of the 2013
census meshblocks and their associated census demographic characteristics. For these to join
accurately some formatting of the dataset was required as there needed to be an exact match in
font and format between the joined fields. To provide some indication of the level of health
need within a meshblock, this project used the readily available and widely used NZ
Deprivation Score. The updated 2013 census file was available in May 2014 from the
Wellington School of Medicine website, enabling this project to have the most accurate dataset
available.
However, as this score does not include variables such as smoking, ethnicity or the age
structure of a population in the indicators of deprivation, despite them being associated with
higher health need. For this reason, these variables, and ones related to household income, level
of education and unemployment rates were selected from the 2013 census to be included within

54
the database. The average number of general practices servicing each NZDep score (a feature
linked to each polygon) was then able to be calculated for the South Island. Because data on
the FTE GP number for each practice was not readily available, this calculation has the
limitation of not representing the average number of FTE GPs per NZDep score.
4.5.4 Teaching Practices
The teaching practices were formatted into an excel spreadsheet to be uploaded into the
ARCGIS platform. They were then mapped as point features to visualise the number of
teaching practices used by the three University of Otago Schools of Medicine in 2014. They
were also compared to the NZDep Score of the meshblock immediately containing the teaching
practice.
While data was received from the Schools and included within the database about teaching
practices used by 6th year Trainee Interns, this was excluded from the mapping analysis as these
students select their GP placements. It was felt that it was more important to investigate where
medical schools were sending students without the individual student’s choice being a factor.
4.5.5 Medical Student Origin
Individual student address data was spatially joined to census meshblock data to allow NZDep
scores to be allocated to each student’s home address. Student address data was also aggregated
within the DHB boundaries using the NZ DHB 2012 boundary file from NZ Statistics. The
number of students admitted per DHB was compared to the 20-24 year old population of the
DHB in order to indicate areas of low student recruitment.
The DHB boundary file had a HTML pop-up box added to each district. This contained
statistical information related to FTE GP to 100,000 population ratio and the census variables
previously detailed as above, to indicate health need and demand within the DHB.
4.6 Qualitative data
A reflective journal was kept throughout the duration of the study, using free-flowing “text as
a window into experience” (323). Inductive thematic analysis of this journal was carried out.
Themes were identified from this process.
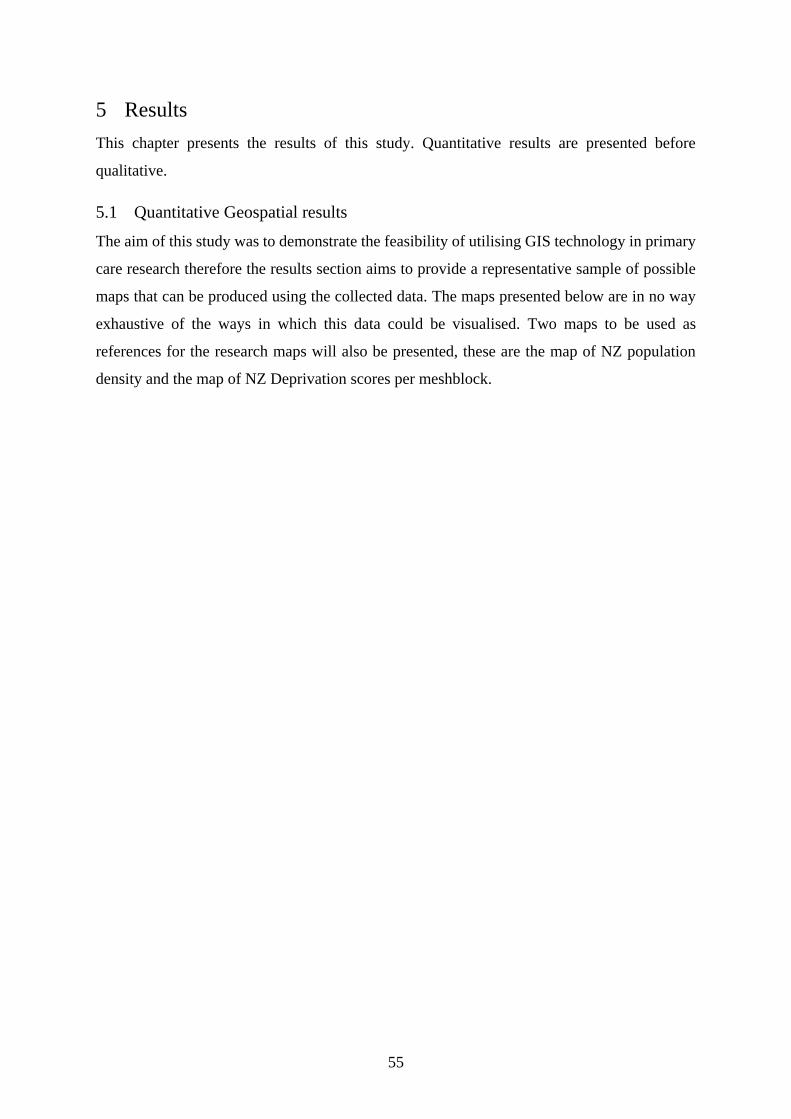
55
5 Results
This chapter presents the results of this study. Quantitative results are presented before
qualitative.
5.1 Quantitative Geospatial results
The aim of this study was to demonstrate the feasibility of utilising GIS technology in primary
care research therefore the results section aims to provide a representative sample of possible
maps that can be produced using the collected data. The maps presented below are in no way
exhaustive of the ways in which this data could be visualised. Two maps to be used as
references for the research maps will also be presented, these are the map of NZ population
density and the map of NZ Deprivation scores per meshblock.

56
Figure 5.1: Population density of NZ: 2013 Census Data

57
Figure 5.2: NZDep Scores 2013 by meshblock

58
Figure 5.1 shows the urbanised nature of the NZ population with clusters of high density
populations in the main urban centres while the vast majority of the country is very sparsely
populated with a very low population density.
Figure 5.2 enables the visualisation of the nationwide pattern of deprivation. Communities of
high deprivation are concentrated in Northland, East Cape and Waikato. These are also
predominately rural areas with high Māori populations’ resident, showing the association
between ethnicity, rurality and deprivation that is particularly evident in the North Island of
NZ. Rural areas of the South Island are more likely to be characterised by deprivation scores
in the low to middle range.
5.1.1 General Practices
A total of 1064 General Practices were located and geocoded in the dataset.
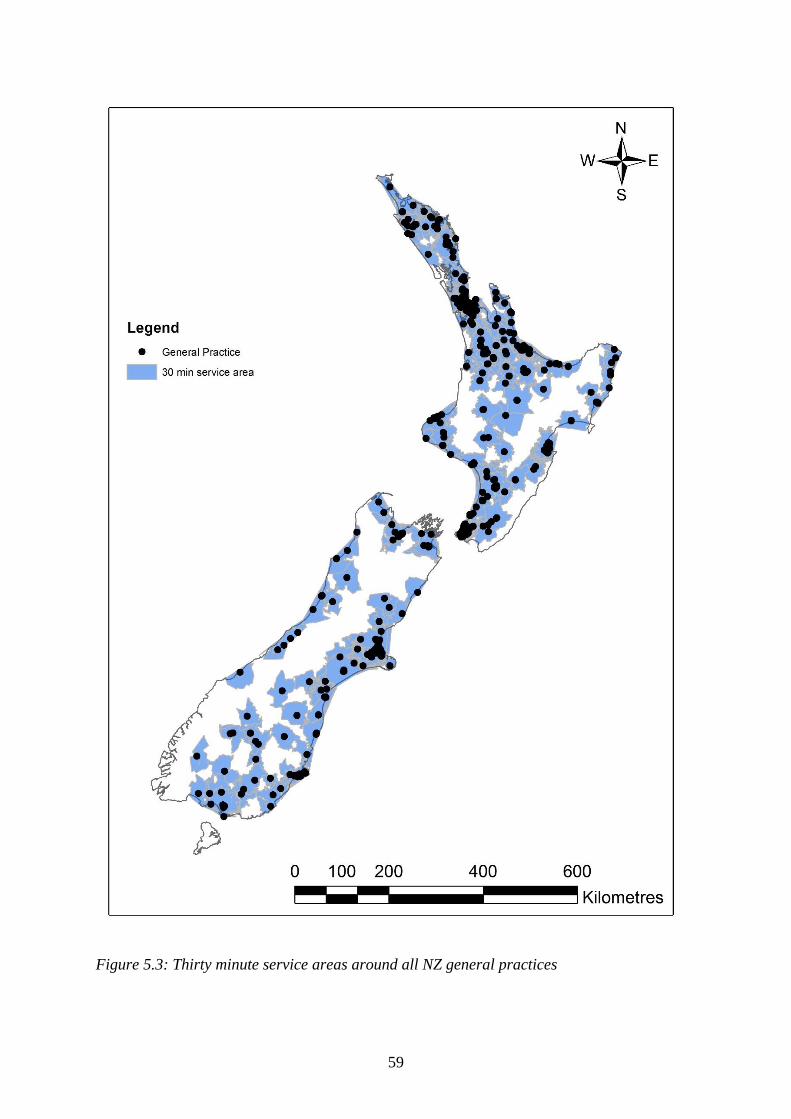
59
Figure 5.3: Thirty minute service areas around all NZ general practices

60
Figure 5.3 shows all the general practices and clinics listed on the DHB and PHO websites and
the areas that are within thirty minutes travel time. The areas of very low population density
are also areas missing general practice service provision. But there are low population density
regions around the East Cape and Waikato which also have high NZDep Scores indicating
there may be higher health need in these regions that could be unmet.
To better visualise the service level available per practice it would be valuable to have data on
the FTE GP for each practice as this would more accurately depict the supply of GPs to an area.
This data could then be symbolised on the map as a graduated symbol to display the level of
FTE GPs per practice. In addition it would be of interest to include data on whether the rural
clinics are run by GPs at a timetabled session once weekly for example, with Rural Nurse
Specialists or Nurse Practitioners providing most of the care outside of that session as this
would also affect GP service supply. The service areas map also does not include public
transport routes. The inclusion of this would be important to pursue in future research,
especially in urban regions, as many low income individuals would be likely to rely on this to
access services such as health care.
Figure 5.4: Average number of General Practices in the South Island per NZDep Score 2013
This graph shows the average number of general practices per NZDep scores in the South
Island. Because the 30 minute travel time polygon of each general practice covers a number of
53 50
38
28
3932
27
43
33
53
0
10
20
30
40
50
60
Num
ver
of
Gen
eral
Pra
ctic
es
NZDep Score 2013

61
meshblocks with different NZDep scores the scores have been analysed to provide the average
number of general practices per NZDep score.
Forty-six polygons that general practices service area boundaries covered were not allocated
an NZDep Score. Missing NZDep scores are due to values being withheld from the index
because of small numbers of individuals and/or missing data affecting the proportions in two
or more of the nine denominators that are used to calculate the dimensions of deprivation. If
the scores were not withheld then the reliability of the index value would be negatively affected
(186).
62
Figure 5.5: Density of General Practices over NZ
This shows the density of General Practices over the NZ landmass with high concentrations
over main urban areas compared to rural and no practices over low density population areas.

63
Figure 5.6: Density of General Practices over the Greater Auckland Area
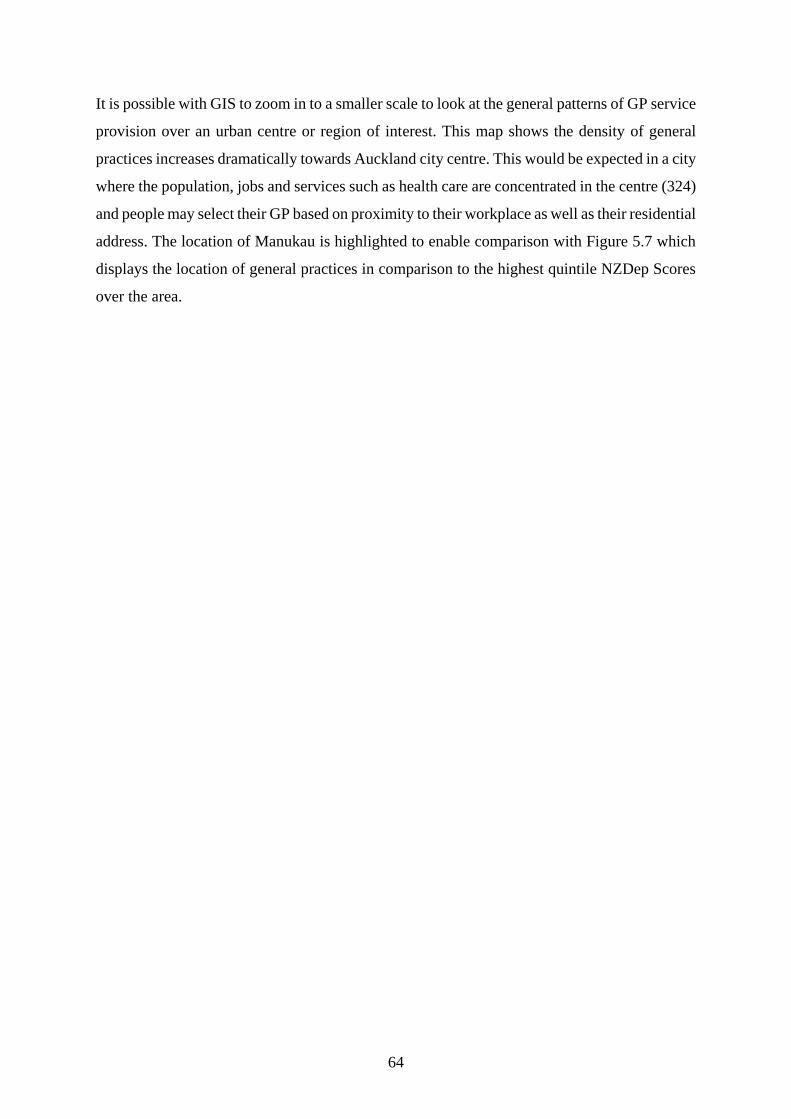
64
It is possible with GIS to zoom in to a smaller scale to look at the general patterns of GP service
provision over an urban centre or region of interest. This map shows the density of general
practices increases dramatically towards Auckland city centre. This would be expected in a city
where the population, jobs and services such as health care are concentrated in the centre (324)
and people may select their GP based on proximity to their workplace as well as their residential
address. The location of Manukau is highlighted to enable comparison with Figure 5.7 which
displays the location of general practices in comparison to the highest quintile NZDep Scores
over the area.

65
Figure 5.7: Location of General Practices in Counties Manukau DHB with the highest
deprivation scores and population density as represented by meshblocks

66
GIS can then zoom closer in to see the actual detail of general practice locations and where
they are located in relation to deprivation, and by proxy, health need. Counties Manukau DHB
is of interest because there is a low FTE GP per 100,000 population and a high percentage of
their population resident in high deprivation areas. This picture would be enhanced by FTE GP
numbers being linked to each practice so that the practice could have graduated symbols
depending on their FTE number. This would more accurately show areas that would benefit
from more practices due to low FTE GP numbers and a high population density.
5.1.2 Teaching Practices
A total of 186 teaching practices that trained students in 2013 were located and geocoded in
ArcMap. The data from the three University of Otago Schools of Medicine was merged to form
one data layer.
Figure 5.8: University of Otago Teaching Practices with NZDep Score 2013
Figure 5.8 is based upon the NZDep Score applying to the meshblock containing the general
practice and not upon the service area averages as in the general practice example. Therefore
this score represents the immediate area containing 100-200 individuals within the meshblock.
A great deal of caution is necessary in interpreting the above graph due to its reliance upon a
meshblock level of measuring deprivation. Ideally this graph would be representing the service
9 1115 16
19
32
19 21
27
13
0
5
10
15
20
25
30
35
Sum
of
Tea
chin
g P
ract
ices
NZDep Score
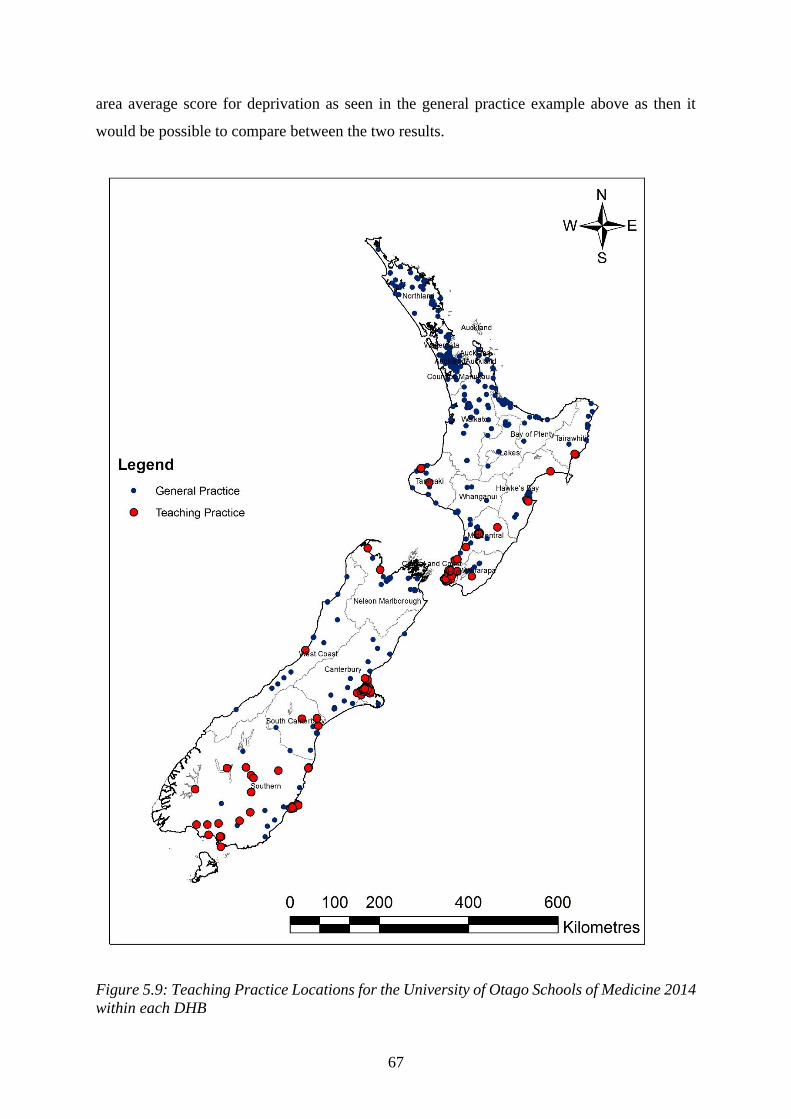
67
area average score for deprivation as seen in the general practice example above as then it
would be possible to compare between the two results.
Figure 5.9: Teaching Practice Locations for the University of Otago Schools of Medicine 2014
within each DHB
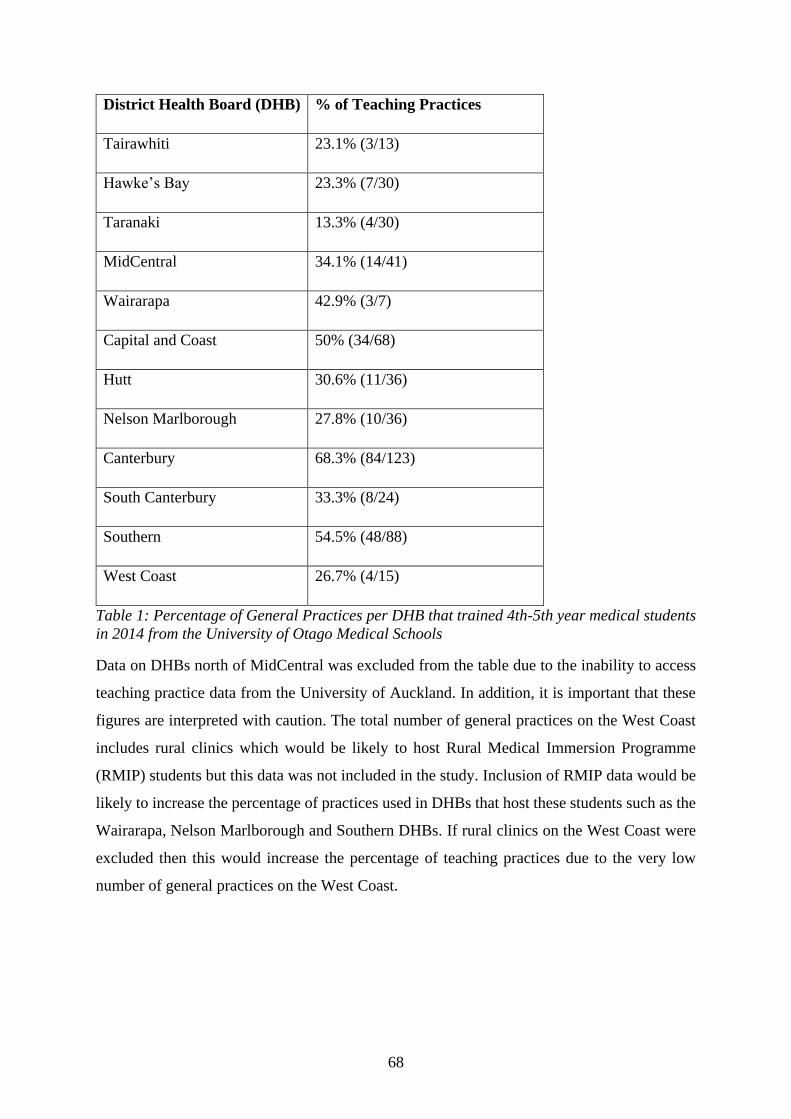
68
District Health Board (DHB) % of Teaching Practices
Tairawhiti 23.1% (3/13)
Hawke’s Bay 23.3% (7/30)
Taranaki 13.3% (4/30)
MidCentral 34.1% (14/41)
Wairarapa 42.9% (3/7)
Capital and Coast 50% (34/68)
Hutt 30.6% (11/36)
Nelson Marlborough 27.8% (10/36)
Canterbury 68.3% (84/123)
South Canterbury 33.3% (8/24)
Southern 54.5% (48/88)
West Coast 26.7% (4/15)
Table 1: Percentage of General Practices per DHB that trained 4th-5th year medical students
in 2014 from the University of Otago Medical Schools
Data on DHBs north of MidCentral was excluded from the table due to the inability to access
teaching practice data from the University of Auckland. In addition, it is important that these
figures are interpreted with caution. The total number of general practices on the West Coast
includes rural clinics which would be likely to host Rural Medical Immersion Programme
(RMIP) students but this data was not included in the study. Inclusion of RMIP data would be
likely to increase the percentage of practices used in DHBs that host these students such as the
Wairarapa, Nelson Marlborough and Southern DHBs. If rural clinics on the West Coast were
excluded then this would increase the percentage of teaching practices due to the very low
number of general practices on the West Coast.

69
Figure 5.10: Teaching Practices in the Dunedin urban centre compared to high deprivation
areas

70
Figure 5.11: Teaching Practices in the Porirua region compared to high deprivation areas
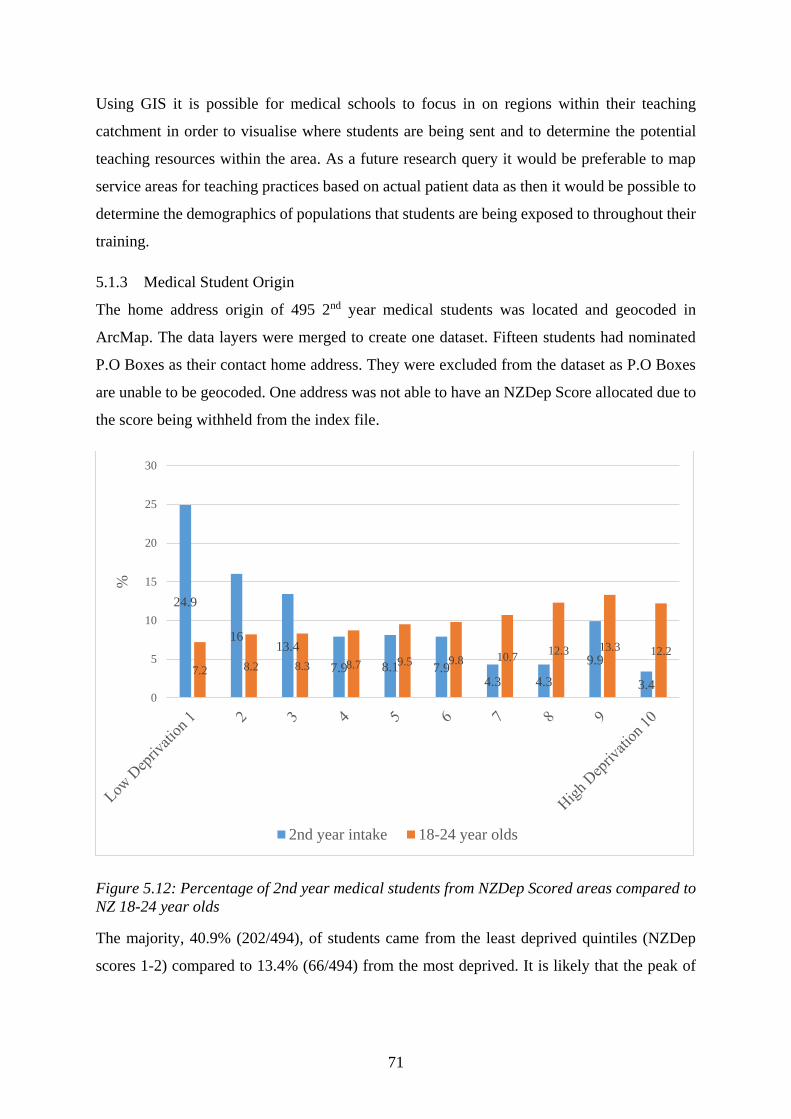
71
Using GIS it is possible for medical schools to focus in on regions within their teaching
catchment in order to visualise where students are being sent and to determine the potential
teaching resources within the area. As a future research query it would be preferable to map
service areas for teaching practices based on actual patient data as then it would be possible to
determine the demographics of populations that students are being exposed to throughout their
training.
5.1.3 Medical Student Origin
The home address origin of 495 2nd year medical students was located and geocoded in
ArcMap. The data layers were merged to create one dataset. Fifteen students had nominated
P.O Boxes as their contact home address. They were excluded from the dataset as P.O Boxes
are unable to be geocoded. One address was not able to have an NZDep Score allocated due to
the score being withheld from the index file.
Figure 5.12: Percentage of 2nd year medical students from NZDep Scored areas compared to
NZ 18-24 year olds
The majority, 40.9% (202/494), of students came from the least deprived quintiles (NZDep
scores 1-2) compared to 13.4% (66/494) from the most deprived. It is likely that the peak of
24.9
1613.4
7.9 8.1 7.94.3 4.3
9.9
3.47.2 8.2 8.3 8.7 9.5 9.8 10.7
12.3 13.3 12.2
0
5
10
15
20
25
30
%
2nd year intake 18-24 year olds

72
students in scores 9 and 10 is largely due to the North Dunedin student quarter being listed as
a high deprivation area.
5.1.3.1 Ethnicity
The medical student ethnic groups were analysed using ‘total response’ records (325) as both
the University of Otago and the University of Auckland allow students to self-select up to three
ethnic groups that they self-identify with. The total response method allows for all these
responses to be recorded so that the total number of results exceeds the total number of students.
Only the ethnicity of domestic students was included in the analysis as international student
data was not received by the researcher. There were a total of 646 responses for ethnicity from
495 students. These were grouped into four categories: Māori, Pacific, MELAA (Middle
East/Latin America/Africa) and European/Other. Students of Māori ethnicity comprised 12.2%
(79/646); Pacific peoples 6.7% (43/646); Asian 25.9% (167/646); MELAA 2.5% (16/646); and
European/Other 52.8% (341/646).
Figure 5.13: Ethnic Origin of 2nd Year Medical Students
12.26.7
25.9
2.5
52.8
16.68.9
15.8
1.5
63.1
0
10
20
30
40
50
60
70
Maori Pacific Asian MELAA European/Other
%
2nd year intake NZ 20-24 year olds

73
Figure 5.14: Ratio of Medical Students Admitted compared to the 18-24 year old population
resident within the DHB boundary with the DHB FTE GP ratio
74
Figure 5.14 aggregates the student data to present it as a ratio of students admitted compared
to the DHB age-matched population. This can be used to display regions of lower student
recruitment such as the Waikato, Lakes, Wairarapa and Taranaki, and compare them to areas
with the highest intake (Auckland, Tairawhiti and Whanganui DHBs). It would be valuable to
map data from successive intakes to determine whether regions were chronically under-
represented. This map has the FTE GP per 100,000 ratio as the background to show which
DHBs have particularly severe GP shortages and where it may be particularly important to
focus secondary school student recruitment efforts such as Taranaki, West Coast and Counties
Manukau.
5.2 Qualitative results
Three main themes emerged from the research journal as they were repeated throughout the
data collection and input phases of the study. These themes were: the difficulties of adapting
American software, tutorials and online forum advice to the NZ context; the challenges of
formatting and inputting data into the GIS database; and concerns from data providers over
issues of anonymity and privacy of data. Because the first two themes are related I will address
these together before considering the final theme of anonymity and data privacy. These
difficulties and challenges led to changes in my research processes following the principles of
Action Research where challenges lead to reflection before action.
5.2.1 Difficulties with context, language and inputting data
ARCGIS software originates from Redlands, California in the USA, therefore its software
support, online tutorials and the data used for them are based on American examples. This often
made it difficult to transfer the information into the New Zealand context. Quite a considerable
amount of time was spent trying to apply examples of recommended practices from the tutorials
to the NZ data files downloaded to be used in the database. In addition, the software support
relied upon the user having a strong background in computer programming terminology.
Wang has stated (326) that these complex “human-defined formal languages” have strict
grammar rules which are difficult for non-technical GIS end-users to understand, learn and use.
This reduces the ease of accessibility of GIS to those without the necessary training background
or without the work infrastructure to support the learning process. Wang believes that the range
of fields that GIS have been applied to, indicate that users are either prepared to persevere
through this phase to reach a level of competence or have an expert in the GIS software to assist
them.

75
Traynor stated (269) that software applications such as ARCGIS are developed with certain
assumptions. These assumptions are that the end-user has prior knowledge of the technical field
and “software architecture”. Because end-users often do not fulfil these assumptions but still
require the software capability to answer research questions this frequently leads to end-users
becoming dependent upon experts acting as “intermediaries between them and the software”.
Traynor believes that GIS software are particularly prone to non-technical end-user difficulty
as they combine geography, cartography and database management: all requiring computer-
literacy and the time to learn the software architecture.
Fortunately, as I discovered, once competence in a specific task such as geocoding has been
reached it is typically straightforward to repeat. However, sometimes tasks that should be
straightforward become riddled with error messages that do not indicate the true reason behind
the error. Sometimes in such situations, online forums were useful to explain what the error
was, but it was not always possible to overcome the problem. This could have been due to
limitations of the computer to process the datasets as they became larger. For example, the
2013 census meshblock dataset had 46,637 entries which were unioned with the 1064 GP
service area polygons in order to extract information on supply of GPs in high versus low need
areas as defined by the census variables. The personal computer I had for the project was unable
to cope with this process and regularly ‘crashed’ in just the preliminary steps. I was fortunate
enough to have the support of the GIS specialist, Dr Tony Moore in the Surveying Department
who offered to complete this union procedure on his office computer. Unfortunately the
ARCGIS method of carrying out this procedure would not work either so other web-based
techniques were used instead.
This emphasised to me the importance of having specialist support with this software as it was
particularly invaluable in the analysis phases of the datasets. Technical support in the analysis
phase is important because specialists are able to understand how to extract the necessary
information out from the data in a time-efficient manner. Without this specialist input I am
unsure whether I would have known best how to visualise the solutions to the research
questions. The analytical phase is in contrast to the data input phase which was relatively
straightforward and was characterised more by repetition of key tasks until the data was
successfully housed in the database. But the data analysis was where a specialist understanding
of what the data could be used to show was crucial.
76
5.2.2 Concerns over anonymity and information privacy in geotechnologies
This study faced some reluctance to provide data due to concerns about whether it was
appropriate to do so. Interestingly this concern was not from the ethical committee who gave
approval for data gathering but from departments requested to provide data. Unfortunately the
missing data reduced the strength of the research outcome for one of the study questions.
International studies have also found that concerns over spatial data confidentiality and privacy
of individual information have been found to limit the use of GIS (271).
Most legal issues related to applications of GIS are concerned with the collection, ownership,
access, retention, use and distribution of geographic data at either the individual or collective
levels (267). This is primarily due to concern around individual privacy and data accessibility
issues. Westin’s (327) 1967 definition of privacy states that “privacy is the claim of individuals,
groups, or institutions to determine for themselves when, how, and to what extent information
about them is communicated to others”.
A key concept in new American legislation is that of locational privacy. This entails an
individuals’ right to decide how much locational information about them should be conveyed
to others (328). According to Sui (267) location is an integral part of somebody’s identity “as
where we are often reflects and defines who we are”. Maintaining locational privacy and the
spatial confidentiality of individuals is increasingly under threat from geographic mapping
technologies. But as Boulos et al., (329) assert, there will always be some level of trade-off
between maintaining data privacy and getting the most accurate geographical analyses of a
particular dataset. Techniques like spatial generalisation through aggregating and anonymising
individual detail are important methods to protect an individuals’ location privacy with GIS
technologies (267, 330).
Information privacy in NZ is regulated through the Privacy Act 1993 and the Privacy
Commissioner whereas patient privacy is dealt with through the Health and Disability
Commissioner Act 1994. The Health and Disability Commissioner has argued that complaints
over breaches in patient information privacy should be dealt with by both commissioners
through a Memorandum of Understanding (331).
The NZ Privacy Act resulted from the increased use of technology changing how privacy
operates and how access to personal information could occur (332). This Act embraces Moor’s
theory of “control restricted access” (333), meaning that access to personal information should
be restricted once it has been collected by an external agency. This recognises that current

77
technologies make it virtually impossible for an individual to maintain complete control over
their personal information but that agencies should act in the individuals’ best interests by
protecting and managing their data (334).
Boulos et al., (329) argue that “self-policing” of maps for publication is still the most important
issue for researchers to be aware of. In particular, they believe that researchers should question
whether it is necessary for a map to display individuals at a ‘point-level’, from which a person’s
identity could be traced back. This study had individual address data for medical students that
could potentially have been displayed at the point-level, however the final results produced
aggregated these students into the NZDep Score and DHB levels in order to preserve their
locational privacy. To further preserve their privacy, access to the database was restricted to
the researcher and two supervisors for the duration of the project.
78
6 Discussion
In this section I discuss the results, describe the limitations and the implications of the research
The emphasis of this project was upon the demonstration of feasibility of using GIS as a
research and planning tool rather than on the interpretation of the results that the tool produces.
The accessibility of general practice services, the location of teaching practices and the origin
of medical students in New Zealand may be useful for planning and policy purposes at some
point but all would need greater expansion and more in-depth research to produce conclusive,
generalisable results.
6.1 General Practices
The network analysis has produced the most current and up-to-date picture of general practice
accessibility in New Zealand. The data resulting from these analysis comprises of 1064 general
practices or ‘points of supply’, linked to service area polygons containing 2013 census
demographic information including the NZDep Score. This method has shown that physical
accessibility to general practices varies considerably throughout New Zealand but that the
presence of clinics in rural areas is reducing the shortage of medical services and increasing
the access of these populations to health professionals such as Rural Nurse Specialists and
Nurse Practitioners.
The maps of NZ with the density of GPs overlaid made it possible to visualise the effects of
urbanisation upon services such as health care. While regional and rural areas had low to
moderate levels of GPs due to the low population density in these regions, main urban areas
such as Auckland had a high density of GPs. NZ Statistics predicts that main urban centres,
satellite urban and rural areas with high and moderate urban influence will experience the
greatest increase in population over the years 2001-2021 (335). The better availability of
services and amenities in urban and peri-urban areas drives greater urbanisation of the
population as cities then become more attractive to young professionals, the growing middle
class and immigrants (324). Services such as GPs, pharmacies (102) and hospitals (305, 336)
then follow the urbanisation of the population and become concentrated in urban areas. This
then affects regional and rural areas as it becomes uneconomic to effectively provide health
care services to small, dispersed populations (337).
This is reflected in the results for the average number of General Practices per NZDep Score
over the South Island. There was a low number of practices in the middle deprivation scores

79
(NZDep4-7). These scores covered many of the regional and rural towns such as Lawrence,
Rakaia, Geraldine, Golden Bay and the West Coast that would have been negatively affected
by the consolidation of population and health care services into urban areas. Their access to
both GPs and hospital care is likely to be reliant on travel times greater than thirty minutes
duration.
It would have been of interest to expand this dataset linking the general practice service areas
with the NZDep score to the North Island to see if a similar picture was apparent there.
Unfortunately this analysis was hindered by the capacity of the computer to handle the large
dataset from the North Island. Interestingly, in the South Island the average GP service
provision covered by the thirty minute service area boundary was equal in the areas with the
least deprived and the most deprived NZDep Scores. This suggests that at least in the South
Island, communities in low and high deprivation areas have good service supply, perhaps
because they are located in urban regions and that poor service supply is more related to rurality
than socio-economic deprivation.
6.1.1 Limitations
Because the service area catchments in this study are not based upon actual patient utilisation
data but upon where the practice is located geographically, the catchment is unlikely to
accurately reflect the true practice catchment. This is particularly important in the main urban
areas such as Auckland where a patient’s daily activity space may be more centred on their
place of employment than their home so an individual’s access to a GP is not necessarily
constrained by their place of residence. This service area model assumes that patients would
travel to their closest GP when this has been proven through research to not be the case. Ideally
the service area catchment model would utilise actual data on patient choice, access and
utilisation of GP services as this would be a more realistic representation of the geographical
extent of health services and patients’ ‘realised access’. But this data was not sought by the
researcher as it was beyond the scope of the study and would potentially be difficult to access
(277). In spite of this, the service area method was selected through consultation with a GIS
specialist because the technical process would be within the skill level of the researcher as a
novice GIS user. In addition it was thought that the results could be used to provide evidence
of the potential feasibility of using GIS software in NZ primary care research.
The service area boundaries also carry the risk of the “tyranny of zonation”. This is where
artificially fixed boundaries create a false binary relationship between access and non-

80
accessibility (338). A further problem then arises because this study related the catchment of
the practice to area deprivation and need measures. The problem then becomes that health care
or practitioner catchments do not follow census area boundaries as the practice draws patients
from many small areas. The risk then is that the census based data assigned to the practice is
not accurate so few, if any, generalisations can be made about the catchment characteristics
(339). The remedy for this would be a survey of the actual patients utilising the practice so that
the demographic data is accurate and the catchments can be re-drawn based upon this.
Research based on this method may help to explain the ongoing high level of reported unmet
need for primary care in NZ. Because it could suggest that the availability and potential
accessibility to services does not guarantee their utilisation (68). This is because measures of
potential accessibility may neglect to include individual preference so it is important to include
actual utilisation as an indicator of accessibility. This highlights the need to include qualitative
aspects to studies to determine why patients choose a particular clinic over another and their
reasons for not using the closest facility. The problem of accessibility is not just the location or
number of clinics but also other factors.
Additionally, because census units of measurement such as area units or meshblocks
unnaturally aggregate individuals in geographic space to enable individual data confidentiality
this can lead to an overestimation of the strength of the relationship between the individual and
the area. This is called the ‘modifiable areal units problem’ (322). In particular, the accuracy
of NZ census data is affected by the withholding of data in spatial units with very small
populations. In this project, the suppression of data led to some general practices and medical
students missing data on NZDep Scores and other measures of need.
Accuracy is also affected by the five-yearly interval between censuses in NZ. Fortunately this
project had access to the most recent census data available and the analysis is focused on the
period around the date of the census. But the database will become less accurate with time until
the next census is collected and the database is updated with this. Additionally, the
Christchurch earthquake delayed the latest census by two years affecting some comparisons
between this census and those previous. This region has undergone considerable migration and
urban redevelopment since the earthquakes which could affect the accuracy of research linking
geography with population health and its needs (340).
The dataset upon which the 30 minute service areas was calculated has some limitations around
the speed attribute allocated to roads. The speed limit attribute is not the legal speed limits but
81
the actual speed a car may travel at on a particular road e.g., most residential streets are
specified as 40km/h as they allow for this speed more than 50km/h. The validity of the data
also depends upon the file having been very recently updated, especially for Christchurch
whose travel times may have increased considerably after the 2010-2011 earthquakes affecting
roads. The file does not go into the high level of detail for particular regions so the service areas
in Christchurch may be smaller than depicted due to longer travel times to a GP.
6.1.2 Research Implications
To expand the dataset on general practices, it would be valuable to include the numbers of FTE
GPs per practice and what level of nursing services are available e.g. whether there are nurse
practitioners who are able to dispense medications as these factors could increase or decrease
the service provision to these communities. In addition, with the advent of e-health or
telemedicine services for GP consultations in rural areas such as the West Coast and the Eastern
Bay of Plenty, a future line of research would be to map the geographical areas using these
digital methods and to interview residents on their perspectives of these services as to whether
they are as accessible as face-to-face consultations. Qualitative perceptions of accessibility
could be explored from a number of perspectives and then compared with the physical
accessibility results derived from this study. E-health methods may lead to changes in peoples’
activity patterns so that inferences about individuals by combining areal units and
socioeconomic data in a GIS may become more problematic unless a qualitative perspective is
incorporated.
6.2 Teaching Practices
The teaching practice data showed an encouraging range of communities that practices were
located in and students were potentially exposed to with 72% of practices located in the middle
to highest deprivation areas (NZDep scores 5-10). The map of South Island practices shows
that there are a high number involved in teaching suggesting that some DHBs may be reaching
saturation point. This is especially evident in the high-scale map of Dunedin where most of the
inner-city practices are teaching practices. Data on whether the other practices were teaching
PGYs or GP registrars was not available, however this may explain why they do not participate
in teaching undergraduates. Also because this dataset is only from one year of practices used
by medical schools it may change yearly with some practices opting to teach or not to teach in
particular years for various reasons.

82
6.2.1 Limitations
The teaching practice data is not a complete census of practices as only the University of
Otago’s data was accessible due to concerns about privacy of data. The data spread of practices
for the Otago schools reached as far north as Taranaki and the East Cape of the North Island
so there is a considerable part of the national picture missing. It would be incredibly useful for
future planning to have the complete dataset to map a nationwide census of teaching practices.
This complete dataset could include data related to whether a practice teaches other years
including PGYs and GP registrars as this may explain why some general practices do not
participate in teaching undergraduates. This could then be related to their capacity for students
as it would be very important to know which practices have the ability to host more students
due to the increasing student numbers.
Unfortunately this study was not able to extract the service area and NZDep score data related
to the teaching practices as was done for the South Island general practices. This would have
been a more valid method of describing the demographics of the communities surrounding a
teaching practice than using the individual meshblock score for the practice as this score only
applies to the area containing the 100-200 individuals resident there. Therefore it is especially
important than the interpretation of the NZDep Score as applied to the teaching practice is done
with caution.
6.2.2 Research Implications
Because of the pressure upon teaching resources it may be necessary to form a nationwide body
that coordinates general practice placements for undergraduate and postgraduate students. This
could increase the pool of available practices to each school and make sure that potential
teaching resources are not wasted as there may be practices willing to train students but that
are not used by the school within whose boundary they fall. It could also benefit students as
they may be exposed to different regions and styles of practice in the different PHO and DHB
boundaries. This could increase the potential for positive learning experiences and provide
further opportunities to persuade students to specialise in general practice. This nationwide
body could maintain a regularly updated dataset of available practices to which students were
allocated to. This would ensure that each school had a sufficient diversity of practices to send
their students to.
83
6.3 Medical Student Origin
6.3.1 Ethnicity
Encouragingly, it appears that across the Auckland and Otago medical school intakes the ethnic
background of students is approaching the NZ picture. Students of Māori ethnicity comprised
12.2% (79/646); Pacific peoples 6.7% (43/646); Asian 25.9% (167/646); MELAA 2.5%
(16/646); and European/Other 52.8% (341/646). This compared to NZ Statistics 2013 census
total group response results for 20-24 year olds where: 16.6% identified as Māori; 8.9% Pacific
peoples; 15.8% Asian; 1.5% MELAA; and 63.1% European/Other (341). So while the Asian
intake is significantly higher than the NZ population, the Māori and Pacific intakes are almost
equivalent to their proportion in the population. This may reflect the increasing impact of
multiple programmes at both the secondary and tertiary levels and through health workforce
development initiatives.
The University of Otago now has four main programme areas working to increase Māori
representation in the health workforce. These programmes start at secondary school level,
follow students through both the Foundation year and Health Sciences First Year (HSFY) and
then act to support those students who are in the health professional programmes. As a result
of this, in 2014 there was a 40% increase in the number of Māori students studying in the
Health Sciences First Year programme (342). Research on Auckland medical students showed
that Māori students were more likely to intend working in regional and rural settings and have
a strong interest in general practice as a speciality while Asian students were the most likely to
opt for urban-based careers (248). Therefore the increase in Māori students could have positive
repercussions for the GP shortages in regional and rural areas in the future.
6.3.2 NZDep Scores
However it is somewhat discouraging to note that as has been reported in previous studies on
medical students this study showed that the vast majority originate from the less deprived
regions of NZ. This is in marked contrast to the distribution of NZDep Scores that NZ 18-24
year olds reside in, with a higher percentage being resident in high deprivation areas than in
the low deprivation areas. Medical school cohorts for some time now have been reported as
being relatively more affluent (104, 157) than the general age-matched population. Because
the demographic characteristics of medical students are correlated with their future area of
practice, for example students with a rural origin are more likely to return to practice in rural
areas (171, 343), it is crucially important that medical schools ensure they train doctors who

84
are willing and able to practice in high need areas. This could be achieved by an increased
demographic range in the student intake, specifically including students from underserved
backgrounds.
6.3.3 Research Implications
This raises the question of why the programmes and affirmative action policies that seem to
have been effective at increasing Māori and Pacific representation are not enabling students of
low socio-economic background to gain entry to medical school. If it is a matter of social justice
and in the public good for a diverse intake then it is crucial that these students, regardless of
their ethnicity, are targeted for similar programmes and policies. UK research has shown that
low socio-economic students tend to underestimate their chances of entering medical school
even if they are academically able. They can feel alienated from it due to cultural, academic
and financial differences and inequalities (259). These factors could be apparent within the
intensely competitive and expensive tertiary first year for the health professional programmes
and act to filter out students who have succeeded thus far.
In the UK some medical schools have introduced an alternative entry test, the UK clinical
aptitude test (UKCAT), aimed to increase the intake of low socio-economic students. This test
bypasses the student’s performance at secondary school as an entry criterion because previous
academic achievement can be affected by the type of school the student attends and is not then
the most perfect predictor of success at medical school (344). In 2001 (157) there was the
suggestion that affirmative action policies targeting low socio-economic students may be
needed in NZ medical schools but little has been done to advance this idea.
Possibly it would be too challenging to implement, as in the NZ context it could be difficult to
accurately define the requirements a student would have to fulfil to gain entry under such a
pathway. Similarly to the rural entry pathway, it may require a certain amount of time
experience living within a high deprivation area or attending a low decile secondary school. Or
it could allow for students from low decile schools having their academic score from their
tertiary first year programme being weighed higher than students who have attended high decile
schools. Kings College in London has developed an extended medical degree programme that
admits students from a list of approximately 100 state schools or colleges that are located in
“educationally deprived” areas of inner London. Their admissions process also includes a
cognitive assessment, an interview and the requirement that the student achieves a requisite
grade in their final school examinations (345).

85
Because medical school entry is a high-stakes endeavour, if the requirements were not
adequately defined the entry pathway could be open to manipulation and not act to increase
representation from these low socio-economic populations. In addition, there is the financial
costs to the educational institution as UK research into ‘widening participation students’ show
that they require considerable extra academic and pastoral support to succeed in graduating
from medical school. These students also have a higher rate of attrition (345). Interestingly, the
retention rate of disadvantaged students is higher when they are financially better supported.
Since the mid-2000s most Australian universities have implemented ‘equity scholarships’
targeted to students from low socio-economic backgrounds in recognition of the drop in
participation of students from these backgrounds in any form of higher education (346). Since
retention of medical students is important due to the large financial investment made by the
tertiary institution and government into their education, targeted scholarships could be a
valuable supplement to an affirmative action policy.
6.3.4 Limitations
However there are limitations in the interpretation of this data. Students may nominate their
study address as their home address, particularly if they are graduate or mature medical school
entrants as they have spent longer away from their parent’s home and may have been exposed
to more formative environments since leaving secondary school. International research
suggests that graduate entrants can act to widen academic and socio-demographic diversity in
medical school intakes (347). This study did not receive data to identify the graduate entrants
so it could not stratify the results to determine whether this finding applied to the cohort.
Because of this, this could skew the results and interpretation of place of origin as, for example,
the North Dunedin student quarter is biased toward the NZDep scores of high deprivation (9-
10) so a higher prevalence of these scores may be due to this.
Inaccuracies with the address file for both students and general practices can also cause errors
in the geocoding process leading to spatial mismatches and the prevention of matching
addresses to their correct location. This can occur from the use of post office box addresses and
the address file having missing fields or misspellings. Various studies have evaluated the extent
of geocoding error and positional accuracy with health address data. Cayo and Talbot found
that positional error was more of an issue in rural than urban areas (348). Concerningly, this
type of error can lead to the misallocation of census demographic variables to the address, and
so by association, to the individual. This study had 15 students who specified post office box
addresses and it could be that some of these were located in rural regions. Because these cannot

86
be geocoded there is the risk that the true geographic and demographic origin of these students
is missing which could lead to bias in the results.
The medical student sample was limited to one nationwide 2nd year cohort which although it
has the benefit of including data from both the Otago and Auckland schools of medicine, it is
difficult to draw strong conclusions from, and provides limited generalizability. However as a
demonstration of the utility of GIS to enable the ongoing monitoring of the impact of
affirmative action policies and educational initiatives upon medical class diversity, the sample
sizes could be argued to have been sufficient.
This is demonstrated in the map showing 2nd year medical student origin compared to their age-
matched population in NZ DHBs. A map such as this, could be used over successive cohorts
to determine whether some DHB regions are particularly poorly represented in medical school
intakes and could potentially benefit from targeted recruitment and secondary school pipeline
programmes. This data could be linked to the FTE GP numbers per population for each DHB
as was demonstrated in the results, as some DHBs suffer from especially low GP service supply
and may wish to initiate ‘grow our own workforce’ programmes similar to Counties Manukau.
6.4 Feasibility of GIS in Primary Care Research
This overriding aim of this project has been to discover whether utilising GIS technology in
primary care research is possible. As a non-specialist end-user there have been some difficulties
in developing the database, from learning the software architecture and how to use the
necessary tools, to learning the methods of data analysis from a GIS specialist, however none
of these have been unsurmountable. This project has shown that it is indeed possible to learn
and use the software to visualise, store and analyse data from mixed sources. Visualisation is
the real power of a GIS, as it enables patterns that may not be evident to be seen (271). But the
key remaining obstacle to an increased use of GIS is whether institutions are willing to invest
the time, finances and human capital into the technology.
An important note is the need to maintain the database that results from this study as without
maintenance and updating it will quickly lose track of the trends in general practice provision
over New Zealand as it is a “snapshot” of time. Maintenance would enable multiple uses to be
made of the data and would lead to improvement of the quality of the data contained within the
database. Multiple uses of the data would enable the real benefit of any investment made into
GIS technology to be realised (271). In addition, it would be valuable to use this database to

87
monitor the trends in teaching practices and student intakes over a number of years for any
patterns in both to become evident.
It has been argued that a national ‘spatial information’ database of geo-referenced health
service locations should be maintained to allow “informed debate on the accessibility of health
services in New Zealand” without researchers having to re-collect the necessary data (349).
Recently there have been calls for more regular and formalised methods of assessing the
performance of the NZ healthcare system and to objectively measure the level of unmet need,
including the accessibility, timeliness and quality of care received by patients (350). Having an
up-to-date geocoded dataset of general practice and hospital locations would be crucial for this
to be a possibility.
Research using an interdisciplinary team and cooperative data sharing would be essential in
order to further advance the use of GIS in primary health care research. The biggest obstacles
to this goal are the lack of awareness of the potential of GIS within primary care planning for
population analysis and modelling at both the medical educational and DHB levels. This lack
of awareness may need to be addressed so that subsequent research outcomes and conclusions
are seriously considered.

88
Bibliography
1. Baker MG, Barnard LT, Kvalsvig A, Verrall A, Zhang J, Keall M, et al. Increasing
incidence of serious infectious diseases and inequalities in New Zealand: a national
epidemiological study. The Lancet. 2012;379(9821):1112-9.
2. Ellison-Loschmann L, Pearce N. Improving access to health care among New Zealand's
Maori population. American Journal of Public Health. 2006;96(4):612-7.
3. Tobias M, Blakely T, Matheson D, Rasanathan K, Atkinson J. Changing trends in
indigenous inequalities in mortality: lessons from New Zealand. International Journal of
Epidemiology. 2009;38(6):1711-22.
4. The Health of New Zealand Adults 2011/12: Key findings of the New Zealand Health
Survey. Wellington: Ministry of Health 2012.
5. Davidson E, Sheikh A. Tackling ethnic variations in asthma outcomes in New
Zealand’s Mãori and Pacific children will need a long-term strategy. Primary Care Respiratory
Journal. 2013;22(3):269-70.
6. Gillies TD, Tomlin AM, Dovey SM, Tilyard MW. Ethnic disparities in asthma
treatment and outcomes in children aged under 15 years in New Zealand: analysis of national
databases. Primary Care Respiratory Journal. 2013;22(3):312-8.
7. Jansen P, Bacal K, Buetow S. A comparison of Māori and non-Māori experiences of
general practice. NZ Med J. 2011;124(1330):24-30.
8. Ministry of Health. New Zealand Health Survey: Annual update of key findings
2012/13. Wellington: Ministry of Health; 2013.
9. Urban-Rural Health Comparisons: Key results of the 2002/03 New Zealand Health
Survey Wellington: Ministry of Health; 2007.
10. Barnett R. Coping with the costs of primary care? Household and locational variations
in the survival strategies of the urban poor. Health & Place. 2001;7(2):141-57.
11. Brabyn L, Barnett JR. Population need and geographical access to general practitioners
in rural New Zealand. NZ Med J. 2004;117(1199).
12. Barnett JR. Where have all the doctors gone? Changes in the geographic distribution of
general practitioners in New Zealand since 1975. 1: Regional and urban-rural differences. NZ
Med J. 1991;104(916):314-6.
13. Garces-Ozanne A, Yow A, Audas R. Rural practice and retention in New Zealand: an
examination of New Zealand-trained and foreign-trained doctors. NZ Med J.
2011;124(1330):14-22.
14. Goodyear-Smith F, Janes R. New Zealand rural primary health care workforce in 2005:
More than just a doctor shortage. Australian Journal of Rural Health. 2008;16(1):40-6.
15. Medical Training Board. The future of the medical workforce: first annual report Nov
2007- Dec 2008. Wellington: Ministry of Health; 2009.
16. van Oostrom SH, Picavet HS, de Bruin SR, Stirbu I, Korevaar JC, Schellevis FG, et al.
Multimorbidity of chronic diseases and health care utilization in general practice. BMC Family
Practice. 2014;15(1):61.
17. Prince MJ, Wu F, Guo Y, Gutierrez Robledo LM, O'Donnell M, Sullivan R, et al. The
burden of disease in older people and implications for health policy and practice. The Lancet
[Internet]. 2014. Available from: doi:10.1016/S0140-6736(14)61347-7.
18. Jatrana S, Crampton P. Primary health care in New Zealand: Who has access? Health
policy (Amsterdam, Netherlands). 2009;93(1):1-10.
19. Popplewell NTA, Rechel BPD, Abel GA. How do adults with physical disability
experience primary care? A nationwide cross-sectional survey of access among patients in
England. BMJ open. 2014;4(8).

89
20. Cattell V. Counties Manukau District Health Board Workforce Development Plan
2007-2011 2007 [cited 2014 August 12]. Available from:
http://www.countiesmanukau.health.nz/about_cmdhb/planning/Workforce/workforce-
developmentplan-2007-11.pdf.
21. Wang F. Measurement, Optimization, and Impact of Health Care Accessibility: A
Methodological Review. Annals of the Association of American Geographers.
2012;102(5):1104-12.
22. Lovett A, Haynes R, Sünnenberg G, Gale S. Car travel time and accessibility by bus to
general practitioner services: a study using patient registers and GIS. Social Science &
Medicine. 2002;55(1):97-111.
23. Pearce J, Witten K, Hiscock R, Blakely T. Regional and urban - rural variations in the
association of neighbourhood deprivation with community resource access: a national study.
Environment and Planning A. 2008;40(10):2469-89.
24. Higgs G, White SD. Changes in service provision in rural areas. Part 1: The Use of GIS
in Analysing Accessibility to Services in Rural Deprivation Research. Journal of Rural Studies.
1997; 13(4):441-50.
25. Director-General of Health's Annual Report on the State of Public Health. Section 3:
Health and Independence Report 2013 Wellington, New Zealand: Ministry of Health; 2013
[cited 2014 Oct 15].
26. An Analysis of the New Zealand General Practitioner Workforce- Update 2009. New
Zealand Medical Association, Wellington.
27. Devaux M, Looper Md. Income-Related Inequalities in Health Service Utilisation in 19
OECD Countries, 2008-2009: OECD Publishing.
28. College president calls for 1000 more GPs [updated 2014 May 19; cited 2014 August
3]. Available from: http://www.nzdoctor.co.nz/news/2014/may-2014/19/college-president-
calls-for-1000-more-gps.aspx.
29. The New Zealand Medical Workforce in 2012. Medical Council of New Zealand,
Wellington: 2012.
30. Cumming J, Stillman S, Liang Y, Poland M, Hannis G. The determinants of GP visits
in New Zealand. Australian & New Zealand Journal of Public Health. 2010;34(5):451-7.
31. Pande MM, Stenson A. GP workforce demographics in 2007: Gender, age, ethnicity,
and work arrangements. New Zealand Family Physician. 2008;35(3):191-6.
32. Birch S, Kephart G, Tomblin-Murphy G, O'Brien-Pallas L, Alder R, MacKenzie A.
Human resources planning and the production of health: a needs-based analytical framework.
Canadian Public Policy. 2007;33:S1-S16.
33. Pong R, Pitblado J. Geographic Distribution of Physicians in Canada: Beyond How
Many and Where. In: Information CIfH, editor. Ottawa, Canada: Canadian Institute for Health
Information; 2005.
34. Sheldon GF, Ricketts TC, Charles A, King J, Fraher EP, Meyer A. The global health
workforce shortage: role of surgeons and other providers. Advances in Surgery. 2008;42:63-
85.
35. World Health Organisation. World Health Report 2006: Workng Together for Health
Geneva: WHO [cited 2014 August 17]. Available from: http://www.who.int/whr/2006/en/.
36. The impending collapse of primary care medicine and its implications for the state of
the nation's health care. Philadelphia: American College of Physicians, 2006.
37. US Department of Health and Human Services - Human Resources and Services
Administration. Projecting the supply and demand of primary care practitioners through 2020
[updated November 2013; cited 2014 August 11]. Available from:
http://bhpr.hrsa.gov/healthworkforce/supplydemand/usworkforce/primarycare/.

90
38. Luo W, Wang F. Spatial accessibility to primary care and physician shortage area
designation: a case study in Illinois with GIS approaches. Geographic Information Systems and
Health Applications Idea Group Publishing, Hershey, PA. 2003:260-78.
39. Bodenheimer T, Pham HH. Primary Care: Current Problems And Proposed Solutions.
Health Affairs. 2010;29(5):799-805.
40. U.S Department of Health and Human Services: Health Resources and Services
Administration. Shortage Designation: Health Professional Shortage Areas & Medically
Underserved Areas/Populations 2014 [updated June 19, 2014; cited 2014 August 31].
Available from: http://www.hrsa.gov/shortage/.
41. Macinko J, Starfield B, Shi L. Quantifying the health benefits of primary care physician
supply in the United States. International Journal of Health Services. 2007;37(1):111-26.
42. Starfield B, Shi L, Macinko J. Contribution of Primary Care to Health Systems and
Health. Milbank Quarterly. 2005;83(3):457-502.
43. Rimmer A. Less than 70% of GP training places are filled in some areas: BMJ Careers;
2014 [updated 16 Jun 2014; cited 2014 Nov 2]. Available from:
http://careers.bmj.com/careers/advice/view-article.html?id=20018042.
44. Rimmer A. One in eight GP training posts vacant, despite unprecedented third round of
recruitment 2014 [updated 24 Oct 2014; cited 2014 Nov 2]. Available from:
http://careers.bmj.com/careers/advice/view-article.html?id=20019782.
45. Jones R. The future NHS: time for another change? British Journal of General Practice.
2014;64(628):550-1.
46. National Health Service (NHS) England. Transforming urgent and emergency care
services in England: urgent and emergency care review 2013 [cited 2014 August 11]. Available
from: http://www.nhs.uk/NHSEngland/keogh-review/Documents/UECR.Ph1Report.FV.pdf.
47. Barnett R, Lauer G. Urban deprivation and public hospital admissions in Christchurch,
New Zealand, 1990–1997. Health & social care in the community. 2003;11(4):299-313.
48. A high quality workforce: NHS Next Stage Review: Department of Health; 2008 [cited
2014 May 20].
49. '10,000 more GPs needed' for NHS to cope with increasing workload: The Telegraph
[updated 2013 Feb 16; cited 2014 August 3]. Available from:
http://www.telegraph.co.uk/health/healthnews/9873540/10000-more-GPs-needed-for-NHS-
to-cope-with-increasing-workload.html.
50. GP Taskforce. Securing the future GP workforce - delivering the mandate on GP
expansion: GP Taskforce final report [July 2014]. Available from: http://hee.nhs.uk/wp-
content/uploads/sites/321/2014/07/GP-Taskforce-report.pdf.
51. Gosden T, Bowler I, Sutton M. How do general practitioners choose their practice?
Preferences for practice and job characteristics. Journal of Health Services Research & Policy.
2000;5(4):208-13.
52. World Health Report 2000. Health Systems: Improving Performance Geneva: World
Health Organisation. Available from: http://www.who.int/whr/2000/en/.
53. Anand S, Bärnighausen T. Human resources and health outcomes: cross-country
econometric study. The Lancet.364(9445):1603-9.
54. Or Z, Joust F, Yilmaz E. Impact of health care system on socioeconomic inequalities in
doctor use. Paris: IRDES; 2008.
55. Wurm S, Wolff JK, Schuz B. Primary care supply moderates the impact of diseases on
self-perceptions of aging. Psychology and Aging. 2014;29(2):351-8.
56. Shi L, Starfield B. Primary care, income inequality, and self-rated health in the United
States: a mixed-level analysis. International Journal of Health Services. 2000;30(3):541-56.

91
57. Shi L, Starfield B, Politzer RM. Primary Care, Self-rated Health, and Reductions in
Social Disparities in Health. Health Services Research. 2002;37(3):529-50.
58. The Ljubljana Charter on reforming health care: World Health Organization; 1996.
59. Penchansky R, Thomas JW. The concept of access: definition and relationship to
consumer satisfaction. Medical Care. 1981;19(2):127-40.
60. The Right to Health Geneva, Switzerland: Office of the United Nations High
Commissioner for Human Rights. World Health Organisation; 2013 [cited 2014 Oct 4].
Available from: http://www.who.int/hhr/activities/Right_to_Health_factsheet31.pdf.
61. U.S. Department of Health and Human Services. Healthy People 2010: Understanding
and Improving Health. Washington, DC: U.S. Government Printing Office; 2000.
62. Joshi C, Jayasinghe UW, Parker S, Del Mar C, Russell G, Lloyd J, et al. Does health
literacy affect patients’ receipt of preventative primary care? A multilevel analysis. BMC
Family Practice. 2014;11:12.
63. Kaphingst KA, Weaver NL, Wray RJ, Brown ML, Buskirk T, Kreuter MW. Effects of
patient health literacy, patient engagement and a system-level health literacy attribute on
patient-reported outcomes: a representative statewide survey. BMC Health Services Research.
2014;14(1):475.
64. Rio Political Declaration on Social Determinants of Health Geneva, Switzerland:
World Health Organisation; 2011 [cited 2014 Oct 4]. Available from:
http://www.who.int/sdhconference/declaration/en/.
65. Goddard M, Smith P. Equity of access to health care services:: Theory and evidence
from the UK. Social Science & Medicine. 2001;53(9):1149-62.
66. Goddard M, Smith P. Equity of Access to Health Care. Centre for Health Economics,
University of York 1998.
67. Aday LA, Andersen R. A framework for the study of access to medical care. Health
Services Research. 1974;9(3):208.
68. Joseph AE, Phillips DR. Accessibility and Utilization- geographical perspectives on
health care delivery. New York: Harper and Row; 1984.
69. Meade SM, Earickson RJ. Medical Geography. 2nd ed. New York: The Guilford Press;
2000.
70. Miller R. Healthcare organisational change: implications for access to care and its
measurement. Health Services Research. 1998;33(3).
71. Shi L. The Impact of Primary Care: A Focused Review. Scientifica. 2012;2012:22.
72. Tudor Hart J. THE INVERSE CARE LAW. The Lancet. 1971;297(7696):405-12.
73. Blakely T, Tobias M, Atkinson J, Yeh LC, Huang K. Tracking disparity: Trends in
ethnic and socioeconomic inequalities in mortality, 1981-2004 Wellington: Ministry of Health;
2007.
74. Pearce J, Witten K, Hiscock R, Blakely T. Are socially disadvantaged neighbourhoods
deprived of health-related community resources? International Journal of Epidemiology.
2007;36(2):348-55.
75. Mortality and Demographic Data 2009 Wellington: Ministry of Health; 2012.
76. Tatau Kahukura: Maori Health Chart Book 2010, 2nd Edition Wellington, New
Zealand: Ministry of Health; 2010 [updated 3 Oct 2014; cited 2014 Oct 13].
77. Barwick H. Improving access to primary care for Maori and Pacific peoples. A
literature review commissioned by the Health Funding Authority: Health Funding Authority.
2000.
78. Mills C, Reid P, Vaithianathan R. The cost of child health inequalities in Aotearoa New
Zealand: a preliminary scoping study. BMC Public Health. 2012;12(1):384.
92
79. Crooks VA, Andrews GJ. Thinking Geographically about Primary Health Care. In:
Crooks VA, Andrews GJ, editors. Primary Health Care: People, Practice, Place. Geographies
of Health. Surrey, England: Ashgate Publishing Ltd; 2009. p. 1-20.
80. Primary Health Care: report of the International Conference on Primary Health Care,
Alma-Ata, USSR., 6-12 September 1978; Geneva: W.H.O.
81. Viner RM, Barker M. Young people's health: the need for action. BMJ.
2005;330(7496):901-3.
82. Rayner G, Crossen K. Can a paediatric department provide health care for vulnerable
adolescents? NZ Med J. 2014;127(1398).
83. Jacobson L, Richardson G, Parry-Langdon N, Donovan C. How do teenagers and
primary healthcare providers view each other? An overview of key themes. British Journal of
General Practice. 2001;51(471):811-6.
84. Milne RJ, Lennon D, Stewart JM, Vander Hoorn S, Scuffham PA. Mortality and
hospitalisation costs of rheumatic fever and rheumatic heart disease in New Zealand. Journal
of Paediatrics and Child Health. 2012;48(8):692-7.
85. Elley CR, Randall P-J, Bratt D, Freeman P. Can primary care patients be identified
within an emergency department workload? Journal of the New Zealand Medical Association.
2007;120(1256).
86. Thomas B. Health and Health Care Disparities: The Effect of Social and Environmental
Factors on Individual and Population Health. International Journal of Environmental Research
and Public Health. 2014;11(7):7492-507.
87. Jansen P, Bacal K, Crengle S. He Ritenga Whakaaro: Māori experiences of health
services. Auckland: Mauri Ora Associates; 2008.
88. Laveist TA, Nuru-Jeter A. Is doctor-patient race concordance associated with greater
satisfaction with care? Journal of Health and Social Behavior. 2002;43(3):296-306.
89. 2013 Census QuickStats about national highlights: Statistics New Zealand; 2013 [cited
2014 July 10]. Available from: www.stats.govt.nz.
90. Elers P. Māori Health: Issues relating to health care services. Te Kaharoa. 2014;7(1).
91. Cram F, Smith L, Johnstone W. Mapping the Themes of Maori Talk About Health. NZ
Med J. 2003;116(1170):357-63.
92. Ye H, Kim H. Measuring Spatial Health Disparity Using a Network-Based
Accessibility Index Method in a GIS Environment: A Case Study of Hillsborough County,
Florida. International Journal of Geospatial and Environmental Research. 2014;1(1):2.
93. McLaren ZM, Ardington C, Leibbrandt M. Distance decay and persistent health care
disparities in South Africa. BMC Health Services Research. 2014;14(1):541.
94. Neighbourhood deprivation (all ages): Maori Health Chart Book Wellington, NZ:
Ministry of Health; 2010 [updated 3 October 2014; cited 2014 Oct 4]. Available from:
http://www.health.govt.nz/nz-health-statistics/health-statistics-and-data-sets/maori-health-
data-and-stats/tatau-kahukura-maori-health-chart-book/nga-awe-o-te-hauora-socioeconomic-
determinants-health/neighbourhood-deprivation-all-ages.
95. Matatuhi Tuawhenua: Health of Rural Maori 2012 Wellington, New Zealand: Ministry
of Health; 2012.
96. Brabyn L, Gower P. Comparing Three GIS Techniques for Modelling Geographical
Access to General Practitioners. Cartographica: The International Journal for Geographic
Information and Geovisualization. 2004;39(2):41-9.
97. Bagheri N, Benwell GL, Holt A. Primary Health Care Accessibility for Rural Otago:
'A Spatial Analysis'. National Health Informatics Conference (2006 : Sydney, NSW); 2006;
Brunswick East, Vic. In: Westbrook, Johanna (Editor); Callen, Joanne (Editor); Margelis,
George (Editor); Warren, James (Editor). HIC 2006 and HINZ 2006: Proceedings. Brunswick
East, Vic.: Health Informatics Society of Australia, 2006: 365-376.
93
98. Blakely T, Hiscock R, Pearce J, Witten K. Is neighborhood access to health care
provision associated with individual-level utilization and satisfaction? Health Services
Research. 2008 2008/12//:2183+.
99. Brabyn L, Gower P. Mapping accessibility to general practitioners. Geographic
Information Systems and Health Applications. 2003:289-307.
100. Farry P, Williamson M. Aligning medical education with the healthcare needs of the
population. NZ Med J. 2004;117.
101. Kruger E, Whyman R, Tennant M. High-acuity GIS mapping of private practice dental
services in New Zealand: does service match need? International Dental Journal.
2012;62(2):95-9.
102. Norris P, Horsburgh S, Sides G, Ram S, Fraser J. Geographical access to community
pharmacies in New Zealand. Health & Place. 2014;29(0):140-5.
103. Shi L, Starfield B. The medical home, access to care, and insurance: a review of
evidence. Pediatrics. 2004;05.
104. Crampton P, Weaver N, Howard A. Holding a mirror to society? The sociodemographic
characteristics of the University of Otago's health professional students. NZ Med J.
2012;125(1361).
105. Borkan JM. Mixed Methods Studies: A Foundation for Primary Care Research. The
Annals of Family Medicine. 2004;2(1):4-6.
106. Pavlovskaya M. Theorizing with GIS: a tool for critical geographies? Environment and
Planning A. 2006;38(11).
107. Bazemore A, Phillips RL, Miyoshi T. Harnessing Geographic Information Systems
(GIS) to Enable Community-Oriented Primary Care. Journal of the American Board of Family
Medicine. 2010;23(1):22-31.
108. Hawthorne TL, Kwan M-P. Using GIS and perceived distance to understand the
unequal geographies of healthcare in lower-income urban neighbourhoods. The Geographical
Journal. 2012;178(1):18-30.
109. Kringos DS, Boerma WG, Hutchinson A, van der Zee J, Groenewegen PP. The breadth
of primary care: a systematic literature review of its core dimensions. BMC Health Services
Research. 2010;10(1):65.
110. Starfield B. Is primary care essential? The Lancet. 1994;344(8930):1129-33.
111. Macinko J, Starfield B, Shi L. The Contribution of Primary Care Systems to Health
Outcomes within Organization for Economic Cooperation and Development (OECD)
Countries, 1970–1998. Health Services Research. 2003;38(3):831-65.
112. Donaldson M, Yordy K, Vanselow N. Defining Primary Care: An Interim Report
Committee on the Future of Primary Care. Division of Health Care Services. Institute of
Medicine Washington D.C: National Academy Press; 1994 [cited 2014 Oct 3]. Available from:
http://www.nap.edu/openbook.php?record_id=9153&page=R1.
113. Starfield B. Basic concepts in population health and health care. Journal of
epidemiology and community health. 2001;55(7):452-4.
114. Safran DG, Wilson IB, Rogers WH, Montgomery JE, Chang H. Primary care quality in
the Medicare Program: comparing the performance of Medicare health maintenance
organizations and traditional fee-for-service medicare. Archives of Internal Medicine.
2002;162(7):757-65.
115. Agarwal G. Geographies of Family Medicine: Describing the Family Doctor's Practice-
Based Landscape of Care. In: Crooks VA, Andrews GJ, editors. Primary Health Care: People,
Practice, Place. Geographies of Health. Surrey, England: Ashgate Publishing Limited; 2009.
p. 116-29.
116. Primary Health Care on the West Coast: Kotahitanga (Working Together). Draft
Primary Health Plan 2006-2009: West Coast DHB; 2007 [cited 2014 Oct 10]. Available from:

94
http://www.westcoastdhb.org.nz/publications/about_us/projects/sustainability_project/Primar
y%20Health%20Care%20Plan.pdf.
117. Haggerty J, Burge F, Levesque J-F. Operational Definitions of Attributes of Primary
Health Care: Consensus Among Canadian Experts. Annals of family medicine. 2007;5:336-44.
118. Starfield B. Primary care: balancing health needs, services, and technology: Oxford
University Press; 1998.
119. Guagliardo MF. Spatial accessibility of primary care: concepts, methods and
challenges. Int J Health Geogr. 2004;3(1):3.
120. Cumming J. Integrated care in New Zealand. International Journal of Integrated Care.
2011;11(Special 10th Anniversary Edition).
121. Primary health care Wellington, New Zealand: Ministry of Health; [updated 9 July
2014; cited 2014 Oct 4]. Available from: http://www.health.govt.nz/our-work/primary-health-
care.
122. King A. The Primary Health Care Strategy. Wellington, New Zealand: Ministry of
Health; 2001.
123. Kearns R, Neuwelt P. Within and Beyond Clinics: Primary Health Care and
Community Participation. In: Crooks VA, Andrews GJ, editors. Primary Health Care: People,
Practice, Place. Surrey, England: Ashgate Publishing Limited; 2009. p. 203-20.
124. Barnett JR. Does the geographic distribution of physicians reflect market failure?: an
examination of the New Zealand experience, 1981-87. Environment and Planning A.
1993;25(6):827-46.
125. Rudoler D, Laporte A, Barnsley J, Glazier RH, Deber RB. Paying for primary care: A
cross-sectional analysis of cost and morbidity distributions across primary care payment
models in Ontario Canada. Social Science & Medicine. 2015 Jan;124:18-28.
126. Barnett JR, Barnett P. Reinventing Primary Care: The New Zealand Case Compared.
In: Crooks VA, Andrews GJ, editors. Primary Health Care: People, Practice, Place. Surrey,
England: Ashgate Publishing Limited; 2009. p. 149-65.
127. Wiles JL, Rosenberg MW. The Role of Scale in Conceptualizing Primary Health Care
Practice: Considering Social and Institutional Structures and Systems. In: Crooks VA,
Andrews GJ, editors. Primary Health Care: People, Practice, Place. Geographies of Health.
Surrey, England: Ashgate Publishing Limited; 2009. p. 75-92.
128. About primary health organisations Wellington: Ministry of Health; 2014 [updated 8
July 2014; cited 2014 July 21]. Available from: http://www.health.govt.nz/our-work/primary-
health-care/about-primary-health-organisations.
129. Hefford M, Crampton P, Foley J. Reducing health disparities through primary care
reform: the New Zealand experiment. Health policy (Amsterdam, Netherlands). 2005;72(1):9-
23.
130. Langton J, Crampton P. Capitation funding of primary health organisations in New
Zealand: are enrolled populations being funded according to need? NZ Med J. 2008;121(1272).
131. Crampton P, Davis P, Lay-Yee R, Raymont A, Forrest C, Starfield B. Comparison of
private for-profit with private community-governed not-for-profit primary care services in New
Zealand. Journal of Health Services & Research Policy. 2004;9 Suppl 2:17-22.
132. Crengle S. The development of Maori primary care services. Pacific Health Dialog.
2000;7(1):48-53.
133. Ape-Esera L, Nosa V, Goodyear-Smith F. The Pacific primary health care workforce
in New Zealand: what are the needs? Journal of Primary Health Care. 2009;1(2):126-33.
134. Health Utilisation Research Alliance. Ethnicity, socioeconomic deprivation and
consultation rates in New Zealand general practice. Journal of Health Services & Research
Policy. 2006;11(3):141-9.

95
135. Cumming J, Mays N, Gribben B. Reforming primary health care: is New Zealand's
primary health care strategy achieving its early goals? Australia and New Zealand Health
Policy. 2008;5:24.
136. Cumming J, Mays N. New Zealand’s Primary Health Care Strategy: early effects of the
new financing and payment system for general practice and future challenges. Health
Economics, Policy and Law. 2011;6(01):1-21.
137. Ryall HT. Free Doctors' Visits, Prescriptions for Under 13s Wellington: National Party;
2014 [updated 2014 May 15; cited 2014 August 4]. Available from:
https://www.national.org.nz/news/news/media-releases/detail/2014/05/15/free-doctors-visits-
prescriptions-for-under-13s.
138. Ryall HT. Better, sooner, more convenient: health discussion paper. Wellington:
National Party of New Zealand; 2007.
139. Ryall HT. Media release: Govt takes primary health care forward Wellington: Ministry
of Health; 2009. Available from: http://www.beehive.govt.nz/release/govt-takes-primary-
health-care-forward.
140. Ministerial Review Group. Meeting the challenge: enhancing the sustainability and the
patient and consumer experience within the current legislative framework of health and
disability services in New Zealand: report of the Ministerial Review Group Wellington 2009.
141. Stangroom R, Morriss M, Soosay I. Patient engagement with primary health care
following discharge from community mental health services. NZ Med J. 2014;127(1405).
142. Fretter JM, Pande MM. How many general practitioners are 'enough'? - Forecasting GP
workforce capacity in New Zealand. New Zealand Family Physician. 2008;35(4):232-44.
143. Fretter JM, Pande MM. Royal New Zealand College of General Practitioners.
Forecasting GP workforce capacity. Towards an understanding of GP workforce capacity,
long-term forecasting and benchmarking tools. Occasional Paper 8. RNZCGP, Wellington.
2005.
144. Implementing the Primary Health Care Strategy in Rural New Zealand: A report of the
Rural Expert Advisory Group to the Minister of Health. Wellington: Ministry of Health; 2002.
145. London M. New Zealand annual rural workforce survey 2002. Report to the Ministry
of Health Wellington: Ministry of Health. 2003.
146. Farry P, Thompson R, Robertson H, Benwell G, Williamson M. The role of GIS in
supporting evidence-based rural health service planning and evaluation: A New Zealand case
study. New Zealand Family Physician. 2008;35(6):373-9.
147. Yang D-H, Goerge R, Mullner R. Comparing GIS-Based Methods of Measuring Spatial
Accessibility to Health Services. J Med Syst. 2006;30(1):23-32.
148. Mazumdar S, Konings P, Butler D, McRae IS. General practitioner (family physician)
workforce in Australia: comparing geographic data from surveys, a mailing list and medicare.
BMC Health Services Research. 2013;13(1):343.
149. PHCRIS Fast Facts: FTE and FWE in the Australian medical workforce explained:
Primary Health Care Research & Information Service; [updated 20 Jan 2014; cited 2014 Oct
3]. Available from: http://www.phcris.org.au/fastfacts/fact.php?id=4833.
150. Zurn P, Dal Poz MR, Stilwell B, Adams O. Imbalance in the health workforce. Human
resources for health. 2004;2(1):13.
151. Engstrom S, Foldevi M, Borgquist L. Is general practice effective? A systematic
literature review. Scandinavian Journal of Primary Health Care. 2001;19(2):131-44.
152. Starfield B, Shi L. Policy relevant determinants of health: an international perspective.
Health Policy (Amsterdam, Netherlands). 2002;60(3):201-18.
153. Shi L, Starfield B, Kennedy B, Kawachi I. Income Inequality, Primary Care, and Health
Indicators. Journal of Family Practice. 1999;48(4):275-84.

96
154. Pande MM. General Practice in Urban and Rural New Zealand: Results of the Annual
RNZCGP Membership Survey. Journal of Primary Health Care. 2010;1(2):108-13.
155. Goodyear-Smith F, Janes R. The 2005 Rural Health Workforce Survey New Zealand
Institute of Rural Health. Wellington: Ministry of Health; 2006.
156. Gorman DF, Brooks PM. On solutions to the shortage of doctors in Australia and New
Zealand. Med Journal Australia. 2009;3:152-6.
157. Fitzjohn J, Wilkinson T, Gill D, Mulder R. The demographic characteristics of New
Zealand medical students: the New Zealand wellbeing, intentions, debt and experiences
(WIDE) survey of medical students 2001 study. Journal of the New Zealand Medical
Association. 2003;116(1183).
158. Heath C, Stoddart C, Green H. Parental backgrounds of Otago medical students. NZ
Med J. 2002;115(1165):U237.
159. Gąsiorowski J, Rudowicz E, Safranow K. Motivation towards medical career choice
and future career plans of Polish medical students. Advances in Health Sciences Education.
2014:1-17.
160. Gill H, McLeod S, Duerksen K, Szafran O. Factors influencing medical students’
choice of family medicine: Effects of rural versus urban background. Canadian Family
Physician. 2012;58(11):e649-e57.
161. Black C. Advancing 21st-century professionalism: a multistakeholder approach.
JAMA. 2009;301(20):2156-8.
162. Hedden L, Barer ML, Cardiff K, McGrail KM, Law MR, Bourgeault IL. The
implications of the feminization of the primary care physician workforce on service supply: a
systematic review. Human resources for health. 2014;12(1):32.
163. Boyle V, Shulruf B, Poole P. Influence of gender and other factors on medical student
specialty interest. NZ Med J. 2014;127(1402):78-87.
164. Shadbolt N, Bunker J. Choosing general practice: A review of career choice
determinants. Australian Family Physician. 2009;38(1/2):53.
165. Smith KB, Humphreys JS, Wilson MGA. Addressing the health disadvantage of rural
populations: How does epidemiological evidence inform rural health policies and research?
Australian Journal of Rural Health. 2008;16(2):56-66.
166. Pande MM. General practice in urban and rural New Zealand: Results of the 2007
RNZCGP membership survey. Journal of Primary Health Care. 2009:108.
167. Kearns R, Myers J, Adair V, Coster H, Coster G. What makes ‘place’ attractive to
overseas-trained doctors in rural New Zealand? Health & Social Care in the Community.
2006;14(6):532-40.
168. Janes R. Defining 'rural', who decides? New Zealand Doctor. 2006;12(6 September).
169. Brooks RG, Walsh M, Mardon RE, Lewis M, Clawson A. The roles of nature and
nurture in the recruitment and retention of primary care physicians in rural areas: a review of
the literature. Academic medicine : Journal of the Association of American Medical Colleges.
2002;77(8):790-8.
170. Dunbabin J, Levitt L. Rural origin and rural medical exposure: their impact on the rural
and remote medical workforce in Australia. Rural and Remote Health. 2003;3(1):212.
171. Feldman K, Woloschuk W, Gowans M, Delva D, Brenneis F, Wright B, et al. The
difference between medical students interested in rural family medicine versus urban family or
specialty medicine. Canadian Journal of Rural Medicine : the official Journal of the Society of
Rural Physicians of Canada. 2008;13(2):73-9.
172. Duffrin C, Diaz S, Cashion M, Watson R, Cummings D, Jackson N. Factors Associated
with Placement of Rural Primary Care Physicians in North Carolina. South Med J.
2014;107(11):728-33.

97
173. Report of the ministerial taskforce on nursing: Releasing the potential of nursing
Wellington, New Zealand: Ministry of Health; 1998.
174. Gardner G, Carryer J, Gardner A, Dunn S. Nurse Practitioner competency standards:
Findings from collaborative Australian and New Zealand research. International Journal of
Nursing Studies. 2006;43(5):601-10.
175. Consultation on two proposals for registered nurse prescribing: Community nurses
Specialist nurses Nursing Council of New Zealand2013 [cited 2014 Oct 13]. Available from:
http://www.nzdoctor.co.nz/media/2156154/nursing_council_of_nz.pdf.
176. Nurse practitioner: Nursing Council of New Zealand (NCNZ); 2013 [cited 2014 Oct
13]. Available from: http://nursingcouncil.org.nz/Nurses/Scopes-of-practice/Nurse-
practitioner.
177. Horrocks S, Anderson E, Salisbury C. Systematic review of whether nurse practitioners
working in primary care can provide equivalent care to doctors. BMJ. 2002;324(7341):819-23.
178. Oliver GM, Pennington L, Revelle S, Rantz M. Impact of Nurse Practitioners on Health
Outcomes of Medicare and Medicaid Patients. Nursing Outlook. 2014;62(6):440-7
179. Gagan MJ, Boyd M, Wysocki K, Williams DJ. The first decade of nurse practitioners
in New Zealand: A survey of an evolving practice. Journal of the American Association of
Nurse Practitioners. 2014;26(11):612-9
180. Brooten D, Youngblut JM. Nurse Dose as a Concept. Journal of Nursing Scholarship.
2006;38(1):94-9.
181. Bigbee J, Evans S, Lind B, Perez S, Jacobo L, Geraghty E. RN-to-Population Ratio and
Population Health: A Multifactorial Study. Journal of Nursing Regulation. 2014;5(1):11-7.
182. Banbury A, Roots A, Nancarrow S. Rapid review of applications of e-health and remote
monitoring for rural residents. Australian Journal of Rural Health. 2014;22(5):211-22.
183. "Advice to the Incoming Minister of Health: AIM 3 Rural Health". Ministry of Health;
2002.
184. Moffatt JJ, Eley DS. The reported benefits of telehealth for rural Australians. Australian
Health Review. 2010;34(3):276-81.
185. Han JH, Sunderland N, Kendall E, Gudes O, Henniker G. Professional practice and
innovation: Chronic disease, geographic location and socioeconomic disadvantage as obstacles
to equitable access to e-health. Health Inf Manag J. 2010;39(2):30-6.
186. Atkinson J, Salmond CE, Crampton P. NZDep2013 Index of Deprivation: Department
of Public Health, University of Otago Wellington; 2014.
187. Zurn P, Dumont J-C. Health workforce and international migration: can New Zealand
compete? Geneva: World Health Organisation. 2008.
188. Moore J, Gale J, Dew K, Simmers D. Student debt amongst junior doctors in New
Zealand; part 2: effects on intention and workforce “. Journal of the New Zealand Medical
Association. 2006;119(1129).
189. Report of the Health Workforce Advisory Committee on encouraging Maori to work in
the Health Professions Wellington [cited 2014 August 15]. Available from:
https://www.health.govt.nz/system/files/documents/publications/hwac-encouraging-maor-
work-health-professions.pdf.
190. Science Participation and Attainment in National Certificate of Educational
Achievement Wellington: Education Counts, Ministry of Education; 2009 [cited 2014 August
15]. Available from: http://www.educationcounts.govt.nz/statistics/schooling/ncea-
attainment/ncea-attainment/participation-and-attainment-in-the-national-certificate-of-
educational-achievement-in-science.
191. University Entrance Attainment Wellington: Education Counts, Ministry of Education;
2011 [cited 2014 August 15]. Available from:

98
https://www.educationcounts.govt.nz/statistics/schooling/senior-student-attainment/ncea-
attainment/university-entrance-attainment.
192. Poole P, Moriarty H, Wearn A, Wilkinson T, Weller J. Medical student selection in
New Zealand: looking to the future. Journal of the New Zealand Medical Association.
2009;122(1306).
193. University of Otago Foundation Year Dunedin: University of Otago; [cited 2014 Oct
3]. Available from: http://www.otago.ac.nz/uolcfy/fy/.
194. Tichbon C, Rewha D. Grow Our Own: Future Health Workforce: Presentation to
Welfare Working Group: Counties Manukau DHB; 2010 [cited 2014 August 17]. Available
from:
http://igps.victoria.ac.nz/WelfareWorkingGroup/Downloads/Working%20papers/Grow-Our-
Own-Workforce.pdf.
195. Soto-Greene M, Wright L, Gona OD, Feldman LA. Minority enrichment programs at
the New Jersey Medical School: 26 years in review. Academic Medicine. 1999;74(4):386-9.
196. James Cook High School Health Sciences Academy [cited 2014 August 17]. Available
from: http://www.jchs.school.nz/academies/health.
197. Bunker J, Shadbolt N. Choosing general practice as a career-the influences of education
and training. Australian Family Physician. 2009;38(5):341.
198. Calvert B, Williams H, Rosenthal J. GP careers: changing student perspectives. British
Journal of General Practice. 2014;64(621):201-2.
199. Meli DN, Ng A, Singer S, Frey P, Schaufelberger M. General practitioner teachers' job
satisfaction and their medical students' wish to join the field - a correlational study. BMC Fam
Pract. 2014;15:50.
200. Laurence CO, Black LE. Teaching capacity in general practice: results from a survey
of practices and supervisors in South Australia. Medical Journal of Australia. 2009;191(2):102-
4.
201. Laurence C, Black L. Sustainable Teaching in General Practice in WA. Western
Australian General Practice Education and Training Ltd, 2010.
202. PGY 2/3 into General Practice/Community: Discussion/Consultation paper. South
Island Regional Training Hub (SIRTH), 2013.
203. Larsen K, Perkins D. Training doctors in general practices: a review of the literature.
The Australian Journal of Rural Health. 2006;14(5):173-7.
204. Grant A, Robling M. Introducing undergraduate medical teaching into general practice:
an action research study. Med Teach. 2006;28(7):e192-7.
205. About Us: Health Workforce New Zealand Wellington [updated 2 April 2014; cited
2014 Oct 3]. Available from: http://healthworkforce.health.govt.nz/about-us.
206. Ryall HT. Health workforce gets budget boost Wellington: New Zealand Government;
2009 [cited 2014 Oct 3]. Available from: http://www.beehive.govt.nz/release/health-
workforce-gets-budget-boost.
207. Hughes LA. Qualitative evaluation of general practices developing training for a range
of health disciplines. Education for Primary Care : an official publication of the Association of
Course Organisers, National Association of GP Tutors, World Organisation of Family Doctors.
2014;25(1):43-51.
208. Pearce R, Laurence CO, Black LE, Stocks N. The challenges of teaching in a general
practice setting. Medical Journal of Australia. 2007;187(2):129.
209. Derbyshire H, Rees E, Gay SP, McKinley RK. Undergraduate teaching in UK general
practice: a geographical snapshot. British Journal of General Practice. 2014;64(623):e336-e45.
210. Mathers J, Parry J, Lewis S, Greenfield S. What impact will an increased number of
teaching general practices have on patients, doctors and medical students? Medical Education.
2004;38(12):1219-28.

99
211. Sturman N, Régo P, Dick ML. Rewards, costs and challenges: the general practitioner’s
experience of teaching medical students. Medical Education. 2011;45(7):722-30.
212. Thomson J, Allan B, Anderson K, Kljakovic M. GP interest in teaching junior doctors
- Does practice location, size and infrastructure matter? Aust Fam Physician.
2009;38(12):1000-2.
213. Sheehan D, Thwaites JH, Byrnes I. General practice rotations for post graduate year 1
and 2 house officers—how feasible? NZ Med J. 2007;26.
214. Laurence CO, Black LE, Karnon J, Briggs NE. To teach or not to teach? A cost-benefit
analysis of teaching in private general practice. The Medical Journal of Australia.
2010;193(10):608-13.
215. Holden J, Pullon S. Trainee interns in general practices. NZ Med J.
1997;110(1053):377-9.
216. Laurence CO, Coombs M, Bell J, Black L. Financial costs for teaching in rural and
urban Australian general practices: Is there a difference? Australian Journal of Rural Health.
2014;22(2):68-74.
217. Rowe CJ, Campbell IS, Hargrave LA. Rural experience for junior doctors: Is it time to
make it mandatory? Australian Journal of Rural Health. 2014;22(2):63-7.
218. Shelker W, Zaharic T, Sijnja B, Glue P. Influence of rural background and rural medical
training on postgraduate medical training and location in New Zealand. NZ Med J.
2014;127:1403.
219. Williamson M, Wilson R, Mckechnie R, Ross J. Does the positive influence of an
undergraduate rural placement persist into postgraduate years? Rural & Remote Health.
2012;12(2).
220. Myhre DL, Adamiak P, Turley N, Spice R, Woloschuk W. Beyond bricks and mortar:
a rural network approach to preclinical medical education. BMC Medical Education.
2014;14(1):166.
221. Poole P, Bagg W, O'Connor B, Dare A, McKimm J, Meredith K, et al. The Northland
Regional-Rural program (Pūkawakawa): broadening medical undergraduate learning in New
Zealand. Rural and Remote Health. 2010;10:1254.
222. Scott-Jones J, Lucas S. Rural general practice training: experience of a rural general
practice team and a postgraduate year two registrar. Journal of Primary Health Care. 2010:243.
223. Edwards J, Goulding S, Leach J. The general practice foundation placement:
innovations for added value. Education for Primary Care. 2007;18(4):443-9.
224. Irish B, Lake J. When and why do doctors decide to become general practitioners?
Implications for recruitment into UK general practice specialty training. Education for Primary
Care. 2011;22(1):20-4.
225. Tolhurst H, Stewart M. Becoming a GP: A qualitative study of the career interests of
medical students. Australian Family Physician. 2005;34(3).
226. Pawelczyk A, Pawelczyk T, Bielecki J. Determinants of primary care specialty choice.
Polski merkuriusz lekarski : organ Polskiego Towarzystwa Lekarskiego. 2007;22(129):233-8.
227. Gold JA, Barg FK, Margo K. Undergraduate Students’ Perspectives on Primary Care.
Journal of Primary Care & Community Health. 2014.
228. Cleland JA, Johnston PW, Anthony M, Khan N, Scott NW. A survey of factors
influencing career preference in new-entrant and exiting medical students from four UK
medical schools. BMC Medical Education. 2014;14(1):151.
229. Hecht BH. The image of general practice: the revolution begins. British Journal of
General Practice. 2014;64(621):190.
230. Lambert T, Goldacre R, Smith F, Goldacre MJ. Reasons why doctors choose or reject
careers in general practice: national surveys. British Journal of General Practice.
2012;62(605):e851-e8.

100
231. Minogue M, Goodyear-Smith F. The black hole of general practice manpower. NZ
Family Physician. 2005;32(5):317-22.
232. Hill E, Bowman K, Stalmeijer R, Hart J. You've got to know the rules to play the game:
how medical students negotiate the hidden curriculum of surgical careers. Medical Education.
2014;48(9):884-94.
233. Gill D, Palmer C, Mulder R, Wilkinson T. Medical student career intentions at the
Christchurch School of Medicine. The New Zealand Wellbeing, Intentions, Debt and
Experiences (WIDE) survey of medical students pilot study. Results part II. NZ Med J.
2001;114(1142):465-7.
234. Hauer KE, Durning SJ, Kernan WN, Fagan MJ, Mintz M, O’Sullivan PS, et al. Factors
associated with medical students' career choices regarding internal medicine. Jama.
2008;300(10):1154-64.
235. Svirko E, Goldacre MJ, Lambert T. Career choices of the United Kingdom medical
graduates of 2005, 2008 and 2009: questionnaire surveys. Medical Teacher. 2013;35(5):365-
75.
236. Medical workforce pipeline update: Health Workforce New Zealand; 2014 [cited 2014
July 3]. Available from: http://healthworkforce.health.govt.nz/medical-workforce-pipeline-
update.
237. Consultation document: Developing a career pathway for General Practice. Royal New
Zealand College of General Practitioners; 2012.
238. Pringle M. General practitioners with special interests. The Royal College of General
Practitioners and the Royal College of Physicians of London. 2001.
239. Woloschuk W, Tarrant M. Does a rural educational experience influence students'
likelihood of rural practice? Impact of student background and gender. Medical Education.
2002;36(3):241-7.
240. Stagg P, Greenhill J, Worley PS. A new model to understand the career choice and
practice location decisions of medical graduates. Rural and Remote Health. 2009;9(4):1245.
241. Weissman JS, Campbell EG, Gokhale M, Blumenthal D. Residents' preferences and
preparation for caring for underserved populations. Journal of Urban Health : Bulletin of the
New York Academy of Medicine. 2001;78(3):535-49.
242. Kristiansen IS, Forde OH. Medical specialists' choice of location: The role of
geographical attachment in Norway. Social Science & Medicine. 1992;34(1):57-62.
243. Henry JA, Edwards BJ, Crotty B. Why do medical graduates choose rural careers?
Rural and Remote Health. 2009;9(1):1083.
244. Harris MG, Gavel PH, Young JR. Factors influencing the choice of specialty of
Australian medical graduates. The Medical Journal of Australia. 2005;183(6):295-300.
245. Scott I, Gowans M, Wright B, Brenneis F, Banner S, Boone J. Determinants of choosing
a career in family medicine. Canadian Medical Association Journal. 2011;183(1):E1-E8.
246. Senf JH, Campos-Outcalt D, Kutob R. Factors Related to the Choice of Family
Medicine: A Reassessment and Literature Review. The Journal of the American Board of
Family Practice. 2003;16(6):502-12.
247. Shelker W, Belton A, Glue P. Academic performance and career choices of older
medical students at the University of Otago. Journal of the New Zealand Medical Association.
2011;124(1346).
248. Pasley T, Poole P. Characteristics of University of Auckland medical students intending
to work in the regional/rural setting. NZ Med J. 2009;122(1292):50-60.
249. Lucas C, Edmonds L, Leroy J, Reith D. Career decisions: factors that influence the
Māori doctor. Internal Medicine Journal. 2014;44(6):562-7.

101
250. Ko M, Heslin KC, Edelstein RA, Grumbach K. The role of medical education in
reducing health care disparities: the first ten years of the UCLA/Drew Medical Education
Program. Journal of General Internal Medicine. 2007;22(5):625-31.
251. Rabinowitz HK, Diamond JJ, Veloski JJ, Gayle JA. The impact of multiple predictors
on generalist physicians' care of underserved populations. American Journal of Public Health.
2000;90(8):1225.
252. Rabinowitz HK. Recruitment, retention, and follow-up of graduates of a program to
increase the number of family physicians in rural and underserved areas. The New England
Journal of Medicine. 1993;328(13):934-9.
253. Junior docs are turning to general practice - HWNZ makes progress [updated 2014 July
28; cited 2014 August 3]. Available from: http://www.nzdoctor.co.nz/news/2014/july-
2014/28/junior-docs-are-turning-to-general-practice---hwnz-makes-progress.aspx.
254. Kuczewski MG, Brubaker L. Medical Education for" Dreamers": Barriers and
Opportunities for Undocumented Immigrants. Academic Medicine. 2014;89(12):1593-8
255. Boelen C, Heck J. Defining and measuring the social accountability of medical schools.
Geneva: Division of Development of Human Resources: World Health Organisation; 1995.
256. Medical Deans Social Accountability Coalition 2012 [cited 2014 August 3]. Available
from: http://www.medicaldeans.org.au/projects-activities/other-activities/social-
accountability.
257. Curtis S, Blundell C, Platz C, Turner L. Successfully widening access to medicine. Part
2: Curriculum design and student progression. Journal of the Royal Society of Medicine.
2014;107(10):393-7.
258. Gorard S, Adnett N, May H, Slack K, Smith E, Thomas L. Overcoming the barriers to
higher education. Trentham Books, Stoke-on-Trent; 2007.
259. Greenhalgh T, Seyan K, Boynton P. “Not a university type”: focus group study of social
class, ethnic, and sex differences in school pupils' perceptions about medical school. BMJ.
2004;328(7455):1541.
260. Andersen R. Revisiting the behavioural model and access to medical care: does it
matter? Journal of Health and Social Behaviour. 1995;36(1):1-10.
261. Brabyn L, Barnett R. Population need and geographical access to general practitioners
in rural New Zealand. NZ Med J. 2004;117(1199):U996.
262. Blakely T, Fawcett J, Hunt D, Wilson N. What is the contribution of smoking and
socioeconomic position to ethnic inequalities in mortality in New Zealand? The Lancet.
2006;368(9529):44-52.
263. Blakely T, Pearce N. Socio-economic position is more than just NZDep. NZ Med J.
2002;115:109-11.
264. Harris R, Tobias M, Jeffreys M, Waldegrave K, Karlsen S, Nazroo J. Racism and
health: The relationship between experience of racial discrimination and health in New
Zealand. Social Science & Medicine. 2006;63(6):1428-41.
265. Maguire DJ, Goodchiled M, Rhinds D. An overview and definition of GIS.
Geographical Information Systems: Principals and Applications. 1991:9-20.
266. Cowen DJ. GIS versus CAD versus DBMS: What are the differences? Photogramm
Eng Remote Sens. 1988;54(11):1551-5.
267. Sui DZ. Legal and Ethical Issues of Using Geospatial Technologies in Society. In:
Nyerges TL, Couclelis H, McMaster R, editors. The Sage Handbook of GIS and Society.
London: Sage Publications Ltd; 2011. p. 504-28.
268. Fisher RP, Myers BA. Free and simple GIS as appropriate for health mapping in a low
resource setting: a case study in eastern Indonesia. Int J Health Geogr. 2011;10(15).
269. Traynor C. Putting power in the hands of end users: a study of programming by
demonstration, with an application to geographical information systems. CHI 98 Conference

102
Summary on Human Factors in Computing Systems; Los Angeles, California, USA. 286533:
ACM; 1998. p. 68-9.
270. Mohan J. Geographies of Health and Health Care. In: Johnston RJ, Gregory D, Pratt G,
Watts M, editors. The Dictionary of Human Geography. 4th ed. Oxford and Massachusetts:
Blackwell Publishers Ltd; 2000.
271. Boulos M. Towards evidence-based, GIS-driven national spatial health information
infrastructure and surveillance services in the United Kingdom. Int J Health Geogr.
2004;3(1):1-50.
272. Higgs G. A Literature Review of the Use of GIS-Based Measures of Access to Health
Care Services. Health Serv Outcomes Res Method. 2004;5:119-39.
273. Phillips RL, Kinman EL, Schnitzer PG, Lindbloom EJ, Ewigman B. Using geographic
information systems to understand health care access. Archives of Family Medicine.
2000;9(10):971-8.
274. Roeger LS, Reed RL, Smith BP. Equity of access in the spatial distribution of GPs
within an Australian metropolitan city. Australian Journal of Primary Health. 2010;16(4):284-
90.
275. Namosha EM, Ivo Kastens, Will Kiele, Regina Kasehagen, Laurin Siba, Peter M.
Mapping the prevalence of malaria in rural Papua New Guinea using a geographic information
system. Papua New Guinea Medical Journal. 2010;53:5-14.
276. Luginaah I, Jerrett M, Elliott S, Eyles J, Parizeau K, Birch S, et al. Health profiles of
Hamilton: Spatial characterisation of neighbourhoods for health investigations. GeoJournal.
2001;53(2):135-47.
277. Grinzi P, Phillips R, Bazemore A. Navigating general practice: the use of geographic
information systems. Australian Family Physician. 2008;37(10):855-8.
278. Higgs G, Smith DP, Gould MI. Findings from a survey on GIS use in the UK National
Health Service: organisational challenges and opportunities. Health Policy (Amsterdam,
Netherlands). 2005;72(1):105-17.
279. Pachauri A. Ananya GIS, Enhancing Health Service Delivery with GIS Mapping in
Bihar, India. International Journal of Geoinformatics. 2014;10(1).
280. Public Health Mapping: World Health Organisation (WHO); 2003 [cited 2014 May
25]. Available from: http://www.who.int.ezproxy.otago.ac.nz/csr/mapping/en/.
281. Modeling Physical Accessibility to Health Care and Geographic Coverage
(AccessMod): World Health Organisation; 2014 [cited 2014 28 June]. Available from:
http://www.who.int/kms/initiatives/accessmod/en/index2.html.
282. The Dartmouth Atlas of Health Care: The Dartmouth Centre for Health Policy and
Clinical Practice; 2014 [cited 2014 September 2]. Available from:
http://www.dartmouthatlas.org/.
283. Health Quality and Safety Commission New Zealand. Atlas of Healthcare Variation
2014 [updated 06/08/2014; cited 2014 August 17]. Available from:
http://www.hqsc.govt.nz/our-programmes/health-quality-evaluation/projects/atlas-of-
healthcare-variation/.
284. Kerr A, Exeter D, Hanham G, Grey C, Zhao J, Riddell T, et al. Effect of age, gender,
ethnicity, socioeconomic status and region on dispensing of CVD secondary prevention
medication in New Zealand: The Atlas of Health Care Variation CVD cohort (VIEW-1). NZ
Med J. 2013;127(1400):39-69.
285. Grey C, Wells S, Exeter DJ, Hanham G, Zhao J, Kerr AJ. Stakeholder engagement for
the New Zealand Atlas of Healthcare Variation: cardiovascular disease secondary prevention:
VIEW-3. NZ Med J. 2013;127(1400):81-91.
286. Exeter DJ, Zhao J, Hanham G, Grey C, Wells S, Kerr A. Construction and use of
mapping techniques to describe the geographical distribution of medication dispensing for the

103
secondary prevention of atherosclerotic CVD in New Zealand: VIEW-2. NZ Med J.
2013;127(1400):70-80.
287. Ishfaq M, Lodhi B. Role of GIS in Social Sector Planning: Can Developing Countries
Benefit from the Examples of Primary Health Care (PHC) Planning in Britain? J Community
Health. 2012;37(2):372-82.
288. Luo W. Using a GIS-based floating catchment method to assess areas with shortage of
physicians. Health & Place. 2004;10(1):1-11.
289. Mokgalaka H, Mans G, Smit J, McKelly D. Validating the Accuracy of GIS-Based
Accessibility Analysis in Determining Public Primary Health Care Demand in Metropolitan
Areas. African Geo Proceedings 2014: Proceedings of the Second AfricanGEO Conference.
290. McGrail MR, Humphreys JS. Measuring spatial accessibility to primary health care
services: Utilising dynamic catchment sizes. Applied Geography. 2014;54(0):182-8.
291. Allan DP. Catchments of general practice in different countries-a literature review. Int
J Health Geogr. 2014;13(1):32.
292. Albert DP, Gesler WM. How spatial analysis can be used in medical geography. In:
Albert DP, Gesler WM, Levergood B, editors. Spatial analysis, GIS and remote sensing:
applications in the health sciences. Chelsea, MI: Ann Arbor Press; 2000. p. 11-38.
293. Creswell JW, Plano Clark VL. Designing and Conducting Mixed Methods Research.
2nd ed. London: Sage; 2011.
294. O'Cathain A, Murphy E, Nicholl J. Why, and how, mixed methods research is
undertaken in health services research in England: a mixed methods study. BMC Health
Services Research. 2007;7:85.
295. Creswell JW, Fetters MD, Ivankova NV. Designing a mixed methods study in primary
care. Annals of Family Medicine. 2004;2(1):7-12.
296. Boulos MNK. Towards evidence-based, GIS-driven national spatial health information
infrastructure and surveillance services in the United Kingdom. Int J Health Geogr. 2004;3(1).
297. Joyce K. “To me it's just another tool to help understand the evidence”: Public health
decision-makers’ perceptions of the value of geographical information systems (GIS). Health
& Place. 2009;15(3):831-40.
298. Bagheri N, Benwell G, Holt A. Measuring Spatial Accessibility to Primary Health Care.
Proceedings 17th Annual Colloquium of the Spatial Information Research Centre University
of Otago; November 24th-25th 2005; Dunedin, New Zealand.
299. Kruger E, Whyman R, Tennant M. High acuity GIS comparison of dentist and doctor
surgery locations in Auckland, New Zealand. Community Dental Health. 2013;30(2):83-7.
300. Field A, Witten K, Robinson E, Pledger M. Who gets to what? Access to community
resources in two New Zealand cities. Urban Policy and Research. 2004;22(2):189-205.
301. Pearce J, Witten K, Bartie P. Neighbourhoods and health: a GIS approach to measuring
community resource accessibility. Journal of Epidemiology and Community Health.
2006;60(5):389-95.
302. Pearce J, Dorling D. Increasing geographical inequalities in health in New Zealand,
1980–2001. International Journal of Epidemiology. 2006;35(3):597-603.
303. Andrews GJ, Crooks VA. Geographical Perspectives on Health Care: Ideas,
Disciplines, Progress. In: Crooks VA, Andrews GJ, editors. Primary Health Care: People,
Practice, Place. Geographies of Health. Surrey, England: Ashgate Publishing Limited; 2009.
p. 21-41.
304. Probst JC, Laditka SB, Wang J-Y, Johnson AO. Effects of residence and race on burden
of travel for care: cross sectional analysis of the 2001 US National Household Travel Survey.
BMC Health Services Research. 2007;7(1):40.
305. Brabyn L, Skelly C. Modeling population access to New Zealand public hospitals. Int
J Health Geogr. 2002;1(1):3.

104
306. Hays SM, Kearns R, Moran W. Spatial patterns of attendance at general practitioner
services. Social Science & Medicine. 1990;31(7):773-81.
307. Liu JJ, Bellamy G, Barnet B, Weng S. Bypass of local primary care in rural counties:
effect of patient and community characteristics. The Annals of Family Medicine.
2008;6(2):124-30.
308. Rosenberg MW. Linking the Geographical, the Medical and the Political in Analysing
Health Care Delivery Systems. Social Science & Medicine. 1988;26:179-86.
309. Panelli R, Gallagher L, Kearns R. Access to rural health services: Research as
community action and policy critique. Social Science & Medicine. 2006;62(5):1103-14.
310. Ward B, Humphreys J, McGrail M, Wakerman J, Chisholm M. Which dimensions of
access are most important when rural residents decide to visit a general practitioner for non-
emergency care? Australian Health Review. 2014: doi.org/10.071/AH14030
311. Taylor DM, Yeager VA, Ouimet C, Menachemi N. Using GIS for administrative
decision-making in a local public health setting. Public health reports (Washington, DC : 1974).
2012;127(3):347-53.
312. Jacquez GM. GIS as an Enabling Technology. In: Gattrell A, Loytonen M, editors. GIS
and Health: GISDATA 6. London: Taylor and Francis; 1998. p. 17-28.
313. Creswell JW. Research design : qualitative, quantitative, and mixed methods
approaches. Los Angeles: Sage; 2009.
314. Tashakkori A, Teddlie C. Mixed methodology: Combining qualitative and quantitative
approaches. London: Sage; 1998.
315. Johnson RB, Onwuegbuzie AJ, Turner LA. Toward a Definition of Mixed Methods
Research. Journal of Mixed Methods Research. 2007;1(2):112-33.
316. Greenwood DJ, Levin M. Reform of the Social Sciences, and of Universities through
Action Research In: Denzin NK, Lincoln YS, editors. The SAGE Handbook of Qualitative
Research. 3rd ed. Thousand Oaks: Sage Publications; 2005. p. 43-64.
317. Kemmis S, McTaggart R. Participatory Action Research: Communicative Action and
the Public Sphere. In: Denzin NK, Lincoln YS, editors. The Sage Handbook of Qualitative
Research. 3rd ed. Thousand Oaks: Sage Publications; 2005. p. 559-603.
318. McNiff J, Whitehead J. All You Need To Know About Action Research. London: Sage
Publications Ltd; 2011.
319. Koshy E, Koshy V, Waterman H. Action Research in Healthcare. London: Sage
Publications Ltd; 2011.
320. Lewin K. Action research and minority problems. Journal of Social Issues. 1946;2:34-
6.
321. Geographic definitions: Meshblock Wellington: Statistics New Zealand; 2014 [cited
2014 Oct 2]. Available from: http://www.stats.govt.nz/Census/2013-census/info-about-2013-
census-data/2013-census-definitions-forms/definitions/geographic.aspx#meshblock.
322. Haining R. Spatial Statistics and the Analysis of Health Data. In: Gattrell A, Loytonen
M, editors. GIS and Health: GISDATA 6. London: Taylor and Francis; 1998. p. 29-48.
323. Ryan GW, Bernard HR. Data Management and Analysis Methods. In: Denzin NK,
Lincoln YS, editors. The Sage Handbook of Qualitative Research. 2nd ed. London: Sage; 2000.
p. 769-802.
324. Gospodini A. Portraying, classifying and understanding the emerging landscapes in the
post-industrial city. Cities. 2006;23(5):311-30.
325. Understanding and working with ethnicity data: A technical paper. Wellington:
Statistics New Zealand. 2005.
326. Wang F. Handling Grammatical Errors, Ambiguity and Impreciseness in GIS Natural
Language Queries. Transactions in GIS. 2003;7(1):103-21.

105
327. Westin AF. Privacy and Freedom. New York: Athenaeum Publishers; 1967.
328. Armstrong MP, Ruggles AJ. Geographic information technologies and personal
privacy. Cartographica: The International Journal for Geographic Information and
Geovisualization. 2005;40(4):63-73.
329. Boulos MN, Curtis AJ, AbdelMalik P. Musings on privacy issues in health research
involving disaggregate geographic data about individuals. Int J Health Geogr. 2009;8(1):46.
330. Mascetti S, Bettini C, Freni D, Wang XS. Spatial generalisation algorithms for LBS
privacy preservation. Journal of Location Based Services. 2007;1(3):179-207.
331. Review of the Privacy Act 1993- Review of the Law of Privacy Stage 4. Wellington:
New Zealand Law Commission, 2011 Report 123.
332. Rose EA. An examination of the concern for information privacy in the New Zealand
regulatory context. Information & Management. 2006;43(3):322-35.
333. Moor JH. Towards a Theory of Privacy I1', in the Information Age. Computers and
Society. 1997;27(3):27-32.
334. Haque A. Information technology, GIS and democratic values: Ethical implications for
IT professionals in public service. Ethics and Information Technology. 2003;5(1):39-48.
335. Statistics New Zealand. New Zealand: An Urban/Rural Profile Wellington, New
Zealand [cited 2014 Oct 30]. Available from:
http://www.stats.govt.nz/browse_for_stats/people_and_communities/Geographic-
areas/urban-rural-profile.aspx.
336. Brabyn L, Beere P. Population access to hospital emergency departments and the
impacts of health reform in New Zealand. Health Informatics Journal. 2006;12(3):227-37.
337. Fraser J. Rural Health: A Literature Review for the National Health Committee. Health
Services Research Centre: Victoria University of Wellington, NZ; 2006.
338. Martin D, Wrigley H, Barnett S, Roderick P. Increasing the Sophistication of Access
Measurement in a Rural Health Care Study. Health & Place. 2002;8:3-13.
339. Gattrell A, Loytonen M. GIS and Health Research: An Introduction. In: Gattrell A,
Loytonen M, editors. GIS And Health: GISDATA 6. London: Taylor and Francis; 1998. p. 3-
16.
340. 2013 Census QuickStats about greater Christchurch: Statistics New Zealand; [updated
11 July 2014; cited 2014 Nov 3]. Available from: http://www.stats.govt.nz/Census/2013-
census/profile-and-summary-reports/quickstats-about-greater-chch.aspx.
341. Ethnic Group (grouped total responses) by age group and sex, for the census usually
resident population count, 2001, 2006, 2013 (RC, TA, AU). Wellington: Statistics New
Zealand; 2014 [cited 2014 July 26]. Available from: http://www.nzdotstats.govt.nz.
342. Baxter J. From inspiration to graduation. University of Otago Magazine 39. 2014
November 12.
343. Dunbabin J, Levitt L. Rural origin and rural medical exposure: their impact on the rural
and remote medical workforce in Australia. Rural and Remote Health. 2003;3.
344. Tiffin PA, Dowell JS, McLachlan JC. Widening access to UK medical education for
under-represented socioeconomic groups: modelling the impact of the UKCAT in the 2009
cohort. BMJ. 2012;344.
345. Garlick PB, Brown G. Widening participation in medicine. BMJ.
2008;336(7653):1111.
346. Reed RJ, Hurd B. A value beyond money? Assessing the impact of equity scholarships:
from access to success. Studies in Higher Education. 2014:1-15.
347. James D, Ferguson E, Powis D, Symonds I, Yates J. Graduate entry to medicine:
widening academic and socio-demographic access. Medical Education. 2008;42(3):294-300.

106
348. Cayo MR, Talbot TO. Positional error in automated geocoding of residential addresses.
Int J Health Geogr. 2003;2(1):10.
349. Atmore CL, Brabyn L. Population need and geographical access to general practitioners
in rural New Zealand [letter and response]. NZ Med J. 2004;117(1201).
350. Gauld R, Raymont A, Bagshaw PF, Nicholls MG, Frampton CM. The importance of
measuring unmet healthcare needs. NZ Med J.127(1404).

107
Appendix A

108
Appendix B

109

110