geographia polonica vol. 83 no. 1 (2010) sea level...
TRANSCRIPT
SEA LEVEL VARIABILITY IN THE EASTERN PART
OF THE POLISH BALTIC SEA COAST 1975-2004
KATARZYNA J. MAROSZ*, EWA JAKUSIK***Institute of Oceanography, University of Gdańsk, Poland,
Piłsudskiego 46, 81-378 Gdynia, PolandE-mail: [email protected]
**Institute of Meteorology and Water Management, Poland, Podleśna 61, 01-673 Warszawa, Poland
E-mail: [email protected]
ABSTRACT: Sea level, which has been rising over the years, constitutes a higher reference level for storm surges and fl oods. According to the IPCC, extreme phenomena occurred more frequently and this could be connected with global climate change. The work presents the relative changes of sea level and a determination of its quantitative and qualitative variability in the eastern part of the coast along the Polish Baltic Sea which was investigated for the purpose of this paper. The analysis is based upon the results of four tide-gauges: Władysławowo, Hel, Gdynia and Gdansk–Harbour. The fi rst part of the paper examines long-term and seasonal fl uctuations of sea level, then the paper discusses the matter of ampli-tudes, and the fi nal part analyses the appearance of high water levels and storm surges during the year.
KEY WORDS: sea level change, storm surges, southern Baltic Sea
INTRODUCTIONThe Baltic’s sea level depends on a com-
bination of factors. A barrage repletion of the basin, hydrometeorological conditions and isostatic lift all need to be taken into account. The last one belongs to a long–term scale variability condition. Short-term, dynamic changes of sea level are connected with anemobaric conditions. Wind speed is determined mainly by the magnitude of horizontal atmospheric pressure gradient (the higher the gradient the greater the wind speed). A long duration together with strong winds towards land moves a mass of water and subsequently accumulates it on the sea-shore increasing the risk of a storm surge. A barrage repletion of a basin and its direc-tion determine the point of reference from
which a waving process is started. When the barrage repletion of the Baltic Sea is low then a storm surge will not be so intense, as in the case with a high barrage repletion.
According to A1B SRES scenario (IPCC 2007), which presupposes the best estimated rate of greenhouse gas emission, in the nineties of the 21st century the av-erage global sea level will be 0.22-0.44 m higher in comparison with the sea level in 1990 and will be rising by about 4 mm/year. The increase of sea level at a global scale has been analyzed and described by many authors (i.e. Nicholls 2003, 2006; P. Wood-worth 2002, 2003, 2006; J. Church 2001, 2004, 2006) and its occurrence is beyond doubt. However, the effects of this process vary between the regional and local levels,
GEOGRAPHIA POLONICA2010, 83, 1, 61–69
http://rcin.org.pl
62 Katarzyna J. Marosz, Ewa Jakusik
not to mention the hemispheric or global scales. It is necessary to distinguish relative sea level changes from absolute ones. The fi rst indications regarding changes of sea level was recorded at a tide-gauge and did not take changes of land level as opposed to real changes into consideration (Rotnicki 2008). The consequences of an increase in sea level could be far-reaching, which means that this parameter is important not only for science but also in the economic and social spheres.
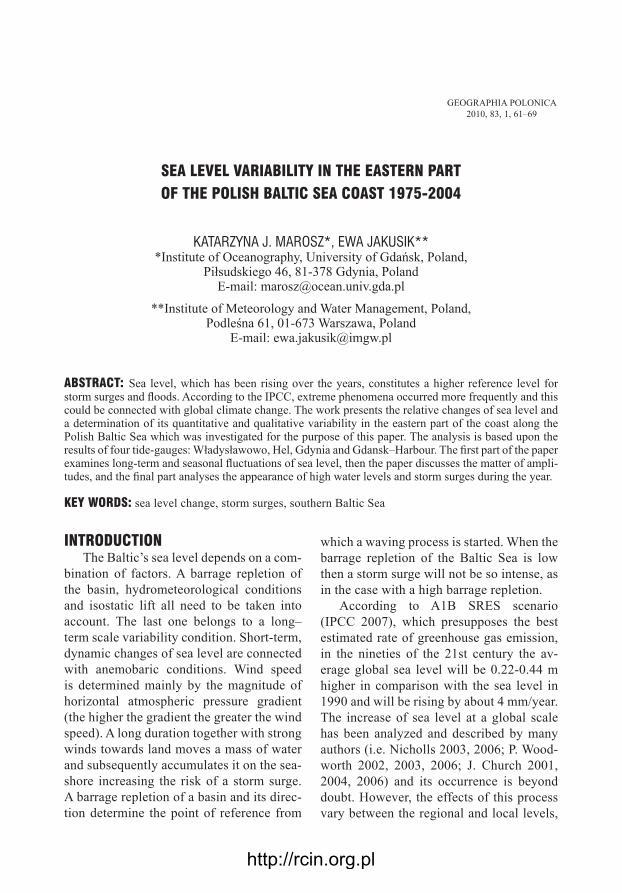
An analysis of relative sea level change and a determination of its quantitative and qualitative variability in the eastern part of the Polish Baltic Sea coast is the pur-pose of this paper. The long-term and sea-sonal variability of water level fl uctuations were studied together with trend analysis. Subsequently, amplitude variability was studied. Finally, analysis of high water levels and storm surges during the year was carried out. The data source com-prised of four tide-gauges of the Institute of Meteorology and Water Management (IMGW): Władysławowo, Hel, Gdynia and Gdansk–Harbour (Table1, Fig.1.). All of the stations belong to a fi rst order sea observ-ing station. The time-frame of the analysis is the years 1975-2004.
Observed changes in the climate of the Baltic Sea region are a refl ection of those at the global level. In this location, however, a spatial variability of glacio-isostatic movements has an impact upon the aver-age sea level. The northern part of the Bal-tic Sea basin is being lifted up, and on the other hand the southern part is descending – Fig 2a. The isoline of 0 mm/year, which is the boundary between the land that is be-ing lifted upwards in the North and the sub-sidence in the South, runs approximately across 56o N. In the northern part of Finland the phenomenon reaches its highest point with 9 mm/year and thereafter decreases towards the South of the country. During
the last century the world’s oceans rose ap-proximately 1.5 mm/year; the rate that the Baltic Sea area rose, however, increased in half this time (Pustelnikovas 2002). While the rate of sea level increase in the south-eastern part of the Baltic Sea is estimated at about 1.7 mm/year, in the north-western Gulf of Bothnia it has been reversed and is estimated to be at 9.4 mm/year. HELCOM predicted that the isostatic uplift of the Scan-dinavian land plate will be one of two main factors behind the increase of the average sea level in the southern part of Baltic Sea (sea level changes are the other factor). In fact, the net-balance between isostatic land movements and the global average sea level rise determines the situation in the Baltic Sea area (if sea level is generally rising or lowering in relation to the bedrock). As a re-
Figure 1. Position of tide-gauges.
Table 1. Coordinates of tide-gauges.Station Latitude Longitude
Władysławowo 54o 47’ 48” 18o 25’ 07”Hel 54o 36’ 07” 18o 48’ 03”Gdynia 54o 31’ 04” 18o 33’ 19”Gdansk–Harbour 54o 23’ 59” 18o 41’ 53”
http://rcin.org.pl

63Sea level variability in the eastern part of the Polish Baltic Sea coast 1975-2004
sult of glacio-isostatic movements, it is pre-dicted that the mean sea level will be higher in the southern Baltic, The Baltic proper, the Gulf of Finland and the Gulf of Bothnia are lower when compared with the annual mean sea level for 1961-1990 (Meier et al. 2006). The research results of Kowalczyk (2006) suggests that Władysławowo and Hel are lowering at a rate of about 2 mm/year, whereas Gdynia and the western part of Gdańsk are descending at 3 mm/year (the eastern part that encompasses the Vistula Delta is rising about 4 mm/year) – Fig. 2b. In the last case this is especially important be-cause over 30% of the Gdańsk area is locat-ed below 2.5 m a.s.l. and 8% below sea level (Kaulbarsz et al. 2006).
RESULTS AND DISCUSSION
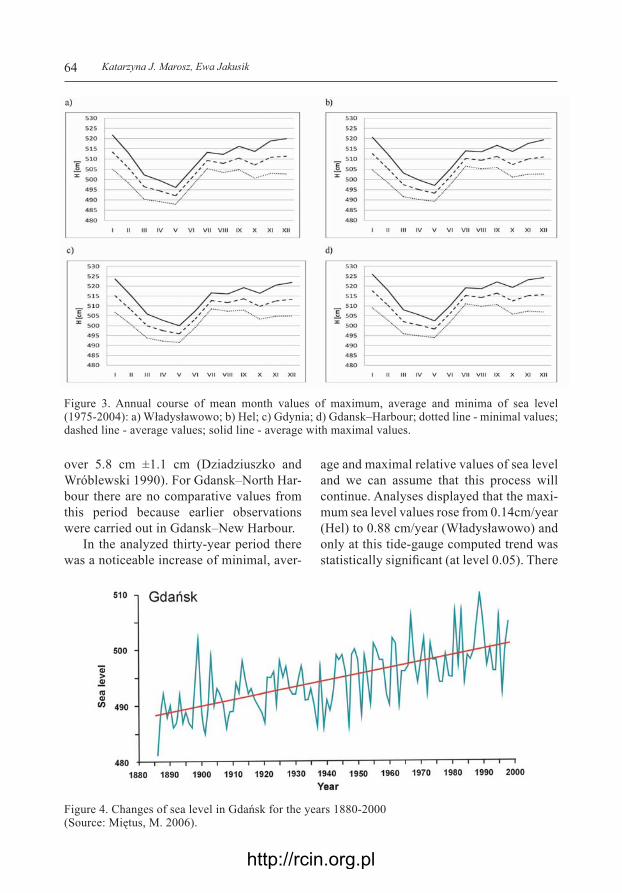
In the world ocean an increase of the rate of sea level over time was recorded. Changes in the South Baltic Sea refl ected this global phenomenon. In the period 1951-1990 the rate of sea level increase in Gdańsk was 4.02 mm/year whereas in
the years 1971-1990 the pace quickened to 7.67 mm/year (Rotnicki and Borzyszkow-ska 2008). Clearly an increase in the rate of this phenomenon can be observed for the time series 1880-2000 in Gdańsk (Fig. 3).
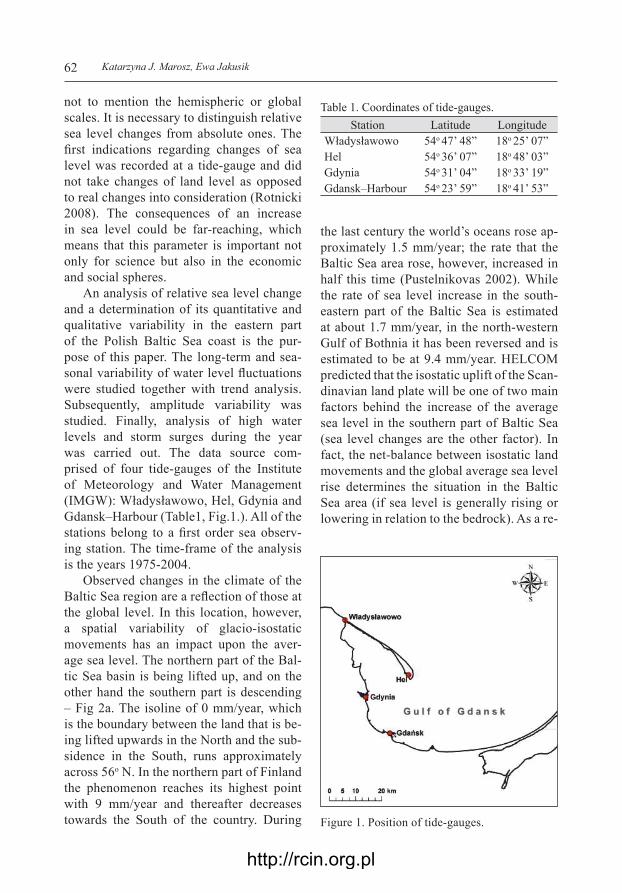
The variability of sea level is seasonal; this means that it changes during the year. Long-term monthly mean relative maxi-mum, average and minimum values of sea level increased from Władysławowo through Hel, Gdynia to Gdansk–Harbour where the highest value from among all the points occurred (Fig.4). In an annual cy-cle the highest long-term mean maximum and average values of sea level appeared in January and the minimum in July. The maximum sea level was observed between March and May. In turn long-term aver-age minimum values at all the analyzed tide-gauges appeared in May. Average sea level in the years 1975-2004 at Władysła-wowo station was 505.0 cm, Hel 505.4 cm, Gdynia 507.8 cm, Gdansk–North Harbour 510.4 cm. If we compare those values with the years 1951-1975 once can notice a rise in Władysławowo by over 6.6 cm ± 1.2 cm; Hel over 4.7 cm ± 1.2 cm and in Gdynia
Figure 2. Isostatic lift - Fennoscandia (a); Poland (b).
R U S S I A
BE
LA
RU
S
UK
RA
IN
E
BA
LT
I CS
EA
GE
RM
AN
Y
CZ
EC
H
RE
PU
BL
IC
S L O V A K I A
LIT
HU
AN
IA
mm/year 2005
Vertical crustal movements in the area of Poland1 : 3 000 000
Kamil Kowalczyk
http://rcin.org.pl
64 Katarzyna J. Marosz, Ewa Jakusik
over 5.8 cm ±1.1 cm (Dziadziuszko and Wróblewski 1990). For Gdansk–North Har-bour there are no comparative values from this period because earlier observations were carried out in Gdansk–New Harbour.
In the analyzed thirty-year period there was a noticeable increase of minimal, aver-
age and maximal relative values of sea level and we can assume that this process will continue. Analyses displayed that the maxi-mum sea level values rose from 0.14cm/year (Hel) to 0.88 cm/year (Władysławowo) and only at this tide-gauge computed trend was statistically signifi cant (at level 0.05). There
Figure 4. Changes of sea level in Gdańsk for the years 1880-2000 (Source: Miętus, M. 2006).
Figure 3. Annual course of mean month values of maximum, average and minima of sea level (1975-2004): a) Władysławowo; b) Hel; c) Gdynia; d) Gdansk–Harbour; dotted line - minimal values; dashed line - average values; solid line - average with maximal values.
http://rcin.org.pl
65Sea level variability in the eastern part of the Polish Baltic Sea coast 1975-2004
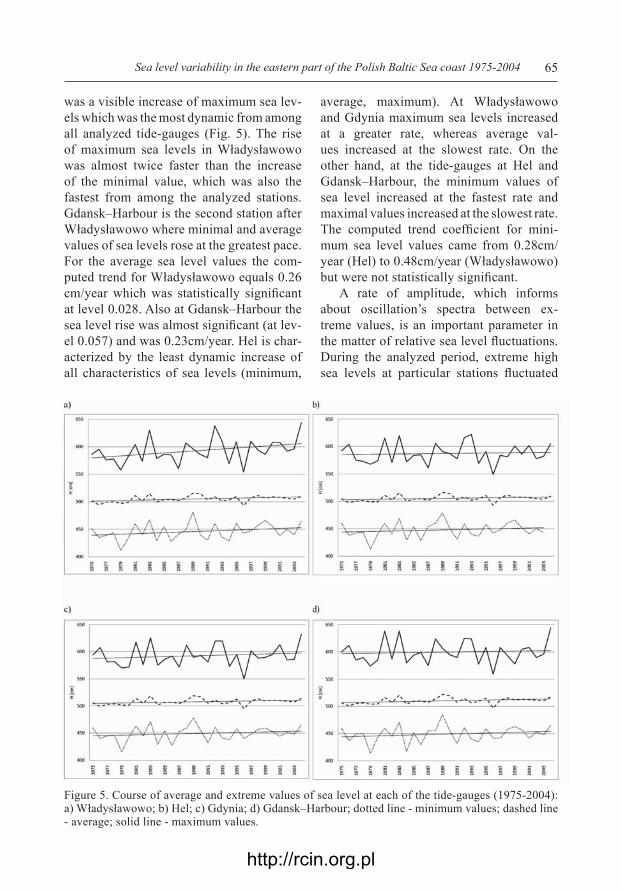
was a visible increase of maximum sea lev-els which was the most dynamic from among all analyzed tide-gauges (Fig. 5). The rise of maximum sea levels in Władysławowo was almost twice faster than the increase of the minimal value, which was also the fastest from among the analyzed stations. Gdansk–Harbour is the second station after Władysławowo where minimal and average values of sea levels rose at the greatest pace. For the average sea level values the com-puted trend for Władysławowo equals 0.26 cm/year which was statistically signifi cant at level 0.028. Also at Gdansk–Harbour the sea level rise was almost signifi cant (at lev-el 0.057) and was 0.23cm/year. Hel is char-acterized by the least dynamic increase of all characteristics of sea levels (minimum,
average, maximum). At Władysławowo and Gdynia maximum sea levels increased at a greater rate, whereas average val-ues increased at the slowest rate. On the other hand, at the tide-gauges at Hel and Gdansk–Harbour, the minimum values of sea level increased at the fastest rate and maximal values increased at the slowest rate. The computed trend coeffi cient for mini-mum sea level values came from 0.28cm/year (Hel) to 0.48cm/year (Władysławowo) but were not statistically signifi cant.
A rate of amplitude, which informs about oscillation’s spectra between ex-treme values, is an important parameter in the matter of relative sea level fl uctuations. During the analyzed period, extreme high sea levels at particular stations fl uctuated
Figure 5. Course of average and extreme values of sea level at each of the tide-gauges (1975-2004): a) Władysławowo; b) Hel; c) Gdynia; d) Gdansk–Harbour; dotted line - minimum values; dashed line - average; solid line - maximum values.
http://rcin.org.pl
66 Katarzyna J. Marosz, Ewa Jakusik
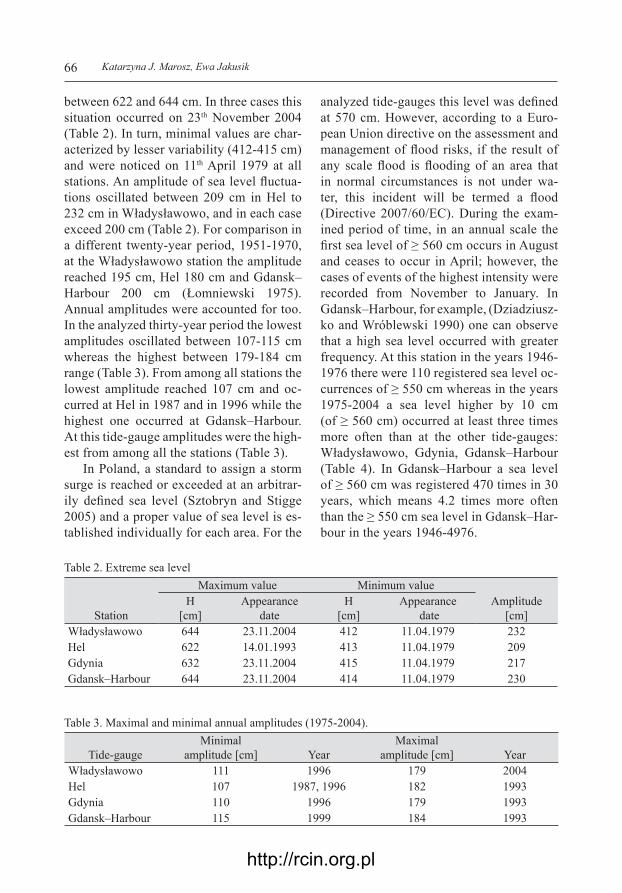
between 622 and 644 cm. In three cases this situation occurred on 23th November 2004 (Table 2). In turn, minimal values are char-acterized by lesser variability (412-415 cm) and were noticed on 11th April 1979 at all stations. An amplitude of sea level fl uctua-tions oscillated between 209 cm in Hel to 232 cm in Władysławowo, and in each case exceed 200 cm (Table 2). For comparison in a different twenty-year period, 1951-1970, at the Władysławowo station the amplitude reached 195 cm, Hel 180 cm and Gdansk–Harbour 200 cm (Łomniewski 1975). Annual amplitudes were accounted for too. In the analyzed thirty-year period the lowest amplitudes oscillated between 107-115 cm whereas the highest between 179-184 cm range (Table 3). From among all stations the lowest amplitude reached 107 cm and oc-curred at Hel in 1987 and in 1996 while the highest one occurred at Gdansk–Harbour. At this tide-gauge amplitudes were the high-est from among all the stations (Table 3).
In Poland, a standard to assign a storm surge is reached or exceeded at an arbitrar-ily defi ned sea level (Sztobryn and Stigge 2005) and a proper value of sea level is es-tablished individually for each area. For the
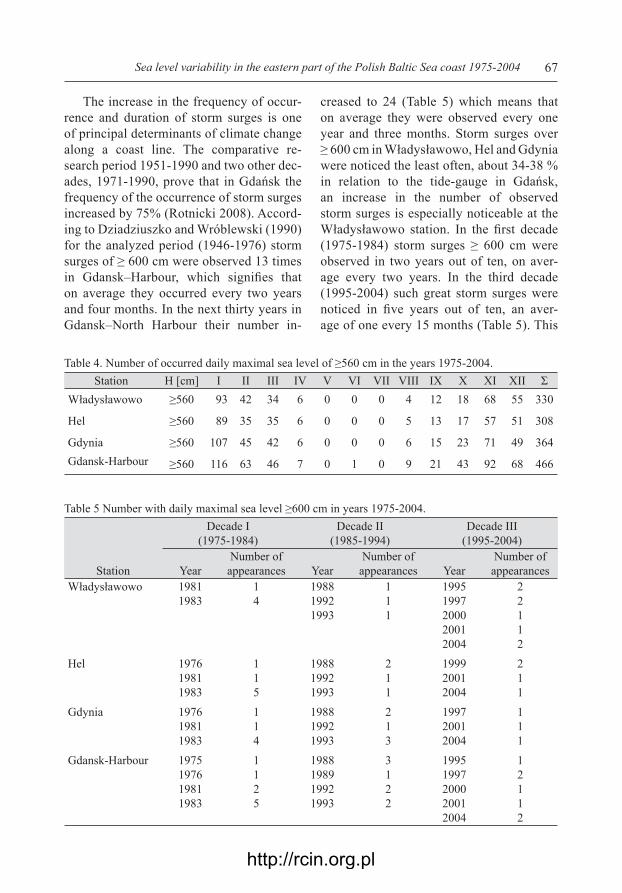
analyzed tide-gauges this level was defi ned at 570 cm. However, according to a Euro-pean Union directive on the assessment and management of fl ood risks, if the result of any scale fl ood is fl ooding of an area that in normal circumstances is not under wa-ter, this incident will be termed a fl ood (Directive 2007/60/EC). During the exam-ined period of time, in an annual scale the fi rst sea level of ≥ 560 cm occurs in August and ceases to occur in April; however, the cases of events of the highest intensity were recorded from November to January. In Gdansk–Harbour, for example, (Dziadziusz-ko and Wróblewski 1990) one can observe that a high sea level occurred with greater frequency. At this station in the years 1946-1976 there were 110 registered sea level oc-currences of ≥ 550 cm whereas in the years 1975-2004 a sea level higher by 10 cm (of ≥ 560 cm) occurred at least three times more often than at the other tide-gauges: Władysławowo, Gdynia, Gdansk–Harbour (Table 4). In Gdansk–Harbour a sea level of ≥ 560 cm was registered 470 times in 30 years, which means 4.2 times more often than the ≥ 550 cm sea level in Gdansk–Har-bour in the years 1946-4976.
Table 3. Maximal and minimal annual amplitudes (1975-2004).
Tide-gaugeMinimal
amplitude [cm] YearMaximal
amplitude [cm] YearWładysławowo 111 1996 179 2004Hel 107 1987, 1996 182 1993Gdynia 110 1996 179 1993Gdansk–Harbour 115 1999 184 1993
Table 2. Extreme sea level
Station
Maximum value Minimum valueAmplitude
[cm]H
[cm]Appearance
dateH
[cm]Appearance
dateWładysławowo 644 23.11.2004 412 11.04.1979 232Hel 622 14.01.1993 413 11.04.1979 209Gdynia 632 23.11.2004 415 11.04.1979 217Gdansk–Harbour 644 23.11.2004 414 11.04.1979 230
http://rcin.org.pl
67Sea level variability in the eastern part of the Polish Baltic Sea coast 1975-2004
The increase in the frequency of occur-rence and duration of storm surges is one of principal determinants of climate change along a coast line. The comparative re-search period 1951-1990 and two other dec-ades, 1971-1990, prove that in Gdańsk the frequency of the occurrence of storm surges increased by 75% (Rotnicki 2008). Accord-ing to Dziadziuszko and Wróblewski (1990) for the analyzed period (1946-1976) storm surges of ≥ 600 cm were observed 13 times in Gdansk–Harbour, which signifi es that on average they occurred every two years and four months. In the next thirty years in Gdansk–North Harbour their number in-
creased to 24 (Table 5) which means that on average they were observed every one year and three months. Storm surges over ≥ 600 cm in Władysławowo, Hel and Gdynia were noticed the least often, about 34-38 % in relation to the tide-gauge in Gdańsk, an increase in the number of observed storm surges is especially noticeable at the Władysławowo station. In the fi rst decade (1975-1984) storm surges ≥ 600 cm were observed in two years out of ten, on aver-age every two years. In the third decade (1995-2004) such great storm surges were noticed in fi ve years out of ten, an aver-age of one every 15 months (Table 5). This
Table 5 Number with daily maximal sea level ≥600 cm in years 1975-2004.
Station
Decade I(1975-1984)
Decade II(1985-1994)
Decade III(1995-2004)
YearNumber of
appearances YearNumber of
appearances YearNumber of
appearancesWładysławowo 1981
198314
198819921993
111
19951997200020012004
22112
Hel 197619811983
115
198819921993
211
199920012004
211
Gdynia 197619811983
114
198819921993
213
199720012004
111
Gdansk-Harbour 1975197619811983
1125
1988198919921993
3122
19951997200020012004
12112
Table 4. Number of occurred daily maximal sea level of ≥560 cm in the years 1975-2004.Station H [cm] I II III IV V VI VII VIII IX X XI XII Σ
Władysławowo ≥560 93 42 34 6 0 0 0 4 12 18 68 55 330
Hel ≥560 89 35 35 6 0 0 0 5 13 17 57 51 308
Gdynia ≥560 107 45 42 6 0 0 0 6 15 23 71 49 364Gdansk-Harbour ≥560 116 63 46 7 0 1 0 9 21 43 92 68 466
http://rcin.org.pl

68 Katarzyna J. Marosz, Ewa Jakusik
means that there was an increase of over 63 % in comparison with the fi rst decade, in spite of the untypical 1983 year (January and February were extraordinary stormy, which has been noted in many papers). In Gdynia and Hel in each decade there were three years in which storm surges of ≥600 cm were observed. In Gdansk–Har-bour in the last decade (1995-2004) such a high sea level was noticed on average eve-ry two years (Table 5).
In the years 1975-2004 sea levels of ≥ 600 cm were observed at all the tide-gauges in November, January and Febru-ary. One can notice that storm surges with an order of magnitude of 600 cm not only appeared more often but what followed was a lengthening of the storm surge season. In the years 1946-1976 sea levels of ≥ 600 cm were observed fi rst of all in November and in January, rarely in February (Dziadziusz-ko and Wróblewski 1990), and were there-fore characteristic for 1/3 of the year.
CONCLUSIONS
An increase of sea level is an alarming phenomenon as it poses a threat for indi-viduals and economies. First of all it con-tributes to a higher reference level for storm surges which in turn causes more intensive abrasion of the coast line and destruction of harbours’ infrastructure. Moreover, a rise in sea level results in an increase in the groundwater level and sea-water intrusion. Coastal areas lose the capability of dewater-ing which is signifi cant for rainfall fl oods when even smaller intense rainfall events will be able to cause fl ash fl oods. Analysis carried out with reference to the eastern part of the Polish coast of the Baltic Sea is co-herent with the research of the IPCC which describes the increase of the mean sea lev-el. These fi ndings state that there has been an increase in the fl uctuations of minimal,
average and maximum of sea level in the eastern part of the Polish Baltic Sea, which is probably connected with global climate change. For the time period of 1975-2004 the computed trend for the average sea level value rose from 0.18 cm/year (Hel) to 0.26cm/year (Władysławowo) but only for the least tide-gauge it is statistically signifi -cant. The analysis confi rms the increase in the frequency of the appearance of high sea level during the year and as a result storm surges appear earlier and disappear later during the year. There is a marked extension of the duration of sea levels of ≥ 600 cm in the analyzed third decade (1975-2004) for April (Władysławowo – 4 cases, Gdy-nia – 3, Gdansk–Harbour -1) and for Sep-tember (Gdynia – 1 case) which means that the time span of a possible occurrence of such a high sea level covers 2/3 of the year. From among analyzed tide-gauges Gdansk–Harbour is the most endangered by high sea levels and storm surges.
REFERENCES
Directive 2007/60/EC of the European Par-liament and of the Council of 23rd Octo-ber 2007 on the assessment and manage-ment of fl ood risks, OJ L 288, 6.11.2007.
Dziadziuszko, Z., Wróblewski, A. (1990), Stany wody [Water’s stages], in Majew-ski, A.(eds.), Zatoka Gdańska [Gulf of Gdańsk], Wydawnictwa Geologiczne, Warszawa, 122-148.
HELCOM Thematic Assessment (2007), Climate Change In the Baltic Sea Area, BSEP No.111.
IPCC (2007), Climate Change 2007: The Physical Science Basis, Susan Solomon, Dahe Qin, Martin Manning, Melinda Marquis, Kristen Averyt, Melinda M. B. Tignor and Henry LeRoy Miller (eds.), Cambridge University Press, Cambridge, UK.
http://rcin.org.pl

69Sea level variability in the eastern part of the Polish Baltic Sea coast 1975-2004
Kaulbarsz, D., Kordalski, Z. and Jegliński, W. (2006), Gdańsk case study area, Sec-ond International ASTRA Conference “Climate change adaptation and fl ood risks in coastal areas”, October 26-28, 2006, Polish Geological Institute (PGI), Gdańsk, Poland.
Kowalczyk, K. (2006), New model of the vertical crustal movements in the area of Poland, Geodesy and Cartography, Vol. XXXII, (4): 83–87.
Łomniewski, K. (1975), Wybrane zagadnie-nia z dynamiki wód bałtyckich [Selected problems of Baltic water dynamics] in Łomniewski, K., Mańkowski, W., Zale-ski, J., Morze Bałtyckie [The Baltic Sea], Państwowe Wydawnictwa Naukowe (PWN), Warszawa, 215-243.
Meier, H.E.M., Broman, B., Kallio, H. and Kjellström, E. (2006), Projections of fu-ture surface winds, sea levels, and wind waves in the late 21st century and their application for impact studies of fl ood prone areas in the Baltic Sea Region, in Schmidt-Thomé, P. (ed.), Sea Level Change Affecting the Spatial Develop-ment of the Baltic Sea Region, Geologi-cal Survey of Finland, Special Paper 41, 23–43.
Miętus, M. (2006), Climate changes in the Southern Baltic area, Second Internation-
al ASTRA Conference “Climate change adaptation and fl ood risks in coastal ar-eas”, October 26–28, 2006, Polish Geo-logical Institute (PGI), Gdańsk, Poland.
Pustelnikovas, O. (2008), On the Eastern Baltic environment changes: a case study of the Curonian Lagoon area, Geologija 50, 2 (26): 80-87.
Rotnicki, K. (2008), Transgresja morska i jej skutki [Sea transgression and its effects], Kosmos. Problemy nauk biologicznych, Polskie Towarzystwo Przyrodników im. Kopernika, vol. 57, (3–4): 225–239.
Rotnicki, K., Borzyszkowska, W. (2008), Accelerated sea-level rise and its causes on the Polish coast of the Baltic Sea in the years 1951–1990, <http://www.lgt.lt/geoin/fi les/Karol_Rotnicki.doc>, ac-cessed 3rd April 2008.
Staudt, M., Kallio, H. and Schmidt-Thomé, P. (2004), Modelling a future sea level change scenario affecting the spatial de-velopment in the Baltic Sea Region-First results of the SEAREG Project, Coastline Reports 2: 195–199.
Sztobryn, M., Stigge, H.J. (2005), Storm surges along the southern Baltic Sea (western and central parts), Instytut Metetorologii i Gospodarki Wodnej (IMGW), Warszawa.
http://rcin.org.pl
INFORMATION FOR AUTHORS
The editors of Geographia Polonica invite theoretical and empirical contributions to human as well as physical geography, in broad terms. Articles are expected to be original and not yet published elsewhere unless in languages other than English.
MANUSCRIPTS. Manuscripts, in the English language, should be submitted to the Editor of Geographia Polonica (Institute of Geography and Spatial Organization, Polish Academy of Sciences, Twarda 51/55, 00-818 Warszawa, Poland).
As all manuscripts will be reviewed, therefore, authors are kindly requested to provide two hard copies of the complete text (main text, abstract, references, tables, illustrations) and one 3.5" diskette in MS Word.
The manuscripts should be arranged in the following order. First sheet: title, full name of author(s), affiliation, full postal adress, e-mail address. Second sheet: abstract of no more than 100 words, key words (3-10) at the end of the abstract. Subsequent sheets: the main text of about 20-25 pages (in A4 format). Then on separate sheets: acknowledgement (if desired), notes, references, tables, illustrations, captions to illustrations.
The main text may be organized in sections under appropriate headings without numerals.
SPACING. Manuscripts should be printed with 1,5 lines spacing without indents; for paragraphs enter a line space.
REFERENCES should be printed in alphabetical sequence at the end of the text. Examples: Articles from journals:
Perroux, E (1950), Economic Space:Theory and Applications, Quarterly Journal of Economics, 64: 89-104, Kotarba, A. (1992), Denudacja mechaniczna Tatr Wysokich pod wplywem opadów ulcwnycli [Mechanic Denudation in the High Tatra Mountains Caused by Downpours], Prace Geograficzne 1955, Instytut Geografii i Przestrzennego Zagospodarowania (IGiPZ), PAN: 191-208.
Books: Stren, R..White, R. and Whitney, J. (1992), Sustainable Cities, London, Jessica Kingslcy Publishers.
Chapters from books: Dematteis G., 1996, Toward a Unified Metropolitan System in Europe: Core Centrality versus Network Distributed Centrality, in Pumain, D. and Saint-Julien, T. (eds.), Urban Networks in Europe, INED, John Libbey, Paris, 19-28.
Theses: Elfring T., 1987, Service Employment in Advanced Economies, Unpublished Ph.D. thesis, Rotterdam, Erasmus University, School of Management.
References should be indicated in the text by listing, in parenthesis, the author's name followed by the data of publication, e.g. (Kowalski 1995) or (Kowalski and Brown 1996) or (Kowalski et al. 1997) if there are more than two authors (Note: all the authors should be listed in the references).
FOOTNOTES and NOTES should be referred to by superscript letters.
ILLUSTRATIONS should be supplied in one of the following formats: —photographs: JPG, TIFF, EPS or PSD, —maps, figures and diagrams should be presented as vector files in AI (Adobe Illustrator) or one of the
format mentioned above. Please ensure that the resolution is not lower than 300 dpi and the lines are a minimum of 0.3 points thick.
Please also supply printouts of illustrations that are to be presented, in black and white or in colours, in relation to the required final appearance in print.
TABLES should be printed on separate sheets and numbered sequentially with Arabic numerals (e.g. Table 1). Each table should be provided with a clear descriptive caption at the top and informative column headings.
EQUATIONS and SYMBOLS used in mathematical formulae must be clearly explained. Axes on graphs should be described clearly. Units and abbreviations used by authors should conform to the International List.
MEASUREMENTS should be given in metric units.
ACCEPTED MANUSCRIPTS. After acceptance for publication, authors will receive page proofs for approval before publication. The revised manuscript should be returned promptly to the Editor.
Articles accepted for publication in Geographia Polonica are not honoured financially. Authors of accepted articles will receive one copy of the journal free of charge.
Authors are responsible for indicating copyright as well as permission from the copyright holder to reproduce any texts, tables or illustrations for which copyright exists. http://rcin.org.pl

GEQGRAPHIA POLONICA
Vol. 83 No. 1 Spring 2010
CONTENTS
ISSN 0016-7282 http://rcin.org.pl