geogebra for trigonometry - mrs orr's...
TRANSCRIPT

ICT & MATHS
Module 3
GeoGebrafor Trigonometry
It is envisaged that this module will also include a session where the participants share resources they themselves have developed using
GeoGebra with the other participants.

2
Published by
The National Centre for Technology in Education in association with the Project Maths Development Team.
Permission granted to reproduce for educational use providing the source is acknowledged. Copying for any other purposes is prohibited without the prior written permission of the publisher.

3
GeoGebra for Trigonometry
Published by:
The National Centre for Technology in Education Dublin City UniversityGlasnevinDublin 9Tel: +353 1 700 8200
Email: [email protected]: www.ncte.ie / www.scoilnet.ie
Project Maths Development TeamFoireann Forbatha Thionscadal MataDrumcondra Education Centre Drumcondra Email: [email protected] 9 Web: www.projectmaths.ie
Copyright © National Centre for Technology in Education & Project Maths Development Team 2010
Permission granted to reproduce for educational use providing the source is acknowledged. Copying for any other purposes prohibited without the prior written permission of the publisher.
Please note
Screenshots used in this manual may appear different from those on computer screens used by participants; variations in versions of the software and differing operating systems may be in use.
The World Wide Web is constantly evolving and content and URLs (Universal Resource Locators - website addresses) change over time. It is possible that the content located at some of the URLs listed throughout this manual may change over time.
Screenshots and software titles used throughout the manual are from a PC using Windows Vista©. Participants using other operating systems may encounter some differences in screen presentation and layout.
Throughout this module reference may be made to software titles and suppliers of Internet services. These references are made purely to illustrate or expound course content. Any such reference does not imply any endorsement by the NCTE of a product or company. The reader should be aware that typically there are many products and companies providing similar services in areas related to ICT. Participants should be as informed as possible before making decisions on purchases of ICT products or services.

4
GeoGebra for Trigonometry
Duration
2.5 hours
ObjectivesThis module aims to enable the participant to:
plot trigonometric functions vary the units on the axes of graphs use sliders when plotting functions such as asinbx create a dynamic web page from a GeoGebra file

5

6

7
Plotting Trigonometric functions
1. In the Input bar type in f(x) = sin (x). Press Enter.
2. The x-values will be in radians. Right click on the Drawing pad. Select Drawing Pad and with the xAxis tab open click on the arrow beside unit and select π. Click Close.The radian measure will now be given in terms of π. If you wish to have the x- values shown in degrees see next section.
3. Right click on the Drawing pad. Select Drawing Pad and the yAxis tab. Then change the max and min values so that the sine curve is positioned about the middle of the Drawing pad. Click Close.

8
4. Right click on the graph of y = sin(x). Select Object Properties and selecting the Basic tab choose Name and Value to label the graph with its equation. Then select the Color and Style tabs to change the colour of the curve and its thickness. Click Close. (If we select the graph and drag it, its equation will change as it is phase shifted).
5. Right click on the Drawing Pad. Select Drawing Pad. Select Background Color, and choose a suitable background colour. Click Close.
6. With the above method of labelling it is not possible to change the size of the text in
the label. If we select the Insert Text tool and click on the screen where we wish the text to appear, and type in f(x)= and then click on the equation f(x) = sin(x) in the Algebra View, “f(x) =”+f appears in the text box. Click OK.
7. If we now right click this Text box and choose Object Properties we can change its size and colour, as shown below on the left hand side, by selecting the Text tab and Color tab respectively. Click Close.
8. Hide the Algebra View, by selecting View from the menu bar and then clicking on Algebra View – the result is shown on the right hand side below.

9
To show the x – values in degree measure rather than in radian measure.
Select File, New window
Type in y = sin(x0) in the Input bar. Press Enter.
Click on the degree symbol here.
Click on Options, Drawing Pad, and insert the following values or similar.
10
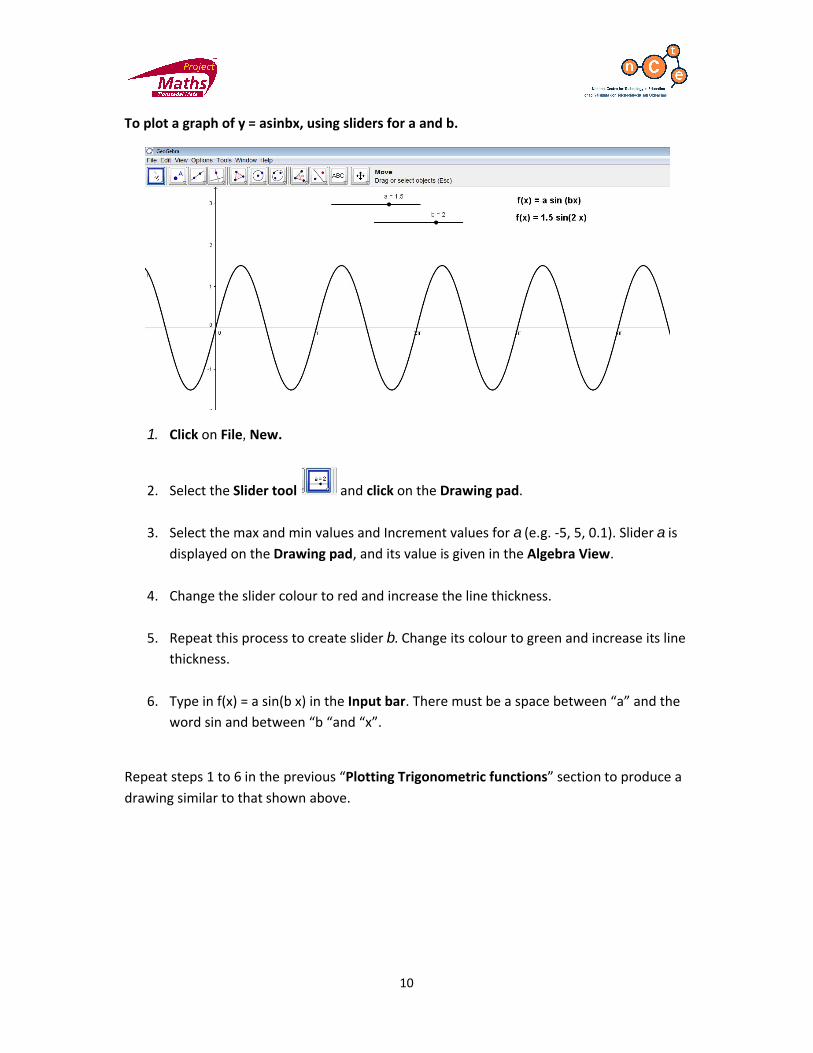
To plot a graph of y = asinbx, using sliders for a and b.
1. Click on File, New.
2. Select the Slider tool and click on the Drawing pad.
3. Select the max and min values and Increment values for a (e.g. -5, 5, 0.1). Slider a is displayed on the Drawing pad, and its value is given in the Algebra View.
4. Change the slider colour to red and increase the line thickness.
5. Repeat this process to create slider b. Change its colour to green and increase its line thickness.
6. Type in f(x) = a sin(b x) in the Input bar. There must be a space between “a” and the word sin and between “b “and “x”.
Repeat steps 1 to 6 in the previous “Plotting Trigonometric functions” section to produce a drawing similar to that shown above.

11
How to create a dynamic worksheet of the above GeoGebra file.
Create a new folder called “Dynamic Worksheets Folder for GeoGebra” in My Documents or a location of your choice.
Save the GeoGebra file in this folder.
Click on File, Export – Dynamic Worksheet as a Webpage (or Ctrl –Shift –W.)
Fill in the title of the worksheet, name of the author, date and any instructions into the Text above the construction box and into Text after the construction box.
Click on the Advance tab and select the option “Show icon to reset the construction”. This will cause a reset icon to be displayed in the upper right hand corner of the interactive applet so that it can be reset to its original state after manipulation.
Insert values for width and height. Try 1100 for width and 500 for height or experiment with different values.

12
Click on Export and save the dynamic worksheet in the Dynamic worksheets folder created as instructed above. Some versions of Geogebra will create several Executable Jar Files known as .jar files which need to stay in the same folder as the dynamic worksheet and the corresponding GeoGebra file to ensure it will always work. Hence it is a good idea to create a “Dynamic Worksheets Folder for GeoGebra” prior to saving the dynamic worksheet.Note: some versions of GeoGebra do not produce these .jar files and if this is the case with your version ignore them, but the dynamic worksheet and the corresponding GeoGebra file will still need to be stored in the same folder.
As soon as it is saved the dynamic worksheet is opened in the web browser.
Next, right click on the bar which says “Click here for options”. Select “Allow Blocked Content” and select “Yes”.
13
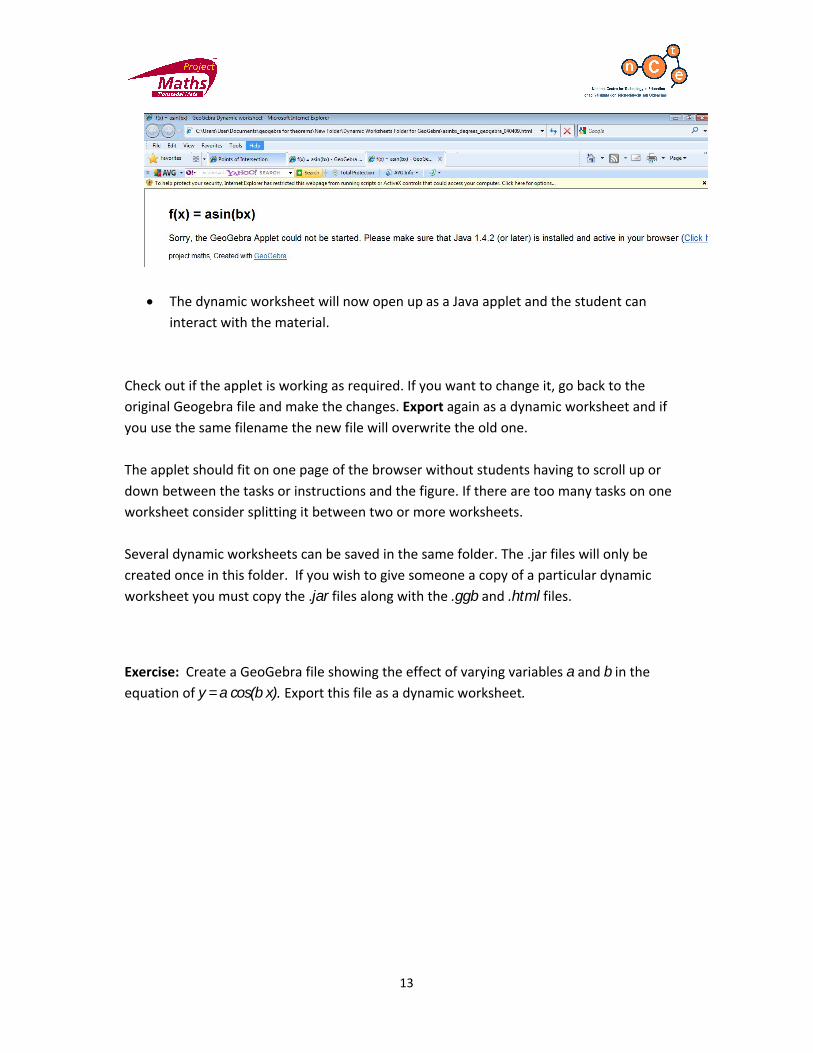
The dynamic worksheet will now open up as a Java applet and the student can interact with the material.
Check out if the applet is working as required. If you want to change it, go back to the original Geogebra file and make the changes. Export again as a dynamic worksheet and if you use the same filename the new file will overwrite the old one.
The applet should fit on one page of the browser without students having to scroll up or down between the tasks or instructions and the figure. If there are too many tasks on one worksheet consider splitting it between two or more worksheets.
Several dynamic worksheets can be saved in the same folder. The .jar files will only be created once in this folder. If you wish to give someone a copy of a particular dynamic worksheet you must copy the .jar files along with the .ggb and .html files.
Exercise: Create a GeoGebra file showing the effect of varying variables a and b in the equation of y = a cos(b x). Export this file as a dynamic worksheet.