geochemistry of single diamond crystals by instrumental
TRANSCRIPT

Geochemistry of single diamond crystals
by Instrumental Neutron Activation Analysis,
by
Ashok Damarupurshad
A thesis submitted in fulfillm ent
of the requirements
for the degree of
M AS.TEILQfl- .S.CIEMCK in the
Department of Geology,
University of the Witwatersrand.
February 1995

u
Declaration
It is hereby declared that aii the analyses, discussion and interpretation contained in
this thesis, except where acknowledged in the text, was performed by the author.
The work has not been submitted elsewhere for a higher degree.
Place: UJIT&

PEPICAXLQN.iii
This thesis is dedicated to my dearest grandmother,
Boodhanee Budhai,
for being the best
cook, nurse, tailor and teacher
that ? know.
/•
The important thing in science is not so much to ontain new facts as to discover newways o f thinking o f them.
(In A. Koestler and J.R. Smithie’s Beyond Reduction 1968 (London : Hutchinson).

CHALCEDONY OFFERINGS
At Beohari 'neath a peepul tree The Hindu God Mohadeo is wrought
Upon a rock. Before him have been brought Offerings of calcite and chalcedony,
Culled from the hills by many a devotee Who seeing there a shining mineral thought
"With this I will appease his wrath," and sought For gem-like stones of clear transparency.
Castings from Nature's foundry! ■ these were made In cavities of various mould and size In lavas by solutions that had grown
Wealthy in mineral as they did arise...
FLOWERS FROM FIRE
Before Decay these lavas decomposed, Disintegrating them to emerald earth,
Before they were in her embrace enclosed, Great Nature knew not of this streamlet's birth.
Before the mists upon the mountains wept Their rainbow tears which carved its narrow urn
That as a crystal flood together kepi They might unto the mighty Sea return
Not till lavas, whose live soul was steam,Had baked as in a kiln the under-clay,
Not till their fire was quenched were they supreme for blossoms in their myriads seen to-day....
iv
(Kenneth Knight Hallowes: The poetry o f geology, 1933)

ACKNOWLEDGEMENTS
A complete thesis may be viewed as a contribution of knowledge to the scientific
community » but to achieve this one has to travel through a difficult path. During
this journey r>ne learns, forgets, remembers, makes and loses i'riends, thanks and
insults God, develops an ulcer, loses ones hair ..........and throughout all this, the
idea of quitting appears very attractive.
However, like in so many paths in life, dealing with all this are valuable lessons in
life. Hence, in the process of starting and finishing a thesis, one is educating and
improving one's self - i.e., one is gaining experience and experience builds
character. Therefore I'd like to think that my thesis is only a tiny scientific
contribution but a huge contribution to building and shaping my character.
So for the opportunity to learn new lessons and remember old ones, I am grateful
firstly to God and then to the following people and organizations:
1. Firstly I am indebted to my employer, the South African Council for G eoscience,
for financial support. In particular I would like to thank Dr. C. Frick, Mr. L .S .
Labuschagne, Dr. D. De Bruin and Dr. RJL Hart for arranging funding and
affording me the luxury of studying whilst being a salaried employee.
2. To my supervisor, Rodger Hart: firstly for putting up with my moody, fiery and
sometimes over-ambitious nature; secondly, for permitting me to work on the
project; thirdly, for correcting, editing and proof-reading several drafts of the
thesis.
3. To D.N. Robinson and the Anglo American ICimberlite Research Unit for donating
the South African diamonds.
4. To J.P.F. Sellschop and Henry Meyer for initiating the project and providing the
American and Chinese diamonds.
jt
5. Iain McDonald, who helped me with the basics of Neutron Activation Analysis
and geochemistry itself.
6. To my friends Raju Kala and Angela Govender for their friendship, help, advice,
encouragement and support during the Iasi few years.t7. Sam Masaia, who transported the samples to and from the reactor. I am also
grateful for his help in the early stages of the project.
8. Marian Tredoux, for her stimulating conversations and also for her assistance at
U .C .T .
9. Deon De Bruin, who made some valuable comments, criticisms and suggestions
on one of the earlier drafts of the thesis.
10. To Mellisa Kirkley, who instructed me on the use of the Carbonate Line at
U .C .T .

ABSTRACT
Neutron Activation Analysis (NAA) is probably the most powerful technique, available to date, for
the analysis of the trace elements in diamond. The carbon matrix of diamond is not activated by
neutrons, so there is no interference from the matrix itself. Of the known 62 impurity elements in
diamond it is possible to analyze for 55 by neutron activation analysis. In this study the technique of
neutron activation analysis has been modified and optimized for the analysis of single, small (0.01
0.5 carat), inclusion-bearing and inclusion-free diamonds.
Instrumental Neutron Activation Analysis (INAA) was used to analyze for up to 40 different elements
at the ppb and ppt levels in diamonds from Brazil, South Africa, Colorado and China. Both,
peridotitic diamonds (those that contain either purple/red garnet, enstatite, chrome-diopside, olivine,
sulphide and chrome-spinel inclusions or combinations of these) and edogitic diamonds (those that
contain either orange garnet, omphacitic-clinopyroxene and sulphide inclusions or combinations of
these phases) were analyzed. The data obtained was used to detect and understand the differences
between diamonds from the edogitic and peridotitic parageneses and between diamonds from the
different localities.
In this regard, two interelement ratios i.e., Cr/Sc and Au/Ir ratios were found to be useful. Cr/Sc
ratios range from <1 to >10 000. The Cr/Sc ratios of edogitic diamonds are. low, usually less than 50,
while peridotitic diamonds have Cr/Sc ratios that are always in excess of 100. These are equivalent to
the Cr/Sc ratios of basaltic rocks (5-49) and ultramafic rocks (100-400), respectively and is consistent
with the behaviour of Cr as a compatible element and Sc as a moderately compatible element during
crystallizing/melting of liquids of basaltic composition.
It seems, also, that diamonds from a particular locality or mine have a unique range of Cr/Sc ratios.
Furthermore, the identity of the dominant silicate inclusion/s can be deduced from the Cr/Sc ratio of
the diamond, since each type of silicate inclusion has a different range of Cr/Sc ratios. Not only is the
Cr/Sc ratio distinctive for silicate inclusions in diamonds, it i,. also quite distinctive for minerals
cogeuctic with diamond such as orange garnet, red garnet, purple garnet, chrome diopside and
orthopyroxene (macrocrysts) which were separated from kimberlites. This confirms that diamond

inclusions are diamond-encased (and thus protected and preserved) xenocrysts found in 'kimberlitic'
rocks. Furthermore, there is a positive correlation between Cr and Sc for any one silicate diamond-
inclusion type or cogenetic mineral but a negative correlation between Cr and Sc in garnet megacrysts
of kimberlites.
Often, diamonds with only visible sulphide inclusions or no visible inclusions can also be identified
as belonging to either the peridotitic or eclogitic paragenesis because they may contain detectable
quantities of Cr and Sc. The presence of Cr and Sc in these diamonds might be interpreted as a
confirmation of the suggestion by Fesq et. al. (1975) of the presence of submicroscopic silicate
inclusions in diamond.
Sulphide inclusions may also contain detectable quantities of Au and Ir and the ratio of these two
elements can also be used to differentiate between diamonds of the two parageneses, Eclogitic
diamonds have a wide range of Au/Ir ratios from low, "mantle" values to high, "crustal" values (1
40). Peridotitic diamonds have low mantle values only (0.01-1).
Carbon isotope ratios of these eclogitic and peridotitic diamonds were also measured. The object here
was to compare the carbon isotope ratios of the diamonds to their Cr/Sc and Au/Ir ratios. This
comparison revealed that the carbon isotope ratios of diamonds from both parageneses overlap in a
narrow range and do not show the clear separations seen with Cr/Sc and Au/Ir ratios. It can be
suggested, therefore, on the basis of the suite of 61 diamonds analyzed in this study, that the Cr/Sc
and Au/lr ratios are much more useful tools to distinguish between diamonds of the two parageneses.

TABLE.Q F .m m m iS
N o. CONTENTS PAGE
TITLE i
DECLARATION ii
DEDICATION iii-iv
ACKNOWLEDGEMENTS V
ABSTRACT vii
TABLE OF CONTENTS ix
INTRODUCTION 1
1 ANALYTICAL TECHNIQUES 4
1.1 Introduction to Neutron Activation Analysis (NAA) 4
1.2 Irradiation 4
1.3 Principles of NAA 5
1.4 Instrumentation 6
1.5 NAA of diamonds 9
1.6 Other nuclear techniques used in the geochemical study of diamonds 12
1.7 Analysis of diamonds by other techniques 12
X
2 METHODOLOGY 16
2.1 Diamond selection 16
2.2 Diamond preparation 16
2.3 Standardization 17
2.4 Preparation of quartz vials 19
2.5 Irradiation 20
2.6 Post Irradiation Preparation 20
2.7 Counting 22
2.8 Short-lived Isotopes 23
3 RESULTS 25
3.1 Finsch diamonds 26
3.2 Premier diamonds 28
3.3 Brazilian diamonds 30
3.4 George Creek diamonds 31
3.5 Chinese diamonds 32
4 DISCUSSION 33
4.1 Cr and Sc in diamonds 33
4.2 Geochemistry of Cr and Sc in upper mantle rocks and minerals 39
4.3 Au and Ir in diamonds 43
4.4 REE in diamonds 46
5 CARJBON ISOTOPES 50
5.1 Methodology 50
5.2 Results 52
5.3 Discussion 53
6 CONCLUSIONS 56

xi
7 APPENDIX 59
7.1 Appendix I: Diamond descriptions 59
7.2 Appendix II: Standard data and comparisons 64
7,3 Appendix HI: Isotopes for counts 1-4 66
7.4 Appendix IV: Analytical data 70
7.5 Appendix V: Carbon isotope data 77
8 REFERENCES 80

LIST. OF.. ILL.USXR AII.ONS.
N o. ILLUSTRATION PAGE
Photo 1 HPGe, "monster" detector 7
Photo 2 Electronics for gamma-counting 8
Photo3 The computer used 8
Fig.2.1 Quartz vials. 19
Photo 4 Quartz vials and counting vials. 21
Fig.2.2 Liquids used to clean quartz vials. 21
Fig.4.1 Cr vs Sc in diamonds with silicate inclusions. 34
Fig.4.2 Cr vs Sc in Brazilian and Premier diamonds with sulphide inclu'• ions. 34
Fig.4.3 Cr vs Sc in diamonds with different silicate inclusions. 36
Fig,4.4 Cr vs Sc for heavy minerals separated from South African kimberhtes 37
Fig.4.5 Cr/Sc ratio vs Ca/Cr ratio in diamonds. 38
Fig.4.6 Cr vs A1 in garnet inclusions in diamond 38
Fig.4.7 Cr vs MgO in diamond inclusions 43
Fig.4,8 Au vs Ir in single diamonds compared to South African kimberlites 44
Fig.4.9 Positive correlation between Au and As in peridotitic, Brazilian diamonds with sulphide inclusions.
45
Fig.4.10 Positive correlation between Ni and Au in peridotitic, Brazilian diamonds with sulphide inclusions.
45
Fig.4.11 Positive correlation between Au/Ir and Fe/Fe+Ni ratios in diamonds with sulphide inclusions.
46
Fig.4.12 REE patterns for diamonds PPG1, FOG1 and FOG2. 47
Fig.4.13 REE patterns for Brazilian and Premier diamonds with sulphide inclusions. 48
Fig.4.14 REE pattern for diamond POM1 48
Fig.415 REE patterns for kimberlite contaminated diamonds. 49
Fig.5,1 The carbonate line. 51

xiii
‘ Fig.5.2 5 ^ c values for Finsch and Premier edogitic and peridotitic diamonds analysed in this work.
53
Fig.5.3 8* 3c values for V5inc;h and Premier edogitic and peridotitic diamonds analysed by Deines et al., (1984).
53
Fig.5.4 Cr/Sc ratios versus 813c 54
Fig.5.5 Au/Ir ratio versus S^C 55

"In many a diamond there is enclosed the clue to its own genesis.., Nature, in her infinite variety, has
given an individual character to every diamond. No two diamonds are exactly alike."
These are the words of A.N, Wilson in his book Diamonds: from Birth to Eternity. His first statement
sums up the reason for this and many other research projects being conducted on diamonds and the
specks, spots, smears and separate mineral phases (the clues) frequently encountered in them. These
imperfections or impurities are elemental and mineral inclusions believed by most geoscientists to be
incorporated into the diamond during its genesis in the mantle. Diamond inclusions have been
investigated by various, modem analytical techniques (for XRD see Futergendler, 1956; electron
microprobss see Meyer and Boyd, 1972; ion microprobe see Hervig et al. 1980a; proton microprobe
see Griffen et al. 1988; and neutron activation analysis see Fesq et al. 1975) with the intention of
unraveling the clues held so tightly in the strongly bonded carbon atoms.
Over the past three decades this has become a highly specialized branch of geochemistry, as diamonds
are not merely beautiful gems, they also have great scientific and industrial value. One of the reasons
for their scientific value stems from the fact that they are mantle minerals and thus diamonds can also
be viewed as clues to the composition of the mantle. Diamonds and their inclusions provide direct
information about the mineralogical and chemical properties of the mantle and processes which have
operated therein. They are believed to be xenoctysts (foreign minerals) transported from the mantle to
the crust by kimberlites and lamproites (Meyer, 1985 & 1987; Richardson, 1989). Curiously, not all
kimberlitic rocks (collective term for kimberlites and lamproites) cany diamonds. Studies have shown
that kimberlites or related rocks which have not sampled potential diamond-bearing rock could not
possibly contain diamond (Clifford, 1970; Haggerty, 1986, Mitchell, 1986 and others).
Wilson's second statement about the uniqueness of each diamond is also very true, although
diamonds do show some broad similarities, and on the basis of these similarities diamonds can be
divided into groups and subgroups. For geochemists the most important division is according to
paragenesis or inclusion mineralogy. There are two main parageneses in diamonds, that is, diamonds
‘ --

occur in two main mineral associations or rock-types. Peridotitic diamonds are older (3.2-3.3 Ga:
Richardson et al„ 1984; Richardson, 1986) and crystallized in ultramafic mantle-rocks such as
harzburgites and Iherzolites at temperatures which are generally below the subsolidus (Boyd and
Gurney, 1986) while eclogitic diPMonds are relatively younger (90Ma-1.6Ga: Smith et al., 1991) and
crystallized in basaltic mantle-rocks at temperatures that are predominantly above the subsolidus
(Boyd and Gurney, 1986).
The most common is the peridotitic paragenesis in which minerals included in diamond are invariably
low Ca-chrome pyrope garnet, olivine, enstatite, chrome diopside, Mg-chromite and sulphide (Meyer
and Boyd, 1972). The eclogitic paragenesis is dominated by pyrope almandine, omphacitic
clinopyroxene and sulphide, although kyanite, rutile and coesite may also occur (Meyer and Boyd,
1972). It is important to note that sulphides are found in both parageneses but to date the differences
between sulphides that occur in eclogitic diamonds and those that occur in peridotitic diamonds have
not been established (note that the Fe/Fe+Ni ratio used by Haggerty, 1991 to distinguish between
sulphide inclusions of the 2 parageneses, does not hold for all the diamonds studied and so does not
have a universal application). It is certain, though, that sulphide inclusions are much more abundant in
eclogitic diamonds and this off-course has important genetic implications (Haggerty, 1986 and 1994).
Besides the mineralogical differences there are also chemical differences between the two parageneses:
the major elements in diamonds and their inclusions have been analyzed extensively by electron and
proton microprobes. The emphasis in this study is to quantify the trace element differences between
the two populations.
Diamonds from different mines and geographical locations also have characteristic mineralogical and
geochemical features. For instance, diamonds from a particular mine m y have a distinctive carbon
isotope range (e.g., Sloan in Colorado: Otter, 1989). Likewise, they may have distinctive chemistries
e.g., significant boron in Premier diamonds (Erasmus et al., 1977) and predomination of a particular
paragenesis e.g., 90% eclogitic diamonds at Argyle and 99% peridotitic diamonds at Liaoning and
Shandong in China (Meyer, 1987). The differences in the diamonds from the different areas has been
attributed to the heterogeneity of the mantle (Wilson, 1982; Gurney, 1990). In this project diamonds
from Brazil, Colorado, South Africa and China are compared and contrasted and although the sample
size is small the data can also provide information on the variation of mantle chemistry below these
geographical locations.
Diamonds do occur in a variety of colours: colourless, yellow, brown, green, blue, black and pink.
Colouration in diamonds is taken as evidence that impurities have been incorporated into the diamond
structure on an atomic scale (Wilks and Wilks, 1991), Nitrogen for instance gives diamonds a yellow
tinge while boron is responsible for a light blue hue (Erasmus et. al., 1977). The other colour
categories (except pink) are also studied in this work, to investigate whether they too can be correlated
with trace element content (note: only inclusion-free diamonds are suitable for this investigation).
Instrumental .neutron activation analysis (INAA) is an ideal technique to study the trace elements in
diamonds, since the carbon matrix is "transparent" to neutrons. Matrix effects are thus negligible and
allow for extreme sensitivities. Fesq et. al. (1975), in a significant contribution, used neutron
activation analysis to study the trace element chemistry of a large suite (1500 stones) of South African
diamonds. Their main conclusion was that the major contributor to the impurity of diamonds were the
mineral inclusions whether visible or submicroscopic. They referred to the submicroscopic inclusions
as "magma droplets". Although their work pioneered this type of study it did have two important
shortcomings: firstly, they analyzed their diamonds in packages of about ten stones and secondly,
they made no attempt to separate the diamonds into the eclogitic or peridotitic type parageneses. In
such a study the composition of diamonds are "averaged out."
Subsequent to the work of Fesq et. al., (1975) there has been vast improvements particularly in the
field of detector technology and computers. The improved efficiency and resolution of detectors and
advanced computer programs make it possible to analyze minute, single diamond crystals (> 0.01 mg)
for trace elements at the ppb and ppt levels.
In this project 61 inclusion-bearing and inclusion-free diamonds of both parageneses i.e., eclogitic
and peridotitic, have been analyzed by instrumental neutron activation analysis for up to 40 trace
elements. The data obtained has been used to distinguish the eclogitic and peridotitic parageneses
more comprehensively and to compare the trace element signature of diamonds from different
geographical locations and mines. Such a study would help to gain further insight into the chemistry
of the upper mantle and the environment of diamond genesis.

1; ANALYTICAL_ TE.CHNLQIIES,
4
1.1 INTRODUCTION TO NEUTRON ACTIVATION ANALYSIS (NAA).
Neutron Activation Analysis (NAA) is an analytical technique that involves the irradiation of sample
material with neutrons and the subsequent detection of the gamma rays emitted from the activated
nuclides of the elements that constitute the sample.
When a rock or mineral sample is irradiated with neutrons the naturally occurring stable isotopes of
most of the elements present in the sample are transformed into radioactive or unstable isotopes by
neutron capture reactions, The activated nucleus then decays with a characteristic half-life. Most
nuclides emit gamma rays at characteristic energies in the process of decay. This gamma radiation can
be measured and quantified. The amount of the radioactive nuclide is proportional to the intensity of
the characteristic gamma-ray peaks in the gamma spectrum. To measure the intensity of the gamma-
ray lines a gamma-ray detector and other associated instrumentation is used. This process is referred
to as gamma counting. NAA is a comparative technique and results are quantified by comparison to
standard reference material which is irradiated and counted together with the samples of interest.
There are two methods of NAA. One involves the extraction or isolation of a particular element (after
irradiation) from a complex spectrum of activities by a wet chemical procedure. This is called
radiochemical neutron activation analysis (RNAA), When there is no chemical processing and the
isotope in question is counted in the presence of all other induced activity the method is referred to as
instrumental neutron activation analysis (INAA),
1.2 IRRADIATION
A neutron source is necessary for NAA. Nuclear reactors are the most popular neutron sources
because their high neutron fluxes give the most intense irradiation which is essential for lower
detection limits of the required elements. The fission of 235U produces neutrons with energies too
high for NAA and they are therefore moderated by water which also serves to cool the reactor. The
moderated neutrons can be classified according to their energies into three groups:
a) thermal neutrons (0.001-0.05 eV),

b) epithermal neutrons (0.5-10 KeV) and
c) fast neutrons (>10 KeV).
The neutron flux decreases sharply from thermal to higher neutron energies. Usually thermal neutrons
are suitable for most geological materials, however epithermal neutrons are better for certain elements
such as As, Br, Rb, Sr, Sb, Ba, Ta and U (Steinnes, 1971; Koeberl, 1991). Interactions between the
neutrons and the target nuclei are dependent on the neutron flux. The probability of such an interaction
is termed the neutron capture cross-section (0) and varies from isotope to isotope. The larger the
neutron cross-section and the higher the neutron flux the greater the amount of neutron activation that
occurs. Elements with isotopes which have large cross sections e.g., Au and Ir are therefore more
suitable for analysis by NAA
1.3 PRINCIPLES OF NEUTRON ACTIVATION ANALYSIS.
The activation analysis equation (taken from Hoffman, 1992) for a radioisotope with a half-life of ti/2
i s : A~(kNWFa$/M) (irradiation term) (decay term) where,
A =measured activity of a radionuclide
k = proportionality constant (includes detection efficiency)
N - Avagadro's number (6.023 x 10²³ atoms/mole)
W = weight of an element (g)
F = natural fractional isotopic abundance of target isotope
M = atomic weight of an element
cr= nuclear reaction cross section cm2
0 = reactor neutron flux (n .cn rV 1)
irradiation term = [l-exp(-ATi)]
decay term=exp(-X7£i)
X = decay constant (ln2/*i/2) of the radioisotope
Ti = length of irradiation
Td a length of decay after irradiation

From the equation it can be deduced that NAA sensitivity can be increased by increasing the
following:
a) sample weight,
b) detection efficiency,
c) irradiation time,
d) neutron flux and
e) counting time.
After irradiation the samples and standards are counted sequentially, under similar conditions i.e,
with:
a) the same detector,
b) the same sample to detector distance and
c) identical counting time.
Hence, the activation equation can be simplified as follows:
Wsample = (Asample > Astandard) (Wstandard)> where W is the weight of the element of interest and A is
the measured decay-corrected activity.
1.4 INSTRUMENTATION.
The instrumentation for gamma-ray spectrometry consists basically of four main components:
1.4.1) a gamma detector, (see photo 1)
1.4.2) the electronic signal processing and amplification component, (see photo 2)
1.4.3) a multi-channel analyzer for storage of all measured signals and
1.4.4) a computer for data evaluation (see photo 3).
1.4*1 The detector used:’1 monster detector.1'
The Schonland High Purity Germanium (HPGe) Coaxial Detector System (affectionately called the
"monster detector") used in this study, has the following certified specifications and capabilities,
i) Total Active Volume: 190 cc
ii) High Voltage Bias: Positive 3500 v
6

iii) Resolution: 1.77 KeV
iv) Peak-to-compton ratio, 6OC0: 72
v) Efficiency: 40%
vi) Maximum count rate allowed: 10 000 counts/s.
Photo 1: Detector in the middle (silver in colour with black, circular sample holder)
within a lead cage (blue-grey).
1.4.2/3 Electronic signal processing, amplification and storage.
Voltage pulses from a detector are processed in a preamplifier, a spectroscopy amplifier and an
anolog-digital converter (ADC). The ADC converts the analog (voltage) signal into a digitized signal
which may be stored (as a single event) in a channel of the multi-channel analyzer (MCA), Many
gamma-ray interactions with the same energy create many events in the same channel and in this way
a gamma peak in the gamma spectrum is produced.
1.4.4 Data reduction.
The computer shown in photo 3 is used to perform data reduction and data evaluation. The Yule
computer program (Yule, 1968) is used for gamma peak analysis. Prior to peak areas in the samples
<1

being compared to peak areas in the standards, various corrections have to be made. Peak areas are
corrected for:
a) decay time,
b) counting time,
c) irradiation time and
d) neutron flux (usually thermal).
The concentration of an element (y) is calculated by the equation: Wt of element y in sample = (Wt of
element y in standard X peak area sample!peak area standard).
8
Photo 2: The electronics for gamma-ray counting.

1.5 NEUTRON ACTIVATION ANALYSIS IN DIAMONDS
The technique of neutron activation analysis is very suitable for the analysis of the trace element
chemistry of diamonds because the carbon matrix of diamond is not activated by neutrons, so there is
no interference from the matrix. Of the known 62 impurity elements found in diamond, it is possible
to analyze for a maximum of 55 by NAA (Sellschop, 1987). This includes the use of Fast Neutron
Activation Analysis, Instrumental Neutron Activation Analysis (both short-lived and long-lived
isotope work) and some wet chemistry. The most useful and simple method is Instrumental Neutron
Activation Analysis (INAA) which is the technique used in this project With the combination of
short-lived and long-lived isotope work a maximum of 43 elements can be analyzed by INAA. In this
study no quantitative short-lived isotope work was attempted.
Fesq et al., (1975) were the first to use neutron activation analysis on a large suite of diamonds. They
analyzed 1500 diamonds from 3 South African mines namely Premier, Finsch and Jagersfontein. At
the time when Fesq et al., (1975) did their work, detector technology (detector sensitivity and
efficiency for instance) was not good enough to detect trace elements in a single stone. Another
limitation was that standards for ultra-trace level analysis of single diamonds had not been developed.
Therefore, the diamonds were analyzed in packages of 10-25 stones (to form Ig samples) separated
on the basis of source, colour, presence/absence of inclusions, size and quality. In these diamond
packages Fesq et al., (1975) determined up to 44 elements by NAA. Since this work there has been
vast improvements in both detector technology and computers which resulted in improved detector
resolution and the speed of data reduction. In addition standards (see chapter 2) for the analysis of
single mineral crystals have been prepared and tested in this work, These developments together with
vast improvements in computers and software now allow for the quantitative analysis of single
diamond crystals.
1.5.1 Advantages of using NAA in the analysis of diamonds*
a) The technique is highly sensitive and multielemental. The lower limits of detection approach
the theoretical detection limits, chiefly because the carbon matrix of diamond is not activated
by neutrons. In diamonds with inclusions there is very low matrix effects from the major

elements such as Si, O, Mg, A1 and S because they either have very short half-lives of
minutes/seconds or they are not/poorly activated by neutrons.
Table 1.1 lists the lower lirr.'; of detection (LLOD) for the various elements that can be
analyzed in diamonds by INAA, The lowjr limits of detection for most elements in diamond are
up to 3 orders of magnitude lower than they are in other (geological material) matrices for
interference-free conditions Other factors contributing to the low limits of detection are:
i) The very long irradiation times used (128 hours).
ii) The high neutron fluxes of 2-3 x 10¹³ n,cnr2.S'1.
iii) The very long counting times of up to 24 hours.
iv) The high sensitivity and efficiency of the large volume HPGe detector.
b) Very small, single diamond ciystals can be analyzed. Samples as tiny as 0.01 carat or 2 mg
have been successfully analyzed.
c) The technique is non-destructive. Although diamonds are turned black by the heavy neutron
dose they can, nevertheless, be returned to their original colour by annealing them after
irradiation.
d) The activity produced in diamonds by neutron irradiation is generally very low and hence
radioactive diamonds pose no health risks to the researcher.
e) There are no depth restrictions since neutrons penetrate the entire diamond.
f) Samples are not put into solution prior to analysis.
g) Elements can be detected independent of the chemical form in which they exist.
1.5.2 Disadvantages of NAA in diamonds.
a) Neutrons are electrically neutral, so they seldomly collide with the carbon nuclei in the diamond.
Thus a neutron beam irradiates the whole diamond and not just the surface. Consequently,
neutrons sample the diamond matrix + inclusion and therefore one can never be certain of the
exact source of the impurities, However, this problem can be overcome by analyzing the
inc'usion and its diamond matrix separately. Furthermore, the technique does not yield
information on the distribution and chemical form in which a particular element exists.

I! iI
I J
11
b) If a neutron collides with a nucleus of a carbon atom, it is ejected from its position in the
lattice with enough energy to cause damage in the form of interstitials and vacancies, X-ray
measurements of the lattice spacing indicates that the damage produced by neutron irradiation
causes a slight expansion of the lattice for fluxes of the order of 1020 neutrons,cm-2
(Damask, 1958). The X-ray patterns also indicate that damage of this order may eventually
reduce the diamond to an amorphous state (Levy and Hammerer, 1955). The colour of the
diamond is changed initially to a dark green and finally to an unattractive black colour, With
high fluxes (1019 neutrons.cm"2) density of the diamond can be reduced by 2%.
c) There are no certified reference standards for the analysis of diamonds.
ELEMENT LLOD ELEMENT LLOD
Sc lppt Cu 100 ppb
Cr 0.3 ppb Zn 200 ppb
La 10 ppt Ag . 400 ppb
Ce 200ppt Sn ioppm .....Nd 300 ppb As 10 ppt
Sm <1 PPt . Sb 100 ppt
Eu 0.5 ppt Br 5 ppt
Gd i ppb . Ca 50 ppb
Tb 1 PPb .... Na 60 ppt
Ho 10 ppt K 10 ppb
Yb 30 ppt Ti 10 ppb
Lu lppt Mn 10 ppt
Au 0.2 ppt Ga 100 ppt
Ir 20 ppt Zr 100 ppb
Th 2 ppb Hf lppt
U 100 ppt Rb 1 ppb .......
Ni 100 ppb Sr 10 ppb
Co 1 PPb . ... Ba 500 ppt
Fe 200 ppb Cs 5 ppt ......
Ta 80 ppt W 500 ppt
* /'

1.6 OTHER NUCLEAR TECHNIQUES USED IN THE GEOCHEMICAL STUDY OF DIAMONDS.
Many other nuclear techniques are used to analyze for elements in diamonds at the trace and ultra-trace
levels. The main features, advantages and drawbacks of a few are listed below.
a) Rutherford Backscattering (RBS) is a multielemental, non-destructive and quantitative
technique. However, since it's a charged particle technique it cannot analyze the whole
diamond. The volume of the diamond that can be analyzed is totally dependent on the diameter
of the beam and the range of the charged particle in a diamond matrix. Furthermore, RBS
sensitivity for the light elements is very poor.
b) Similarly, Proton Induced X-ray Emission (PIXE) which is also multielemental, non
destructive and quantitative can be regarded as a surface or near-surface technique only. In
addition, PIXE is insensitive to the light elements (as with NAA),
c) For the light nuclides, element-specific Charged Particle Activation Analysis ( PAA) is used.
Nuclear reactions are chosen for the elements in question. Specific high energy beams are used
to induce the required reaction for the analysis of a particular dement Hydrogen, oxygen,
boron and nitrogen can be analyzed for in this way.
d) Mossbauer measurements are used for the analysis of iron in polycrystalline natural diamonds
such as carbonado, Stewartite and Framesite. Determination of iron content in single diamond
crystals is difficult because of the low concentrations (Bharuthram et al., 1991).
1.7 ANALYSIS OF DIAMONDS BY OTHER TECHNIQUES
1.7a Analysis by vaporization followed by mass spectrometry.
Diamonds are vaporized by heating them in a vacuum. Analyses are then performed with a mass
spectrometer. One variation of this technique is to vaporize a diamond by directing a beam of ions on
to a small area of the diamond to sputter off the surface atoms. The mass spectrometer is used to
measure the ratio of the electron charge on the sputtered ions to their mass. This ratio is then related to
a specific element.
12
fi

This method has been used extensively to measure N contents in inclusion free diamonds (Kaiser and
Bond, 1959). Nitrogen is the most abundant substitutional impurity in diamond. Nitrogen contents
range from 0-500 ppm (Bibby, 1982) and its mode of aggregation/substitution and concentration has
a marked effect on the physical properties of diamond such as colour, crystal shape and conductivity.
Carbon isotope ratios of diamonds i.e., 13c/12c (see chapter 5) are also measured in this way.
Diamonds (C) are vaporized in a vacuum by burning them in oxygen (02). The CO2 gas produced is
collected and the ratio of the two isotopes are measured in a mass spectrometer. Since the initial work
of Craig (1953) carbon isotopes of diamonds from various sources have been measured by many
other workers. The most noteworthy of these are Sobolev et al., (1979), Deines et al., (1984) and
Otter et al., (1991).
Another modification is the measurement of radiogenic isotopes in diamond inclusions for the purpose
of age dating. The Sm-Nd and Rb-Sr geochronological technique has been used (see Richardson et
al., 1984; Richardson, 1989; Smith et al., 1991) for the dating of garnet and pyroxene diamond
inclusions. Diamond inclusions are believed to be cogenetic (formed at the same time) with their
diamond host. Sm/Nd and Rb/Sr isotopic data (Richardson, 1984) yielded model ages of 3.2-3.3 Ga
for a combined sample of peridotitic, low-Ca chrome pyrope garnets hosted by Finsch kimberlite that
was erupted at 118 Ma. Edogitic garnet and clinopyroxene inclusions from Finsch and Kimberly pool
yielded proterozoic ages between 990 and 1580 Ma (Richardson, 1986). Smith at al. (1991) found
ages of between 1443-2408 Ma for single, large edogitic suite garnet inclusions from the Finsch
Mine.
1.7b Electron probe micro analysis (EPMA)
The electron microprobe has been used widely to analyze inclusions in diamonds (see review by
Meyer, 1987), Its use opened up a new and specialized field of geochemistry. It is now a well
established technique for in situ non-destructive analyses of the major and trace elements at
concentrations generally above 500 ppm. Elements such as P. Cr, Mn, Ca, Ni and Na have been

analyzed at trace levels by Hervig et al., (1980a, b). The detection limits in EPMA are seriously
affected by excessive background noise (bremsstralung).
By studying the chemistry of the various diamond inclusions, the early electron microprobe workers
concluded, that diamond inclusions were of generally, two distinct suites - an ultramafic suite and an
eclogitic one (Meyer and Boyd, 1972). This meant that diamonds formed in at least two distinct
geochemical environments.
1.7c Proton microprobe (Micro-PIXE)
The proton microprobe, introduced relatively recendy (see Griffen et al., 1988 and 1992) is an
effective technique for the analysis of small inclusions in diamond, for their trace element content.
With this technique detection limits for most elements are in the ?ower ppm range. The proton beam
employed for analysis may vary in diameter or beam spot size. For diamond inclusions a beam spot
size of a few microns is sufficient. If the energy of the protons is 20-50 MeV it is possible to look at
the L X-rays and K X-rays of medium and heavy elements allowing good resolution. In a valuable
contribution Griffen et al., (1988; 1992) analyzed forMn, Ni, Cu, Zn, Ga, Pb, Rb, Sr, Y, Zr, Nb,
Ta, Ba and Mo in eclogitic and peridotitic inclusions in West Australian diamonds by proton
microprobe.
The advantage of the proton microprobe is that it is possible (as with the electron microprobe) to
determine the distribution of trace elements ("in situ") in a crystal. In comparison to the electron
microprobe, the lower detection limits allows one to look at a specific grain and create an elemental-
composition map. The technique is generally used to analyze flat polished surfaces.
The disadvantage of the proton microprobe is that analysis is confined to a narrow depth of 50-100
microns from the crystal surface. Bulk composition, therefore, cannot be measured. In addition,
certain diamonds (e.g., some from Zaire and Sierra Leone) tend to have elemental zonation, while
many exhibit growth strata (Orlov, 1973). One has to be cognizant of the fact that this reflects changes
in conditions in the environment of diamond growth. A zonal distribution of inclusions and a decrease

in Fe content in olivines from the central areas to those in the periphery was recorded by Bulanova
(1991), Similarly some element/s (S and Fe-Ni-Co-Cu metal solvents?) present in the core of the
diamond may be depleted in the first 100 microns of the diamond and it is these elements that are more
important for the understanding of the genesis of the diamond for they act as seeds for diamond
nucleation.
Hence, to get a more realistic picture of the bulk composition of diamond (or diseqilibrium between
coexisting phases) by proton microprobe the progressive polishing technique as used by Bulanova
(1991) has to be used.
l,7d Ion microprobe
In tliis technique ion beams are used to sputter off layers of the diamond sample and analysis is then
done with the mass spectrometer. The ion microprobe may have better spatial resolution than the
proton microprobe (usually <l|i), but there are serious interference and calibration problems.
Hervig. et al., (1980a, b) analyzed for Li, Na, Ca, Sc, Ti and Co, by ion microprobe, in olivine and
orthopyroxene inclusions. Shimizu and Richardson (1987) obtained REE, Zn and Ti data from the
analysis of purple (G10) garnet inclusions. Their REE patterns for the garnets showed extreme LREE
enrichment and they suggested that this enrichment was introduced metasomatically.

2: M E T H O D O L O G Y
2.1 DIAMOND SELECTION
A total of 61 inclusion-bearing and inclusion-free diamonds were studied. Although most of the
diamonds were colourless, other colour categories e.g., yellow, brown, green and black were also
represented. The diamonds analyzed were between 0,01-0.5 carats (with inclusions of up to 600|xm)
and came from the following sources:
a) Seventeen from the Finsch Mine in the Northern Cape, South Africa.
b) Twenty from the Premier mine in Northern Transvaal, South Africa,
c) From Brazil there were nine from the Romario mine, two from the Arenapolis area and one
each from the Canastra and Boa Vista regions,
d) Eight from the George Creek mine in Colorado, United States of America.
e) Three from the Liaoning and Shandong Provinces in China.
A detailed description of each of the diamonds mentioned above is given in tables 2.1 to 2.11 in
Appendix: 1. Diamond descriptions were based on colour, inclusion type and morphology.
2.2 PREPARATION OF DIAMONDS FOR ANALYSIS.
Some of the diamonds analyzed in this study were of high quality and purity, hence their total level of
impurities (i.e., elements other than carbon) were often quite low (<lppm). It was therefore essential
to restrict any source of contamination for the analytical results obtained to be meaningful. In other
words, it is absolutely imperative that the gamma signal counted on the detector came from the body
of the diamond and not from any residual surface contamination. Therefore meticulous cleaning of the
diamond surface was necessary. Diamonds with large visible cracks had to be avoided because of the
obvious contamination problems associated with them, However many of the diamonds did have
micro-cracks and these certainly posed problems (discussed in chapter 4). Every diamond had to be
cleaned separately to prevent contamination. The following procedure was used before and after
neutron irradiation for each diamond:

a) The diamonds were first cleaned with dilute superdecontamine, in an ultrasonic-cleaner for 3
minutes, Any adhering material is dislodged by this process.
b) Diamonds were then rinsed in distilled water,
c) They were then boiled in a concentrated mixture of HNO3, HCIO4 and H2SO4 for one hour.
This period was found to be necessaiy to remove kimberlite or other residual contamination
from the micro-cracks which can be many microns deep. Although the acids used were of
analytical grade, it is still possible that a few ppb's of Br detected in some diamonds could have
come from HCIO4,
d) Distilled water is used to flush out the acid + contamination. This process is repeated several
times until there is no visible trace of acid in the water.
f) The diamonds were air-dried and weighed (in grams correct to 5 decimal places).
2.3 STANDARDIZATION
In order to quantify the trace element data in single diamond crystals, it was essential to develop
suitable standard reference material with trace element concentrations that are comparable to diamond,
Three options were consider'd:
i) diluting rock standards in a carbon matrix.
ii) using very small masses (few jo.g) of rock standards or
iii) preparing liquid standards by adding known quantities of trace elements to a suitable liquid.
The last option was difficult in that it required the pipetting of extremely low concentrations of mote
than 40 elements. Since the first two options involved existing certified standards, it was decided they
would be implemented.
2,3.1 Diluting rock standards.
This method involved reducing the concentrations of elements in certified rock standards by "solid
dilution." Specpure graphite was used to dilute several rock standards: PTOl, NEM-1, NIM-L, NIM-
P and NIM-N (Mintek certified rock standards). Graphite was chosen because as is the case with
diamond the carbon matrix is not activated by neutrons. So the activities produced after irradiation are
low and comparable to diamond. This enables the researcher to count irradiated diamonds and the

standards after a short cooling period. Various ratios of graphite to rock standards were tried. In this
study it was found that a 1:50 mixture of PTOl to graphite, a 1:50 mixture of NEM-1 to graphite, a
1:90 mixture of NIM-G to graphite and a 1:90 mixture of NIM-L to graphite were the most suitable.
The standards were chosen to cover the broad range of elements sought. PTOl was more suitable for
the siderophile and chalcophile elements, NEM-1 for Br, As, W, Sb, and both NIM-G and NIM-L
for the other lithophile elements. The concentrations of most elements in the diluted standards were
found to be ideal for diamonds with silicate inclusions.
Large volumes of these mixed standards were analyzed both at the Schonland Research Centre,
University of the Witwatersrand and at the Institute of Geochemistry, University of Vienna. The
interlaboratory comparisons and replica analyses (for PTOl the most problematic standard in terms of
inhomogeneity - see table 2.12 in Appendix:2) provide a measure of the accuracy and precision of the
analyses. Note that there are significant differences between the Schonland value and the Vienna value
for some of the lithophile elements, viz., Br, Sc, Ba and Eu. The Sc value, because of its importance
in the study, was rechecked several times. In most cases (see table 2.13: Appendix:2) the Schonland
values were used because of their better reproducibility. However, it is important to note that for the
lithophile elements, the NIM-G, NIM-L and NEM-1 standard values provided better calibration
curves. In essence the PTO-1 values given, represent the extreme case or "worst case scenario' for the
lithophile elements. PTO-1 was used chiefly for the siderophile elements i.e., Au and Ir, the
chalcophile elements and Cr.
Furthermore, note that the absolute concentrations for Cr and Sc in the standards are not of critical
importance in this study because deductions (see chapter 4) are made from the ratio of the 2 elements
and not from their absolute values.
The basic problem encountered was that of inhomogeneity of the standards which is further
compounded for ultra-trace level analyses. This problem was overcome to a certain extent by using
standards in triplicate. The concentrations of the various elements in the graphite standards are given
in table 2.13 of Appendix:2.

2.3.2 Using microgram masses of roc!: standards.
The other method of rendering standard reference material comparable to diamond is to reduce the
masses proportionately, With this method ±Ji |ig of the rock standards AUende Meteorite and G2 are
used. Each standard is prepared in triplicate to reduce inhomogeneity problems. Such small masses
are used so that the activities produced after irradiation are low and similar to that produced in
irradiated diamonds. Measurements of the masses need to be done with care and must be correct to 5
decimal places because of the very small quantities used. This method was found to be as good as the
graphite-diluted standard method but handling such small masses proved to be quite a challenge,
2.4 PREPARATION OF QUARTZ IRRADIATION-VIALS.
High purity quartz vials are prepared for the diamonds and standard reference material. Extreme care
is taken in ensuring that the vials are clean before inserting samples in them. Weighed diamonds and
standards are heat-sealed in the quartz vials as shown in Fig.2.1. Note that each diamond and
standard is encapsulated in the smaller, inner quartz vial, The larger, outside vial serves to protect the
inner vials from any contamination that may be picked up in 'he reactor and also to isolate the
sample/standard from the Fe-Ta wire, flux monitor which accompanies each sample. Furthermore, if
the outer vials are broken in the reactor, the diamonds remain safe and uncontaminated.
Fig. 2.1 Quartz vials for irradiation., r ~ \
Actual Size , ^
r \
/ -r \
■ O uter Quartz Vial
M onitor
Inner Quartz Vial
N ' ' 1 ^ 7 7 ------ Diamond
* Note; Standards are also seated in a simitar manner in the small inner quartz vials,

2.5 IRRADIATION
Samples were wrapped in aluminium foil (to keep the samples together in case of breakage) and
placed in aluminium rabbits for irradiation. The samples were irradiated in the 5 MW capacity, Oak
Ridge-type Research Reactor at Pelindaba. Since a high neutron flux and a long irradiation period
were needed, the samples were irradiated for 128 hours in the Poolside Facility of the reuctor which
has a neutron dose of about 2 x 10^ N.cnr^/s. To fit in with the schedule of the Pelindaba Research
Reactor the following procedure was used:
a) Irradiation for 5 days (this activates the long and short-lived isotopes).
b) Cooling for 2 days (the reactor is not operational during weekends).
c) Irradiation again for 32 hours (this relatively short burst is necessary to reactivate the short-lived
isotopes after the 2 day cooling period).
d) Cooling for 15 hours (this includes the necessary cooling period after removal from the reactor and
the traveling time back to the laboratory at Schonland Centre),
2.6 POST IRRADIATION PREPARATION.
After cooling for 15 hours the samples are brought back to Schonland Centre and are prepared for
counting. The procedure is as follows:
a) Each aluminium parcel is opened up within a large lead cage and the activity of the parcel and
damage or loss (if any) is recorded.
b) The vials are then cleaned in a succession of liquids i.e., dilute superdecontamine, dilute HC1,
water and acetone (see Fig,2,2). This is done to remove radioactivity and other contamination
from the outsides of the vials.
c) The outer vials are then cut open, carefully, with a tungsten carbide-knife and the diamond or
standard and monitor are removed. In the case of the diamond-bearing vials - both vials are cut
open and the diamond crystal is removed to be boiled later in acid for 30 minutes, A further
modification was to cut open the quartz vials (containing the irradiated standards) and put the
active standard material in a small polyethylene vial for counting (reweighing is essential since
20

all the material cannot be transferred). This modification was necessary because irradiated
quartz vials contribute certain elements such as Na, Ce, Br and K.
d) Monitor wires are cleaned in superdecontamine, water and acetone but not in HC1 (see Fig.2.2),
Each monitor is then inserted in separate high purity, polyethylene counting bottles which have
foam inserts to ensure constant counting geometry,
e) After the irradiated diamonds are cleaned, they are placed in the centre of a small polyethylene
vial for counting.
Photo 4: Quartz vials and counting vials.
Fig.2.2,Liquids used to dean miarta vials_and.monitor.wires.
Monltor+vial Vial only
& mJQ
w
Monitor+vial Monitor+vlal
f i n
te

2.7 COUNTING
The samples are counted 17 hours, 3 days, 12 days and 30 days after irradiation, This is to ensure the
best statistics for the medium and long lived isotopes (see tables 2.14-2.18 in Appendix:3). Diamonds
and their accompanying standards are counted at the detector head for maximum efficiency. Relative
neutron flux factors are obtained by counting monitors wires about 2 weeks after irradiation.
2.7.1 Count 1 ■
This count is performed at approximately 17 hours to 1,5 days after irradiation, Each sample is
counted for 10 000 seconds each. A maximum of 18 isotopes can be processed, from this count (see
table 2.14 in Appendix :3). Note that important elements such as Ca, K, Mn and Cu which have short
half-lives can decay before or during this count, if the samples are not counted in time (designated as
N/A in tables 3.1-3,8 in Appendix:4).
2.7.2 Count 2
Count 2 is usually done 2-5 days after irradiation and each sample is counted for 3 hours each.
Twenty one isotopes can be processed from this count. Table 2.15 (of Appendix:3) lists the isotopes
for count 2. Only the main peaks are listed in the tables. It is assumed that these peaks are
interference-free. However, interferences occur often. In this case alternate peaks are chosen or
interference corrections are applied.
2.7.3 Count 3.
Count 3 is performed 10-15 days after irradiation. Depending on the activity of the samples each
diamond and standard is counted for 6 or 12 hours. Essentially, only 6 isotopes are processed from
this count (see table 2.16 of Appendix;3), but some isotopes from the first and third counts can be
included in this count as a check,
2.7.4 Count 4/S
This count is done 30-40 days after* irradiation for the long-lived isotopes. The diamonds and the
standards are counted for 24 hours each. Most of the 24 isotopes listed in table 2.19 (of Appendix:3)
can be counted at a later date in a fourth count to improve counting statistics.
22

2.7.5 Count S
This count is not always necessary, It is done 70-10U days after irradiation to improve counting
statistics for the long-lived isotopes and sometimes to eliminate interferences from medium-lived
isotopes (see table 2.20 of Appendix:3). Samples are counted for a duration of 48 hours each.
2.7.6 Monitor count.
The monitor wires are counted about 2 weeks after irradiation. They need to be counted for 20
minutes each only, Ta-182 peaks are used to measure the neutron flux (see table 2.17 of Appendix:3),
The counts for these peaks are ratioed and averaged for each sample to give a flux factor. These flux
factors are entered in the computer files that were created for the samples. The spectra are then
reprocessed by the computer (the counts for every isotope in each spectrum are divided by the flux
factor).
2.8 Short-lived isotope work.
Many significant elements have short-lived radioactive isotopes. These are radioactive isotopes with
half-lives of seconds and minutes. Some important short-lived isotopes are given in table 2.18 (of
Appendix:3). As a result of the very short half-lives, counting has to take place at the irradiation site.
The reactor at Pelindaba has a remote facility for irradiations of such a nature. Only qualitative short
lived isotope work was attempted. Single diamond-crystal analysis for short-lived isotopes is
complicated by a number of factors. For short-lived isotopes, irradiations are usually of 10 minute
duration and cooling time is one minute. These short irradiations do not produce enough activity in
diamonds, There are a few reasons for this, Firstly, because of the carbon matrix, purity and small
size of the diamonds, Secondly, most of the short-lived radionuclides do not have large neutron
cross-sections. Furthermore, the portal'1'*, detector used for such experiments is a low energy detector.
This means that it is suitable only for those elements which have significant peaks in the energy region
between 60 and 400 KeV, The portable detector is also less efficient, less sensitive and has a smaller
volume than the monster detector, Consequently, apart from Ti-51 none of the short-lived isotopes
can be detected at reasonable counting errors. The only way enough activity can be produced from
small, single diamond crystals is by cyclic counting, This involves repeated sequences of irradiation
23

24
and counting until enough counts have been accumulated for the isotope to be detectable at acceptable
counting statistics. Cyclic counting was not implemented in this study.
i

3: ANALYTICAL RESULTS FOR SINGLE _PIAMOND_C£YgXAL&
25
The geochemistry of 61 diamonds investigated in this study is presented in tables 3.1 to 3.8 in
Appendix:4. The concentrations of the elements detected in the diamonds are given in ppb, unless
otherwise stated. This means that the concentrations of the elements are given in parts per billion by
weight (ppbw) of the diamond matrix + inclusion, hence, the absolute concentration of an element that
occurs in an inclusion is diluted by the diamond matrix. The concentrations of the elements in the
large inclusions themselves were calculated to be up to 20 000 times higher than that reported for the
diamond matrix + inclusion. Consequently, in most cases, conclusions are drawn from ratios rather
than absolute abundances. In this study the diamonds range in weight from 0.01-0.5 carats (see tables
2.1-2.11 of Appendix: 1) and the inclusions are generally less than 600 microns in size. The size,
number and nature of the inclusions are the most important factors affecting the concentration of
elements in a diamond.
The data given in the tables includes diamonds of both parageneses, many of which contain inclusions
of silicate or sulphide or both. The colour of the different inclusions are distinctive allowing one to
make rough estimations of their major element composition as well as reasonably accurate estimation
of their paragenesis i e., either edogitic or peridotitic. Edogitic diamonds are characterized by orange
garnets which have high Fe, Mn, Na and Ca but low Cr and pale green, omphacitic clinopyroxene
which have high Ca and Na but low Cr, Peridotitic diamonds are characterized by purple garnets
having high Cr and Mg but low Ca and emerald green chrome diopsides which are characterized by
high Cr and Ca. Olivine and enstatite which are distinguished by high Mg and moderate Cr are usudly
colourless and are peridotitic (Meyer and Boyd, 1972; Hervig et al. 1980; Gurney, 1985; Meyer,
1987; McCandless & Gurney, 1989).
3.0 RESULTS
Analytical results for the diamonds are grouped here, according to region and diamonds with silicate
inclusions are handled separately from those with sulphide inclusions. Note that in all the diamonds
analyzed, i.e., both peridotitic and edogitic diamonds, there are positive correlations between the
elements Cr, Fe, Ni, and Co. The concentrations of these elements vary widely but the highest
concentrations (except for Fe concentrations) are found in the diamonds with peridotitic, purple
garnets. The highest Fe concentrations are found in eclogitic, orange garnet inclusions.
Eclogitic diamonds are characterized by relatively low Cr concentrations of between <1 and 9510 ppb.
Their Sc concentrations are similar to those for peridotitic diamonds i.e., between 0,2 to 447ppb.
Thus their Cr/Sc concentrations are low and range from <1 to 43. Eclogitic diamonds are relatively
enriched in Fe, Na, Mn, Ca, K, HREE, Ga and Au.
The peridotitic diamonds are characterized by higher Cr concentrations of between 71 and 131745
ppb. Sc concentrations in these diamonds are between 0,3 to 377ppb and are within the range for the
eclogitic diamonds. This gives these diamonds much higher Cr/Sc ratios of between 174-10773.
Peridotitic diamonds are also relatively enriched in Ni, Co, LREE and Ir.
3.1 FINSCH DIAMONDS
3.1.1 FINSCH DIAMONDS WITH SILICATE INCLUSIONS.
The diamonds with orange (eclogitic) garnet inclusions (FOG1&FOG2) have Cr values of 463-1201
ppb and Sc values of 66-132 ppb (see table 3.1 of Appendix:4). Their Cr/Sc ratios are relatively
constant i.e., between 7 and 11. The diamond with omphacitic (eclogitic) clinopyroxene inclusions
has higher Cr (2929 ppb) while its Sc value (68.7 ppb) is comparable to orange garnets. This gives
the diamond a much higher Cr/Sc ratio of 42.6. The diamonds with purple (peridotitic) garnet
inclusions (FPG1-FPG5) have the highest Cr values ranging from 22319 to 131745 ppb. Scandium
values are also fairly high (67-357 ppb). Their Cr/Sc ratios are greater than 100,
The diamonds with orange garnet inclusions have an order of magnitude more Mu than the purple
garnets and it is known that the orange colour of the garnets is caused by Mn2+ ions in distorted cubic
coordination (Manning, 1967a). There is a positive correlation between Fe and Mn in all garnet
inclusions, In two diamonds with purple garnet inclusions (FPG1&FPG5), the chalcophile elements
W and As were detected. These elements are rare in diamonds without visible sulphide inclusions.
3.1.2 FINSCH DIAMONDS WITH SULPHIDE INCLUSIONS.
There are positive correlations between the chalcophile elements Fe, Ni, Co, Sb and W in the
diamonds containing sulphide inclusions (FS1 & FS2, see table 3.2 of Appendix:4) The Fe/Fe+Ni
ratios of both diamonds are similar i.e, 0.92 and 0.91 respectively. Au and Ir were detected in
diamond FS2 only. The presence of elements such as Na, Cs, LREE, Th, Ba and Hf which are not
expected to be found in sulphide minerals may be taken as evidence for the presence of kimberlite
contamination in these diamonds. FS1 has higher Cr, Sc, Ta, Br, Cs and Na concentrations but lower
La, Ce and Ba concentrations than FS2,
Submicroscopic silicate inclusions could be the source for Cr and Sc, This enables one to determine
their paragenesis. As discussed above, diamonds with Cr/Sc ratios below 50 are eclogitic and those
with Cr/Sc ratios above 100 are peridotitic. It follows then that FS1 is probably eclogitic
(C r /^ ^ 5 .5) while FS2 may be peridotitic (Cr/Sc=190).
3.1.3 *HCLUSION-FREE FINSCH DIAMONDS
Although diamonds FIF1-FIF6 have no visible inclusions they still contain detectable Cr, Sc, Ni, Co,
Fe, W, Na and Au (see table 3.2 of Appendix:4). This suggests the possibility of submicroscopic
inclusions (Fesq et al„ 1975). The presence of detectable Au in FIF1'FIF3 is also noteworthy. The
concentrations of Na, Cr, Sc, W, Co and Ni in FIF1-FIF4 are low. There is a marked difference in
the concentrations of these elements in diamonds FEF5 & FIF6, when compared to FEF1-FIF4. They
have higher Cr, K, Ca, Fe and Ni contents. Diamonds FIF5 and FEF6 are fragments that remained
after omphacite and orange garnet inclusions were removed, from large diamonds, for dating of single
inclusions (see Smith et al., 1991). Therefore the higher concentrations of the lithophile elements
suggests that traces of the large inclusions (that were removed) remain in the diamond. These
diamonds still retain their eclogitic character, as their Cr/Sc ratios are below 50. Diamonds FIF1-
F1F4 have low Cr and Sc values and should therefore be eclogitic.
FBI, the black Finsch diamond, is characterized by very high La, Ce, Na, Cr and Fe, but moderate
concentrations of HREE, Sc, Co, Ni Au and Ir. The chemistry of "black" diamonds is easily
distinguishable from that of other diamonds because of the large number and high concentrations of

2.8
elements detected in them. More than 25 elements were detected in this diamond. The black colour is
not a body colour and is probably due to the intensity of submicroscopic inclusions and graphite. The
presence of Au and Ir suggests that some submicroscopic inclusions may be sulphides. FBI has a
Cr/Sc ratio of 41 (a ratio typical of all diamonds with eclogitic elinopyroxene inclusions discussed
thus far) which implies that besides the sulphide inclusions, the diamond is dominated by oinphacitic
elinopyroxene inclusions. This accounts, also, for the high Na, LREE, and Cr contents,
3.2 PREMIER DIAMONDS
3.2.1 PREMIER DIAMONDS WITH SILICATE INCLUSIONS.
Diamond POM1 (see table 3.3 of Appendix,’4) has high Ca, Na, Sc and Fe and moderate
concentrations of REE, Cr, Sc, Ni and Co, which is typical of diamonds with omphacitic
elinopyroxene inclusions. POM2 has high Na, K, Ni and Fe and moderate concentrations of LREE,
Cr, Sc and Co. In this diamond Ca was not analyzed. Diamond POC1 has the highest Ca and Fe of all
the diamonds studied. This is consistent with the diamond having orange garnet and omphacitic,
elinopyroxene inclusions. The concentrations of Na, K, Cr, Sc, Ni and Co are moderate in
comparison to Fe and Ca.
The diamonds with peridotitic pyroxene inclusions (PCI & PC2) have similar inter-element ratios.
They include Co/Ni (-0.08), Ni/Fe (-0.03), Sc/Fe (-0.0001), Ca/Fe (-0.002) and Na/K (-11.5).
However, diamond PC2 is characterized by LREE-enrichment, high Ca, Cr, Na and K, moderate Ni
and Co but low Sc. This is typical for diamonds with chrome diopside inclusions. PCI differs in that
it has a lower concentration of REE, Na and K. The diamond has a high Cr content but its Sc
concentration is low, These features are characteristic of diamonds with enstatite inclusions. Diamond
PPG1 has visible purple garnet inclusions and this accounts for its high Cr, Fe and Ni, LREE-
enrichment and low Ca, Au and Ir are also present and this together with high Ni leads one to interpret
that sulphide inclusion/s may be present in this diamond, as well.
Although the Cr and Sc values vary in diamonds POM1 and POM2, their Cr/Sc ratios are nearly the
same (±.40) and are distinctive of diamonds with omphacitic elinopyroxene inclusions. Sample POC1
which has been described as having visible orange garnet inclusions as well as an omphacitic

clinopyroxene inclusion has a Cr/Sc ratio of 7. This indicates that the chemistry of the diamond is
dominated by the orange garnet inclusions. The Cr/Sc ratios of PCI (743) and PC2 (10773) are
higher than those of the rest of the diamonds in this study and are typical of diamonds with peridotitic
pyroxene inclusions. The extremely high Cr/Sc ratio of PC2 may suggest the presence of chrome
spinel inclusions in addition to the chrome diopside inclusion in this diamond, Such extreme Cr/Sc
ratios are distinctive of chrome spinels. The ratio rarely exceeds 1000 in chrome diopside. Diamond
PPG1 with purple garnet inclusions has a Cr/Sc ratio of 276 which is comparable to other diamonds
with purple garnet inclusions, such as the Finsch diamonds (Cr/Sc: 174-410) discussed above.
3.2.3 PREMIER DIAMONDS WITH SULPHIDE INCLUSIONS.
Diamond PS1 (see table 3.4 of Appendix:4) is characterized by high Fe and moderate Co but no
detectable Ni. PS2 is distinguished by high Fe, moderate Ni and low Co. PS3 has high Fe, Ni, Co
and Cu. PS4 also has high Fe, Ni and Cu. Diamonds PS5 and PS6 contain moderate Fe and Ni but
low Co. The ratios of the elements Fe, Ni, Co and Cu indicate that the sulphide inclusions are
probably Fe-Ni-Cu sulphides such as monosulphide solid solution (Mss=FeNi(i.x)S: probably PS2,
PS5 andPS6), pyrrhotite (Fei-xS: probably PS1), cubanite (FeCu2S3) +Mss (PS3 probably) and
pyrrhotite + pentlandite (FeNigSs: probably PS4). Au concentrations, detected in diamonds PS1-PS5
are between 0.1 and 0.9 ppb. Ir was aslo detected in the same diamonds and ranged from 0.024 -0.25
ppb. The most striking feature of the data for these diamonds is the fairly constant Au/Ir ratios which
are between 3.6 and 4.3 (see Fig. 4.3). All the diamonds have low concentrations of Na, Cr and Sc.
In diamond PS1 moderate amounts of LREE and HREE were detected but moderate amounts of
LREE only, were detected in diamonds PS2, PS4, PS5 and PS6. No REE were detected in PS3. A
relatively high concentration of Ca was detected in PS5 while the other diamonds have much lower Ca
contents.
Diamond PS4 has a Cr/Sc ratio of 35 (once again a value indicative of diamonds with eclogitic
clinopyroxene inclusions). This suggests that it probably has submicroscopic, omphacitic
clinopyroxene inclusions together with its visible sulphide inclusion. The other diamonds (PS1, PS2
and PS5) have very low Cr/Sc ratios which seem to be typical for eclogitic diamonds with large,
visible, sulphide inclusions.
3.2.4 INCLUSION-FREE PREMIER DIAMONDS.
Five brown, inclusion-free diamonds were analyzed for the sole purpose of attempting to correlate
trace element chemistry to their brown colour. However, besides some negligible concentrations of Fe
and Co, only Na values are worth reporting. Na values are moderate and vary from 3.44 to 87.6 ppb.
Whether the Na is responsible for the brown colour cannot be ascertained at this stage.
In the yellow, inclusion-free Premier diamonds only 3 elements are noteworthy of mention i.e., Na,
Co and Ni. AH three diamonds have only a few ppb of Na. Iridium (0.35 ppb) was detected in
diamond PYB and is accompanied by 17 ppb Co and 247 ppb Ni. Diamonds PYS and PCY are quite
similar. They have approximately the same Na (2-3ppb), Co (0.5-0.6 ppb) and Ni (24-32 ppb)
concentrations.
3.3 BRAZILIAN DIAMONDS
With the exception of D4 and D6 (which have unidentified colourless inclusions) the diamonds from
Romaria (see table 3.5 of Appendix:4) have no visible inclusions. They are however, very "messy"
diamonds which have spots (possibly due to radiation damage since, U and Th are present in some
diamonds) and graphite along planes. The diamonds are rich in lithophile elements especially LREE
and Na. This could be due to kimberlite/alluvial contamination because no suitable host minerals were
recognized in the diamonds. The presence of Ba, Cs, Hf and Th in some diamonds also support this
suggestion. Au was detected in all these Brazilian diamonds and ranges from 0.0004 to 13.5 ppb. The
Values of 13.5 ppb (D9) and 9 ppb (D7) are the highest detected in the diamonds studied. It is
possible that the diamonds could have subinicroscopic sulphide inclusions hosting the Au, which is
corroborated by the presence of other chalcophile elements i.e., Sb, W and As. Low concentrations of
As and Br are common in these diamonds, Cr and Sc were detected in only 3 diamonds from Romaria
(D7, D8 and D10) which yield low Cr/Sc ratios indicating that the diamonds are eclogitic.
The Brazilian diamonds with sulphide inclusions (table 3.6 of Appendix:4) have moderate (in
Al&Bl) to high (in A2&C1) concentrations of Fe and Ni. The Co values are low in all the diamonds.
Au values are lower (0.02-0.16 ppb) than those for the Premier diamonds but the Ir concentrations are
significantly higher (0.4-5.33 ppb). Au/Ir ratios are low and range from 0.01 to 0.1 (refer to Fig.
4.3). Note that the ratio of 0.01 attained for A2 is the lowest measured in this study. Cu was detected
in Cl, the diamond with highest Fe, Ni and Co concentrations of the 4 diamonds. As was detected in
all 4 diamonds and ranged from 0.13-0.25 ppb. The 4 diamonds have moderate amounts of Na and K
and are enriched in LREE, Cr concentrations are also moderate but Sc values are low. The presence of
Zr (6470 ppb in Cl), Hf (in Cl) and Ba (in A2&C1) may be indicative of contamination from the
kimberlite/sediment as this is an alluvial diamond. The Zr/Hf ratio is very high and is not kimberlitic.
Note that (with the exception of Al from Arenapolis) there are positive correlations between the
elements Fe, Ni, Co, Cr, Au. Diamond Al does not show these correlations probably because it has a
peridotitic olivine inclusion in addition to its large sulphide inclusion. The chemistry of these
diamonds with sulphide inclusions is dominated by Fe, Ni, Ca, Ir and As in order of decreasing
abundance.
The Cr/Sc ratios of all four diamonds (Al, A2, Cl and Bl) are greater than 100 (196-1157) which
suggests that they are peridotitic. The olivine inclusion in Al supports this statement. The essential
difference between the Brazilian diamonds with sulphide inclusions and the Premier diamonds with
sulphide inclusions, discussed above, is one of paragenesis. The Premier diamonds have Cr/Sc ratios
that are less than 50, so they are eclogitic (see Fig. 4.8). The Brazilian diamonds, as mentioned
above, have Cr/Sc ratios that are much greater than 100 and are thus peridotitic (see Fig. 4.8).
3.4 DIAMONDS FROM GEORGE CREEK, COLORADO
The data for the George Creek diamonds is given in table 3.7 of Appendix:4, GC1, the dark green
almost black diamond, has very high REE, Na, Ba and Fe contents, As with all black diamonds
analyzed, the intensity and variety of the impurities is distinctive. There are no Visible inclusions in
this diamond, therefore impurities are probably the result of the presence of submicroscopic
inclusions or tiny inclusions masked by the green-black colour. The diamond has the highest U and

Til detected in these diamonds. The presence of radioactive elements U and Th (which are rare
elements in diamonds) could possibly be partly responsible for the dark green colour, through
radiation damage. GC2, the honey brown diamond, has moderate Fe, Ni, Co, Cr and Na
concentrations. Its brown colour cannot be correlated with any specific element. GC3 which is a
messy diamond with altered inclusions and graphite along planes is also rich in REE, Na, Ba and Fe
and is similar to GC1, although the concentrations of these elements are lower in GC3. The similarity
in the impurities (especially the presence of Ba in both diamonds) evokes the suspicion that the
impurities are possibly kimberlite contamination, introduced into the diamond through micro-cracks.
GC5, the blue-green, inclusion-free diamond has moderate levels of Na, Cr, Fe, Ni and Co
concentrations, GC6 is a gem quality diamond and this is reflected in the almost total absence of
impurities. Only low concentrations of Na and Co are present in this diamond. In diamond GC7 (a
yellow-green, inclusion-free diamond), moderate amounts of only Fe, Ni and Co were detected. The
impurity elements in GC8 (low concentrations of La, Sm, Na and Co) may be due chiefly to the
secondary material which was observed in the diamond. GC9 which has an altered (mica) inclusion
possesses moderate Fe, Ni and Co concentrations that are very similar to GC7.
Diamonds GC1, GC3 and GC9 have low i.e., eclogitic Cr/Sc ratios. GC5 which may have a sulphide
inclusion has a Cr/Sc ratio of 144. This ratio suggests that submicroscopic chrome pyrope inclusions
may be present as well and that the diamond is peridotitic.
3.5 CHINESE DIAMONDS
The diamonds from Liaoning CHJ2 and CHJ17 (see table 3.8 of Appendix:4) share some similarities.
They have roughly the same amounts of Na, Sc and Fe but they differ in their Co and Ni
concentrations. Note also that the diamoiid with the higher Ni and Co concentrations (CHJ17) has
detectable Ir (0.13 ppb), while CHJ2 with lower Co and Ni has detectable Au. Only small
concentrations of Na, Co and Sc were detected in diamond CHA36 from Shandong,
32

The most noteworthy aspects of the data reported in chapter 3, in order of decreasing importance, are
the Cr/Sc ratios, Au/Ir ratios and the rare earth element contents of diamonds. These will be discussed
further, with the objective of distinguishing between diamonds of the edogitic and peridotitic
parageneses and between diamonds from the different geographic locations.
4.1 CHROME AND SCANDIUM IN DIAMONDS
A Cr versus Sc plot for the diamonds with silicate inclusions is shown in figure 4.1, The Cr/Sc ratios
of the two parageneses are dearly different, with the edogitic diamor.. , having Cr/Sc<50 and
peridotitic diamonds having Cr/Sc>100. Moreover, the Cr/Sc ratios distinguish between diamonds on
the basis of geographic location, and in all cases there are positive correlations between Cr and Sc in
each diamond group.
Much of the variations in Cr and Sc concentrations shown in Fig,4.1 are due to inclusion size and
inclusion type: a comparison of Premier diamonds to those from Finsch indicate that the Premier
edogitic diamonds appear to be richer in Cr and Sc than the Finsch edogitic diamonds, however, the
Premier peridotitic diamonds have lower Cr and Sc compared to those from Finsch. The Cr and Sc
differences in the edogitic diamonds are attributed to the fact that the Premier edogitic diamonds are
dominated by omphacitic clinopyroxene inclusions while the Finsch edogitic diamonds are dominated
by orange garnet inclusions. The Finsch peridotitic diamonds investigated in this study are dominated
entirely by purple-garnet inclusions. However, the Finsch peridotitic diamond inclusions in general
(as reported in the literature) belong to the gamet-harzburgite suite (Nixon et al., 1987, Gurney,
1989) and therefore are dominated by olivine, orthopyroxene, chrome-pyrope (puiple) garnet (in
order of decreasing abundance) while clinopyroxene is usually absent. Thus the Finsch peridotitic
diamonds investigated in this study were biased towards those with garnet inclusions, These
harzburgitic garnet inclusions are usually subcalcic and extremely Cr-rich (Harte et al., 1980). The
Premier peridotitic diamonds, on the other hand, are dominated by pyroxene inclusions (including

chrome diopside) which suggests that the host rock for the Premier peridotitic diamonds may have
been lherzolite (Gurney, 1989),
Fig. 4.1: Cr versus Sc in diamonds with silicate inclusions.1000000 -s-------------------------- ----------------------------------------------------------- -----
i Finsch-pcridotitic100000 j PERIDOTITIC: Cr/Sc> 100
10000 ■
5a .Premier®>, cclogitic
§ < 4 * A 8O jqq Finsch-cclogites" " " "
10 s/" " " '''" * ,, B Brazil! \ § Finsch
. ' Brazil-eclogitfc J a > fColorado-cclogiticJ p Colorado11 -----Mg. n - X * Premier
: ECLOGITIC: Cr/Sc<50 -------" A Finsch 2, 1 ■■[-'..-....... i .... rf — "i i ' i i 1 i " i |""J . i ii] — 11 | r" i n .
.1 1 10 100 1000
Sc(ppb)
34
PERIDOTITIC: Cr/Sc>100Finsch-pcridotitic
Premiercclogitic
Finsch-cclogitic
C BraZT c d o g T ic ''^ '? {Colorado-cclogiticJ
ECLOGITIC: Cr/Sc<50
Q Brazil Finsch
D Colorado * Premier A Finsch 2
“t - I I T I I*]’- * 1 T t- t v t i - ■ I "t i 't i n ; r—r
Fig. 4.2: Cr vs Sc in Brazilian and Premier diamonds with sulphide inclusions. 10000 •a----------- ---------------------------------------
1000 ■=
■cia . 100 i
10 -s
PERIDOTITIC Cr/SolOO*,^'*
Brazilian *vV OV u -
Premier ,
^ ^ ECLOGITIC ' Cr/Sc < 50
a Brazil ♦ Premier
r i""i 11 n " “ 1 "" V T I T | IT} "V I 1 1 * 11
1 Sc(ppb) 10100
The most exceptional difference between Premier peridotitic diamonds and the Finsch peridotitic
diamonds are the Sc concentrations. The Premier peridotitic diamonds have Sc values <51, while the
Finsch peridotitic diamonds have Sc values between 67-357. This may also have significant

implications for lherzolitic and harzburgitc diamonds in general i.e., when like-rninerals are compared
the lherzolitic inclusions are Sc-poor in comparison to the harzburgitic inclusions, This is a corollary
of the fact that there are positive correlations between Cr and Sc in any one diamond-inclusion type.
However, it possible that the Cr and Sc differences between diamonds', of the two kimberlitefi may be
due to geographic location as well as the mineralogically controlled differences outlined above.
The low concentrations of Cr and Sc in the Brazilian and Colorado diamonds is probably due to the
fact that these diamonds have no visible inclusions, thus the Cr and Sc detected in these stones may be
due to submicroscopic, eclogitic, silicate inclusions as suggested by Fesq et al., (1975). However, it
does appear that the Colorado Diamonds have an order of magnitude more Sc than the Brazilian
diamonds, once again indicating the possibility of differences in these elements from one geographic
location to the next.
The Cr versus Sc plot (Fig.4.2) for diamonds with sulphide inclusions from Brazil and Premier also
show similar differences in the Cr/Sc ratios of the parageneses, to that observed in the silicate
inclusions, and there are also positive correlations between Cr and Sc for each diamond group. Figure
4.2 suggests that the Brazilian diamonds are peridotitic (substantiated by the presence of a visible
olivine inclusion in Al and probably B1 as well) and that the Premier diamonds are eclogitic. The
occurrence of non-chalcophile elements (Cr and Sc) in sulphide bearing diamonds without visible
silicate inclusions are once again interpreted as being due to the presence of submicroscopic silicate
inclusions.
4J..1 Cr and Sc in relation to inclusion-type and its implications.
The differences in the Cr/Sc ratios between diamonds of the eclogitic and peridotitic parageneses is
thought to be due to tlie characteristic Cr and Sc ratios of the different mineral inclusions (see table 4.1
and Fig, 4.3). In figure 4.4 it is demonstrated that the Cr/Sc ratio is also distinctive for silicate
minerals cogenetic with diamond such as orange garnet, red garnet., purple garnet, chrome diopside
and orthopyroxene which were separated from kimberlites. There are strong similarities between
figures 4.3 and 4,4: firstly, there is a positive correlation between Cr and Sc for any one type of
cogenetic mineral (which was seen in the diamond inclusions above) and secondly, the relative

positions of the different minerals on the Cr/Sc plot for the cogenetic minerals are similar to those for
the diamond inclusions.
Fig. 4.3: Cr vs Sc in diamonds with different silicate inclusions.1000000
100000
sra 10000w Inu
1000
100.1 1 10 100 1000
S c (ppb)
36
Table 4.1 Cr/Sc ratios in diamond inclusions
PURPLE GARNET ORANGE GARNET OMPHACITIC
CLJNOPYROXENE
PERIDOTITIC
PYROXENE
410 9.1 40 743
333 7 38 10773
174 7 28
273 10 22
231 4 ,,
2!5 5
6.4 _
(174-410) (4-10) (22-40) (743-10773)
i h P gurnet PERIDOTITIC• O garnetA Ecpx PURPLE GARNET y g >+ P pyroxene a y x
/*CHROME r' B
: i + ~*t \L+ v^MPHifal'E: ' diopsidev ■• OPX*̂
Cr/ScySu _ -« •"i
GARNET■ 1 1 J f / ECLOGITIC
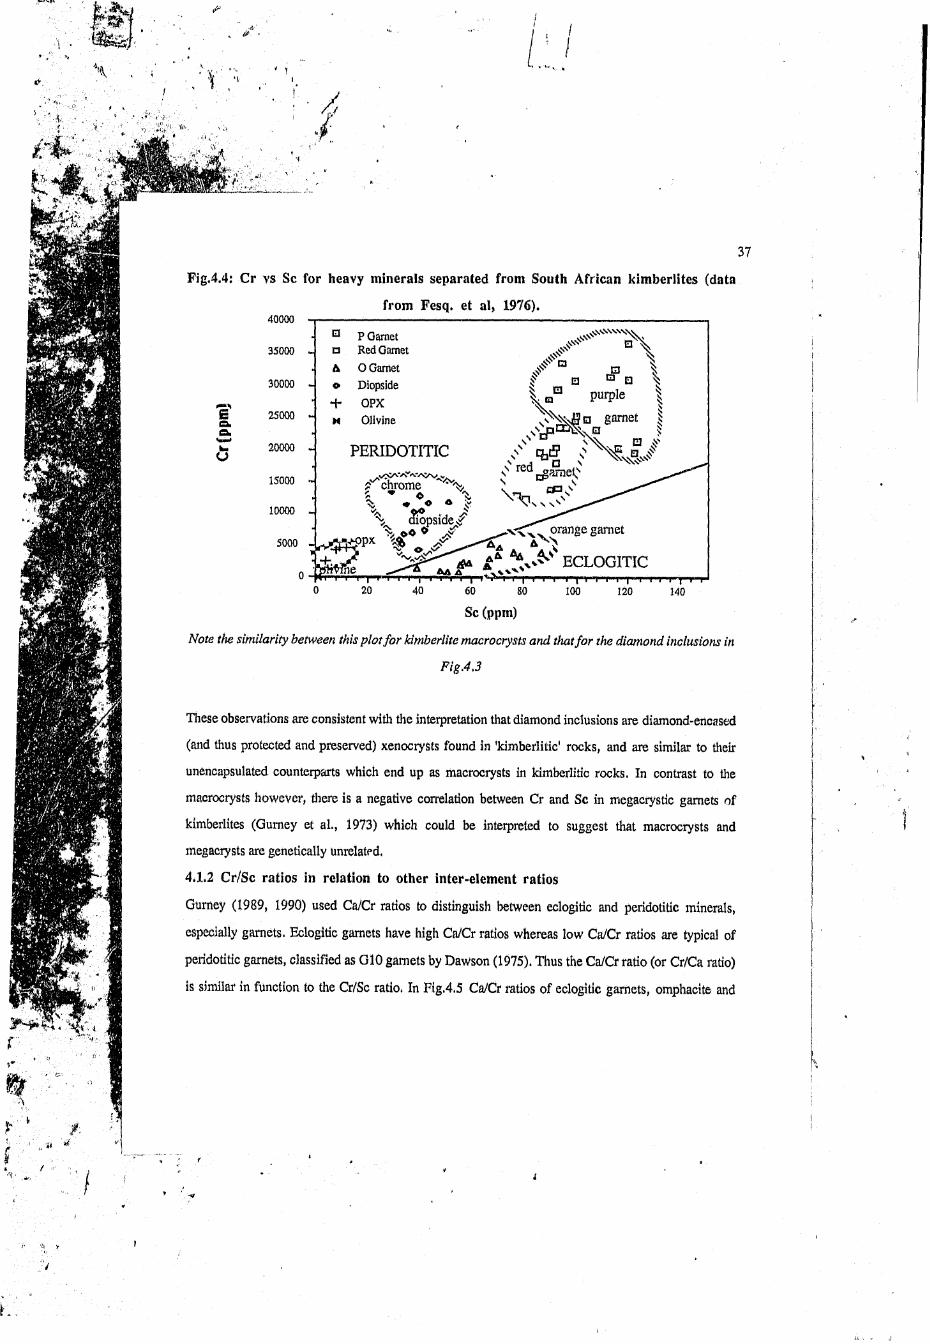
Fig.4.4: Cr vs Sc for heavy minerals separated from South African kimberlites (data
Sc (ppm)
Note the similarity between this plot for kimberlite macrocrysts and that for the diamond inclusions in
Fig.4,3
These observations are consistent with the interpretation that diamond inclusions are diamond-encased
(and thus protected and preserved) xenocrysts found in 'kimberlitic' rocks, and are similar to their
unencapsulated counterparts which end up as macrocrysts in kimberlitic rocks. In contrast to the
macrocrysts however, there is a negative correlation between Cr and Sc in megacrystic garnets of
kimberlites (Gurney et al., 1973) which could be interpreted to suggest that macrocrysts and
megacrysts are genetically unrelated.
4.1.2 Cr/Sc ratios in relation to other inter-element ratios
Gurney (1989, 1990) used Ca/Cr ratios to distinguish between eclogitic and peridotitic minerals,
especially garnets. Eclogitic garnets have high Ca/Cr ratios whereas low Ca/Cr ratios are typical of
peridotitic garnets, classified as G10 garnets by Dawson (1975). Thus the Ca/Cr ratio (or Cr/Ca ratio)
is similar in function to the Cr/Sc ratio. In Fig.4.5 Ca/Cr ratios of eclogitic garnets, omphacite and
from Fesq. et al, 1976).40000 ------------------------------
• n P Garnet 35000 - n Red Garnet

fk
Wkiit
I I> 1' /
38
chrome diopside inclusions are plotted against their Cr/Sc ratios, Peridotitic diamonds have high
Cr/Sc ratios and low Ca/Cr ratios, whereas eclogitic diamonds have low Cr/Sc ratios but relatively
higher Ca/Cr ratios,
Fig.4.5: Cr/Sc ratio versus Ca/Cr ratio in diamonds.100000 _______________
10000
1000 1
uss
100
PERIDOTITC:
0 High Cr/Sc and low Ca/Cr
□10
1
ECLOGITIC:
Low Cr/Sc and high Ca/Cr □ n
" i .......... i-------r ^ T T i - T T'T'"1*"------ ~~ i----------1------i— r - i - i-T - r
1000100
Ca/Cr
There is a negative correlation between the Cr/Sc ratio and the CalCr ratio in diamond inclusions.
Fig. 4.6: Cr vs Al in garnet inclusions in diamond (electron probe data from Griffen
et al., 1992).

Similarly, figure 4.6 shows that there is a negative correlation between Cr and A1 in garnet inclusions
which suggests that Cr-rich garnets i.e., peridotitic garnets are Al-poor while Cr-poor (eclogitic)
garnets are Al-rich, Consequently peridotitic garnets have low Al/Cr ratios whereas eclogitic garnets
have higher Al/Cr ratios.
4.2 THE GEOCHEMISTRY OF Cr AND Sc IN UPPER-MANTLE ROCKS AND
MINERALS.
It can be deduced from the discussion, in section 4,1 above, that the distribution or partitioning of Cr
and Sc between minerals of the peridotitic paragenesis (olivine, orthopyroxene, chrome-pyrope garnet
and chrome-diopside) and those of the eclogitic paragenesis (omphacitic clinopyroxene and pyrope-
almandine garnet) are significantly different These differences reflect differences in the environment
of diamond crystallization and hence are genetically controlled.
Diamonds of the peridotitic paragenesis are older (>3.0 Ga: Richardson, 1986) and crystallized in
ultramaf'ic mantle rocks such as harzburgites and lherzolites at temperatures that were generally below
the subsolidus (Boyd and Gurney, 1986), whereas eclogitic diamonds are relatively younger (90 Ma -
1.6 Ga: Smith et al., 1991) and crystallized in eclogitic mantle rocks, which have a composition that is
similar to basalts, r.t temperatures that were predominantly above the subsolidus (Boyd & Gurney,
1986). The partitioning of trace elements such as Cr and Sc are greatly influenced by factors such as
temperature, pressure and composition of tie phases involved. These factors clearly differed during
the crystallization of diamonds of the two parageneses,
The partitioning of a trace element is defined by its partition coefficient (Kd ) = (Cone, in
minerallConc, in liquid), which is a constant. If K d > 1 for an element, that element is described as
being compatible and so will be retained or extracted in the residual or crystallizing solid phases
respectively. Whereas, if K d « 1 for a particular element, that element is referred to as being
incompatible and will be preferentially concentrated in the liquid us phase duri-.g melting and
crystallization,
Although partition coefficients and trace element modeling have been used extensively in geochemical
studies of basaltic rocks (see table 4.2, data from Irving, 1978 and Irving, Frey, 1978 and
39

Henderson, 1982), very little work has bean attempted in rocks of peridotitic composition. The
average partition coefficients of Cr and Sc, for liquids of basaltic composition (table 4.2) may be used
for the eclogitic minerals but are found to be erroneously low for the Cr-rich end members of
elinopyroxene (chrome diopside) and garnet (Cr-pyrope garnet). Therefore the maximum values for
Cr are used for these minerals. Considering that there is a positive correlation between Cr and Sc in
each mineral type, the maximum values for Sc are used for these minerals as well. In this study the
K o for Cr in chrome diopside and Cr-pyrope garnet have been extrapolated from figure 4.7 (see table
4.2), Table 4.2 shows that K~o for Cr is usually greater than unity (up to 20) so Cr behaves as a
compatible element, in the mineral phases given, whereas K& for Sc ranges from < 1 in olivine to 8 in
garnet and so Sc behaves as only a moderately compatible element in olivine but a compatible element
in the rest of the mineral phases given.
In the evolution of a magmalic liquid, more than one mineral phase is involved, therefore the
partitioning is described by the bulk distribution coefficient (D) which is calculated from the weight
proportions of each mineral. For example, the bulk distribution (partition) coefficient of Cr and Sc
(Dcr/Sc) for a hypothetical garnet peridotite consisting of 50% olivine, 25% orthopyroxene, 15%
garnet and 10% chrome-diopside will be as follows:
D c r - 0.5x3.0 + 0.25x10 + 0.15x~20 + 0 ,1x20 D sc= 0.5x0.2 + 0.25x1.2 + 0.15x3.0+ 0 ,1=5.0
= 1.5+ 2.5+ 3 + 2 =0.1 + 0.3 + 0.45 + 0.5
= 9 = 1.35
so Dcr/Sc = 6.7
Similarly the bulk distribution coefficient of Cr and Sc for a hypothetical eclogite consisting of 50%
omphacitic elinopyroxene and 50% pyrope-almandine garnet will be as follows:
Dcr = 0.5x8 + 0.5x2 t>Sc = 0.5x3 + 0.5x5
= 4+1 = 1.5 + 2.5
= 5 =4
D c r /S c = 1.25
40

The bulk distribution coefficient for Cr in this garnet peridotite is about 7 times more thau it is for Sc.
On the other hand, the bulk distribution coefficient for Cr in the eclogite is only 1.25 timcss greater than
it is for Sc. Hence, the bulk distribution coefficients explain the mineralogically-controllcd reasons for
the Cr/Sc ratios of peridotitic rocks being higher than they are for basaltic rocks (see table 4,3).
However, they do not account for the magnitude of the difference between the 2 parageneses. The
very high Cr/Sc ratios of some upper mantle peridotites point to a secondary enrichment process or
melt extraction episode/s (which predated peridotitic, diamond genesis). An enrichment process would
require the addition of Cr such as through metasomatism. Melt extraction episode/s would involve the
preferential removal of Sc and the subsequent enrichment of Cr in the residue. Liang & Elthon (1990)
suggest that the abundance of Cr in upper-mantle peridotites is indicative of the ex fraction (prior to 3,0
Ga) of picrite to komatiite liquids from the Earth's upper mantle. This follows from Boyd and Gurney
(1982) who proposed that diamond-bearing harzburgites (of the Kaapvaal Craton) may be the residues
from the formation of komatiite lavas.
As mentioned above, the partitioning of Cr and Sc are significantly influenced by the composition of
the solid and liquid phases. The MgO content of the phases, in particular, plays an important role in
the structure of the phases and thus affects the partitioning of these elements, Figure 4.7 is a plot of Cr
against MgO for silicate diamond-inclusions analyzed by electron microprobe (Moore & Gurney, 1988
; Otter & Gurney, 1988). Note that the trend for the peridotitic suite differs from that for the edogitic
suite. The plot for the peridotitic minerals suggests a crystallization trend (see arrow in Fig,4,7): Cr
increases and MgO decreases with the crystallization of olivine, orthopyroxene, chrome-pyrope garnet
and chrome-diopside (in that order). A maximum in Cr concentration is found between 20 -25% MgO
and occurs in the Cr-pyrope garnets,
In the edogitic field Cr increases as MgO increases. The edogitic suite therefore, suggests a melting
trend and the order is omphacitic clinopyroxene and then pyrope-almandine garnet. The basaltic nature
of the edogitic suite is emphasized by the fact that the edogitic minerals plot between 10-20% MgO.
41
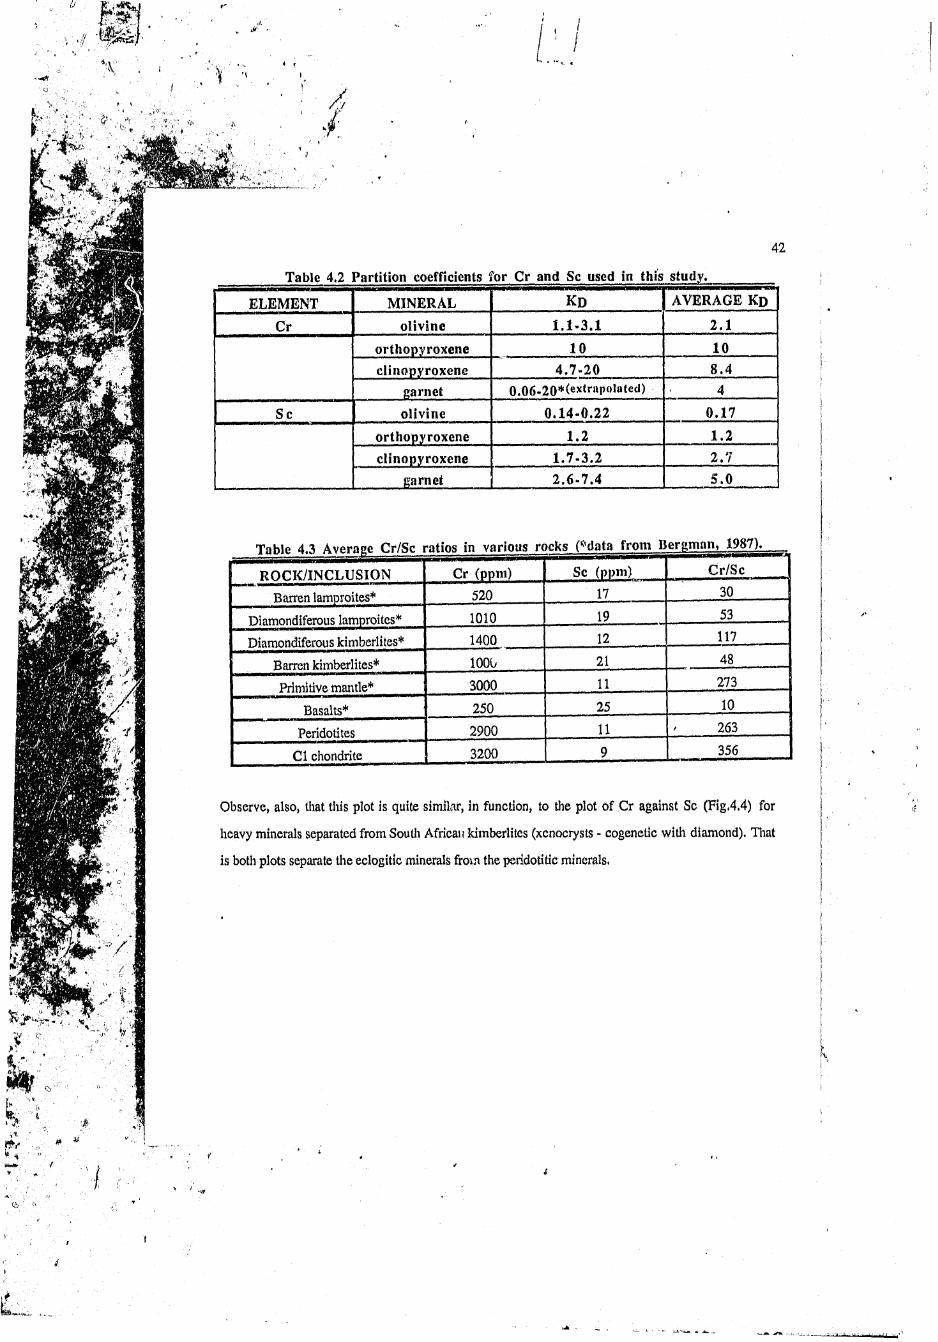
Table 4,2 Partition coefficients for Cr and Sc used in this study.
ELEMENT MINERAL K d AVERAGE Kd
Cr olivine 1 .1 -3 .1 2 .1
orthopyroxene 10 10
clinopyroxene 4 .7 -2 0 8 .4
garnet 0.06-20*(extll'aPo,atcd) ■ 4
S c olivine 0 .1 4 -0 .2 2 0 .17
orthopyroxene 1 .2 1 .2
clinopyroxene 1 .7 -3 .2 2 .7
garnet 2 .6 -7 .4 5 .0
Table 4.3 Average Cr/Sc ratios in various^ggksj^ ju jata jfeo in^
ROCK/INCLUSION Cr (ppm) Sc (ppm) Cr/Sc
Barren lamproites* 520 17 30
Diamondiferous lamproites* 1010 19 53
Diamondiferous kimberlites* 1400 12 117
Barren kimberlites* 1000 21 48
Primitive mantle* 3000 11 273
Basalts* 250 25 10
Peridotites 2900 11 ' 263 |
Cl chondrite 3200 9 356 ]
Observe, also, that this plot is quite similar, in function, to the plot of Cr against Sc (Fig,4,4) for
heavy minerals separated from South African kimberlites (xcnocrysts - cogenetic with diamond). That
is both plots separate the eclogitic minerals from the peridotitic minerals.
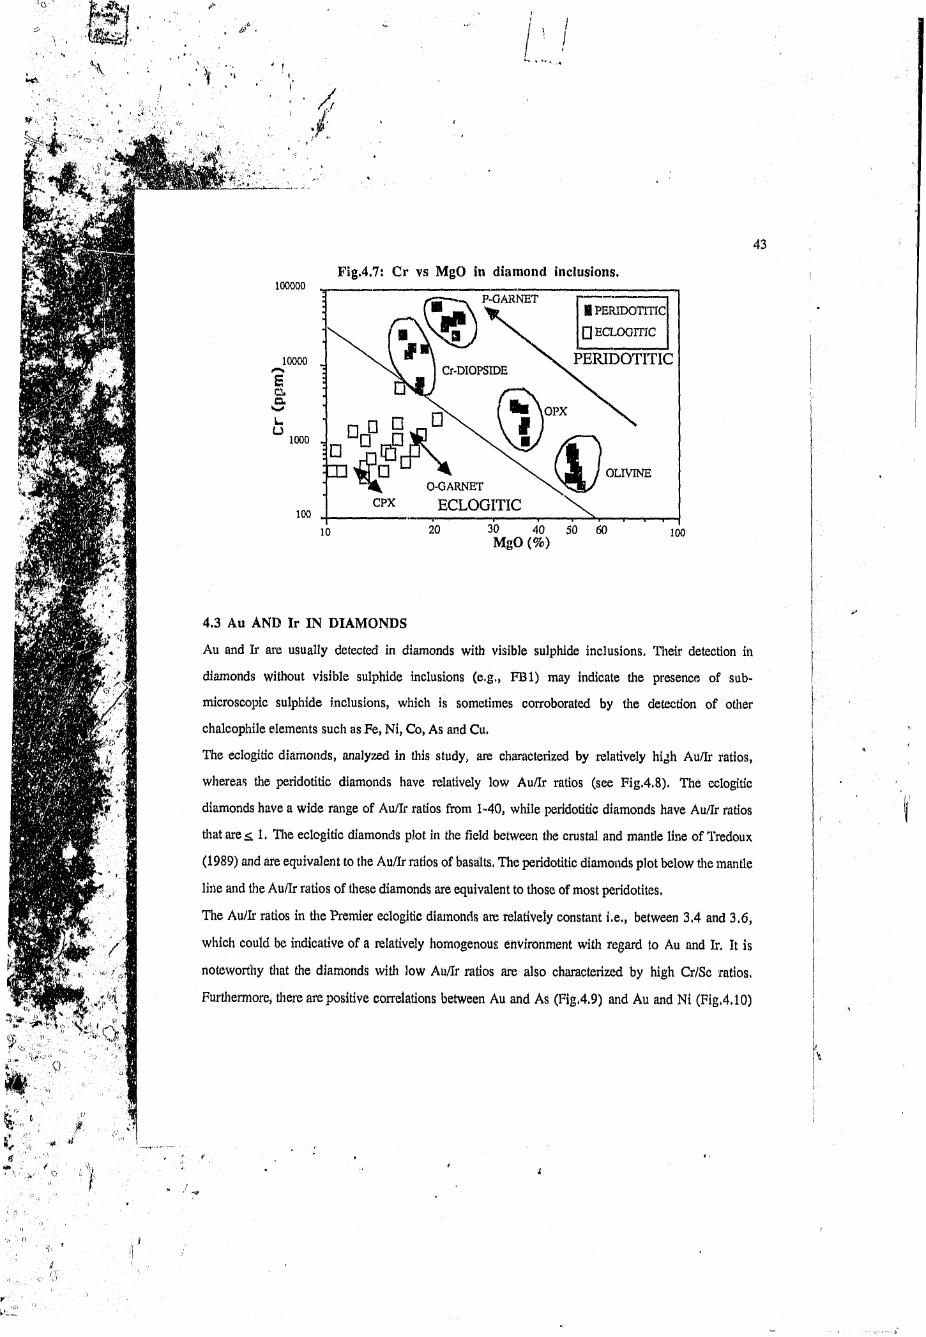
43
Fig.4.7: C r vs MgO in diamond inclusions.100000 ________________________________________
MgO (%)
4.3 Au AND Ir IN DIAMONDS
Au and Ir are usually detected in diamonds with visible sulphide inclusions. Their detection in
diamonds without visible sulphide inclusions (e.g., FBI) may indicate the presence of sub-
microscopic sulphide inclusions, which is sometimes corroborated by the detection of other
chalcophile elements such as Fe, Ni, Co, As and Cu.
The eclogitic diamonds, analyzed in this study, are characterized by relatively high Au/Ir ratios,
whereas the peridotitic diamonds have relatively low Au/Ir ratios (see Fig.4.8). The eclogitic
diamonds have a wide range of Au/Ir ratios from 1-40, while peridotitic diamonds have Au/Ir ratios
that are< 1, The eclogitic diamonds plot in the field between the crustal and mantle line of Tredoux
(1989) and are equivalent to the Au/Ir ratios of basalts. The peridotitic diamonds plot below the mantle
line and the Au/Ir ratios of these diamonds are equivalent to those of most peridotites.
The Au/Ir ratios in the Premier eclogitic diamonds are relatively constant i.e., between 3.4 and 3,6,
which could be indicative of a relatively homogenous environment with regard to Au and Ir. It is
noteworthy that the diamonds with low Au/Ir ratios are also characterized by high Cr/Sc ratios,
Furthermore, there are positive correlations between Au and As (Fig,4.9) and Au and Ni (Fig.4.10)

in the peridotitic diamonds with sulphide inclusions, but these relationships were not observed in the
eclogitic diamonds with sulphide inclusions.
Au/Ir ratios are thus similar in function to the Fe/Fe+Ni ratios of Haggerty (1991) who pointed out
that eclogitic diamonds with sulphide inclusions have the highest Fe/Fe+Ni ratios of between 0.88
0.99, while peridotitic diamonds with sulphide inclusions have moderate Fc/Fe+Ni ratios of 0.55 to
0.65, This holds, in general, for the diamonds analyzed in this study, except where the sulpliide
inclusions are accompanied by large silicate inclusions as well. Nevertheless, there is a broad positive
correlation between the Au/Ir ratios and the Fe/Fe+Ni ratios of the diamonds analysed.
Fig.4.8: Au Vs Ir in single diamonds compared to South African kimberlites
(modified from Tredoux, 1989).
Note also, the >ery low limits o f detection for both Au and Ir.
Kimberlite data from McDonald (1993).

in the peridotitic diamonds with sulphide inclusions, but these relationships were not observed in the
eclogitic diamonds with sulphide inclusions.
Au/Ir ratios are thus similar in function to the Fe/Fe+Ni ratios of Haggerty (1991) who pointed out
that eclogitic diamonds with sulphide inclusions have the highest Fe/Fe+Ni ratios of between 0.88
0.99, while peridotitic diamonds with sulphide inclusions have moderate Fe/Fe+Ni ratios of 0.55 to
0.65. This holds, in general, for the diamonds analyzed in this study, except where the sulphide
inclusions are accompanied by large silicate inclusions as well Nevertheless, there is a broad positive
correlation between the Au/Ir ratios and the Fe/Fe+Ni ratios of the diamonds analysed.
Fig.4.8: Au Vs Ir in single diamonds compared to South African kimberlites
(modified from Tredoux, 1989).
Note also, the very low limits o f detection fo r both Au and Ir.
Kimberlite data from McDonald (1993),
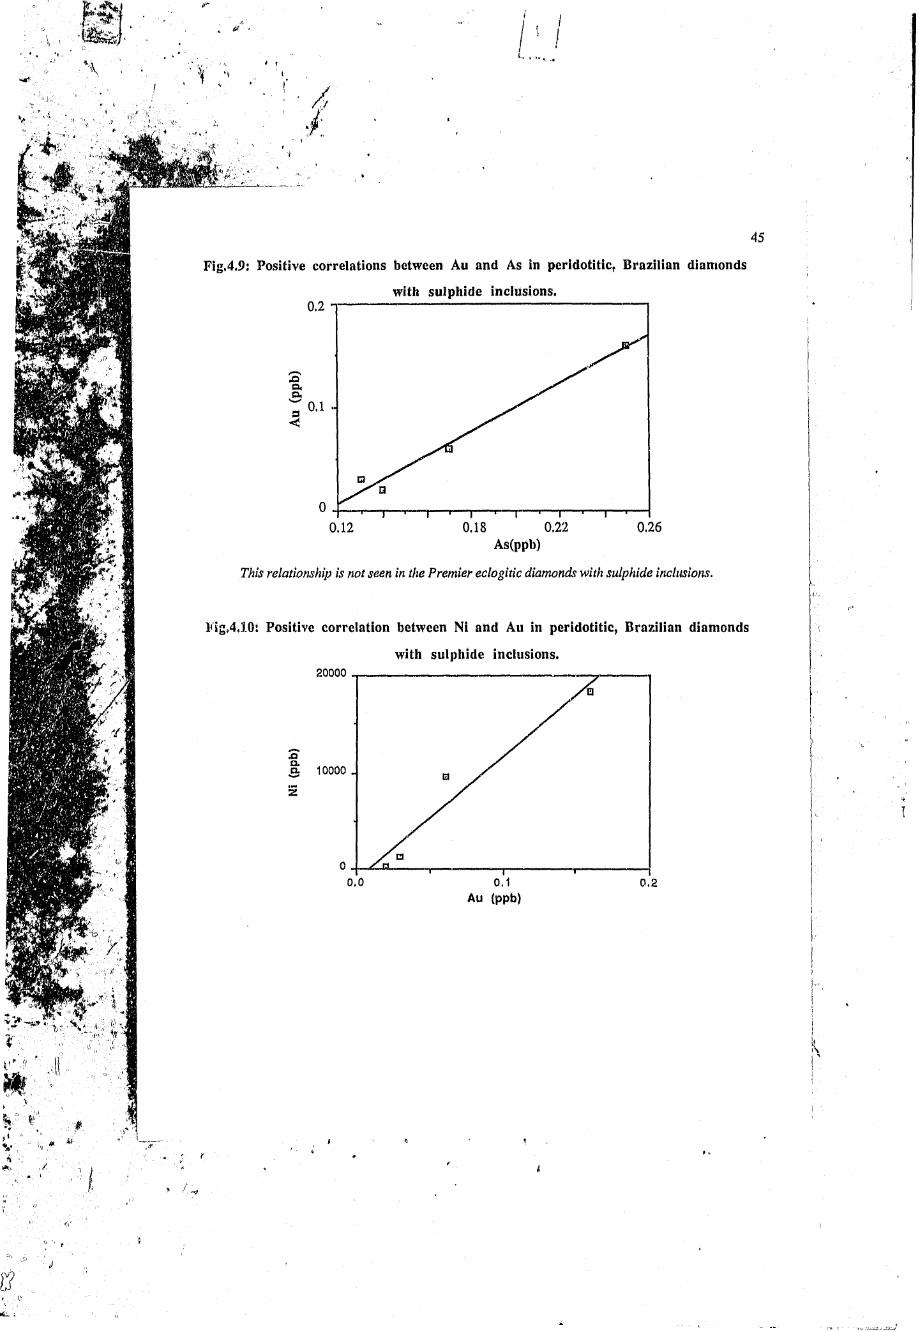
Fig,4.9: Positive correlations between Au and As in peridotitic, Brazilian diamonds
45
with sulphide inclusions.
As(ppb)
This relationship is not seen in the Premier eclogitic diamonds with sulphide inclusions.
Fig,4.10: Positive correlation between Ni and Au in peridotitic, Brazilian diamonds
with sulphide inclusions.

46
Fig. 4.11 Positive correlation between Au/Ir ratios and Fe/Fe+Ni ratios in diamonds
with sulphide inclusions.
5
sfe
Au/Ir
4.3 RARE EARTH ELEMENTS IN DIAMONDS.
The rare earth element (REE) data in these diamonds are difficult to interpret because of the varied and
unusual (chondrite normalized) REE patterns that are observed. Nevertheless, the REE patterns of
diamonds can be divided into 4 broad groups.
4.3.1 LREE-enriched patterns.
The LREE-enriched patterns are characteristic of diamonds with ' ;ther purple garnet (Fig.4.12),
chrome diopside or omphacitic clinopyroxene inclusions (e,g., FPG1-FPG5, PPG1: see Fig.4.12,
FOM1, PCI and PC2). These observations are consistent with those of Shimizu and Richardson,
(1987). The LREE-enriched pattern of the Brazilian peridotitic diamonds with sulphide inclusions (see
Fig,4.13) can be interpreted to indicate the presence of submicroscopic purple garnet or
submicroscopic peridotitic, pyroxene inclusions.
4.3.2 HREE-enriched patterns.
HREE-enriched patterns are characteristic of diamonds with orange garnet inclusions (e.g., FOG1
and FOG2), The HREE enriched pattern is therefore a good indicator of the eclogitic paragenesis and
of the influence of pyrope-almandine garnet. The Premier diamond with a sulphide inclusion (see
Fig.4,13) shows HREE-enrichment and this is interpreted to indicafe submicroscopic orange garnet
inclusions.

47
4.3.3 Sub-horizontal pattern.
This is found in the eclogitic diamond POM1, where the REE content is the sum of the contributions
of the visible and submicroscopic orange garnet and omphacitic, clinopyroxene inclusions (see
Fig,4.14). This pattern is relatively flat.
4.3.4 LREE-enriched subparallel patterns.
Some LREE-enriched diamonds display subparrallel patterns with higher than usual concentrations of
REE and these can be explained in terms of variable amounts of kimberlite contamination
superimposed on the contribution from the diamond itself. Kimberlite contamination can be
introduced into the diamonds through micro-cracks, and it seems that the cleaning procedure cannot
remove this contamination, entirely. However, such kimberlite contamination (especially REE) may
also have its advantages, since it leaves a fingerprint of the kimberlite. Thus, diamonds from different
kimberlite-sources can be differentiated on this basis. Figure 4.15 shows that diamonds (with
different inclusion mineralogies) from different localities (e.g., Romaria, Finsch and George Creek)
have distinctive LREE-enriched subparallel patterns.

48
Fig.4.13: REE patterns t'or Brazilian diamonds and a Premier diamond with sulphide
inclusions.
.01La
L- A l
• Ci
m i Ji
-rr"T T |'T”p'T"i T—I "r |-v r ’ T '"I " ' " r i ' 'Ce Sm Eu Yb
REELu
Fig.4.14: REE pattern for diamond POM1
This diamond shows enrichment in both LREE and HREE, and this is responsible fo r the relative
flattening o f the chondrite normalized pzttern.

49
Fig.4.15: REE patterns for kimberlite-contaminated diamonds.
50
5: CARBON ISOTQEKEAIIQi?
In this work carbon isotope analysis of 33 inclusion-bearing and inclusion-free diamonds (which
were previously analyzed by INAA) was carried out. The analyses were performed using the
carbonate line (see Fig.5,1) at the University of Cape Town. The main objective of this work was to
compare the carbon isotope ratios, of the diamonds, to their geochemistry, in particular their
relationship to the Cr/Sc and Au/lr ratios. The data is also compared to carbon isotope data from the
literature.
5.1 M ETHODOLOGY
5.1.1 Diamond preparation/selection.
The diamonds were analyzed according to the technique described by Kirkley (1992, pers.comm.).
The diamonds were first described with strong emphasis being placed on the surface features.
Particular attention was paid to resorption morphology, presence or absence of ribbing, pits, laminae
and striations (see Robinson, 1979), in order to facilitate the recognition of the external and internal
fragments of each diamond. The diamonds were then broken in a steel pestle and mortar. Great care
Wul. taken, to avoid contamination by cleaning the pestle and mortar (with alcohol and then water) after
each sample. One external and one internal fragment (0.1-0.2 mg) of each diamond was selected for
analysis. Recognition of the external and internal fragments was based on the presence or absence of
the surface features mentioned above. Each fragment selected was then weighed.
5.1.2 C 0 2 collection
Each diamond fragment is placed in the platinum basket (located in the chamber section: see Fig,5,1)
and then burnt in oxygen. The diamond (C) in the presence of O2 forms CO2. This CO2 yield, which
is measured by the vacuum gauge, is then recorded. The CO2 is then transferred from the chamber
section to the end of a break-seal tube (see Fig.5.1) by using liquid-nitrogen traps (alternate liquid-
nitrogen freezing and artificial heating is used to transfer the gas along the chamber). Once the CO2 is
frozen at the bottom of the break-seal tube, the tube is heat-sealed,

U1

5.1.3 S tandardization.
Four NBS graphite standards were also burnt and their CO2 collected in this manner. This is done to
check on the efficiency of the extraction procedure.
5.1.4 Analysis by mass spectrom eter.
The JEOL Mass Spectrometer was used to measure the ratio of "C02-mass 45"/"C02-mass 44"
which is the ratio of [(C13 +O16. 0 16)/(C12+ 0 16. O16)] in each sample of CO2 extracted. Basically,
this involves breaking the break-seal tube and releasing the CO2 into the system. The sample gas is
compared to a ioic-rence gas.
5.1.5 Calculating 8 13C values.
The raw values for "mass 45" and "mass 44" obtained from the mass spectrometer are then converted
into 8 13C by the following formula: 8 13C sam ple-[(R sample - R standard)/R standard] X 1000
where R = 3̂C/^2C. Therefore 8 is the difference in isotopic ratio between a sample and a standard,
expressed in parts per thousand or permil (°/oo), The S13C values are reported relative to the PDB
standard (belemnite from the Peedee Formation).
5.2 RESULTS
The data obtained for the 33 diamonds analyzed, is given in tables 5.1-5.6 (in Appendix:5) and
plotted on a bar graph (see Fig,5.2). Values for both the external fragment (ext) and internal fragment
(int) are given. The 813C values range from -1.8 to -16.4 °/oo, With the exception of GC3 (-16.4 %o)
the values are well within the range for the majority of diamonds worldwide (Kirkley, 1991). In some
diamonds (e.g., D2, D3 and POC1) there are noteworthy differences between the values for the
external and internal fragments.
The George Creek diamond yielded the lightest carbon isotope ratio (-16.4 °/oo) of all the diamonds
analyzed (see table 5.1). This may be significant in that some other North American diamonds e.g.,
Sloan (see Otter et al., 1991) are also reported to have high negative values. The data for the Finsch
and Premier diamonds compares reasonably well with the data of Deines et al., 1984 (see Fig.5.2-

53
Fig.5.2: 513C values for Finsch and Premier eclogitic and peridotitic diamonds
analysed in this work.20.
xn 8 >*^ 10.
IX*o
g ECLOGITIC g PERIDOTITIC
'"I............. 1 ■ i r1 0 -1 -2 -3 -4 -5 -6 -7 -8 -9 -1 0 -1 1 -1 2
CARBON ISOTOPE RATIO
Fig.5.3: S*3c values for Finsch and Premier eclogitic and peridotitic diamonds
analysed by Deines et alv (1984).
V3u
IX*oa
H ECljOGmC ■ PE R iD orm c
1 0 -1 -2 -3 -4 -5 -6 -7 -8 -9 -1 0 -1 1 -1 2
CARBON ISOTOPE RATIO
5.3 DISCUSSION OF DATA
The carbon isotope compositions of more than 1000 diamonds from Roberts Victor (Deines et al,,
1987), Finsch and Premier (Deines etal,, 1984), Star (Hill, 1989), Sloan (Otter, 1989), New South
Wales (Sobolev, 1984) and Argyle and Ellendale (Jaques et al., 1989) have been determined in the
past decade. These analyses revealed that most peridotitic diamonds have 8 ^ C values between -10
i
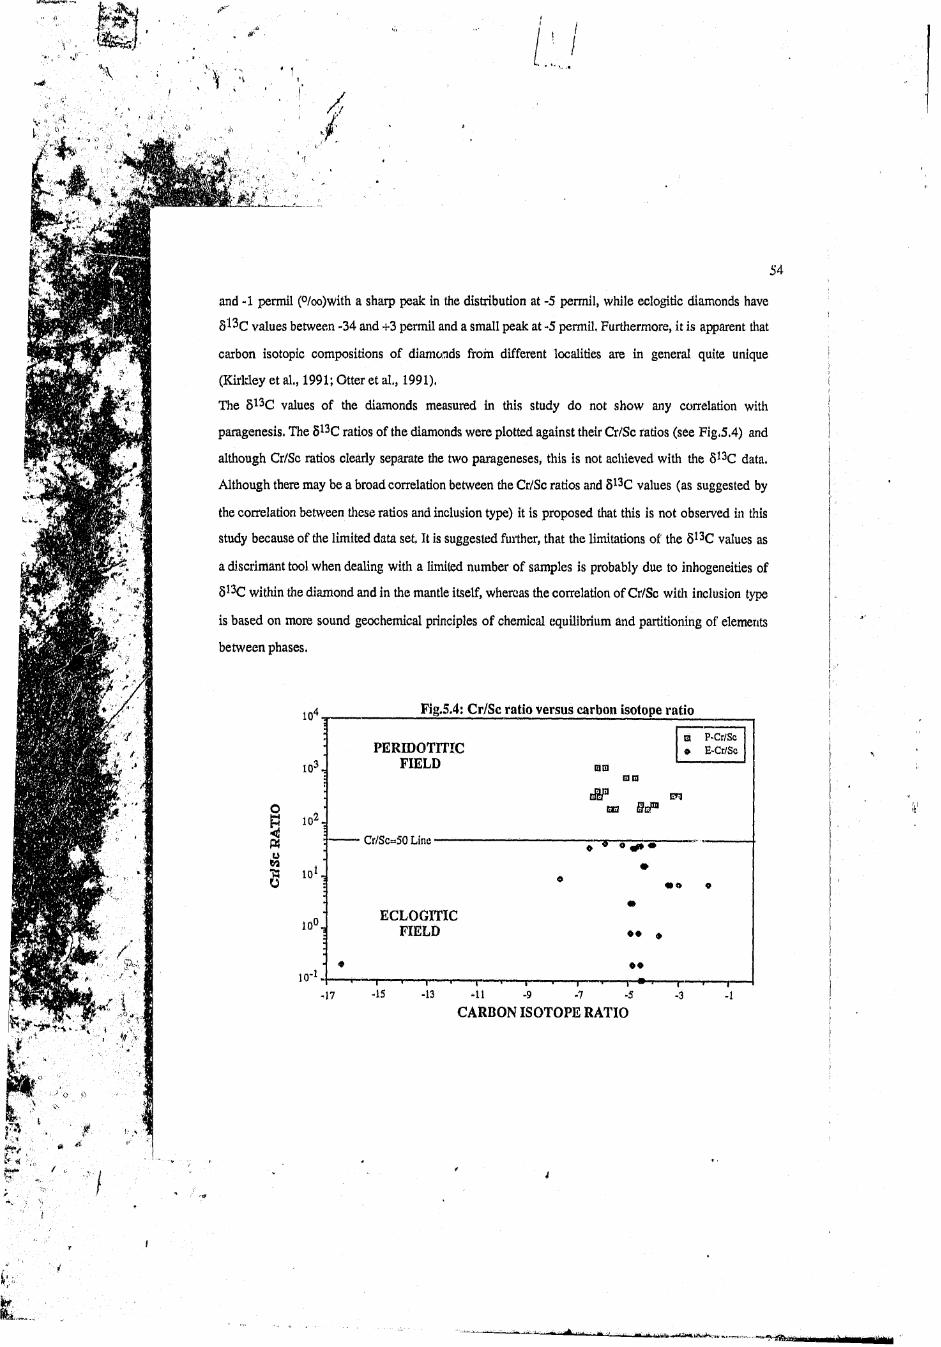
and -1 permil (%o)with a sharp peak in the distribution at -5 permil, while eclogitic diamonds have
S ^ C values between -34 and +3 permil and a small peak at -5 permil, Furthermore, it is apparent that
carbon isotopic compositions of diamonds from different localities are in general quite unique
(Kirldey et al., 1991; Otter et al., 1991).
The 513C values of the diamonds measured in this study do not show any correlation with
paragenesis. The 813C ratios of the diamonds were plotted against their Cr/Sc ratios (see Fig.5.4) and
although Cr/Sc ratios clearly separate the two parageneses, this is not achieved with the 813C data.
Although there may be a broad correlation between the Cr/Sc ratios and 813C values (as suggested by
the correlation between these ratios and inclusion type) it is proposed that this is not observed in this
study because of the limited data set. It is suggested further, that the limitations of the 813C values as
a discrimant tool when dealing with a limited number of samples is probably due to inhogeneities of
S53C within the diamond and in the mantle itself, whereas the correlation of Cr/Sc with inclusion type
is based on more sound geochemical principles of chemical equilibrium and partitioning of elements
between phases.
io*
io3.
2 2P 102
M$ ,
g 10* J
i o u
i<r
Fig.5.4: Cr/Sc ratio versus carbon isotope ratio
PERIDOTITICFIELD
C r/Sc=50 Line ■
ECLOGITICFIELD
-17 -15“ i—
-13
B P-Cr/Sc • E'Cr/Sc
□a□ a
di/3 ehEE SeP
* •
• •
• •
-11 -9 -7 -5f-3
~r—-1
CARBON ISOTOPE RATIO

55
10Fig.5.5: Au/Ir ratio versus carbon isotope ratio
ECLOGITICFIELD
s C , " « V PREMIER SULPHIDESVxxA O
Q □A1
□ Dt >1 t Q El*
a ta ... .
PERIDOTITICFIELD
10 0 .
£CE9<
10 - 1.
10 -2.
CARBON ISOTOPE RATIO-3
Similarly a plot of Au/Ir ratios versus 813C (see Fig,5,5) shows that although there may be a broad
correlation between the Au/Ir ratios and 513C (with the exception of sample A1 which is anomalous;
see chapter 3) only the Au/Ir ratios separate the 2 parageneses clearly. Nevertheless, note the fairly
constant Au/Ir ratios and 813C values for the Premier diamonds with sulphides inclusions which are
all eclogitic.

6;. CONCLUSIONS.The most significant conclusions reached in this study (in the order in which they were attained in the
body of the thesis) are listed below.
6.1) For standardization of single diamonds the graphite-diluted standard mixtures (1 part rock
standard to 50/90 parts graphite), of 1:50 PTO-1, 1:50 NEM-1, 1:90 NIM-G and 1:90 .NIM-L
were the most suitable.
6.2) Long irradiation periods of 128 hours at a neutron dose of 2 x lO ^N .cm '^/s, in an Oak-Ridge-
type nuclear reactor, were necessary for the analysis of single diamonds.
6.3) For short-lived isotope analysis, cyclic counting at the site of irradiation, is obligatory.
6.4) More than 40 elements can be detected at the ppb and sub-ppb levels, in single diamonds, by
INAA.
6.5) The most important factors affecting the concentration of elements in diamond are the size,
number and nature of the mineral inclusions.
6.6) There are positive correlations between the elements Cr, Fe, Ni and Co in all diamonds.
6.7) Edogitic diamonds are characterized by low Cr/Sc ratios of between <1 and 50. They are
enriched in Fe, Mn, Na, Ca, K, HREE, Ga and Au relative to the peridotitic diamonds.
6.8) Peridotitic diamonds are characterized by much higher Cr/Sc ratios, i.e., >100. Pcridotitic
diamonds are also enriched in Ni, Co, LREE and Ir relative to the edogitic diamonds.
6.9) In diamonds with no visible inclusions or only visible sulphide inclusions, the presence of Cr
and Sc may be taken as evidence for the presence of submicroscopic silicate inclusions in
diamond, as suggested earlier by Fesq et al., (1975). Therefor these diamonds can also be
distinguished as either edogitic or peridotitic using the Cr/Sc ratio.
6.10) The brown and yellow body-colouration in diamonds cannot be correlated to any of the
element's analysed. However, the dark-green to black colouration is often due to the intensity
of submicroscopic inclusions and sometimes graphite as well.
6.11) The O'/Sc ratio can be used, in this data set, to distinguish between diamonds from different
geographical locations/mines (Finsch, Premier, George Creek and Romaria),
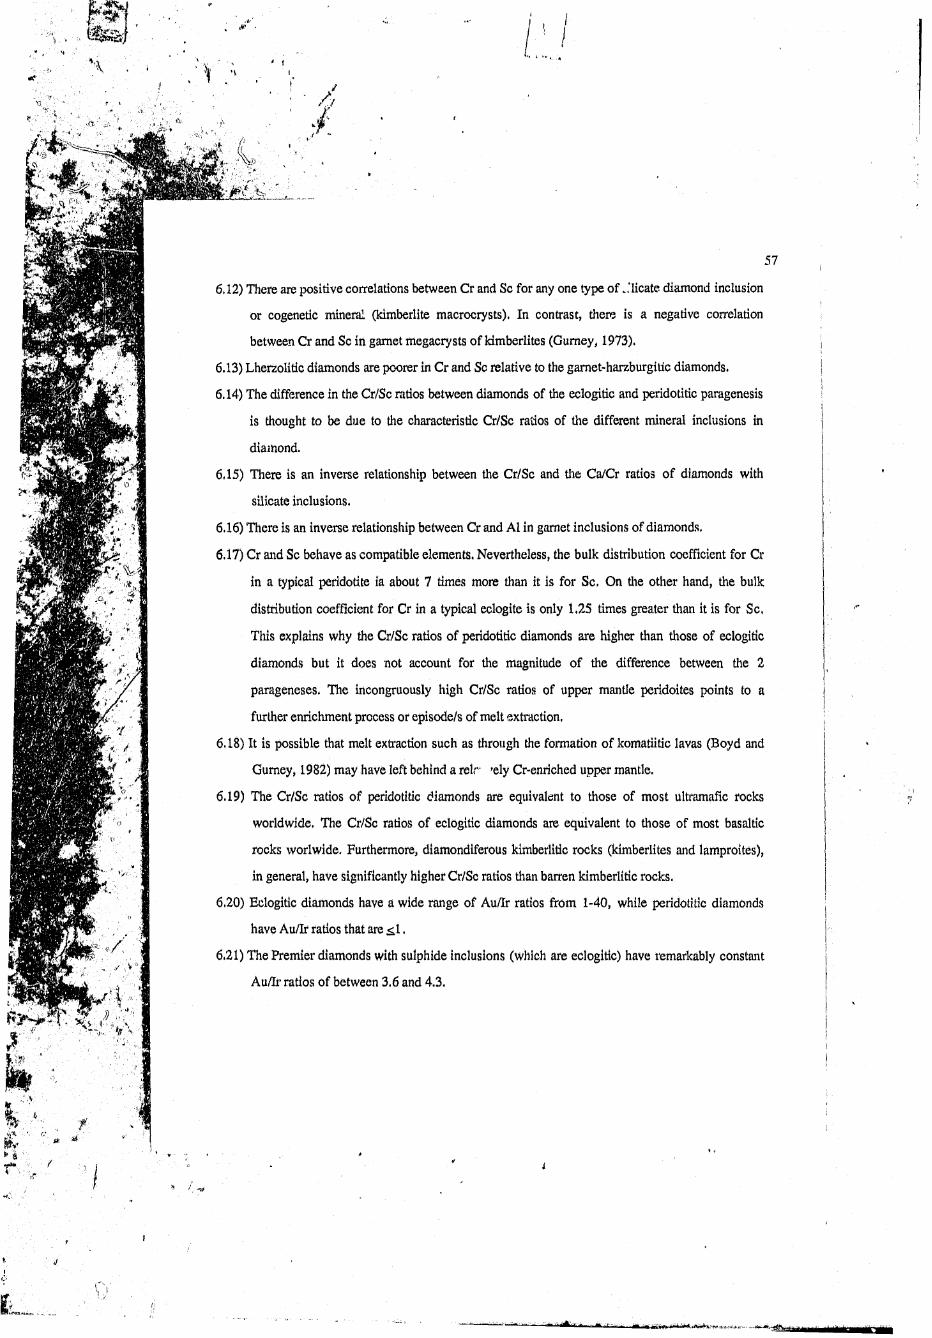
6.12) There are positive correlations between Cr and Sc for any one type of Jlicate diamond inclusion
or cogenetic mineral (kimberlite macrocrysts). In contrast, there is a negative correlation
between Cr and Sc in garnet megacry sts of kimberlites (Gurney, 1973),
6.13) Lherzolitic diamonds are poorer in Cr and Sc relative to the gamet-harzburgitlc diamonds.
6.14) The difference in the Cr/Sc ratios between diamonds of the eclogitic and peridotitic paragenesis
is thought to be due to the characteristic Cr/Sc ratios of the different mineral inclusions in
diamond.
6.15) There is an inverse relationship between the Cr/Sc and the Ca/Cr ratios of diamonds with
silicate inclusions.
6.16) There is an inverse relationship between Cr and Al in garnet inclusions of diamonds,
6.17) Cr and Sc behave as compatible elements. Nevertheless, the bulk distribution coefficient for Cr
in a typical peridotite ia about 7 times more than it is for Sc, On the other hand, the bulk
distribution coefficient for Cr in a typical eclogite is only 1.25 times greater than it is for Sc,
This explains why the Cr/Sc ratios of peridotitic diamonds are higher than those of eclogitic
diamonds but it does not account for the magnitude of the difference between the 2
parageneses, The incongruously high Cr/Sc ratios of upper mantle peridoites points to a
further enrichment process or episode/s of melt extraction,
6.18) It is possible that melt extraction such as through the formation of komatiitic lavas (Boyd and
Gurney, 1982) may have left behind a relr 'ely Cr-enriched upper mantle.
6.19) The Cr/Sc ratios of peridotitic diamonds are equivalent to those of most ultramafic rocks
worldwide. The Cr/Sc ratios of eclogitic diamonds are equivalent to those of most basaltic
rocks worlwide. Furthermore, diamondiferous kimberlitic rocks (kimberlites and lamproites),
in general, have significantly higher Cr/Sc ratios than barren kimberlitic rocks.
6.20) Eclogitic diamonds have a wide range of Au/Ir ratios from 1-40, while peridotitic diamonds
have Au/Ir ratios that are ̂ 1.
6.21) The Premier diamonds with sulphide inclusions (which are eclogitic) have remarkably constant
Au/Ir ratios of between 3.6 and 4.3.

6.22) Eclogitic diamonds have Au/Ir ratios that are equivalent to those of most basaltic rocks.
Peridotitic diamonds have Au/Ir ratios that are equivalent to most ultramafic rocks.
6.23) There is a broad positive correlation between the Au/Ir and Fe/Fe+Ni ratios in diamonds with
sulphide inclusions.
6.24) All peridotitic diamonds are LREE-enriched (see also Shimizu & Richardson, 1987).
6.25) HREE-enriched (chondrite-normalized) patterns are typical of diamonds with eclogitic, orange
garnet inclusions.
6.26) Sub-horizontal (chondrite-normalized) REE patterns are typical of eclogitic diamonds with
omphacitic clinopyroxene and orange garnet inclusions.
6.27) Kimberlite contaminated diamonds yield (chondrite-normalized) REE patterns that are
subparallel and distinctive of that particular kimberlite source.
6.28) There is no apparent relationship between the Cr/Sc and S13C ratios of the diamonds analysed.
6.29) There seems to be a broad positive correlation between the Au/Ir and 813C ratios of the
diamonds analysed.

59
7 -L A E P J,& B IX
7,1.. AEPENDIX ;________ Table: 2.1: Description ol’ T.nsch diamonds with silicate inclusions.
Sam ple Wt(R) D escriptionFOG1 0.08187 Colourless dodecahedron with orange garnet inclusions.FOG2 0.09350 Colourless, irregular, twinned diamond with orange garnet inclusions.FPG1 0,12239 Tetrahexahedroid with purple garnet inclusions. Surfaces are not smooth -
etch features are present.FPG2 0.11145 Colourless, perfect octahedron. It has a purple garnet inclusion.FPG3 0,07325 Colourless, rounded octahedron with trigons. Has a purple garnet inclusion.FPG4 0.02635 Nearly colourless, rounded dodecahedron with peridotitic garnet and olivine
inclusions.FPG5 0.02922 Brown, rounded dodecahedron with five peridotitic garnet inclusions.
White/grey contaminating material in surface depressions. iFOCI 0.03288 Yellow, rounded dodecahedron with subordinate octahedral faces, containing
four eclogitic, clinopyroxenes and many small orange-garnet inclusions.FOM1 0.02954 Light brown, rounded dodecahedron with subordinate octahedral faces,
containing four eclogitic clinopyroxene inclusions.
Table 2.2: Description of Finsch diamonds with sulphide inclusions.
Sam ple _W t(g) D escriptionFS1 0.03257 Fairly deep yellow, rounded dodecahedron containing a large sulphide
inclusion. There is whitish, contaminating material in surface depressions." ■ ■ ....... ...................FS2 0.02693 Deep brown, rounded dodecahedron with a large sulphide inclusion. White
contaminating material in surface depressions.
Table 2.3: Description of inclusion-free Finsch diamonds.
Sam ple W t(s) D escriptionFIF1 0.03437 Deep yellow, rounded dodecahedron without inclusions.FIF2 0.03693 Pinkish brown octahedron with subordinate, rounded dodecahedral faces,
without inclusions.FIF3 0.03121 Colourless, inclusion-free dodecahedron,

Table 2.3 continued
FIF4 0.02075 Colourless fragment.
FIF5 0.1224 Colourless fragment with a grey spot near the surface.
F.IF6 0.04025 Colourless fragment.
FBI 0.03455 Black cube partly modified to a rounded dodecahedron. White contaminating material in surface depressions.
Note that diamonds FIF4-FIF6 are actually fragments, o f diamonds from which large eclogitic
silicate inclusions were removed fo r age-dating o f single inclusions by Smith et al., (1991). They
were analyzed to see whether the inclusion-free fragments still retained their eclogitic signature
(discussed further in chapter 3)
T able 2.4: Description of Prem ier diamonds with silicate inclusions.
Sam ple W t(g) D escriptionPOM1 0.08382 Colourless, rounded octahedron with two greenish-black (omphacite)
inclusions. Small orange garnet inclusions are also present.POC1 0.07321 Colourless octahedron with one blackish-green inclusion and small orange-
brown inclusions.PCI 0.06027 Colourless, planar octahedron with slightly frosted surface. Has a green
clinopyroxene (chrome diopside?) inclusion.PPG1 0.09544 Colourless, frosty, rounded dodecahedron with 2 purple garnet inclusions.POM2 0.09884 Dirty brown, frosty and pitted tetrahexahedroid with a broken edge. Has a
green clinopyroxene inclusion.PC2 0.06994 Colourless, rounded dodecahedron with broken edges. There are 2 green
"wings" which may be clinopyroxene.
Table 2.5: Description of Prem ier diamonds with sulphide inclusions.
Sam ple W t(g) D escriptionPS1 0.05506 Rounded dodecahedron - orangy-brown in colour. Has one big, sulphide
inclusion.PS 2 0.04152 This is a cube with trigon development. It has one sulphide inclusion.PS3 0.04824 The diamond has one large and one small black sulphide inclusion.
PS4 0.04479 Colourless octahedron with trigons and 4 sulphide inclusions
PS5 0.06392 Colourless, rounded dodecahedron with a black sulphide (?) inclusion.PS6 0.04333 Colourless, rounded dodecahedron with one large, sulphide (?) inclusion.

Table 2.6: Description of brown, inclusion free Prem ier diamonds.
Sam ple W t(g) D escriptionB1 0.04573 Brown, inclusion-free octahedron with one side broken off.
B2 0.05585 Brown, inclusion-free, rounded dodecahedron.
B3 0.03170 Brown, inclusion-free, irregular stone.
B4 0.06439 Brown, inclusion-free, rounded dodecahedron.B5 0.04210 Brown, inclusion-free octahedron with one edge broken off.
Table 2.7: Description of yellow, inclusion-free Prem ier diamonds.
Sam ple W t(g) DescriptionY1 0.07145 Deep yellow, inclusion-free, rounded dodecahedron.Y2 0.05343 Lighter yellow, inclusion-free, rounded dodecahedron.Y3 0.04962 Rounded dodecahedron with a yellow tint.
Table 2.8: Description of Brazilian diamonds with sulphide inclusions.
Sam ple W t(«) D escriptionAl* 0.02855 Yellow octahedron, slightly resorbed and twinned. Brown and green
diffusive spots on the surface. Peridotitic garnet, sulphide and olivine inclusions are present.
A2* 0.03128 Highly resorbed. Has a sulphide inclusion. Also has a crack or hole.Bl* 0.02674 Highly resorbed, and on one surface highly frosted. Has a sulphide and
probably an olivine inclusion as well.Cl* 0.03567 Highly resorbed and frosted. Big sulphide and other small "wing" inclusions.
The four diamonds (A1,A2, C l an dB l), also from Brazil, were bought a t Arenapolis, Canastra and Boa Vista, Once again these are alluvial diamonds and their source is unknown. The diamonds have
black sulphide and/or graphite inclusions.
Table 2.9: Description of diamonds from Rom aria, Brazil.*
Sam ple W t(g) D escriptionD2 0.00644 Colourless, irregular dodecahedron with no visible inclusions,D3 0.01248 Colourless octahedron with a slightly stepped surface. One face has an
embayment

62
Table 2,9 continued.
Sam ple W t(g) D escriptionD4 0.02466 Elongated, colourless dodecahedron with slightly frosted, faces and one large
colourless inclusion (300 |im).D5 0.01806 Greenish octahedron with 6 flat faces and enclosing a smaller dodecahedron
inside. No visible inclusions.D6 0.00919 Clear deformed dodecahedron with one small interior cleavage giving a black
film appearance. Possibly one very tiny colourless inclusion.D7 0.01552 Off-coloured octahedron that has been partly broken. One orange spot near
the surface.
* This batch o f Brazilian diamonds are from the mine at Romaria, Western Minas Gerais, which is
working an upper Cretaceous conglomerate, The source o f the diamonds and tlte conglomerate is
unknown.
Table 2.10: Description of diamonds from George Creek, Colorado.
Sam ple W t(g) DescriptionGC1 0.0042 Dark-green to almost black, partially rounded octahedron. No visible
inclusions.GC2 0.0045 Gold to honey brown octahedron with etch-pitting. One comer is broken off.
Colour is a body colour.GC3 0.0043 Colourless fragment which may have been part of a twinned octahedron.
There are inclusions but these appear altered. Possibly a light green clinopyroxene (or opx) inclusion with uncertain bright red specks probably
on a fracture plane (haematite?). Graphite on fractures. This is a bit of amessy diamond.
GC5 0.0026 Green fragments. The bluish-green tinge looks to be a surface coating. No inclusions. Originally part of a rounded dodecahedron.
GC6 0.0023 Clean, unresorbed octahedron. Two comers are broken off. There are no inclusions This is a gem.
GC7 0.0035 Yellow (deep) to yellow-green dodecahedron. No inclusions except for some internal graphite on a plane near one surface.
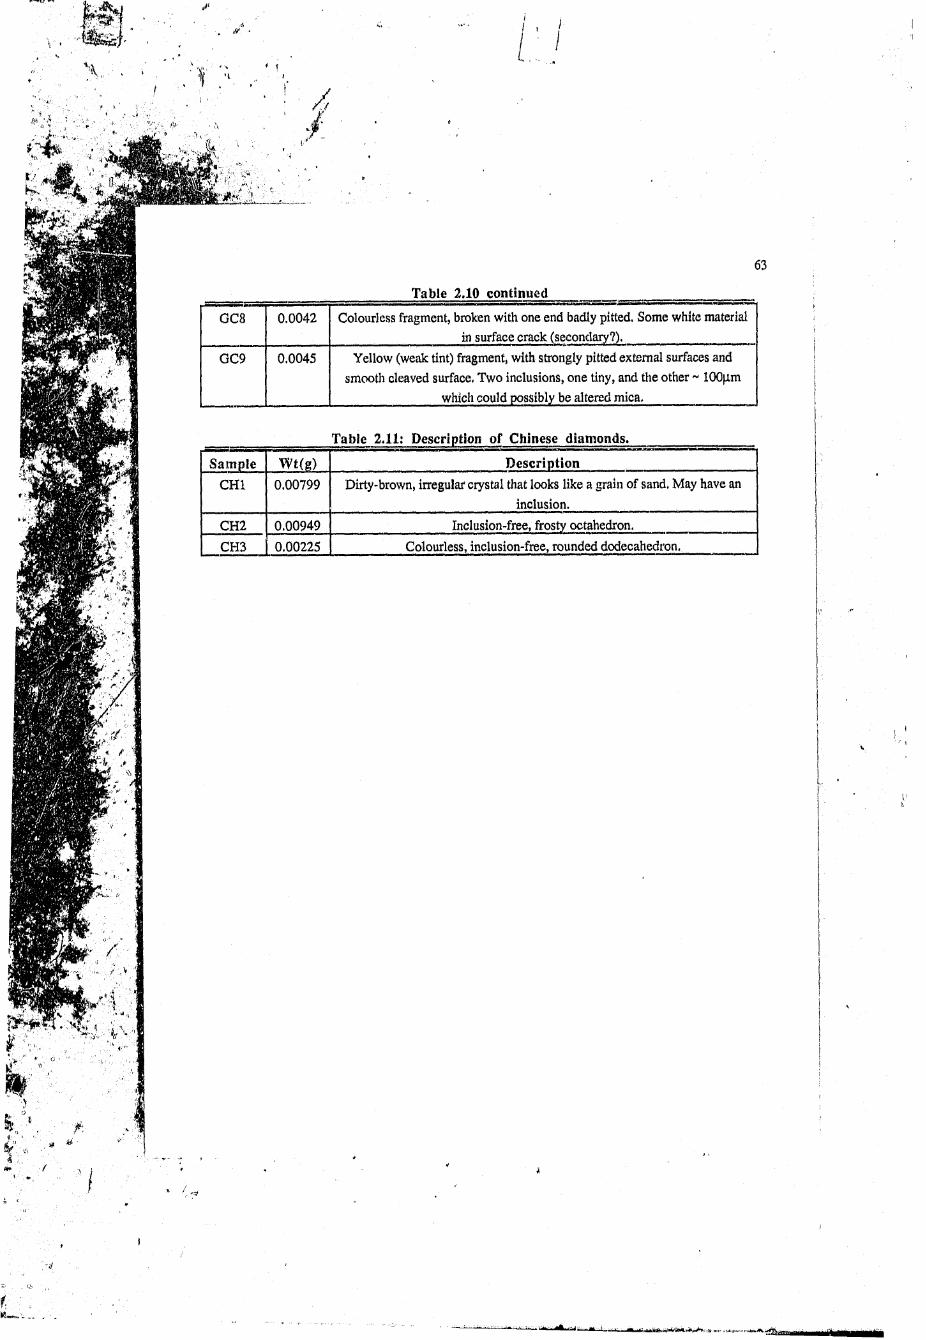
Table 2.10 continued
63
GC8 0.0042 Colourless fragment, broken with one end badly pitted. Some white material in surface crack (secondary?).
GC9 0.0045 Yellow (weak tint) fragment, with strongly pitted external surfaces and smooth cleaved surface. Two inclusions, one tiny, and the other ~ lOOfim
which could possibly be altered mica.
Table 2.11: Description of Chinese diamonds.
Sam ple W t(g) D escription
CHI 0.00799 Dirty-brown, irregular crystal that looks like a grain of sand. May have aninclusion.
CH2 0.00949 Inclusion-free, frosty octahedron.
CH3 0.00225 Colourless, inclusion-free, rounded dodecahedron.
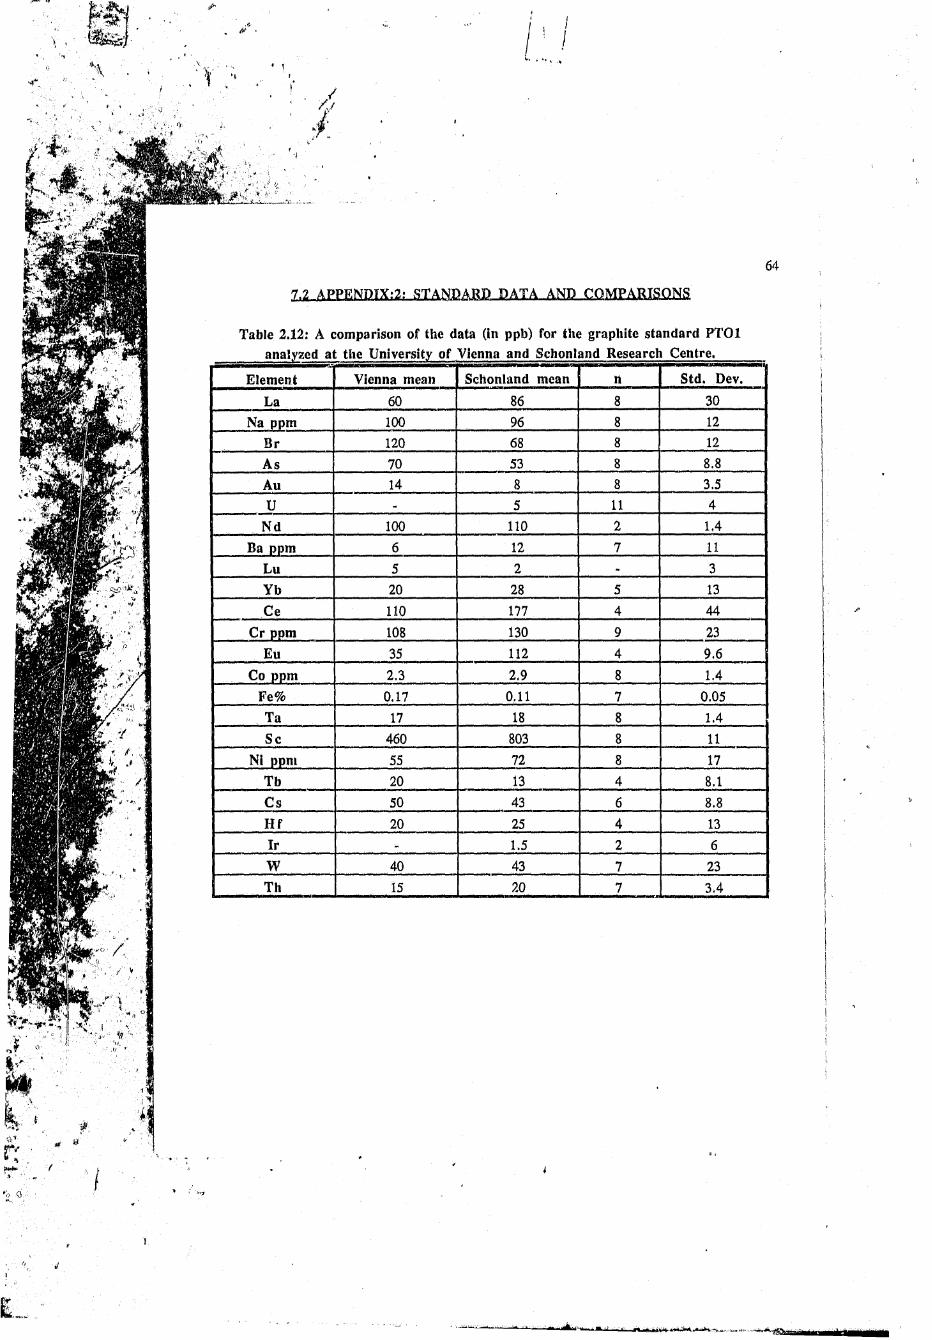
64
7.2 APPENDIX:2: STANDARD_DA1A_AND-CD-MEARISQNS.
Table 2.12: A comparison of the data (in ppb) for the graphite standard PTO l analyzed at the University of Vienna and Schonland Research Centre.
Element Vienna mean Schonland mean n Std. Dev.
La 60 86 8 30
Na ppm 100 96 8 12
Br 120 68 8 12
As 70 53 8 8.8
Au 14 8 8 3.5U . 5 11 4
N d 100 110 2 1.4Ba ppm 6 12 7 11
Lu 5 2 - 3Yb 20 28 5 13Ce n o 177 4 44
Cr ppm 108 130 9 23Eu 35 112 4 9.6
Co ppm 2.3 2.9 8 1.4Fe% 0.17 0.11 7 0.05Ta 17 18 8 1.4Sc 460 803 8 11
Ni ppm 55 72 8 17Tb 20 13 4 8.1Cs 50 43 6 8.8
H f 20 25 4 13Ir - 1.5 2 6
W 40 43 7 23Th 15 20 7 3.4
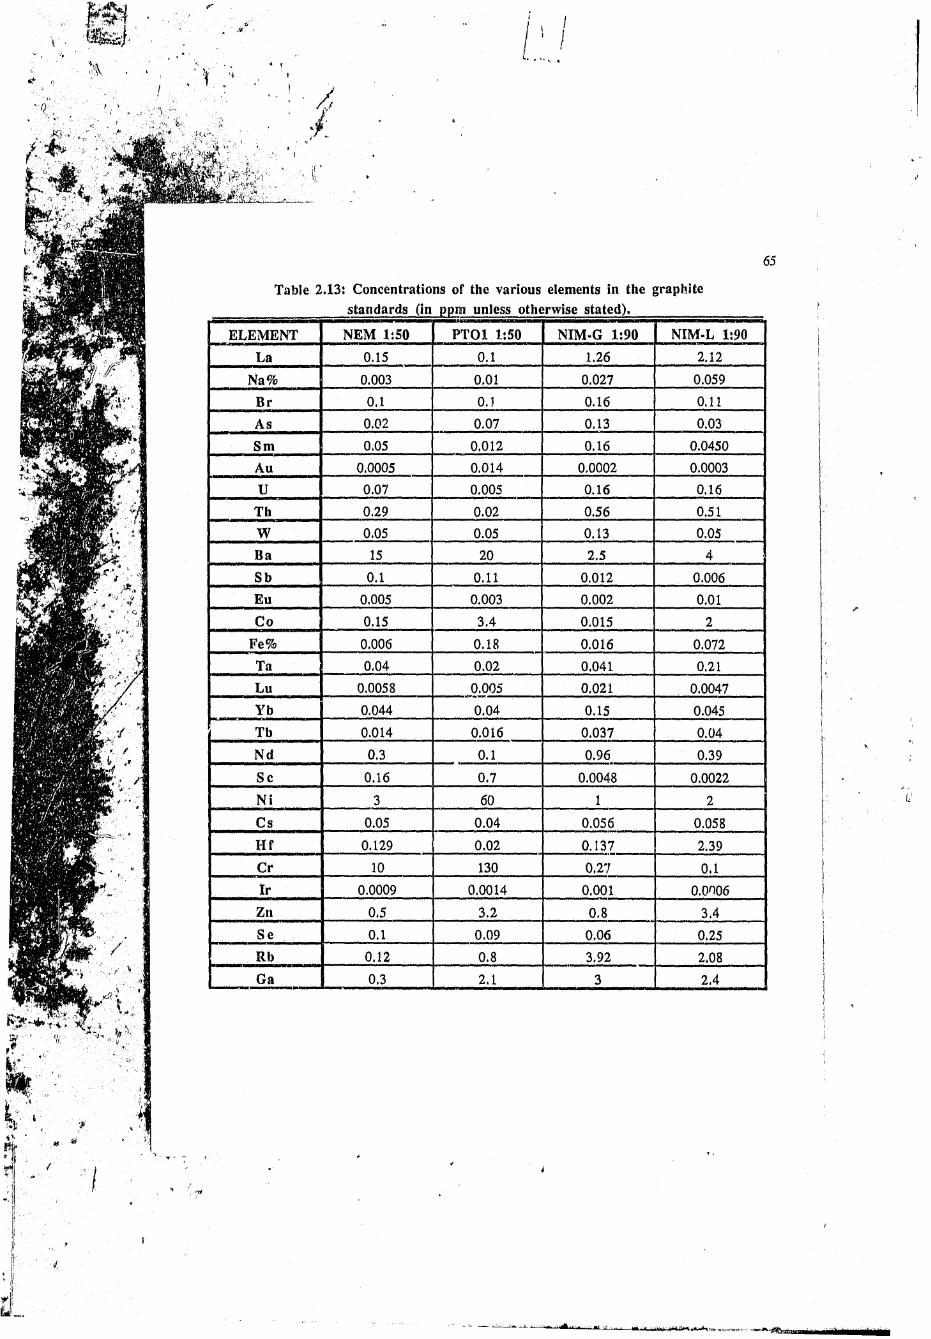
Table 2*13: Concentrations of the various elements in the graphite ___________ standards (in ppm unless otherwise stated). ________
ELEMENT NEM 1:50 PT O l 1:50 NIM-G 1:90 NIM-L 1:90
La 0.15 0.1 1.26 2.12
Na% 0.003 0.01 0.027 0.059
B r 0.1 0.1 0.16 0.11
As 0.02 0.07 0.13 0.03
Sm 0.05 0.012 0.16 0.0450Au 0.0005 0.014 0.0002 0.0003
U 0.07 0.005 0.16 0.16Th 0.29 0.02 0.56 0.51
W 0.05 0.05 0.13 0.05Ba 15 20 2,5 4
Sb 0.1 0.11 0.012 0.006Eu 0.005 0.003 0.002 0.01
Co 0.15 3.4 0.015 2
Fe% 0.006 0.18 0.016 0.072Ta 0.04 0.02 0.041 0.21
Lu 0.0058 0.005 0.021 0.0047Yb 0.044 0.04 0.15 0.045Tb 0.014 0.016 0.037 0.04N d 0.3 0.1 0.96 0.39
S c 0.16 0.7 0.0048 0.0022
. N i 3 60 1 2
Cs 0.05 0.04 0.056 0.058H f 0.129 0.02 0.137 2.39Cr 10 130 0.27 0.1Ir 0.0009 0.0014 0.001 0.0006Zn 0.5 3.2 0.8 3.4Se 0.1 0.09 0.06 0.25Rb 0.12 0.8 3.92 2.08Ga 0.3 2.1 3 2.4

Table 2.13 continued
66
ELEMENT NEM 1:50 P T O l 1:50 NIM-G 1:90 NIM-L 1:90
S r 5 5 3 35
Zr 5 10 5 102
. Ag 0.05 0.04 0.025 0.011
Gd 0.2 - 0.2 0.22
Tin 0.05 - 0.03 -
H o - 0.017 - -
Ti 92.6 - ■ - -
Ca% 0.15 0.11 - -
K% - . 0.065 0.065Mn - - 3.7 110
Cu - - - 0.3
Sn - . 0.1 .
........Dy - - 0.35 .
Mo - - 0.1 -
7.3 APPENDIX;3: ISOTOPES FOR COUNT t-4
_______ Table 2.14: Isotopes for count 1A
Iso tope Energy/Peak (KeV) H alf lifePr-142 1575.5 19.20HK-42 1524.7 12.42HNi-65 1481.7 2.54HNa-24 1368 15.00HCu-64 1345,5 12.75HMn-56 846.8 2.58H
Eu-152M 841,4 9.30HGa-72 630.1 14.10H
Zn-69M 438.6 13.90HTe-127 418 9.4HGd-159 363.5 18.00HIr-194 328.4 17.40HEr-171 308.2 7.5 2H
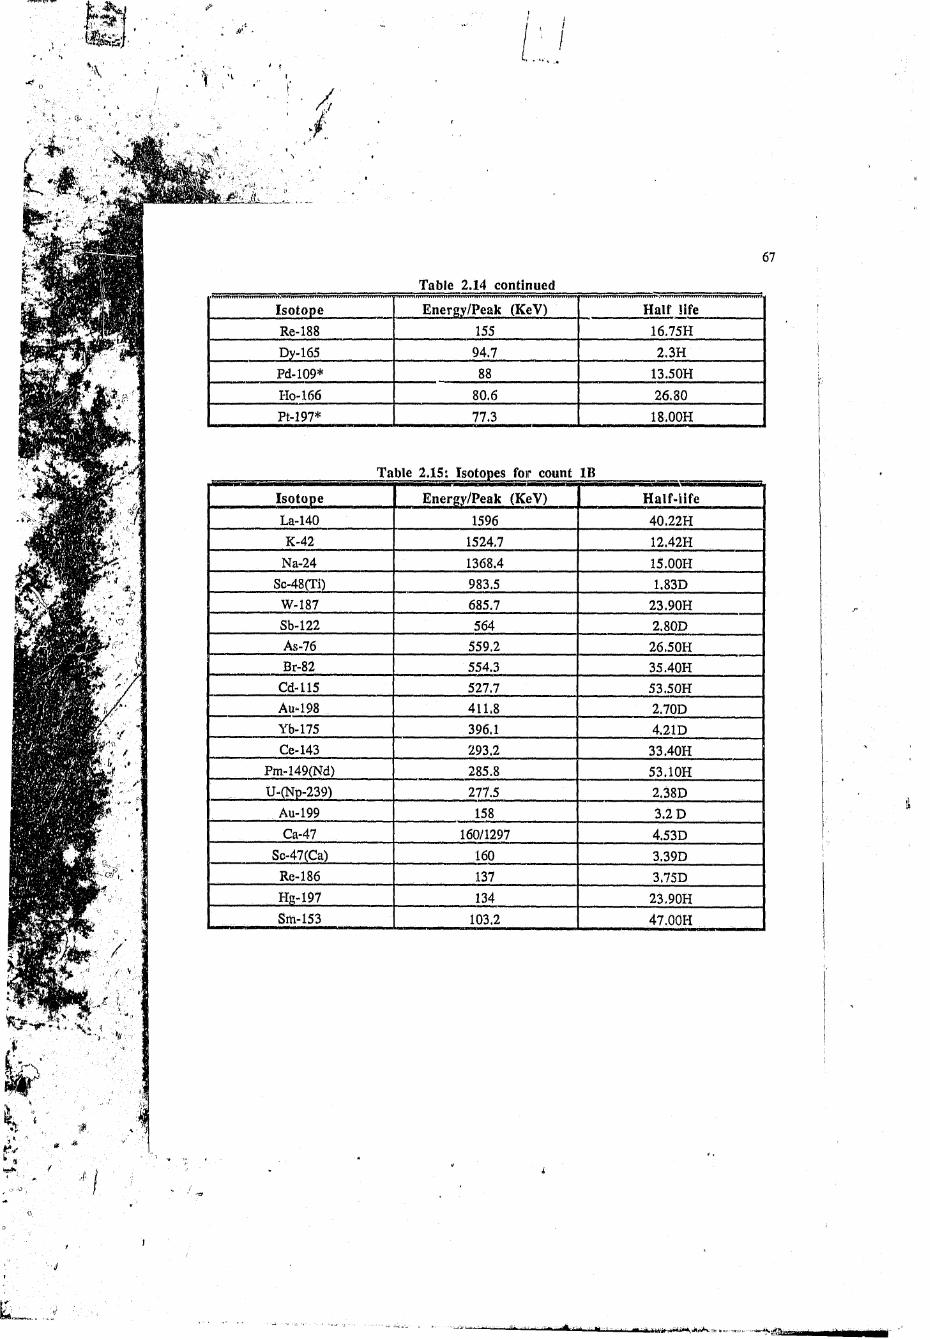
Table 2.14 continued
Isotope Energy/Peak (KeV) H alf lifeRe-188 155 16.75HDy-165 94.7 2.3HPd-109* 88 13.50HHo-166 80.6 26.80Pt-197* 77.3 18.00H
Table 2.15; Isotopes for count IB
Isotope Energy/Peak (KeV) H alf-lifeLa-140 1596 40.22HK-42 1524.7 12.42H
Na-24 1368.4 15.00HSc-48 (Ti) 983.5 1.83D
W-187 685.7 23.90HSb-122 564 2.80DAs-76 559.2 26.50HBr-82 554.3 35.40H
Cd-115 527.7 53.50HAu-198 411.8 2.70DYb-175 396.1 4.21DCe-143 293.2 33.40H
Pm-l49(Nd) 285.8 53.10HU-(Np-239) 277.5 2.38D
Au-199 158 3.2 DCa-47 160/1297 4.53D
Sc-47 (Ca) 160 3.39DRe-186 137 3.75DHr-197 134 23.90HSm-153 103.2 47.00H

Table 2.16: Isotopes for count 2
Iso tope Energy/Peak (KeV)
Rb-86 1076.6 18.66D
Sn-125 1067 9.40D
Ba-131 496.3 12.00D
Au-198 411.8 2.7D
Lu-177 208 6.72D
Os-191 129.4 14.6D
Nd-147 91/531 11.06D
Table 2.17: Ta isotopes for flux monitoring.
Iso tope Energy/Peak (KeV) H alf-life
Ta-182 1231 115.00D
1221.3
1189
Table 2.18 Im portant short-lived isotopes.
Iso tope Half-life (min) Energy/Peak (KeV)
Mr-27 9.5 170.7
Al-28 2.3 1779
V-52 3,8 1434
Ti-51 5.8 320
Cu-66 5.1 1039.2
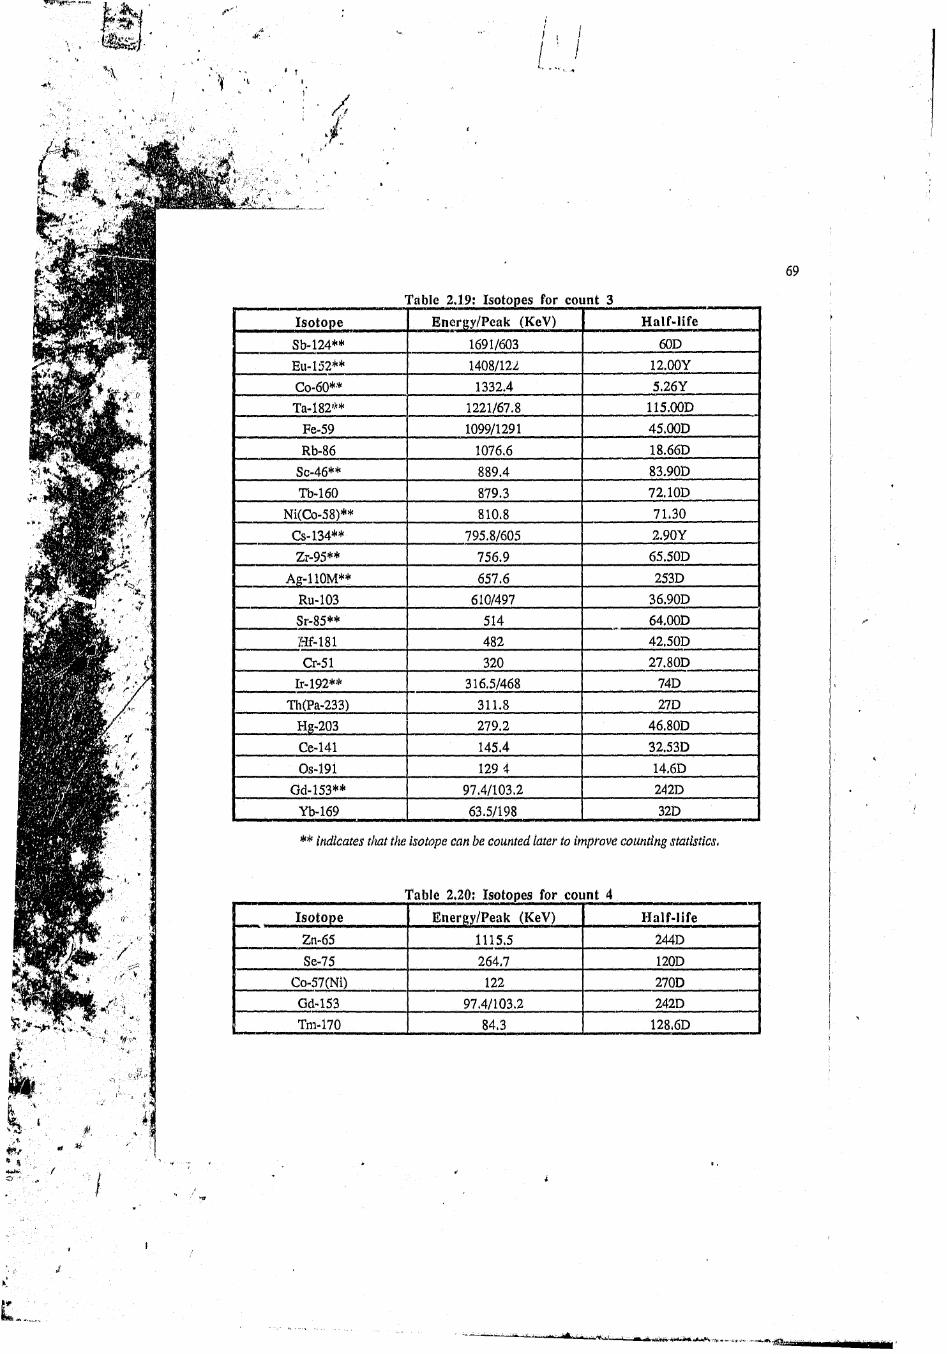
Tabic 2.19: Isotopes for count 3
Isotope Energy/Peak (KeV) H alf-life
Sb-124** 1691/603 60D
Eu-152** 1408/122 12.00Y
Co-60** 1332.4 5.26YTa-I82'v* 1221/67.8 115.00D
Fe-59 1099/1291 45.00D
Rb-86 1076.6 18.66D
Sc-46** 889.4 83.90D
Tb-160 879.3 72.10D
Ni(Co-58)** 810.8 71.30Cs-134** 795.8/605 2.90Y
Zr-95** 756.9 65.50D
Ag-110M** 657.6 253DRu-103 610/497 36.90DSr-85** 514 64.00D
Hf-181 482 42.50DCr-51 320 27.80D
Ir-192** 316.5/468 74D
Th(Pa-233) 311.8 27DHg-203 279.2 46.80D
Ce-141 145.4 32.53D
Os-191 129 4 14.6D
Gd-153** 97.4/103.2 242DYb-169 63.5/198 32D
** indicates that the isotope can be counted later to improve counting statistics,
rrable 2.20: Isotopes for count 4
Isotope Energy/Peak (KeV) Ila lf-life
Zn-65 1115.5 244DSe-75 264.7 120D
Co-57(Ni) 122 270DGd-153 97.4/103.2 242DTm-170 84.3 128.6D
i

70
1A.AEf.EKPJ .̂4i.AMALXlI.CAL.E>ATA
Table 3.1 Data for Finsch diamonds with silicate inclusions (in ppbw).
Element FOG1 FO G 2 FPG 1 FPG 2 FPG 3 FPG 4 FPG S FOM1 FO C I
La - 0.79 11.6 0.72 0.73 - 0.32 0.33 186
Ce - - 1062 - - - 279 148 -
Sm 4.26 3.74 5.12 1.25 0.48 0,02 0.009 0.009 »
Eu 0.29 0.2 - ~ - . - - .
Tb 0.11 0.06 - - - - - - -
Ho 0.79 0.35 - - - - - - 0.07
Yb 2,2 0.87 - 0.85 - - - -
Lu 1.28 0.55 - 0.78 - - - - -
Ca 243864 142295 - - . . - - _
Na 6442 3329 433 112 996 7,62 519 142477 701
K 12900 3041 6813 418 638 N/A N/A N/A N/A
Cr 1201 463 131745 22319 50489 82817 68676 2929 399
Sc 132 65.9 321 67 291 350 68.7 36,3
Ga 45.3 25.2 - 18.7 - T - - -
As - * - - - 2.08 - .
Mn (counts) 4.4 E9 2.4 E9 5.5 E8 1.8 E8 8.3 E8 N/A N/A - .
Fe 623000 354667 109233 30947 134300 131179 6882 18410 172838Ni 812 1900 14057 991 1460 5600 569 3508 567Co 243 165 434 61.8 177 257 82,5 225 69.0
Cu * » 1.30 E5 2.2 E4 * * - . . _
Au 0.15 0.25 - » -
Ir - - 3.8 0.12 0.21 - * 0.14 _
W - - 3.7 . - 2.11 M
RATIOS
Cr/Sc 9.1 7.0 410 333 174 232 196 42.6 11Mn/Fe 0.07 0.07 0.05 0.06 0,06 _ to W
Ca/Cr 203 307 _ M U ..
Au/[r - ■ 0.066 - - - - <*

71
Table 3.2 Data for Finsch diamonds with sulphide inclusions and inclusion free _________________________ Finsch diamonds (in ppbw)._________________________
Element FSX FS2 FIF1 FIF2 FIF3 FIF4 FIF5 F IF 6 F B I
La 0.72 2.8 - - - - - - 183
Ce £8.8 123 . . - - - - - 2795
Nd - - - - - - 24.5
Sm 0.01 0.002 - - . - - - 0.17
Eu 0.007 0.004 - - - - - 0.06
Tb . - - - - 0.27
Yb 0.03 - - - - - - - 1.12
U - - - - - - 0,04
Tli 2.54 4.18 - - - - - - 128
Na 1024 175 8.32 14.9 3.86 4.6 906 0.69 19245
Cr 370 117 15.3 10,2 - 50 32 2394
10.4 0.61 - 0.4 0.71 - 1.76 5 58.5
K - - - ~ - - 41634 - N/A
Ca - - - - - - 12190 9000 N/A
Mn (counts) - - - - - 4*3 E7 - N/A
Ba - 143 - - - - - - 1212
Cs 2.27 1.53 - - - - - - 17.1Br 8.9 3.17 2*8 - • - - - 359
Hf 0.03 - - - - - - - 0.15
W 21.5 4*42 3*82 1.45 - - - 16*1
As - 0.07 - 0.18 - .. - 5.10Sb 0.14 0,06 - - - - - 0.34
Ta 1.56 0*71 - - - 0*39 0.61 3.20Fe 12253 4642 - - - 213 8352 19035 83450Ni 751 438 4844 - . 620 687 3299 2585
Co 17 6.43 4*88 - 1.5 - - 43*4 59*4Au - 0.06 9.8 0.9 0.03 - - _ 0.12
Ir - 0*15 _ - 0.12
RATIOS
Cr/Sc 35.5 192 - 25*5 - - 28 6.4 41

72
Table 3.3 Data for Premier diamonds with silicate inclusions (in ppbw)
Elements POM1 POM2 POC1 P C I PC2 PPG 1
La 3.94 1.98 _ 4.64
Ce 22.7 232 29 1.87
Sm 2.21 0.97 2.26 0.69 0.36
Eu 1.35 0.85 0.37
Tb 2.99
Yb 6.94 .. 7.5
Lu 0.41 0.78 0.57 _ 0.6
Ca 253020 N/A 1292282 N/A 145537
Na 69338 8079 13695 1528 25272 1084
K 3146 2043 133 2141 4785
Cr 4258 9510 3182 7874 5925 14075
Sc 106 251 447 10.6 0.55 51
Hf 4.91 „ _ „
As 1.02
Fe 350437 68284 604372 108470 308415 118470
Ni 3108 17270 1644 3551 6269 38025
Co 425 1003 667 253 557 974
Au _ . 0.15
Ir _ 0.2
RATIOS
Cr/Sc 40 38 7 743 10773 276
Ca/Cr 60 406 25
Co/Fe 0.001 0.01 0.001 0.002 0.002 0.01
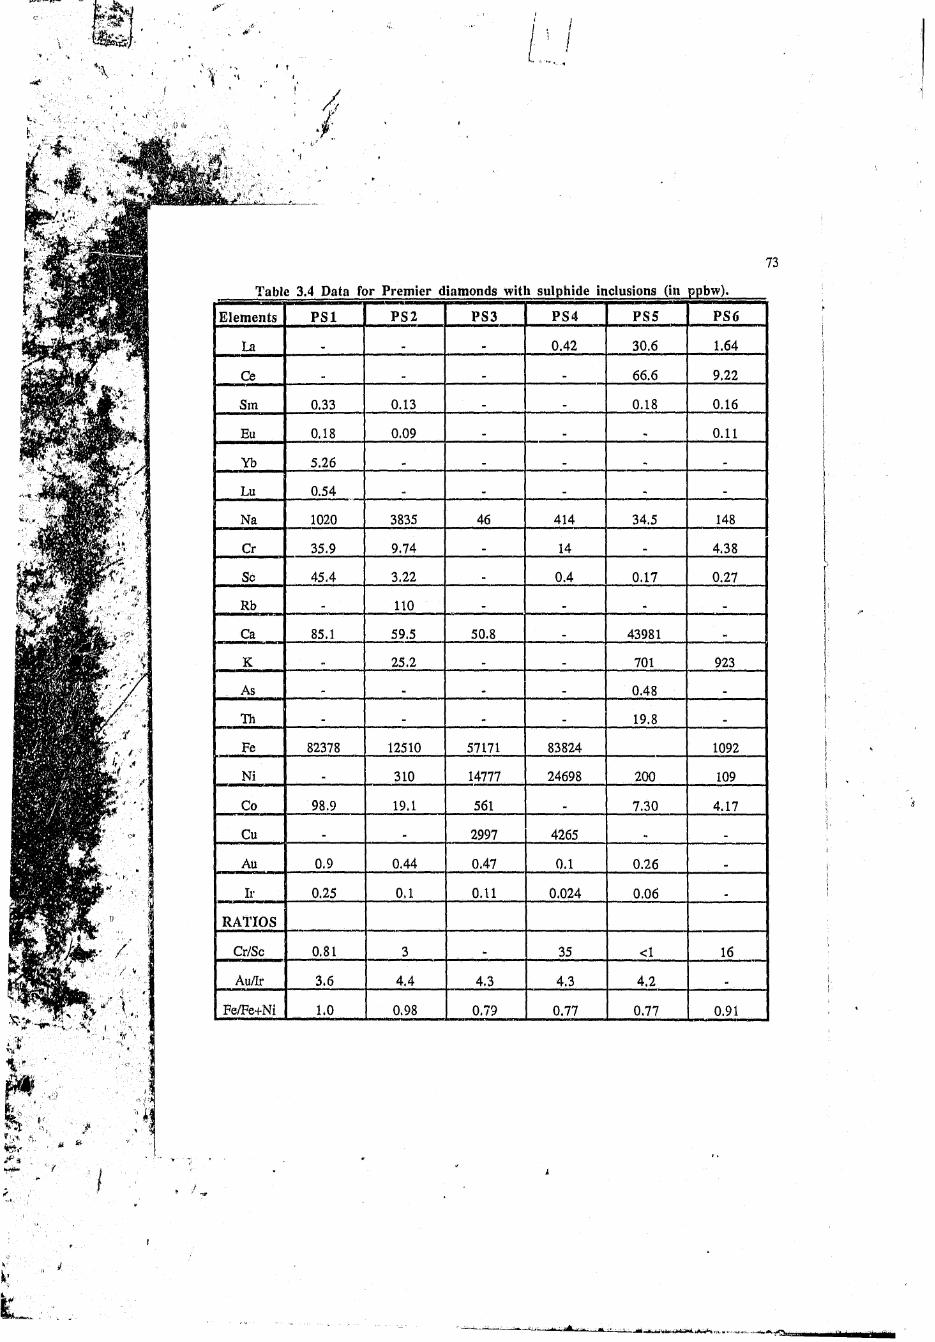
Table 3.4 Data for Premier diamonds with sulphide inclusions (in ppbw).
Elements PS1 PS2 PS3 PS4 PS5 P S 6
La „ „ 0.42 30.6 1.64
Ce * .. 66.6 9.22
Sm 0.33 0.13 _ _ 0.18 0.16
Eu 0.18 0.09 * 0.11
Yb 5.26 _ _ _
Lu 0.54 _ ..
Na 1020 3835 46 414 34.5 148
Cr 35.9 9.74 14 4.38
Sc 45.4 3.22 0.4 0.17 0.27
Rb 110 _
Ca 85.1 59.5 50.8 _ 43981
K 25.2 _ 701 923
As _ 0.48
Th _ .. _ 19.8
Fe 82378 12510 57171 83824 1092
Ni _ 310 14777 24698 200 109
Co 98.9 19.1 561 7.30 4.17
Cu _ 2997 4265 .
Au 0.9 0.44 0.47 0.1 0.26 _
Ir 0.25 0.1 0.11 0.024 0.06
RATIOS
Cr/Sc 0.81 3 _ 35 <1 16
Au/Ir 3.6 4.4 4.3 4.3 4.2
Fe/Fe+Ni 1.0 0.98 0.79 0.77 0.77 0.91

Fig.3.5 Data for diamonds from Romaria, Brazil (in ppbw).
Elem ents D2 *>3 D4 DS D 6 D7 D 8 D9 D10
La 456 110 - 14.4 - 103 231 5.06 1.83
Ce «. _ _ 367 595 - -
Sm 52 3.7 _ 0*89 - 5.21 22.8 - 0.22
Eu - . - 0.2 1.43 - -
Tt> 12.3 - - - - - - - -
Yb _ - M . 21.6 - - -
U 5.39 . - - - - - - -
Th 21 105 M - 7.72 - 15.3 -
Na 3722 4165 387 - 13.8 223 130 107
Ba 2767 4020 - * - - » - -
Cs - - - - - 1.62 - - -
Cr . 6.87 - 1.36 1.04 - 1.26
Sc _ - - - 1.58 1.4 0.72 0.18
Br 3 7.03 0.58 0.46 - 8.28 6.49 3.39 -
Hf . - - - - 1.53 - - -
W - 7.4 _ _ 1.72 0.21 - -
As 4 12.2 0.8 1.08 1.68 - - -
Sb _ _ * - - 1.79 - - -
Ta 4.19 - - - - 3.32 - 5.59 -
Fe - _ 43600 - 4200 12500 - 9800
Ni 715 > 3537 6577 4724 - 10039 -
Co _ _ 180 - 171 4.24 71.9 - 110
Au 0.04 0.04 0.002 0.06 0.0004 9 0.55 13.5 0.69
Ir M ■M - - - - - 0.17
Cr/Sc - - - - 0.86 0.75 - 7
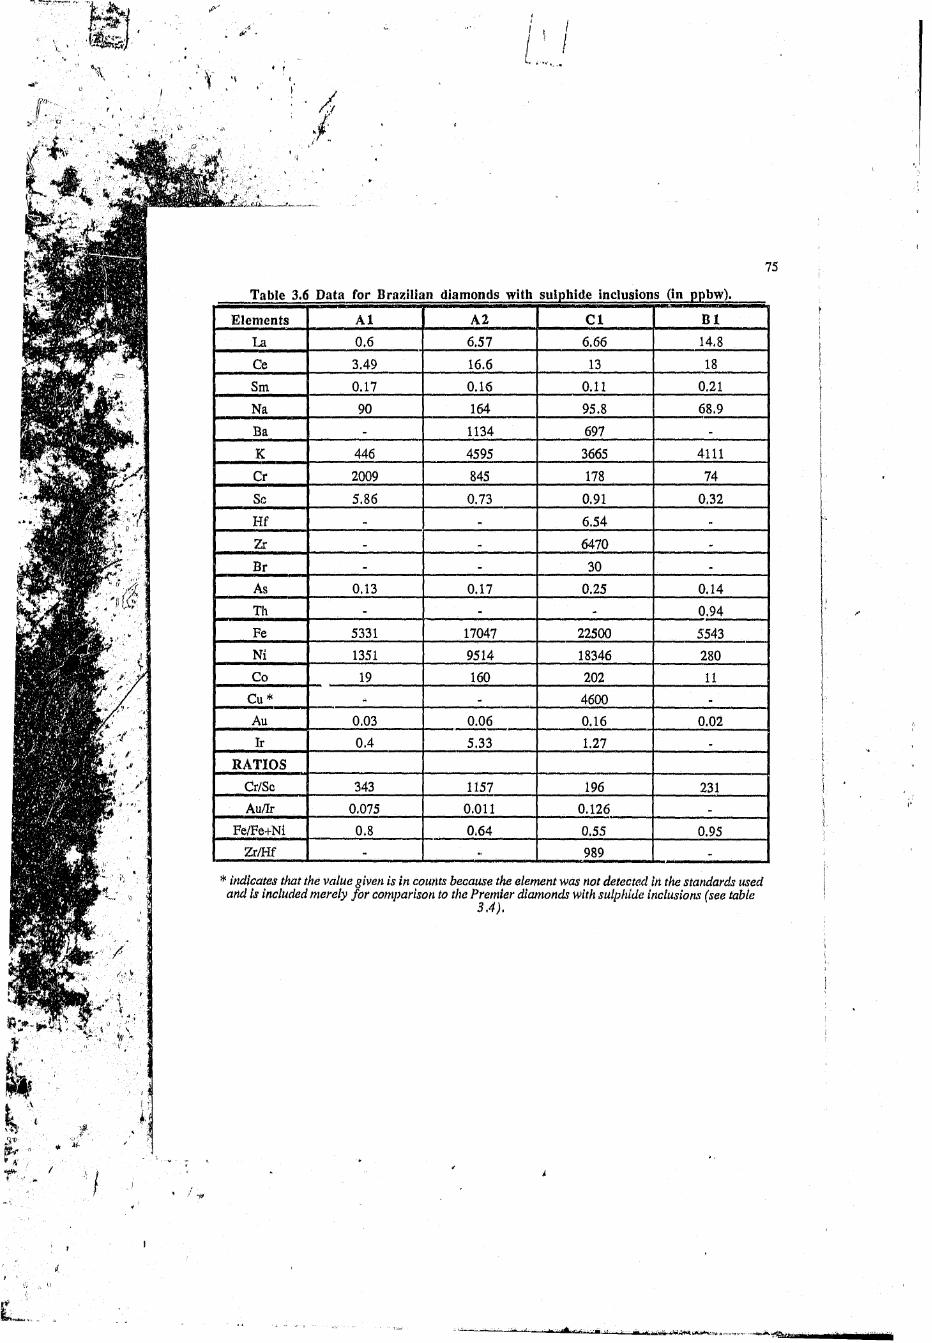
Table 3.6 Data for Brazilian diamonds with sulphide inclusions (in ppbw).
Elements A1 A2 C l B 1
La 0.6 6.57 6.66 14,8
Ce 3.49 16.6 13 18
Sm 0.17 0.16 0.11 0.21
Na 90 164 95.8 68.9
Ba - 1134 697 -
K 446 4595 3665 4111
Cr 2009 845 178 74
Sc 5.86 0.73 0.91 0,32
Hf - - 6.54 -
Zr - - 6470 -
Br - - 30 -
As 0.13 0.17 0.25 0.14Th - • 0.94Fe 5331 17047 22500 5543Ni 1351 9514 18346 280Co 19 160 202 11
Cu * - - 4600Au 0.03 0.06 0.16 0.02Ir 0.4 5.33 1.27 .
RATIOSCr/Sc 343 1157 196 231Au/Ir 0.075 0.011 0.126
Fe/Fe+Ni 0.8 0.64 0.55 0.95Zr/Hf - •• 989 -
* indicates that the value given is in counts because the element was not detected in the standards used and is included merely fo r comparison to the Premier diamonds with sulphide inclusions (see table
i
* '.......a- - m j ■flu.Mivniii i j V ' j f f l i r ' i i - * - - ! ! I, I I

Table 3.7; Data for diamonds from George Creek, Colorado (in ppbw).
Elem ents GC1 GC2 GC3 GC5 G C 6 G C7 G C 8 GC9
La 972 1.82 825 - - - 7.3 33.5
Ce 5521 - 3511 - - - - 401
Nd 54.1 - 30.6 - - - - -
Sm 99.4 - 73.1 - - - 0.24 6.7
Eu 7.45 - 4.72 - - - - 1.18
Tb 27 - 19.3 - - - - -
Yb 88.1 - - - - - - -
U 33.3 - - - - - - -
Th 156 - 21.9 - • - - -
Na 3375 102 5639 2639 - - 395 2347
Ba 2040 - 8007 - - - - -
Cr 0.94 53.7 0.81 70.5 - - - -
Sc 11.7 • 4.08 0.49 - - - 6.34
Br 19.9 - - - 8.09 - - -
Hf 0.49 - 0.31 - - • - -
As 2.47 - - - - - - -
Ta 8.04 - - • - - - -
Fe 33900 5269 23500 8722 - 15236 - 14800
Ni 42J6 4886 1246 1411 - 4750 - 4112
Co 252 248 47.4 33.1 14.6 112 10.7 179
Au - - 0.27 0.03 - - - 0.05
Ir 0.11 ■ - - - - - -
Cr/Sc 0.08 - 0.20 144 0.60

77
Table 3.8 Data for inclusion-free Chinese diamonds.
Element CH J2 CH J17 CHA36
Na 4.64 5.55 3.4
Sc 0.5 0.26 1.28
Fe 1530 2973 _
Co 1.95 487 10.1
Ni 87 455
Au 0.03
Ir _ 0.13 _
RATIOS
Co/Ni 0.02 1.07
Fe/Ni 17.6 6.5
(SEE CHAPTERS)
Table 5.1: SC13 values for the Chinese Diamond and the George Creek diamond.
Diamond 8 C 13(°/oo) Std. Deviation. Type
CH2-ext. -3.3 0.14 U
CH2-int. -3.6 0.14 U
CH2-int. -3.6 0.14 uGC3 -16,4 0.12 E
The TYPE column indicates a peridotitic (P), eclogitic (E) or unknown (U) parageneisis.

Table 5.2 8C 13 values for the Brazilian diamonds.
Brazilian diamonds. 8C 13(°/oo) Std. Deviation j Type
Al-ext. -3.2 0.14 PAl-int, -3 0.14 P
A2-ext. -6.2 0.14 PA2-int. -5.9 0.14 PBl-ext. -3.9 0.14 PBl-int, -4 0.14 PCl-ext. -5.5 0.14 PCl-int. -5.7 0.14 PD2-ext. -5.3 0.14 UD2-int. -6.3 0.14 uD3-ext. -5,2 0.14 uD3-int. -4.1 0.14 uD5-ext, -5.2 0.14 uD5-int, -5.5 0.14 u
D6 -5.2 0.14 uD8 -3.74 0.10 E
Table 5.3: SC*3 values for the Prem ier diamonds with sulphide inclusions.
Prem ier diamond 5Cl3(0/oo) Std. Deviation. . .....TypePSl-ext. -4.9 0.14 EPS 1-int. -4.6 0.14 EPS2~ext. -4.9 0.14 EPS2-int,
OOt 0.14 E
PS3-ext. -4.4 0.14 EPS3-int. -4.5 0.14 EPS4-ext.
OOt 0.14 E
PS4-int. -4.7 0.14 EPS5-ext, -4.8 0.14 EPS5-int. -4.5 0.14 EPS6-ext. -4.3 0.14 EPS6-int. -4.4 0.14 E

Table 5.4 8C 13 values for Prem ier diamonds with silicate inclusions.
Table 5.5: 8C 13 values for the Finsch diamonds w ithout visible silicate inclusions.
Finsch diamond 5 C 13(% o) Std. Deviation. TypeFIF1 -4.14 0.1 UFS1 -6.51 0.1 EFS2 -4.55 0.1 PFBI -5.20 0.1 E
Table 5.6: SC13 values for the Finsch diamonds w ith silicate inclusions.
Finsch diamond. 8 C 13(°/oo) Std. Deviation Type
FOG 1-ext. -7.7 0.14 EFOGl-int. -7.7 0.14 EFOG2-ext. -3.3 0.14 EFOG2-int. -3.4 0.14 EFPGl-ext. -5.9 0.14 PFPG l-int -6.2 0.14 PFPG2-ext. -6.1 0.14 PFPG2-int. -6.4 0.14 P
FPG4 -4.51 0.11 PFPG5 -4.20 0.11 P
-5.90 0.11 E
The TYPE column Indicates a peridotitic (P), eclogitic (E) or unknown (U) paragenesls.

80
£ i ^ E E E R M £ E £
Bergman, S.G. (1987). Lamproites and other potassium-rich igneous rocks: a review of
their occurrence, mineralogy and geochemistry. In: Fitton, J.G. & Upton, B.G.J,
(eds), 1987, Alkaline. Igneous Rocks. Geological Society Special Publication No. 30,
pp.103-190.
Bibby, D.M., Erasmus, C,S„ Fesq, H.W., Kable, E.J.D., Sellschop, J.P.F. & Steel,
T.W, (1975). The determination of trace elements in natural diamonds by
instrumental neutron activation analysis. Johannesburg National Institute for
Bibby, D.M. (1982). Impurities in natural diamond. In: .Chemistry, and Physics od .Carbon. 18t (ed.
P.A. Thrower), Marcel Dekker, New York, pp,l-91.
Bharuth-Ram, K,, Haricharun, H., Govender, N. & Sellschop, J.P.F. (1991). 57j?e
Mossbauer spectroscopy of synthetic diamond. The 41st Annual Diamond Conference
Boyd, F.R. & Gurney, JJ . (1982). Low calcium garnets: Keys to craton stucture and diamond
Boyd, F.R. & Gurney, JJ , (1986). Diamonds and the African lithosphere. Science. 232, pp,2533-
Yakutian Diamonds. Hflh_Intemation.al... Kimberlite Conference Extended Abstracts. CPRM
Special Publication 2/91, Brasilia, pp.293-295.
Clifford, T.N, (1970). The structural framework of Africa. In T,N. Clifford and I.G.
Oxford, England. Paper 31.
2546.
Bulanova, G,P. (1991). Compositional evolution of syngenetic inclusions of ultrabasic association in
Craig, H. (1953). The geochemistry of the stable carbon isotopes. , 3 ,
pp.53-92.
Damask, A.C, (1958), Effects of neutron irradiation in diamond.
Phvsics. 29, pp.1590-1593,

Dawson, J.B. & Stephens, W.E. (1975). Statistical classification of garnets from
kimberlite and associated xenoliths. J. Geoi.. 83, pp.589-607.
Dawson, J.B. (1984). Contrasting types of upper mantle metasomatism, TIKC. 2,
pp.289-294.
Dawson, J.B. (1990). Kimberlites aodTheir Xenoliths. Springer Verlag. Berlin, pp, 1-154.
De Bruin,. M. (1992), Present and future position of Neutron Activation Analysis. L,
Deines, P., Gurney, J.J. & Harris, J.W. (1984). Associated chemical and carbon isotopic
composition in diamonds from Finsch and Premier kimberlite, South Africa. Geochim.
Cosmochim. Acta.. 48, pp.325-342.
Deines, P., Karris, J.W.& Gurney, J.J, (1987). Carbon isotopic composition, nitrogen
content and inclusion composition of diamonds from the Roberts Victor kimberlite,
South Africa: Evidence for l^C depletion in the mantle. Geochim.Cosmochim, Acta.
51, pp,1227-1243.
Deines, P„ Harris, J.W., Spear, P.M. and Gurney, J.J. (1989), Nitrogen and 13c content
of Finsch and Premier diamonds and their implications, Geochim, Cosmochim. Acta.
53, pp.1367-1378.
Erasmus, C.S., Sellschop, J.P.F., Bibby, D.M., Fesq, H,W,, Kable, E.J.D., Keddy,
R.J., Hawkins, D.M., Mingay, D.W., Rasmussen, S.E., Renan, M.J., Watterson,
J.I.W, (1977). Natural diamonds - major, minor and trace impurities in relation to
source and physical properties. Journal of Radioanalvtical C h em istry . 38, pp. 133-146.
Fardy, J.J. & Farrar, Y.J, (1992). Trace element analysis of Argyle Diamonds using
instrumental neutron activation analysis. J, Radioanal, Nucl, Chem. Letters, 164, (5),
pp.337-345,
Fesq, H.W., Bibby, D.M,, Erasmus, C.S., Kable, EJ.D. & Sellschop, (1975), A comparative trace
element study of diamonds from Premier, Finsch and Jagersfontein mines, South Africa, In:
Phvsics and Chemistry of the Earth, 9, (eds L,H. Ahrens, J.B. Dawson, A,R. Duncan and A.J.
Erlank), Pergamon press, Oxford, pp,817-836,

Fesq, H.W., Kable, E.J.D., Gurney, J.J., Sellschop, J.P.F. & r teel, T.W. (1976). The
geochemistry of some South African kimberlites and associated heavy minerals
Johannesburg National Institute for Metallurgy, Report.N.o, 17-03i
Fritch, E. & Rossman, G.R. (1987). An update on colour in gems. Part 1: Introduction
and colours caused by dispersed metal ions. Gems and-Gemology., 23, No.3, pp. 126-134.
Futergendler, S.I. (1956). The study of inclusions in diamond by the method of x-ray
structural analysis, (in Russian) Zapiski Vsesoyznyi Mineralogica Obshchestva. 85,
pp.568-656.
Griffen, W.L., Jaques, A.L. Sie, S.H., Ryan, C.G., Cousens, D.R. & Suter G.F.
(1988). Conditions of diamond growth: a proton microprobe study of inclusions in
West Australian diamonds. Contrib, Mineral. Petrol. 99, pp.143-158.
Griffen, W.L., Gurney, J.J. & Ryan C.G. (1992). Variations in trapping temperatures and
trace elements in peridotite-suite inclusions from African diamonds: evidence for two
inclusion suites, and implications for lithosphere stratigraphy. Contrib. Mineral Petrol.
110, pp.1-15.
Gurney, J.J., Fesq, H.W., Kable, E.J.D. (1973). Clinopyroxene-ilmenite intergrowths
from kimberlite: A re-appraisal, Lesotho Kimberlites. pp.238-253,
Gurney, J,J. (1989). Diamonds. Geol. Soc. Spec, pupl. No, 14. 2. pp.935-965.
Gurney, J.J. (1990). The diamondiferous roots of our wandering continent. S. Afr. J,
QS2L, 93, (3), pp.424-434.
Haggerty, S.E. (1986). Diamond genesis in a multiply-constrained model. Nature. 320, pp,34-38.
Haggerty, S.E, (1991). Source regions for oxide., sulphides and metals in the upper
mantle: Clues to the stability of diamonds, and the origin of kimberlites and lamproites.
Fifth International Kimberlite Conference Extended Abstracts, CPRM Special
Publication 2/91, Brasilia, pp.293-295,
Haggerty, S.E., Fung, A.T. and Burt, D.M. (1994). Apatite and compositional zoning in garnet:
Implications for phosphorous metasomatism and the evolution of eclogites in the upper mantle,

Hallowes, K.K, (1933). The Poetry of Geology. Thomas Murby & Co, London, pp. 31&38.
Harte, B., Gurney, J J , & Harris, J.W. (1980). The formation of peridotite suite inclusions in
diamonds. Contrib. Mineral. Petrol. 72. pp,181-190.
Henderson, P.H. (1982). Inorganic Geochemistry, Pergamon Press, Oxford, pp.88-94.
Hervig, R.L., Smith, J.V., Steel, I.M., Gurney, J.J., Meyer, H.O.A. & Harris, J.W.
(1980a). Diamonds: Minor Elements in Silicate Inclusions: Pressure-Temperature
Implications. J. Geophysical Research. 85, (B12), pp.6919-6929.
Hervig, R.L., Smith, J.V., Steel, I.M. and Dawson, J.B. (1980b). Fertile and barren Al-
Cr-spinel hartzburgites from the upper mantle: Ion and electron probe analyses of trace
elements in olivine and orthopyroxene: Relation to lhertzolites. Earth Planet. Sci. Lett,. 50,
pp.41-58.
Hevesy, G., Levi, H. (1936). Det. Kgl. Danske Videnskabemes Selskab, Mathematiskfysiske
Meddeldelser, 14, No.5,1.
Hill, SJ. (1989). A study of the diamonds and xenoliths from the Star kimberlite, Orange
Free State, South Africa. M.S. thesis, University of Cape Town.
Hoffman, E.L. (1992). Instrumental neutron activation in geoanalysis. In: G.E.M. Hall
(Editor). Geoanalysis. J. Geochem. Explor.. 44, pp.297-319.
Irving, A J. (1978). A review of expeimental studies of crystal/liquid trace element pardoning,
Geochim,_Cosmochim, Acta.,42. pp,743-770,
Irving, A.J. &Frey, F.A. (1978). Distribution of trace elements betwween garnet megacrysts and
host volcanic liquids of kimberlitic to rhyolitic composition. Geochim. Cosmochim. Acta..42.
pp,771-787.
Jaques, A.L., Hall, A.E., Sheraton, J,W., Smith, C.B,, Sun, S-S., Drew, R.M., Foudoulis, C. &
Ellingsen, K. (1989). Composition of crystalline inclusions and C-isotopic composition of Argyle
and EUendale diamonds. In: Kimberlites and Related Rocks, vol 2. Proceedings 4th Tnt Kimh
Conf. Geol. Soc. Spec, Publ. 14. pp. 966-987.
Jervis, R.E. (1992). Hairs, criminals, moonrocks, metals, diseases, polluters! Where next
for nuclear analytical chemistry? L__Radioanal. Nucl. Chem.. 160, No. 1, pp.21-
30.
Kaiser, W, and Bond, W.L. (1959), Nitrogen , a major impurity in common type I
diamond, Phvsics Review. 115, pp.857-865.
Kirkley, M.B., Otter, M.L., Gurney, J.J. & Hill, S.J. (1991). Diamond carbon sources: A
comparison of carbon isotope models. Fifth .International ..Kimberlite Conference
Extended Abstracts. CPRM Special Publication 2/91, Brasilia, pp.293-295,
Koeberl, C. (1991). Neutron Activation Analysis course notes (unpublished). University of Vienna,
Austria.
Kramers, J.G, (1979). Lead, uranium, strontium, potassium and rubidium in inclusion-
bearing diamonds and mantle-derived xenoliths from Southern Africa. Earth Planet Sci
Lett, 42, pp.58-70.
Levy, P.W. & Hammerer, O.F. (1955). Radiation damage in diamond. Physical Review.
100, pp.1787-1788.
Liang, Y. & Elthon, D. (1990). Evidence from chromium abundances in mantle locks for extraction
of picrite and komatiite melts, Nature. 343, pp.551-553.
Manning, P.G. (1967a). The optical absorption spectra of the garnets almandine-pyrope,
pyrope and spessartine and some structural interpretations of mineralogical significance.
Canadian Mineralogist. 9, No.2, pp.237-251.
McCandless, T.E. & Gurney, J.J. (1989). Sodium in garnet and potassium in clinopyroxene: criteria
for classifying mantle xenoliths. 4th International Kimberlite Conference. Kimberlites and Related
Rocks. 2, pp.827-S32.
McCallum, M,E. XRF analyses of kimberlites from North America (unpublished). Pers
comm.
McDonald, I. (1993), The analysis of the platinum-group elements by Neutron Activation Analysis
and their behaviour in fire-assay and natural Igneous melts in the presence of a carbonaceous
volatile phase. Ph.D. thesis (unpublished), University of Cape Town.

Marsh, N. & Dodd, C. (1986). XRF analyses of the kimberlitic rocks of Western
Australia. In: Excursion guide to the kimberlitic rocks of Western. Australia. Fourth
Kimberlite Conference, Perth Australia, pp. 1-253.
Meyer, H.O.A. (1985). Genesis of diamond: A mantle saga, American Mineralogist, 70, pp.344-
355.
Meyer, H.O.A. and Boyd, F.R. (1972). Composition and origin of crystalline inclusions
in natural diamonds. Geochimica et Cosmochimica Acta. 36, pp. 1255-1273.
Meyer, H.O.A. (1987). Inclusions in diamond. In: P.H. Nixon, Ed., Mantle Xenoliths.
John Wiley, New York, pp.501-522.
Mitchell, R.H, (1986). Kimberlites: Mineralogy. .Geochemistry and Petrology. Plenum
Press, New York.
Moore, R.O. & Gurney, J.J. (1988). Mineral inclusions in diamonds from the Monastery kimberlite,
South Africa. In: Kimberlites andRelatedRocks, vol 2. Proceedings 4th Int Kimb Conf, Geol Soc
Spec Publ. 14, pp. 1029-1041.
Nier, A.O. and Gulbransen, E.A. (1939). Variations in the relative abundance of the
carbon isotopes. Am. Chem. Soc.J.. 61, pp.697-698.
Nixon, P.H., van Calsteren, P.W.C., Boyd, F.R. & Hawkesworth, C J. (1987). Harzburgites with
garnets of diamond facies from southern African kimberlites. In: P.H. Nixon, Ed., Mantle
Xenoliths. John Wiley, New York, pp.523-532.
Orlov, Y.L, (1973). The Mineralogy of the Diamond. Izdatel'stva Nauka.(Trans., John
Wiley and Sons, New York, 1977).
Otter, M.L. & Gurney, J.J. (1988). Mineral inclusions in diamonds from the Sloan diatremes,
Colorado-Wyoming State Line kimberlite district, North America. In: Kimberlites and
RelatedRocks. vol 2. Proceedings 4th Int Kimb Conf. Geol Soc Spec Publ 14, pp. 1042-1053.
Otter, M.L. (1989). Diamonds and their mineral inclusions from the Sloan diatremes of the
Colorado-Wyoming State Line kimberlite district, North America. Ph.D thesis, (unpubl).
University of Cape Town,
Otter, M.L., Gurney, J.J.& McCandless, T.E. (1991). The growth environment of Sloan
Diamonds: inferences based on their carbon isotope composition. Fifth International
Kimberlite Conference Extended Abstracts. CPRM Special Publication 2/91, Brasilia,
pp,439-442.
Pike, J. , Slezak, T„ Pappas, W. & Haldane, J. (1986). XRF analyses of the kimberlitic
rocks of Western Australia. In: Excursion guide to the kimberlitic rocks... of. Western
Australia. Fourth Kimberlite Conference, Perth Australia, pp. 1-253.
Richardson, S.H., Gurney, J.J., Erlank, A.J. & Harris, J.W. (1984). Origin of diamonds
in old enriched mantle. Nature. 310, pp. 193-202.
Richardson, S.H. (1986). Latter-day origin of diamonds of eclogitic paragenesis. Nature. 322,
pp.623-626.
Richardson, S.H, (1989). c isotope: studies of diamond inclusions. Workshop
on Diamonds: Extenocu abstracts, 28th International Geological Congress,
Washington D.C., pp.87-90.
Robinson, D.N. (1979). Surface textures and other features of diamonds. Ph.D thesis
(utipubl), University of Cape Town, South Africa, 22 lp.
Rossman, G.R. (1931). Color in gems: The new technologies. Gems & Gemologv. 17, pp.60-71.
Sellschop, J.F.P. (1979). Nuclear probes in physical and geochemical studies of natural
diamonds. In J.E. Field, Ed., The Properties of Diamond, pp. 107-163. Academic
P.ess, New York.
Sellschop, J.F.P. (1987). Nuclear probes in physical, structural and geochemical studies
of diamond. The.. 37th Annual Diamond _Conference.Extended Abstracts.. Oxford,
England. Paper 11, pp.45-52,
Shimizu, N. & Richardson, S.H. (1987). Trace element abundance patterns of garnet
inclusions in peridotite-suite diamonds. Geochim. Cosmochim. Acta.. 51, pp,51-54.
Smith, C.B., Gurney, JJ,, Harris, J.W.& Jagoutz, E. (1991). Sm-Nd Model Ages of
Eclogitic Paragenesis Inclusions in Individual Diamonds from the Finsch Kimberlite

Fifth International . Kimberlite... Conference Extended Abstracts. CPRM Special
Publication 2/91, Brasilia, pp.350-352.
Smith, C.B. (1993). Personal communication.
Sobolev, N.V., Galimov, E.M., Ivanovskaya, I.N. and Yefimova, E.S. (1979). Isotope
composition of carbon of diamonds containing crystalline inclusions. Translated from
Dokl. Akad. Nauk SSSR, 249 (5), pp.1217-1220.
Sobolev, N.V. (1984), Crystalline inclusions in diamonds from New South Wales,
Australia. In Glover, I.E. and Harris, P.G., eds, Kimberlite Occurrence and Origin: A
Basis for Conceptual Models, in Exploration. Geology Department and University
Extension, University of Western Australia, Publication No.8, pp.213-226,
Sobolev, N.V. & Shatsky, V.S. (1990). Diamond inclusions in garnets from metamorphic
rocks: a new environment for diamond formation. Nature. 343, pp.742-746.
Steinnes, E. (1971), Epithermal neutron activation analysis of geological material In:
Activ. Anal, in Geochem. and Cosmochem. Proc. of NATO Advanced Study Institute,
Kjeller, Norway, 1970. eds. Brunfelt, A.O. and Steinnes, E,, Universitetsforlaget,
Oslo.
Tredoux, M. (1989). The platinum group elements: Nuclear methods for their analysis and their
behaviour in terrestrail rocks and meteorites (unpubpl). Ph.D. thesis, University of the
Witwatersrand.
Wilks, J. & Wilks, E. (1991). Properties and Applications of diamond. Oxford:
Butterworth-Heinemann Ltd., pp,285-287.
Wilson, A.N. (1982). Diamonds from birth to eternity, Gemological Institute of America,
Los Angeles, pp.3-446,
Yule, H.P. (1966). Data convolution and peak location, peak area and peak energy
measurements in scintillation spectrometry, Anal. Chem. 38, pp. 103,
Yule, H.P, (1968). Computation of lithium-drifted germanium detector peak areas for
activation analysis and gamma-ray spectrometry. Anal, Chem, 40, pp.1480.

Author Damarupurshad AName of thesis Geochemistry of single diamond crystals by Instrumental Neutron Activation Analysis 1995
PUBLISHER:University of the Witwatersrand, Johannesburg ©2013
LEGAL NOTICES:
Copyright Notice: All materials on the U n i v e r s i t y o f t he W i t w a t e r s r a n d , J o h a n n e s b u r g L i b r a r y website are protected by South African copyright law and may not be distributed, transmitted, displayed, or otherwise published in any format, without the prior written permission of the copyright owner.
Disclaimer and Terms of Use: Provided that you maintain all copyright and other notices contained therein, you may download material (one machine readable copy and one print copy per page) for your personal and/or educational non-commercial use only.
The University o f the W itw atersrand, Johannesburg , is not responsible for any errors or omissions and excludes any and all liability for any errors in or omissions from the information on the Library website.