geochemical variations in magmatic rocks from southern - ediss
TRANSCRIPT

Geochemical variations in magmatic rocks from southernCosta Rica as a consequence of Cocos Ridge subduction
and uplift of the Cordillera de Talamanca
DISSERTATION
zurErlangung des Doktorgrades
der Mathematisch-Naturwissenschaftlichen Fakultätender Georg-August-Universität zu Göttingen
vorgelegt von
MICHAEL ABRATISaus Oldenburg/Holstein
Göttingen 1998

D7
Referent: Prof. Dr. Gerhard WörnerKorreferent: Prof. Dr. Bent Hansen
Tag der mündlichen Prüfung: 4. November 1998

Pour ma femme Catherine
LE SANG DE LA TERRECOULE DANS LES VEINES DU VOLCAN.
Katia et Maurice Krafft

Abstract III
Abstract
The Cordillera de Talamanca, which constitutes the magmatic arc in SE Costa Rica, its relatedforearc (Fila Costeña) and backarc region (Limon Basin) are a segment of the CentralAmerican arc system.
To describe and explain the Neogene to Quaternary magmatic evolution of this segment of theCentral American arc system, I investigated the geochemical and isotopic (Sr, Nd, Pb)composition of magmatic rocks. The results indicate various magma sources for the igneousrocks in this region. The evolution of the magmatic system is temporally and geneticallyrelated to the ridge-trench collision of Cocos Ridge and Central America.
With increasing arc maturity, magmatic products change from arc-tholeiitic to calc-alkalinemagma compositions in Costa Rica. These changes take place during the Miocene.Prior to collision of the Cocos Ridge and SE Costa Rica, erupted magmas had their source inthe mantle wedge. This is in accordance with generally accepted models for arc magmatism.Derivation from a depleted, sediment and fluid modified mantle source is documented by theisotopic and trace element signature (Nb/Zr: 0.03-0.09, Ba/La: 20-134, 87Sr/86Sr: 0.7036-0.7042, 143Nd/144Nd: 0.51300-0.51304, 206Pb/204Pb: 18.72-18.87).When the Cocos Ridge collided with SE Costa Rica, this “normal” arc magmatism ended anda gap formed in the chain of arc volcanoes.
Simultaneously with the collision event, alkaline magmas started to erupt in the backarcregion. Their composition is geochemically and isotopically distinct from the former arcmagmatic products (Nb/Zr: 0.17-0.46, Ba/La: 13-19, 87Sr/86Sr: 0.7035-0.7036, 143Nd/144Nd:0.51297-0.51298, 206Pb/204Pb: 19.06-19.12), indicating derivation from decompressionalmelting of new upwelling sub-slab mantle material. Tapping of this new magma sourceoccurred when the subducting plate ruptured and opened a slab window in response to ridge-trench collision. A temporal and spatial association of alkalic backarc magmatism with theslab window formation can be shown by 40Ar/39Ar dating. From this it has to be concludedthat the slab window opened in a north-westward direction, consistent also with the directionof decreasing sub-Costa Rican mantle wedge contamination by enriched Galapagos plumemantle.
Shortly after collision and backarc activity, minor volumes of calc-alkaline lavas erupted inthe Fila Costeña (inner forearc), very close to the trench.
Adakites erupted as the latest phase of magmatic activity at the location of previouslyvoluminous calc-alkaline arc magmatism. Adakites are considered to be products of partialmelting of hydrated oceanic crust which could have formed when hot upwelling sub-slabasthenosphere came in contact with subducted oceanic crust at the slab window margins.Under these rare circumstances of slab window opening, adakites could be formed even in afast converging subduction zone.

Kurzfassung IV
Kurzfassung
Plattengrenzen sind üblicherweise die Orte auf der Erde, an denen eine hohe vulkanischeAktivität herrscht. So ist auch Mittelamerika, bedingt durch die Subduktion der Cocos Platteunter die Karibische Platte, vulkanisch eine der aktivsten Regionen weltweit. Im südlichenCosta Rica allerdings, sind im Gegensatz zu den benachbarten Gebieten derzeit keine aktivenVulkane zu finden.
Das betroffene und in dieser Arbeit untersuchte Segment des Mittelamerikanischen Arcsumfaßt die Cordillera de Talamanca als Hauptmagmatischen Rücken, sowie die Fila Costeñaals assoziierten Forearc und das Limon Becken als Backarc Bereich.
Mit geochemischen, isotopengeologischen und geochronologischen Methoden wurde dieAbfolge der Magmatite aus dieser Region untersucht. Eine Entwicklung des Magmatismussollte Rückschlüsse auf mögliche Veränderungen in der Magmenbildungszone ermöglichen.
Die Ergebnisse dokumentieren ein sehr vielfältiges Magmen Inventar in Südost Costa Rica,was nicht mit der Herkunft aus einer einzigen Magmenquelle zu erklären ist. Die Evolutiondes Magmatismus in der jüngeren Zeit ist zeitlich und offensichtlich auch genetisch mit derKollision und Subduktion des Cocos Rückens unter diesen Abschnitt desMittelamerikanischen Arcs verknüpft.
Die Entwicklung des Magmatismus im Miozän belegt das Heranreifen des Südost CostaRicanischen Arc-Segments: Arc-tholeiitische Magmen werden zunehmend von Kalk-alkalischen Magmen abgelöst. Letztere geben deutliche Hinweise auf eine sich aufbauende,verdickende Arc-Kruste, in der sie in Magmenkammern in hohem Maß Kristalle fraktionierenund Nebengestein assimilieren.
Diese Magmen, die vor der Kollision des Cocos Rückens mit dem Arc gefördert werden,sowohl die Arc-tholeiitischen als auch die Kalk-alkalischen Magmen, haben ihre Quelle imMantelkeil über der subduzierenden Platte. Der Mantelkeil ist heute als der primäre Ort fürdie Bildung von Magmen an Subduktionszonen anerkannt. Die Herkunft der Magmen auseiner durch Schmelzbildungen relativ verarmten, aber mit Sedimenten und Fluiden von dersubduzierenden Platte modifizierten Mantelquelle dokumentiert sich in ihrer Spurenelement-Signatur und Isotopie (Nb/Zr: 0.03-0.09, Ba/La: 20-134, 87Sr/86Sr: 0.7036-0.7042,143Nd/144Nd: 0.51300-0.51304, 206Pb/204Pb: 18.72-18.87).
Als der Cocos Rücken mit Südost Costa Rica kollidierte, endete dieser “normale” Arc-Magmatismus und es bildete sich eine Lücke in der Kette der Vulkane Mittelamerikas.
Gleichzeitig mit dem Kollisionsereignis eruptieren und intrudieren alkalische Magmen imBackarc Bereich. Ihre Zusammensetzung ist geochemisch und isotopisch sehr verschiedenvon den vorangehenden magmatischen Produkten des Arcs (Nb/Zr: 0.17-0.46, Ba/La: 13-19,87Sr/86Sr: 0.7035-0.7036, 143Nd/144Nd: 0.51297-0.51298, 206Pb/204Pb: 19.06-19.12). Sie zeigennur geringfügig die Signaturen der Subduktionszone und scheinen aus neuem, aufsteigendenMantelmaterial zu stammen, welches bei der Dekompression zu schmelzen beginnt. Aufgrundder geochemischen und isotopischen Ähnlichkeit zu Magmen, die vom Galapagos Hot Spotproduziert wurden, kann angenommen werden, daß sie aus eben diesem Mantelmaterialgebildet werden, welches durch ein Fenster in der subduzierenden Platte in den Mantelkeilaufsteigt. Das Fenster hat sich wahrscheinlich in Folge der Cocos-Rücken Kollision gebildet,wobei die subduzierende Platte entlang von Transformstörungen aufriß, die in diesem Gebietsehr zahlreich sind. Der Zusammenhang zwischen Fensterbildung und Rückenkollision ergibtsich aus dem zeitlichen und räumlichen Bezug von Kollisionsereignis und Auftreten vonBackarc Magmatismus als magmatischem Fensterindiz. Mit Hilfe der 40Ar/39Ar

Kurzfassung V
Geochronologie an den Backarc Magmatiten kann die Erweiterung des Fensters innordwestliche Richtung abgelesenen werden. In eben diese Richtung verbreitet sich auch dieKontamination des Mittelamerikanischen Mantelkeils mit Galapagos Plume Material, wie essich in der Reihe der aktiven Vulkane in Costa Rica und Nicaragua dokumentiert.
Magmatische Aktivität, die lokal und zeitlich beschränkt in der Fila Costeña, nahe am Trenchauftritt, markiert offenbar den Wiedereinsatz der Subduktion in der Region. Durch die dannsehr flach verlaufende Subduktion dieses Teilstücks der Cocos Platte bleibt späterer Arc-Magmatismus aus.
Adakite eruptieren in der letzten Phase magmatischer Aktivität in Südost Costa Rica dort, wozuvor voluminöser Kalk-alkalischer Arc-Magmatismus geherrscht hat. Diese partiellenSchmelzprodukte aus hydratisierter, subduzierter, basaltischer Kruste, haben sich in diesemFall gebildet, als heiße, aufsteigende Asthenosphäre die Ränder des Fensters in dersubduzierenden Platte, d.h. den sich nunmehr unterschiebenden Cocos Rücken, aufschmolz.Unter diesen besonderen Umständen mit Bildung eines Fensters in der subduzierenden Plattekonnten sich Adakite bilden, wo ansonsten aufgrund der hohen Konvergenzraten dergeothermische Gradient ein Aufschmelzen der Kruste nicht ermöglicht hätte.

CONTENTS VI
CONTENTS
ABSTRACT............................................................................................................................III
KURZFASSUNG ................................................................................................................... IV
Abbreviations........................................................................................................................... XI
1 INTRODUCTION..............................................................................................................1
1.1 OBJECTIVES ..............................................................................................................................................11.2 GEOLOGICAL SETTING ..............................................................................................................................3
1.2.1 Magmatic geological history of Costa Rica.....................................................................................31.2.2 Geology of the Cordillera de Talamanca.........................................................................................71.2.3 Talamanca crust and subducting Cocos Plate...............................................................................11
1.3 PREVIOUS WORKS ..................................................................................................................................17
2 FIELD RELATIONSHIPS AND PETROGRAPHY....................................................192.1 ARC THOLEIITE GROUP – PRE-COLLISIONAL............................................................................................19
2.1.1 Field relationships .........................................................................................................................192.1.2 Lithology and petrography.............................................................................................................192.1.3 Interpretation:................................................................................................................................20
2.2 CALC-ALKALINE GROUP – PRE-COLLISIONAL..........................................................................................202.2.1 Field relationships .........................................................................................................................202.2.2 Lithology and petrography.............................................................................................................202.2.3 Interpretation .................................................................................................................................21
2.3 FOREARC CALC-ALKALINE GROUP – SYN-COLLISIONAL..........................................................................212.3.1 Field relationships .........................................................................................................................212.3.2 Lithology and petrography.............................................................................................................212.3.3 Interpretation .................................................................................................................................21
2.4 ADAKITE GROUP – POST-COLLISIONAL ...................................................................................................222.4.1 Field relationships .........................................................................................................................222.4.2 Lithology and petrography.............................................................................................................222.4.3 Interpretation:................................................................................................................................22
2.5 BACKARC GROUP – SYN-COLLISIONAL....................................................................................................232.5.1 Field relationships .........................................................................................................................232.5.2 Lithology and petrography.............................................................................................................232.5.3 Interpretation:................................................................................................................................24
403 AR/39AR AGE ANALYSES..........................................................................................333.1 CHEMICAL COMPOSITION OF THE AMPHIBOLES.......................................................................................363.2 STEP HEATING EXPERIMENTS..................................................................................................................38
3.2.1 ALT 16............................................................................................................................................383.2.2 GUA 28 ..........................................................................................................................................39
3.3 LASER FUSION EXPERIMENTS..................................................................................................................403.3.1 ALT 16; GUA 28 ............................................................................................................................403.3.2 BRI 25 ............................................................................................................................................403.3.3 TAL 104..........................................................................................................................................42
3.4 AGES OF MAGMATIC ROCKS FROM THE CORDILLERA DE TALAMANCA ...................................................45

CONTENTS VII
4 GEOCHEMISTRY ..........................................................................................................50
4.1 MAJOR ELEMENTS ..................................................................................................................................504.1.1 Classification .................................................................................................................................50Classification of intrusives.............................................................................................................................534.1.3 Differentiation................................................................................................................................54
4.2 TRACE ELEMENTS ...................................................................................................................................574.2.1 Sample group distinction ...............................................................................................................574.2.2 Characterisation of Adakites .........................................................................................................594.2.3 Source Characteristics...................................................................................................................604.2.4 Across-arc variations.....................................................................................................................64
5 ISOTOPES........................................................................................................................66
5.1 RADIOGENIC ISOTOPES ...........................................................................................................................665.1.1 Sr- / Nd- isotopic compositions ......................................................................................................665.1.2 Pb- isotopic compositions ..............................................................................................................69
5.2 STABLE ISOTOPES ...................................................................................................................................71
6 GEOCHEMICAL MODELLING ..................................................................................73
6.1 PARTIAL MELTING ..................................................................................................................................746.2 MANTLE SOURCE – CONSTRAINTS FROM ISOTOPES .................................................................................776.3 MANTLE SOURCE – CONSTRAINTS FROM TRACE ELEMENTS ....................................................................806.4 ADAKITES- ECLOGITE PARTIAL MELTING AND MANTLE WEDGE ASSIMILATION ......................................82
7 DISCUSSION ...................................................................................................................847.1 GEODYNAMIC MODELS ...........................................................................................................................84
7.1.1 Locally enriched mantle.................................................................................................................847.1.2 Slab angle variations .....................................................................................................................847.1.3 Slab window...................................................................................................................................85
7.2 REGIONAL EFFECTS.................................................................................................................................92
8 CONCLUSION.................................................................................................................95
9 REFERENCES.................................................................................................................97
10 APPENDIX .....................................................................................................................112
10.1 ANALYTICAL METHODS .......................................................................................................................11210.1.1 Sample Preparation .....................................................................................................................11210.1.2 Analysis of Ferrous Iron (Fe2+) ...................................................................................................11210.1.3 Determination of Loss On Ignition (LOI) ....................................................................................11210.1.4 X-Ray Fluorescence Spectroscopy (XRF) ....................................................................................11210.1.5 Inductively Coupled Plasma Mass Spectrometry (ICPMS)..........................................................11310.1.6 Isotope Analysis ...........................................................................................................................11410.1.7 Stable Isotopes (LA-SIRMS).........................................................................................................11510.1.8 40Ar/39Ar Dating (LA-Noble-Gas-MS)..........................................................................................11510.1.9 Electron Microprobe Analysis (EMP)..........................................................................................116
10.2 ANALYTICAL DATA ............................................................................................................................117
ACKNOWLEDGEMENTS .................................................................................................135
LEBENSLAUF......................................................................................................................136

CONTENTS VIII
FIGURES
Figure 1: Tectonic setting of Central America ..........................................................................3
Figure 2: Plate tectonics around Costa Rica.............................................................................5
Figure 3: Geological sketch map of Costa Rica ........................................................................6
Figure 4: Map of Quaternary volcanic centres..........................................................................8
Figure 5: Geological features of the Cordillera de Talamanca ..............................................10
Figure 6: Crust types in the Caribbean....................................................................................11
Figure 7: Crustal thickness in the Caribbean. .........................................................................12
Figure 8: Ophiolites and aseismic ridges ...............................................................................15
Figure 9: Topographic map with sample localities .................................................................25
Figure 10.1: Sample locations in the Fila Costeña..................................................................26
Figure 10.2: Sample locations around Santa Maria de Dota. .................................................27
Figure 10.3: Sample locations along the Pan-American Highway..........................................28
Figure 10.4: Sample locations in the central Cordillera de Talamanca .................................29
Figure 10.5: Sample locations near San Vito ..........................................................................30
Figure 10.6: Sample locations around Guayacan ...................................................................31
Figure 10.7: Sample locations near Bribri ..............................................................................32
Figure 11: Classification of amphiboles ..................................................................................36
Figure 12: Geochemical composition of hornblende...............................................................37
Figure 13: Step heating - sample ALT 16 ................................................................................38
Figure 14: Step heating - sample GUA 28 ...............................................................................39
Figure 15: 40Ar /39Ar laser fusion experiments ........................................................................41
Figure 16: Inverse isochron - sample BRI 25 ..........................................................................42
Figure 17: Sphenochron - sample TAL 104 .............................................................................43
Figure 18: Age data histogram - sample TAL 104...................................................................43
Figure 19: Chemical variability of the hornblende samples....................................................44
Figure 20: Arc profile with radiometric ages for the 5 rock groups .......................................46
Figure 21: Along-arc age variations for calc-alkaline samples ..............................................47
Figure 22: Along-arc age variations for alkaline rocks ..........................................................48
Figure 23: Distinction of the alkalic and sub-alkalic rock suites ............................................50
Figure 24: Diagram of K2O vs. SiO2........................................................................................51
Figure 25: TAS diagram...........................................................................................................52
Figure 26: AFM ternary...........................................................................................................52

CONTENTS IX
Figure 27: QAPF diagram (Streckeisen) .................................................................................53
Figure 28: Major and trace elements versus MgO ..................................................................54
Figure 29: Major and trace elements versus SiO2 ...................................................................55
Figure 30: REE diagrams ........................................................................................................58
Figure 31: Distinction of adakitic andesites and dacites.........................................................59
Figure 32: Multielement diagrams...........................................................................................60
Figure 33: Plot of Nb/Zr vs. Ba/Th. .........................................................................................61
Figure 34: Plot of (La/Yb)n vs. Nb/Zr. .....................................................................................62
Figure 35: Plot of Th/Yb vs. Ta/Yb...........................................................................................63
Figure 36: Tectonomagmatic discrimination diagrams...........................................................63
Figure 37: Plot of Ba/La variations across the arc .................................................................64
Figure 38: Plot of Nb/Zr variations across the arc..................................................................65
Figure 39: Sr - Nd isotope diagram (overview). ......................................................................67
Figure 40: 143Nd/144Nd vs. 87Sr/86Sr isotope plot......................................................................68
Figure 41: Lead isotope plots ..................................................................................................70
Figure 42: Plot of δ18O vs. 87Sr/86Sr.........................................................................................71
Figure 43: Profile of δ18O variations in oceanic crust ............................................................72
Figure 44: Batch melting models on REE pattern. ..................................................................74
Figure 45: Modelling in the Nd-Sr-isotope space....................................................................78
Figure 46: Modelling in Sr- vs. Pb-isotope plot ......................................................................78
Figure 47: Source contamination and crustal assimilation (δ18O vs. 87Sr/86Sr)......................79
Figure 48: (La/Yb)n vs Ba/La with melting models .................................................................80
Figure 49: (La/Yb)n vs Ba/La variations for the adakites .......................................................81
Figure 50: Degree of melting for adakites (Sr/Y vs Y).............................................................82
Figure 51: Batch melting model for adakites (REE)................................................................82
Figure 52: Mantle wedge interaction for the adakites (Mg# vs. SiO2) ....................................83
Figure 53: Model of aseismic ridge collision and plate rupture (profile) ...............................87
Figure 54: Model of active ridge subduction and slab window formation ..............................89
Figure 55: Model of slab break-off upon Cocos Ridge collision .............................................91
Figure 56: Backarc rocks in relation to assumed slab window...............................................92
Figure 57: Geochemistry of Central American volcanoes.......................................................93
Figure 58: Volcanic evolution along the Central American arc..............................................93

CONTENTS X
TABLES
Table 3-1: Mineral separates for dating ..................................................................................33
Table 3-2: Talamanca radiometric ages ..................................................................................45
Table 6-1: Parameters for melting models...............................................................................76
Table 6-2: Composition of model endmembers........................................................................81
Table 10-1: Sample list...........................................................................................................117
Table 10-2: Chemical analyses of whole rocks ......................................................................119
Table 10-3: Radiogenic isotopes ............................................................................................123
Table 10-4: Oxygen isotopes ..................................................................................................124
Table 10-5: Laser fusion Ar/Ar data ......................................................................................125
Table 10-6: Step heating Ar/Ar data ......................................................................................128
Table 10-7: Amphibole analyses ............................................................................................129
Table 10-8: Literature age data .............................................................................................134

Abbreviations XI
Abbreviations
AFC-Process Assimilation, Fractional Crystallisation: process during magma genesisAmph AmphiboleArc Volcanic arc above a convergent marginBio BiotiteCc CalciteCpx ClinopyroxeneEPR East Pacific RiseGI Galapagos IslandsHbl HornblendeGrt GarnetGSC Galapagos Spreading CentreHFSE High Field Strength Elements: Incompatible Elements of high ionic
potential (cationic charge/ cationic radius > 2 ), e.g. Ti, Nb, Ta, Zr andHf
HIMU High ratio of 238U/ 204PbHREE Heavy Rare Earth ElementsICP-MS Inductively- coupled Plasma- Mass-spectrometryKfsp AlkalifeldsparLILE Large Ion Lithophile elementsLREE Light Rare Earth elementsMAT Middle America TrenchMOR Mid Ocean RidgeMORB Mid Ocean Ridge BasaltMt MagnetiteNe NepheliniteODP Ocean Drilling ProgramOIB Ocean Island BasaltsOl OlivineOpx OrthopyroxenePFZ Panama Fracture ZonePlag PlagioclasePM Partial MeltingP-T Pressure – Temperature (path)Qz QuartzSpl SpinelXRF X-ray fluorescence analysis

Introduction 1
1 Introduction
1.1 Objectives
Southern Costa Rica shows a distinct evolution within the Central American Arc during itsyounger geological history.In respect of many geological aspects, this area differs from the adjacent areas in the arc.These features are for example deformation, rapid uplift and the lack of active strato-volcanoes [Kolarsky et al., 1995] in midst of one of the volcanically most active arcs world-wide [Carr & Stoiber, 1990].
Several geological and geophysical studies of the deformation and uplift history came to theconclusion that indentation and shallow subduction of the buoyant, aseismic Cocos Ridge isresponsible for the distinct evolution in this arc segment [e.g. Kolarsky et al., 1995]. Thecausal relationship is evident when one recognises that the extension of the geologicallymodified arc section correlates with the width and location of the ridge entering theconvergence zone and that the modification correlates also in time with the indentation andsubduction event. Very similar geological features at other sites of ridge subduction supportthe hypothesis [e.g. Vogt et al., 1976; Kelleher & McCann, 1976; Chung & Kanamori, 1978;McGeary et al., 1985; Adamek et al., 1987].
The aim of the present study is to test if the observed geochemical and magmatic changes intime and space within the area of the Cordillera de Talamanca could also be related to CocosRidge subduction.
Volcanism along convergent plate margins is generally related to mantle wedge melting,induced by fluid transfer from the subducting slab [Gill, 1981].Thus, if major changes in the volcanic activity of arcs occur, this could indicate importantchanges in the convergence zone parameters (subduction zone geometry), affecting thenormal process of melt generation.
McGeary et al. [1985] conclude that shallow subduction of the Cocos Ridge and displacementof the asthenospheric mantle wedge inhibit magma generation. Protti et al. [1995] attribute theabsence of subduction-related volcanic activity primarily to a lack of dehydration of the slabwhich did not reach the appropriate depths.In contrast, de Boer et al. [1995] suggest low magma production in the source region, theinability of those magmas to rise through the thickened crust, and/or lateral escape of magmasto adjacent arc segments.However, Johnston & Thorkelson [1997] find an alternative hypothesis and propose thedevelopment of a slab window as reason for the absence of normal arc volcanism and theoccurrence of a magmatic anomaly, rejecting a causal relationship to the Cocos Ridge itself.
These hypotheses have been tested in the present study.To solve this task, geochemical and isotope analyses are used to characterise the magmaticrocks of the southern Costa Rican arc segment, and to identify their melt sources andsubsequent magmatic evolution. Dating of the rocks helps to constrain the time frame for theoccurrence of specific magmatic features.

Introduction 2
Besides the description of the geochemical evolution in the Cordillera de Talamanca, thethesis aims to answer the following questions:
• Does a mantle wedge exist underneath the Cordillera de Talamanca?• What is the depth of the subducting plate in that region?• Can we get new insights in the Late Neogene-Quaternary plate tectonic evolution in
southern Central America?• How do slab windows and slab break-offs form and are they important for subduction
zones world-wide and through earth-history?• How do adakites (i.e. slab melting products) form, are they bound to distinct plate tectonic
configurations like slab windows, what is the proportion and importance of adakiticmagmas for crustal formation processes through earth-evolution?
• What are the driving forces for the evolution of orogenic belts and mountain buildingprocesses?

Introduction 3
1.2 Geological setting
1.2.1 Magmatic geological history of Costa Rica
Costa Rica is a part of the Central American Arc system that evolved on the western marginof the Caribbean Plate (Fig.1). The Caribbean Plate is a product of oceanic volcanism within acomplex interplate realm [Pindell & Barrett, 1990]. Its evolution is mainly governed byrelative plate motions of North and South America.The formation of the Caribbean started when South America moved rapidly away from NorthAmerica after the Late Triassic-Jurassic break-up of Pangaea [Donnelly et al., 1990]. Oceaniccrust produced during that event is proven in the Venezuelan Basin and also by ophioliticassemblages in Venezuela and Costa Rica (Santa Elena) [Diebold et al., 1981; Ghosh et al.,1984].
When plate motions slowed in the Caribbean upon concurrent South Atlantic Ocean opening,flood basalts covered the area. Samples of this Caribbean Large Igneous Province (CLIP)[Hauff, 1998] or Jurassic-Cretaceous Basalt Province [Donnelly et al., 1990] are found asophiolitic complexes throughout the Caribbean and along the Pacific coast of South Americaas far south as Ecuador (Fig. 3, Fig. 8) [Donnelly et al., 1990; Alvarado et al., 1997; Hauff etal., 1997]. Exposures in Costa Rica are bound to the Pacific coast and their rocks date back tothe Jurassic to Cretaceous [e.g. Astorga, 1997; Tournon & Alvarado, 1997]. These floodbasalts show the characteristics of MORB and OIB [Donnelly et al., 1990; Hauff, 1998]. InCosta Rica and western Panama (Chorotega Block), the basaltic ophiolitic complex has beennamed the Nicoya complex [Dengo, 1962].
Figure 1: Plate tectonic environment of the East Pacific and Caribbean region (simplifiedafter Mann & Burke, 1984), and the location of Costa Rica in southern Central America.

Introduction 4
Central America emerged above sea-level primarily as a consequence of subduction relatedvolcanism. Formation of the western convergent margin of the Caribbean and appearance ofthe first arc magmatism during the Upper Cretaceous is related to north-eastward movementof South America, causing a compressional tectonic environment in Central America[Donnelly et al., 1990]. Subduction of the Farallon Plate underneath the Caribbean Plateresulted then in the first occurrence of the Central American Arc.In northern Costa Rica (Santa Elena, Nicoya Peninsula) as well as in western Panama, firstincidences of arc volcanism date back to the Campanian-Maastrichtian [Fisher & Pessagno,1965; Kuijpers, 1979; Weyl, 1980; Tournon, 1984; Sick, 1989; Lundberg, 1991]. Andesiticclasts of calc-alkaline character are intercalated in submarine sediments and give indirectevidence for the existence of mature arcs. Under debate are findings of even older andesitic(calc-alkaline) volcanic clasts within Albian-Campanian sedimentary successions on theNicoya Peninsula [Calvo & Bolz, 1994]. At that time, the area of the Cordillera de Talamancawas still covered by submarine tholeiitic basaltic massive and pillowed flows andhyaloclastites [Tournon & Alvarado, 1997].In the Middle to Upper Eocene, the sedimentary sequences of northern and southern CostaRica contain more evidence of andesitic volcanism [Tournon & Alvarado, 1997]. Somevolcaniclastic sediments are also deposited in the Talamanca area at Río Chirripó Atlanticóand Río Lari [Fisher & Pessagno, 1965; Tournon, 1984].There are only a few rock samples radiometrically testifying for an age of the Talamanca arcas old as Oligocene (at Río Lari, and near Division) [Saenz, 1982; Appel et al., 1992; de Boeret al., 1995]. Rocks of that period are arc-tholeiitic [de Boer et al., 1995].Thus, there is less evidence for an Upper Cretaceous to Lower Tertiary arc within the area ofthe Cordillera de Talamanca than in northern Costa Rica and western Panama [Tournon &Alvarado, 1997].
The Miocene was a period of high volcanic activity throughout Central America, resultingfrom a general plate tectonic reorganisation in the Pacific. Fragmentation of the Farallon Platein the Cocos and Nazca plates occurred at about 26 Ma (Oligocene/Miocene boundary)[Handschuhmacher, 1976] and had an important effect on the intensity of magmatism inCentral America.Large volumes of ignimbrites erupted in Guatemala, Honduras, Nicaragua, north-westernCosta Rica, and central Panama during the Miocene [Weyl, 1961].Neogene northwest-southeast regional compression which meant a change from oblique tonear-orthogonal convergence at the Middle America Trench [Donnelly et al., 1990] led to theproduction of massive volumes of mantle-wedge-derived magma also in southern CentralAmerica [de Boer et al., 1995].Since the Miocene, the geochronological record of arc magmatism becomes more continuousin Costa Rica. The majority of primary arc volcanic formations in Costa Rica that could bedated directly and reliably with radiometric methods date back to the Miocene [Tournon,1984; Alvarado et al., 1992; Appel et al., 1994] and document a vivid arc magmatic activityalso in the Talamanca area: Arc volcanic rocks found in the Cordillera de Talamanca are ofMiddle to Upper Miocene age, intrusive rocks are mostly of Upper Miocene age [Berrange &Whittaker, 1977; Bellon & Tournon, 1978; Bergoeing, 1982; Alvarado et al., 1992; Defant etal., 1992; Appel et al., 1994; Drummond et al., 1995].
Introduction 5
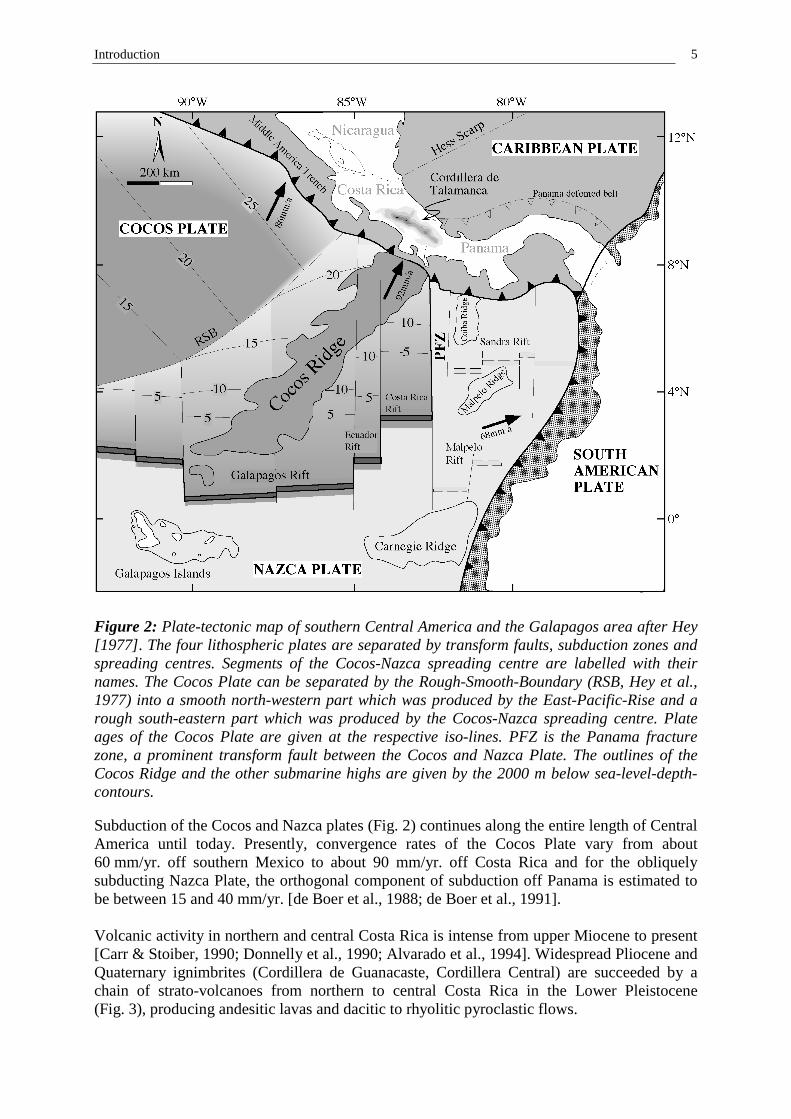
Figure 2: Plate-tectonic map of southern Central America and the Galapagos area after Hey[1977]. The four lithospheric plates are separated by transform faults, subduction zones andspreading centres. Segments of the Cocos-Nazca spreading centre are labelled with theirnames. The Cocos Plate can be separated by the Rough-Smooth-Boundary (RSB, Hey et al.,1977) into a smooth north-western part which was produced by the East-Pacific-Rise and arough south-eastern part which was produced by the Cocos-Nazca spreading centre. Plateages of the Cocos Plate are given at the respective iso-lines. PFZ is the Panama fracturezone, a prominent transform fault between the Cocos and Nazca Plate. The outlines of theCocos Ridge and the other submarine highs are given by the 2000 m below sea-level-depth-contours.
Subduction of the Cocos and Nazca plates (Fig. 2) continues along the entire length of CentralAmerica until today. Presently, convergence rates of the Cocos Plate vary from about60 mm/yr. off southern Mexico to about 90 mm/yr. off Costa Rica and for the obliquelysubducting Nazca Plate, the orthogonal component of subduction off Panama is estimated tobe between 15 and 40 mm/yr. [de Boer et al., 1988; de Boer et al., 1991].
Volcanic activity in northern and central Costa Rica is intense from upper Miocene to present[Carr & Stoiber, 1990; Donnelly et al., 1990; Alvarado et al., 1994]. Widespread Pliocene andQuaternary ignimbrites (Cordillera de Guanacaste, Cordillera Central) are succeeded by achain of strato-volcanoes from northern to central Costa Rica in the Lower Pleistocene(Fig. 3), producing andesitic lavas and dacitic to rhyolitic pyroclastic flows.

Introduction 6
From the Upper Pleistocene to present, spacing of strato-volcanoes which produce calc-alkaline volcanics gets less dense. Nevertheless, the remaining active volcanoes are the mostproductive within the Central American chain [Stoiber & Carr, 1973; Leemann & Carr, 1995].
Closure of the isthmus between the Americas took place during the Pliocene [e.g., Keigwin,1982; Tiedemann et al., 1998] and is reflected in marine fauna differentiation into Pacific andCaribbean associations as well as intermingling of North and South American terrestrial faunaspecies. This closure documents the last step in the evolution of Central America from anarchipelago to a peninsula, an isthmus and finally the present land bridge.
Figure 3: Geological sketch map of Costa Rica and western Panama after Kussmaul et al.[1994] showing the distribution of Neogene and Quaternary igneous rocks.

Introduction 7
1.2.2 Geology of the Cordillera de Talamanca
1.2.2.1 Magmatic succession
The geological sketch map of Costa Rica (Fig. 3) shows that, with respect to magmatic rocks,the Cordillera de Talamanca is mainly made up of Neogene volcanics and Neogene intrusives.Whereas Neogene volcanics are exposed all along the Costa Rican and western Panamanianpart of the Central American Arc, the massive occurrence of intrusive bodies is a particularityof the Cordillera de Talamanca.Intrusive rocks of the Cordillera de Talamanca, intruding sedimentary and volcanic series asbatholiths and stocks of granitoids are pervasive in this magmatic arc, but predominantlyfound in the axial zone (Fig. 3) [e.g., Dengo, 1962]. These intrusions are generallydifferentiated and comprise quartz-diorites and monzonites. Granites and gabbros aresubordinate [Weyl, 1957; Kussmaul, 1987; Drummond et al., 1995].As in the older series of Montes del Aguacate [Kussmaul et al., 1994], an evolution from arctholeiitic to calc-alkaline series can be observed for the Talamanca magmatism, for volcanicsas well as intrusives.
Since the Pliocene, calc-alkaline arc volcanism is absent in the central Cordillera deTalamanca. Instead, Pliocene calc-alkaline volcanism occurs in the tectonised and upliftedFila Costeña (inner forearc) [Henningsen, 1966; Kesel, 1978; Bergoing et al., 1978; de Boeret al., 1995].
Alkaline magmatic rocks emplaced on the Caribbean side of Costa Rica date from theuppermost Miocene in the SE to sub-recent in the NW [Bellon & Tournon, 1978; Robin &Tournon, 1978; Tournon, 1984; this thesis]. A climax of alkaline magmatism around 4Ma isevidenced by intrusive (teschenites, alkaline syenites) and volcanic (nephelinites, alkalibasalts, basanites, ankaramites) alkaline rocks near Guayacan (Fig, 3) [Tournon, 1972;Azambre & Tournon, 1977; Tournon, 1984; Tournon & Alvarado, 1997].
During Upper Pliocene and Lower Pleistocene times, adakitic magmatism (genetic termindicating slab melting) occurs in the central and southern Cordillera de Talamanca. Theproducts are andesitic to dacitic domes and related breccias [Ballmann, 1976; Tournon, 1984;Defant et al., 1992; Drummond et al., 1995; de Boer et al., 1995; this thesis].
1.2.2.2 Volcanic gap
Active volcanoes in Central America are predominantly aligned as a well defined belt whichparallels the Middle America trench and coastline (Fig. 4). This volcanic front represents oneof the most active circum-Pacific volcanic belts with one of the highest densities of activevolcanic centres among convergent plate margins world wide [Carr & Stoiber, 1990].However, a 175km wide gap in the chain of closely spaced Quaternary stratovolcanoes isfound in the Central American volcanic front between the volcanoes Irazú/Turrialba andTisingal/El Barú about the projected onshore extension of the Cocos Ridge (Fig. 4). Thewidth of the gap correlates approximately with the width of the Cocos Ridge and correspondsprecisely to the topographic elevation of the Cordillera de Talamanca.Some Pliocene and Plio-Pleistocene volcanics, petrologically and geochemically distinct fromnormal arc volcanics, occur within the former active arc (i.e. the gap) and in particular withinthe fore arc and back arc region [Ballmann, 1976; Tournon, 1984; Defant et al., 1991;Drummond et al., 1995; de Boer et al., 1995].

Introduction 8
Figure 4: Map of active and inactive late Quaternary volcanic centres in Central Americaafter Carr et al. [1979]. The Cordillera de Talamanca is a volcanic gap between thevolcanoes Irazú (IR) / Turrialba (TU) in southern Costa Rica and Tisingal (TI) / El Barú (EB)in western Panama. A distinction was made between volcanic centres aligned in the volcanicfront and those from fields behind the front.
1.2.2.3 Topographic uplift and exhumation
Topographic elevation of the central segment of the Chorotega arc (the Cordillera deTalamanca) to heights over 3500 m is conspicuous within the Central American Arc (Fig.5A). The maximum elevation of 3819 m at Cerro Chirripó is prominent and the generaltopographic elevation of the area above 2000 m is unique in Central America [Kolarsky et al.,1995]. Thus, Costa Rica is higher than any other part of Central America, excludingcontinent-based Guatemala. The surrounding areas of the Cordillera de Talamanca in CostaRica and Panama are affected by topographic uplift, reflected in the enormous height of theneighbouring volcanoes and a decrease of volcanic heights from central to northernmostCosta Rica (Volcán Irazú 3432 m to Volcán Miravalles 2028 m) [Weyl, 1980].Uplift has probably occurred differentially with periods of rapid uplift followed by periods ofrelative quiescence [Kruckow, 1974]. From marine Miocene deposits of the Valle Central hecalculated uplift rates between 0.040 and 0.095 mm/yr. Alt et al. [1980] have proposed anextremely high uplift rate of 25 mm/yr for the Coastal Range and Miyamura [1975] calculateda present rate of uplift for the central mountain range of Costa Rica at 1 to 2 mm/yr andCollins et al. [1995] report net rates of emergence of 1000 m/m.y. for the Pacific coast and156 m/m.y. for the Caribbean coast. Recent estimates using mineral closing ages of samples

Introduction 9
from Cerro Chirripó gave uplift rates of 1.4 ±0.5 km/Ma with a start of exhumation at 3.5 Ma[Graefe et al. 1998]. The presence of flat lying sedimentary and volcanic successions on CerroChirripó indicates vertical uplift [Tournon & Alvarado, 1997].Cocos Ridge collision and subsequent shallow subduction is also affecting the forearc (FilaCosteña) and backarc (Limón basin) region [e.g., Klitgord et al., 1978; Corrigan et al., 1990;Gardner et al., 1992; Collins et al., 1995]. The forearc and backarc basins are volcanicallyactive, structurally inverted and topographically uplifted in the contact area of the CocosRidge [cf. Kolarsky et al., 1995]. Along strike in Nicaragua, the inverted backarc basinchanges rapidly to an extensional graben structure that is much lower in elevation (Fig. 5C).Rapid crustal uplift of the overriding plate, associated faulting and erosion exposed theremains of volcanic arcs predating the Quaternary volcanic arc to the north and south of thatarea. Exhumation brought Miocene sub-volcanic rocks such as batholiths and granitoid stocksto the surface and high elevations (Fig. 3). Kesel & Lowe [in Gardner et al., 1987], showedthat along the present crest of the Cordillera de Talamanca upper Miocene rocks were raisedfrom about 400 to 900 m to elevations in excess of 3000 m.
Exhumation of southern Costa Rica and western Panama, building up the orogen of theCordillera de Talamanca takes place since the Pliocene [Dengo, 1962; Graefe, 1998] and isascribed to indentation and shallow subduction of the Cocos Ridge [Kolarsky et al., 1995].Plio-Quaternary tectonic events are documented from the forearc to the backarc as forexample by conglomerates, and thrusting and folding of Eocene to Miocene sedimentarysequences in the Limon Basin [Rivier, 1985; Collins et al., 1995].
Since the Cordillera de Talamanca, the area of topographic uplift and exhumation is placeddirectly opposite to the locus of Cocos Ridge subduction, a causal relation is obvious.
1.2.2.4 Neotectonic fault pattern
Both, convergent and divergent structures related to isostatic uplift and sub-horizontal islandarc shortening are described for southern Costa Rica and western Panama by Corrigan et al.[1990]. The pattern of faulting in Neogene sediments in Costa Rica appears to reflectpredominantly horizontal shortening perpendicular to the trench and is consistent with thewidth of the subducting Cocos Ridge [Heywood, 1984]. Major Neogene faults are typicallyreverse faults that strike parallel to the arc and dip steeply to the north-east (Fig. 5B) [Rivier,1985; Mann et al., 1990].Maximum horizontal compressive stress directions trend N-S and N-E, respectively, in thecentral and south-eastern Costa Rican inner arc area, overthrusts are nearly perpendicular tothat direction [Montero, 1994]. Montero [1994] deduced Costa Rican neotectonics and relatedstresses from collision of the oceanic Cocos Ridge with southern Costa Rica, whereby theCocos Ridge behaves as a rigid indenter and the region of central and southern Costa Rica asa rigid-plastic material. The regional stress field of Costa Rica inferred by Kolarsky et al.[1995] from P and T axes of earthquake focal mechanisms describe a radial pattern about thesubducting Cocos Ridge.Forearc indentation of the Pacific margin of Costa Rica as a typical feature of aseismic ridgeor oceanic plateau collision with an island arc was described by Montero [1994] and Kolarskyet al. [1995].

Introduction 10
1.2.2.5 Shallow dipping of Benioff Zone and seismicity
Burbach et al. [1984], Guendel [1986] and Protti et al. [1995] point out that the dip of thesubducted Cocos Plate decreases significantly beneath central Costa Rica (from about 60° dipbetween Mexico and northern Costa Rica to 35-40° dip beneath central Costa Rica andPanama). For the depth interval of 25 to 250 km Guendel [1986] documents shallowing insubduction angle and in the 200- and 250-km isodepth contours he indicates an eastwarddeflection to the top of the Benioff Zone (Fig. 7). Protti et al. [1995] emphasise the abrupttermination of Benioff Zone seismicity deeper than 50 km southeast of Punta Uvita(83°55’W), indicating a tear or contortion in the downgoing slab beneath Costa Rica.Historical large earthquakes (Ms > 7) reported from the area of the Osa peninsula support thehypothesis of shallow ridge subduction by documenting the high compressive stress regimeon the upper plate [Protti et al., 1995; Tajima & Kikuchi, 1995].Noticeable is the abrupt decrease in seismicity below 75km [Guendel, 1986], characterising azone of relative seismic quiescence or a seismic gap.
Figure 5: Geological characteristics of the Cordillera de Talamanca. After Kolarsky et al. [1995].A: Topographic elevation of the Cordillera de Talamanca indicated by 700m height intervals.B: Fault-pattern in Costa Rica characterises southern Costa Rica as an area of sub-horizontalshortening and uplift.C: Basin inversion occurs on either side of the Cordillera de Talamanca.D: Shallowing of the subduction zone beneath the Cordillera de Talamanca is indicated by bending ofthe plate-depth isolines.

Introduction 11
The area of the Cordillera de Talamanca displays thus a section of the arc that isunequivocally strongly modified in comparison to a simple subduction zone. All the describedphenomena are ascribed to indentation and shallow subduction of the aseismic, buoyantCocos Ridge. The resultant effects of crustal shortening upon compressive stresses andisostatic uplift of the low density mass find expression in the geologic evolution observed inthe Cordillera de Talamanca.Modifications as they are present in the Central American Arc at southern Costa Rica andwestern Panama are world-wide observable as common complications arising fromsubduction of anomalous bathymetric features [e.g., Vogt et al., 1976; Kelleher & McCann,1976; Chung & Kanamori, 1978; McGeary et al., 1985; Adamek et al., 1987].
1.2.3 Talamanca crust and subducting Cocos Plate
1.2.3.1 Talamanca crust
Geological and geophysical investigations in the Caribbean region [Case and MacDonald,1990] show that the crust of the Talamanca area is of an accretionary type (Fig. 6), formed bysubduction in oceanic environment. In contrast to the northern end of the Central AmericanArc, no continental crust fragments are indicated.
Figure 6: Genetically distinct types of crust within the Caribbean as characterised by Case etal. [1990]. Indicated are oceanic, continental and accretionary crust types as well as crustwhere no data is currently present. The map shows that southern Central America (CostaRica and Panama) is made up of accretionary crust and northern Central America isunderlain by continental crust.

Introduction 12
1.2.3.1.1 Crustal Thickness
Costa Rican crust is intermediate between continental and oceanic (Fig. 7). It is not as thick,old and layered as continental crust but thickened compared to oceanic crust. Crustalthickness in Costa Rica is locally as much as 40 km. Matumoto et al. [1977] found 43±7 kmfor the northern part of the country, the recent most seismic investigations in northern CostaRica documented 40 km [Goedde et al., 1998]. Crustal thickness in southern Costa Ricaseems to be less (Fig. 7). Stavenhagen et al. [1997] found a thickness of only 20 km. Althoughthe topography of the Talamanca mountain range stands well above the surrounding area, thetotal crustal thickness is not as much as that of the less elevated northern Costa Rica andNicaragua. This implies a mass deficiency in the lower crust and thus isostatic disequilibriumfor that particular region [Case et al., 1990], and characterises the Talamanca as a region ofvery young and rapid uplift (chapter 1.2.2.3). Reduced crustal thickness in southern CostaRica may result from the late establishment of arc magmatism in that region compared tonorthern Costa Rica [Tournon & Alvarado, 1997], (chapter 1.2.1), from a locally reducedthickness of the pre-arc crust, from much higher erosion rates, or from thermal erosion of thelower crust.
Figure 7: Map of the Caribbean depicting the crustal thickness (from Case and MacDonald,1990). Contour lines are 10 km intervals. This map shows that the crust underneath theCordillera de Talamanca is less than 30 km in thickness.
1.2.3.1.2 Crustal composition
Continental basement is unknown for Costa Rica and Panama [e.g., Tournon & Alvarado,1997]. No continental basement xenoliths or outcrops of such basement are presently known.Seismic refraction patterns lack the appropriate layering typical of continental crust [Goedde,1998]. From seismic investigation it was concluded that the crust in Costa Rica consists of athick section of basaltic composition comparable to the Ontong Java Plateau [TICOSECT,1998].Sr-Nd isotope variation diagrams for volcanics of the active arc show no contamination by oldcontinental crust for Costa Rica opposed to Guatemala where old continental crust is evident

Introduction 13
by the distinct pattern of Sr-Nd isotope enrichment along the mantle array [Carr & Feigenson,1986]. Using Sr isotopic compositions of Costa Rican volcanic rocks, Thorpe et al. [1979]exclude the presence of sialic crust older than about 80 m.y.
1.2.3.2 Subducting plate
The subduction zone off the Cordillera de Talamanca in southern Costa Rica and westernPanama is complex because it is the location of a triple junction. Two oceanic plates, theCocos and the Nazca plate, subducting underneath the Caribbean plate at different rates andangles, meet in this area. Furthermore, this convergence zone is modified by the subduction ofthe aseismic Cocos Ridge riding on the Cocos Plate.
1.2.3.2.1 Cocos Plate
The oceanic plate subducting underneath southern Costa Rica is currently the Cocos Plate.This plate subducts along the entire Central American Arc except for Panama. The CocosPlate terminated by the Galapagos Spreading Centre (GSC; also called Cocos-Nazca-Spreading-Centre) in the south and by the East Pacific Rise (EPR) in its west.Lithology and geochemical compositions are probed by DSDP and ODP drillings offGuatemala (Leg 495), near the Galapagos Rift (Site 504), and recently near Nicoya, CostaRica (Leg 170).The south-eastern part of the Cocos Plate may be separated from the remainder by the rough-smooth-boundary (RSB) after Hey [1977] and is characterised by the presence of abundantseamounts and the aseismic Cocos Ridge.At its subducting end, the Cocos Plate is still very young. Within the segment between theRSB and Panama-fracture-zone (PFZ), it dates to only about 15 Ma (Fig. 2) [Hey, 1977].Very high heat flow values above 3 HFU are remarkable for the north-eastern end of theCocos Plate near the triple junction as well as for the neighbouring Nazca Plate [Bowin,1976].
1.2.3.2.2 Cocos Ridge
The Cocos Ridge, located on the Cocos Plate south of Central America extends from southernCosta Rica to the Galapagos Archipelago (Fig. 10). It is a broad, shallow, bathymetric featurethat rises 2 to 2.5 km above the surrounding ocean floor. Marine refraction studies indicate acrustal thickness of 15 km [Bentley, 1974] to 25 km [TICOSECT, 1998] beneath the CocosRidge. This is significantly thicker than surrounding normal oceanic crust of the Cocos andNazca plates.
Today it is well established that the Cocos Ridge is a product of hot spot volcanism from theGalapagos hotspot [e.g., Duncan & Hargraves, 1984; Larson & Olsen, 1991; Hauff et al.,1997].Earlier two alternative hypotheses about the origin of the Cocos Ridge were discussed: (1) ahot spot hypothesis and (2) an ancestral-ridge hypothesis.In the ancestral-ridge hypothesis [van Andel et al., 1971; Malfait & Dinkelman, 1972; Heath& van Andel, 1973; Rea & Malfait, 1974; Meschede et al., 1998], the Cocos Ridge would bea former active spreading centre.

Introduction 14
However, in most recent studies, the Cocos Ridge is believed to be a trace from the Galapagoshot spot, produced by intense plume magmatism during relative movement of that plume tothe oceanic plate (Cocos Plate). This hypothesis was put forth by Wilson [1963] and Morgan[1971] and elaborated by Hey et al. [1977]. Lack of seismic activity as well as lack of parallelmagnetic anomaly stripes are indicators for the hotspot origin and arguments against anexplanation as a spreading ridge [e.g., Hey, 1977].A combined model of a former spreading ridge with superimposed hot spot volcanism isproposed by [Lonsdale & Klitgord, 1978] and [Meschede et al., 1998]. In that case, the vastvolcanic edifice of the Cocos Ridge would be a result of temporary ridge-hot spot interactionas can be observed today in Iceland.
In either of the above models, the Cocos Ridge must be even younger than the rather youngCocos Plate.Ages of the Cocos Ridge are mostly concluded from plate-tectonic reconstructions and aretherefore quite different for the above mentioned hypotheses. Meschede et al. [1998] calculatean age of 24 to 15 Ma for the Cocos Ridge in their spreading ridge model. Hey [1977] givesan age of about 20 Ma at its north-eastern end and Lonsdale & Klitgord [1978] deduce an ageof middle to late Miocene (~10-15 Ma?). Protti et al. [1995] calculate an age of 13-17 Ma forthe Cocos Plate at the trench near the Cocos Ridge, so that the superimposed hot spot tracemust be younger than that.New direct Ar/Ar age determinations on Cocos Ridge samples give an age of 13 to 14 Ma forthe Ridge at its end near the MAT [v.d.Bogaard & Werner, 1998].However, very recent activity along the ridge is documented by the Cocos Islands revealingan age of 1.91 ± 0.1 Ma [Bellon et al., 1983; Alvarado et al., 1992].
The bulk chemistry of the Cocos Ridge is tholeiitic similar to the chemistry found on theGalapagos Islands [Castillo, 1984; Castillo et al., 1988]. New analyses by Werner [1998]support this and indicate a trace element signature of MORB and Sr/Nd isotopic signatures ofmixed MORB – Plume sources as described by White [1993] for the Galapagos Islands. Theradiogenic isotopic composition of the Cocos Ridge matches that of the Galapagos Islandsand is distinct from that of the Cocos Plate [Werner, 1997]. This geochemical evidence pointsto a connection of the Cocos Ridge and the Galapagos hot spot.Seamounts on and adjacent to the Cocos Ridge are predominantly alkalic in composition anddisplay OIB signatures [Werner, 1998].
About 5 Ma ago the Cocos Ridge collided with the Central American trench. Since parts ofthe ridge were possibly cut in an en echelon manner along transform faults on the Cocos Plate[Malfait & Dinkelman, 1972], precursors could have been subducted below Panama prior tothe actual Cocos Ridge collision. The Malpelo Ridge is thought to be such a cut off fragmentof the Cocos Ridge [Lonsdale and Klitgord, 1978; Gardner et al., 1992; Meschede et al.,1998].The exact timing of the collisional event depends on the respective model of plate tectonicevolution or type and location of studies. However, all current research points to a date earlierthan former assumptions. Studies on emergence rates in the back arc of Costa Rica andPanama [Collins et al., 1995] point to 3.6 Ma, palaeotectonic reconstruction models for theCocos plate [Meschede et al., 1998] point to 4 Ma, evolution of local volcanism points to 5Ma [de Boer et al., 1995] and investigations on exhumation rates at Cerro Chirripó reveal 5.4Ma [Graefe, 1998] for the beginning of Cocos Ridge subduction.These new results are older than the ages of Lonsdale and Klitgord [1978], Corrigan et al.[1990], and Gardner et al. [1992], who proposed a date around 1 to 2 Ma for the collision.

Introduction 15
It is convincingly shown that the buoyant ridge did not stall or pivot when it encountered thetrench but was instead subducted beneath Central America. Direct observations of currentlyoccurring underthrusting were made with studies using submersibles [Heezen and Rawson,1977], and numerous studies documented the Cocos Ridge subduction indirectly by its effecton the arc (chapter 1.2.2).When subduction ceased at a ridge-trench encounter, the buoyant parts of the subducting platebroke up into non-subducting micro-plates [Atwater & Severinghaus, 1989].Bathymetric and tectonic investigations have documented a westward shift of the transformplate boundary between the Nazca and the Cocos Plate next to the Cocos Ridge [Moore &Sender, 1995]. This westward jump of the plate boundary may well be induced by sequentialindentation of the Cocos Ridge precursors and the Cocos Ridge itself, occurring upontemporarily reduced convergence rates in the respective area.However, there is no direct observation of disruption of the subducting Cocos Plate or CocosRidge as a consequence of collision with the Central American trench.
Figure 8: Tectonic map of southern Central America and the Galapagos area showinglocations of oceanic, aseismic ridges and exposures of ophiolites after Donnelly et al. [1990]and Hauff et al. [1997]. The ophiolites are of Cretaceous age and assumed to be parts of theCaribbean (Super-) Plume-event which shows compositional similarity to the presentGalapagos hot spot. The aseismic ridges are produced by the hot-spot during a later period ofactivity.

Introduction 16
1.2.3.2.3 Sediment cover
The sedimentary cover on the Cocos Plate, a potential candidate to subduction, is probed bythe drillings of ODP Leg 170 off Costa Rica and by DSDP Leg 67 Site 495 off Guatemala.Lithological and especially geochemical composition of the sediment is well documented forthe Guatemala Site and available at GERM [1998].New detailed information about the lithology of the subducting sediment section off CostaRica is gained from reference Site 1039 of Leg 170 off the Nicoya peninsula, very close to thetrench [Shipboard Sci. Party Leg 170, 1997].The sediment column can be subdivided into three lithostratigraphic units, comprising fromtop to bottom: a unit of diatomaceous ooze, a second one of silty clay and a third one ofcalcareous ooze. The lowermost sediments of the section are of early to middle Miocene age.Carbonates are prevailing in the sediments currently being subducted in the Costa Ricansubduction zone [Shipboard Sci. Party Leg 170, 1997].
For bulk geochemistry, the sedimentary column subducting beneath Costa Rica is broadlysimilar to that entering the trench off Guatemala. Slight exceptions exist with respect to a fewincompatible elements: K and Rb contents of the bulk sediment section are slightly higher, Srand Ba lower in the Costa Rican section as compared to the Guatemalan one. This isexplained by higher proportions of hemipelagic sediments in the sediment column off CostaRica, generally higher sedimentation rates and greater dilution of the marine baritecontribution [Kimura et al., 1997].
Intercalated ash layers of the upper ¾ of the sediment column have trace element signatures(Zr/Nb) indicating their derivation from a volcanic arc, whereas ash layers in the lowermostpart (early to middle Miocene age) show affinities to the Galapagos plume mantle [Kimura etal., 1997]. The shift in ash layer compositions traces the productivity of the respectivevolcanic systems but also the plate motion from its site of generation near the Galapagosislands towards its site of destruction at the Central American arc.
Seismic measurements across the Nicoya peninsula indicate that currently no sedimentaryaccretion takes place at the Costa Rican convergent margin [Goedde et al., 1997]. Thesefindings were substantiated by constraints from trace element concentrations, testifying thatsediments above the decollment are distinct from those on the incoming plate [Valentine etal., 1997].Geophysical data point to active underplating in Costa Rica [Shipboard Sci. Party Leg 170,1997], but the magnitude is not quantifiable by these methods. From comparisons of the 10Beinventory of volcanics from Costa Rica and the sediment section, the amount was specified to>40% of incoming sediment that were removed by underplating [Valentine et al., 1997].Effective separation of the upper hemipelagic sediment portion by underplating explains theabsence of 10Be reported by Morris et al. [1990] for the active volcanoes in Costa Rica.Therefore, only about 60% or less of the incoming sediment section is reaching depths ofmagma generation. Evidently, this is the lower part of the column.
Rates of sediment subduction in southern Costa Rica are influenced by the Cocos Ridgesubduction, which was reported to have deep, partly sediment filled grabens on its north-eastern end [Lonsdale & Klitgord, 1978].

Introduction 17
1.3 Previous Works
Systematic regional geological investigations of Central America began in the later nineteenthcentury [cf. Draper & Dengo, 1990].Due to its volcanic quiescence and inaccessibility, the area of the Cordillera de Talamancawas excluded from many research projects and reports [see e.g., v. Seebach, 1892, orFeigenson & Carr, 1986]. Nevertheless, there exist now several studies from the areadescribing the geology, petrology and in parts geochemistry or the effects of Cocos Ridgecollision on this segment of the arc.Primarily due to difficult accessibility of the Talamanca region, petrologic research has forlong time been of a reconnaissance nature.
The first scientific reports on the geology of the Cordillera de Talamanca are from Gabb[1874a, b, 1875], who explored the mountain chain in 1873 and 1874. Several years later,after extensive research in Central America, Sapper [1937] summarised the existinggeological knowledge in a book that also contains a schematic geological map of theCordillera de Talamanca. He already noted rapid and high uplift of the mountain chain andrejects the opinion that the Talamanca completely lacks young volcanic structures.Important systematic studies directly related to the Talamanca mountain chain are those fromWeyl [1957, 1980] and Dengo [1962]. Their research provided fundamental knowledge of thepetrography and stratigraphy from the Cordillera de Talamanca and a basis for the firstcomplete geological maps and sections.Interest in the Talamanca increased when mining companies started exploration for porphyrycopper ores in the 1970s. Results of these campaigns are however not published but in partsreferred to by Escalante [1990]. Ballmann’s mapping work during an exploration campaign ina remote area in the central part of the Talamanca gave evidence for the existence of spotswith relatively young volcanic activity within this mountain chain [Ballmann, 1976].Tournon [1984] provided a comprehensive overview on magmatism in Costa Rica with anemphasis on geochemical and geochronological data, including detailed information about therespective sample locations. Sampling for my study profited mostly from that thesis.A study of petrographic classification and major element geochemical comparison forintrusive rocks from the Cordillera de Talamanca and other locations in Costa Rica ispublished by Kussmaul [1987]. Alvarado et al. [1992] compiled a review of geochronologydata for Costa Rican igneous rocks. This data set is expanded in respect of the Talamancarocks by works of Defant et al. [1992], and de Boer et al. [1995].The publications of de Boer et al. [1995] and Drummond et al. [1995] are so far the mostelaborate geochronological and geochemical studies on igneous rocks from the Cordillera deTalamanca. Their work concentrated on the central mountain range but included thePanamanian part of the Talamanca. They define four distinct lithologic groupings of rocks(mid-Oligocene tholeiitic gabbros, mid-Oligocene El Barú plutonic rocks, Late Miocene calc-alkaline plutonic rocks, and a Pliocene-Pleistocene undifferentiated volcanic group), whichoverlap with groups of this study. Their study does not comprise igneous rocks from theforearc and backarc region.
Geochemical and geochronological work on backarc igneous rocks from the area aroundGuayacan was carried out by Azambre & Tournon [1977], Tournon & Bellon [1978], Stack[1991], Gargantini [1993], and Luoni [1993].
Igneous rocks in the inner forearc (Fila Costeña) are described in studies of Henningsen[1966], Mora [1979], Rivier [1985], Tournon, [1984], Kesel [1983], and Estrada & Alvarado

Introduction 18
[1993]. Published geochemical data from these rocks exist only to a very limited extent[Kussmaul et al., 1994; deBoer et al., 1995].
The effects of Cocos Ridge collision and subduction on the southern segment of the CentralAmerican arc system (comprising SE Costa Rica and W Panama) has been the subject tonumerous studies. Since this incident directly affects the investigated area and its magmaticevolution, these publications should also be listed here. Lonsdale & Klitgord [1978] were thefirst to postulate a date for the ridge/arc collision from their plate tectonic reconstruction.Corrigan et al. [1990] and Gardner et al. [1992] have studied the effect of the Cocos Ridgesubduction by investigating uplift rates in the forearc region. Collins et al. [1995] didcomparable studies in the backarc region. A relation of the gap in the chain of activevolcanoes in SE Costa Rica to Cocos Ridge subduction was drawn by McGeary et al. [1985].Kolarsky et al. [1995] presented a compilation of the known effects ascribed to Cocos Ridgesubduction.
Johnston and Thorkelson [1997] postulated a slab window underneath SE Costa Rica and WPanama which they hold responsible for the occurrence of certain magmatic rocks in this arcsegment. By plate-tectonic reconstruction they show that segments of the Cocos-Nazcaspreading centre may have been subducted at this site resulting in the slab window formation.
Previous works on the geochemistry of the area are selective by investigating solely a single,restricted arc region (e.g., Talamanca sensu strictu in [Drummond et al., 1995]) or even only acertain magmatic suite (e.g., Guayacán sills in [Gargantini, 1993]). Thus, spatial and temporalevolutions within this segment of the Central American arc system could not be investigatedcomprehensively so far. The present study tries to fill in this gap by describing and explainingthe evolution of this arc segment in its entirety and therefrom concluding to a consistent plate-tectonic model.
A new geological map including comprehensive explicative notes on the up-to-dateknowledge of Costa Rican stratigraphy is provided by Tournon and Alvarado [1997].

Field relationships and petrography 19
2 Field relationships and petrography
Volcanic and plutonic samples were collected along the entire length of the magmatic arc insouthern Costa Rica (Cordillera de Talamanca) as well as in the forearc (Fila Costeña) andbackarc (Limón basin), with the highest density of sampling from rocks dating around thecollisional event. Samples of magmatic rocks in southern Costa Rica were collected in amanner that those rocks would report the effects of Cocos Ridge collision as well as thecharacteristics of normal pre-collisional arc magmatism in that arc segment.Based on age relations, geochemical and isotopic data, petrography and geographicdistribution within the arc, five rock groups could to be distinguished: the pre-collisional arc-tholeiitic and calc-alkaline groups, and the syn- and post-collisional forearc calc-alkaline,backarc alkaline and adakite groups.Sample locations for the five rock groups are compiled in the topographic map (Fig. 9) to givean overview on the distribution of the groups. For detailed information on sample locationsrefer to the geological maps of Fig. 10.
2.1 Arc tholeiite group – pre-collisional
2.1.1 Field relationshipsTholeiitic samples are exposed within the Cordillera de Talamanca (central magmatic arc) aswell as within the Fila Costeña (forearc). In the fore arc they appear as dikes and small stocksin the lower sections, outcropping near Puerto Nuevo and Punta Uvita (Fig. 10.1). Dikes arealso present within the central magmatic arc near Division where the Interamericana (Pan-American Highway) crosses the watershed of the Cordillera (Fig. 10.3). Volcanics of thatgroup were found along the southern slopes of the Cordillera de Talamanca at Cerro Chirripó(Fig. 10.3) and Cerro Echandi near the Panamanian border (Fig. 10.5).
2.1.2 Lithology and petrographyThe tholeiitic groups comprises basalts, basaltic andesites and andesites as well as gabbros. Inhand specimen the volcanic rocks appear aphyric to porphyritic. The rocks are middle to darkgrey and dense. Signs of alteration are noticeable by a greenish touch, but most samplesappear fresh.Porphyritic to glomerophyric texture is common for these rocks, some of the samples displaya more intergranular, intersertal or serial texture. Principal minerals are pyroxene andplagioclase, the latter as phenocrysts and microphenocrysts, mostly euhedral, oftensericitisated and sometimes with sieve texture. Olivine is sometimes found, but almostentirely corroded and recrystallized to secondary minerals. Opaque minerals, predominantlymagnetite, are always present, as phenocrysts or groundmass component. Only one samplecontains minor amounts of anhedral brown-green amphibole. Conspicuous is the alteration ofthe samples. The least altered contain only minor amounts of chlorite, the highly alteredsamples contain chlorite, epidote, quartz, hematite, and calcite.Gabbros of the group are dark grey and massive. Their textures are more anhedral-granularthan intergranular. Main minerals are plagioclase and pyroxene, the former are euhedral tosubhedral, the latter more often anhedral. Olivine is present in almost all gabbro samples, butoften corroded. Ore minerals are always present, some of the samples contain biotite.Alteration is shown by sericitization of plagioclase, corrosion of olivine and the presence ofchlorite.

Field relationships and petrography 20
2.1.3 Interpretation:The above described volcanics show the principal mineralogy of tholeiites comprising olivine,plagioclase and pyroxene for the basaltic samples and predominantly plagioclase for theandesites. The greenschist facies paragenesis of alteration minerals indicates the exposition tolow-grade contact metamorphic conditions. These conditions were easily realised in theproximity to the intrusions and give a hint to their age as they have to be older than theintrusive phase within the Cordillera de Talamanca. Their lower age is confined by theirappearance as massive subaerial lava flows, which requires the existence of an island arc,already emerged above sealevel.Intrusive samples of this group are apparently less affected by alteration or low-grademetamorphic overprint than their volcanic equivalents. Thus, the original paragenesis oftheses primitive island arc magmas is better preserved, facilitating estimations about the rockschemistry. The generalised crystallisation sequence indicated by textural relationships in thegabbros is olivine followed by plagioclase, pyroxene, oxides, and finally biotite.
2.2 Calc-alkaline group – pre-collisional
2.2.1 Field relationshipsThis group comprises intermediate to silicic intrusive rocks and to a lesser amount volcanicrocks of calc-alkaline character. The samples were taken along the main magmatic arc,primarily in the crest region. Outcrops were found (from northwest to southeast) near thevillage Santa María de Dota (Fig. 10.2), along the Interamericana from the location Ojo deAgua down to the town San Isidro (Fig. 10.3), around Cerro Chirripó and Cerro Urán (Fig.10.3), to the south of Cerro Durika (Fig. 10.4), and between Cerro Pando and Cerro Echandiat the Panamanian border (Fig. 10.5).The volcanic rocks are exposed in the northwestern Cordillera de Talamanca, where theInteramericana (Pan-American Highway) intersects the mountain range.
2.2.2 Lithology and petrographyThe plutonic rocks show granular fabrics in hand specimen, and vary in colour betweengabbroic dark grey and tonalitic light grey. Two of the samples are aplite-granites andaccordingly brightly coloured white to pinkish and fine-grained.In thin sections, all these intrusives display granular textures, most often subhedral-granular.Plagioclase which is present throughout is often superseding other minerals in size and arecommonly subhedral. Other major rock forming minerals of these Talamanca intrusive rocksare alkali feldspar (mostly orthoclase), quartz, pyroxene, amphibole, biotite and magnetite.Accessory minerals are apatite, zircon and sphene. At least one of the hydrous mineralsamphibole or biotite is present in the rocks. Amphibole is always green in contrast to thosefrom the adakitic samples. Alkali feldspar is commonly orthoclase and occurs interstitially inthe more basic rocks and as large, anhedral crystals that ophitically enclose other minerals inthe more acid samples. Granophyric intergrowths of alkali-feldspar and quartz arecharacteristic of the most highly differentiated rocks, the aplitic stocks. Secondary mineralslike chlorite are present in minor amounts in some of the samples.Volcanic rocks of that group are highly porphyritic andesites and dacites, containingplagioclase and pyroxene in a black glassy matrix.The extremely porphyritic texture is characteristic of these samples. Large euhedral pyroxenesand plagioclases are embedded in a matrix of glass and tiny feldspar needles. All plagioclasephenocrysts display conspicuous sieve textures. Pyroxenes are both, clinopyroxenes and

Field relationships and petrography 21
orthopyroxenes. Further minerals are some large magnetite grains and accessory apatite.These volcanics appear quite fresh since non-devitrified glass is present.
2.2.3 InterpretationIn contrast to the related volcanics, amphibole is abundant in the intrusive rocks of the calc-alkaline group. This reflects most likely the increased stability of amphibole at depth. Theoverall abundance of hydrous minerals in these rocks may be indicative for the genesis ofthese calc-alkaline rocks, implying an essential contribution of hydrous phases from thesubducting slab.The textural appearance of the volcanic samples indicates their derivation from a rather hot,rapidly cooled magma. Preservation of the glassy texture is surprising since hydrothermalalteration was reported for most of the rocks in the immediate vicinity [Tournon & Alvarado,1997]. Thus, low alteration grades suggest fairly young ages for the volcanics. Interpreting themineral assemblage with its crystallisation sequence and the fabric points out to calc-alkalinecomposition.
2.3 Forearc calc-alkaline group – syn-collisional
2.3.1 Field relationshipsSamples of this group are volcanics without exception. They were found in the central part ofthe Fila Costeña, either as clasts within the sediments of the Paso Real formation near thevillage of same name, as remnants of lava flows near Cerro Mano de Tigre or at newlyencountered outcrops between the village Pejibaye and Río General (Fig. 10.1).
2.3.2 Lithology and petrographyThis group comprises dark grey to black, porphyritic basalts and andesites.Textural characteristics of these samples are predominantly porphyritic fabrics, sometimesporphyritic-aphanitic. In some of the samples, phenocrysts appear as aggregates, hence therocks have a glomerophyric texture. Plagioclase and pyroxene, both as phenocrysts,microphenocrysts and groundmass component, make up the main mineral constituents ofthese samples. Plagioclase and pyroxene phenocrysts are large up to several mm in size andboth are euhedral. In most of the samples, the plagioclases show a conspicuous sieve texture.Olivine is present in most if not in all of these samples, however, in some instances they areseverely corroded, and detectable only by their contours. Ore minerals are present throughoutand apatite was observed in some of the samples. Alteration other than olivine corrosion isconfined to minor chlorite growth in some of the samples. Despite these incipient signs ofalterations, the rocks have a quite fresh appearance.
2.3.3 InterpretationPresence of pyroxene and plagioclase and their crystallisation relationship and the in mostcases highly porphyritic nature point out to the calc-alkaline composition of these island arcbasalts and andesites. Olivine corrosion and the sieve texture in plagioclase seem to signaldisequilibrium in the magma, possibly related to mixing or assimilation processes. The overallfresh appearance suggests a rather young age of these rocks, hence they could not be relatedto the mafic intrusive rocks found in the forearc as well.

Field relationships and petrography 22
2.4 Adakite group – post-collisional
2.4.1 Field relationshipsIn SE Costa Rica, adakites are found in three separate locations. They occur either directlywithin the magmatic arc or at its southern end, whereby they seem to be extruded along majorfaults. A location within the Cordillera de Talamanca near Cerro Durika (Fig. 10.4) wasdescribed by Ballmann [1976]. Other outcrops, near the town San Vito at the villages AguasClaras and San Bosco (Fig. 10.5) are described by Tournon [1984]. The latter occurrence iscurrently quarried for pavement purposes. Tournon provides chemical analysis and age datafor the volcanics from these locations. A third location, about 20km NE from the San Vitoquarry at Cerro Pelón and Cerro Chivo, was not examined so far, though it is of largeextension. These newly described outcrops, together with already known centres of adakiticvolcanism, point to a considerably broader area of this type of volcanism in southeast CostaRica during Plio-Pleistocene times than recognised up to today.
2.4.2 Lithology and petrographySamples of this group are blocky jointed or massive andesites and breccious dacites. Theandesites are middle to dark grey whereas the dacites are pale grey and vesiculated.Conspicuous are large phenocrysts of white plagioclase and dark amphibole. Different is theappearance of two andesites which are black in colour and platy jointed, dense lava flows.Porphyritic texture is common to all adakite samples. The main mineral components involvephenocrysts of euhedral to subhedral plagioclase and euhedral brown to green-brownamphibole. The former shows always strong zonation, the latter is generally opacitized exceptfor the samples from the Durika area and a sample from the San Vito area. Euhedral toanhedral Pyroxene is also common. Pyroxene does not occur in the dacitic samples of theDurika area which contain instead anhedral biotite (xenocrysts?) and furthermore, wellrounded, large quartz crystals. Euhedral to subhedral olivine is present only in three samplesas xenocrysts where it is commonly strongly corroded. Titanomagnetite exists as phenocrystsand microphenocrsts, accessory minerals are zircon and apatite. Glomeroporphyritic xenolithscontaining pyroxene, plagioclase and olivine are present within some of the samples. Thegroundmass is cryptocrystalline, probably formerly glassy, to microcrystalline. Alterationseems to be confined to the glassy groundmass that subsequently devitrified.
2.4.3 Interpretation:The Durika samples contain a typical adakitic mineral assemblage (plag, mt, amph, bio, qz) asit is described by Defant et al. [1991] for the Panamanian samples. However, the pyroxenephyric, biotite and quartz free samples resemble adakites described for the southern Chileoccurrences [Stern & Kilian, 1995].Since all samples contain notable amounts of hydrous minerals (amphibole, biotite), theyseem to be derived by lower degrees of melting than some of the Chilean or Kamchatkaadakites that lack hydrous minerals [Stern & Kilian, 1995; Kepezhinskas et al., 1997].Opacitization and strong corrosion of the amphibole phenocrysts suggests extensive waterloss and reflects the increasing disequilibrium of the intratelluric amphiboles with the magmadue to pressure reduction during uprise of the magma [e.g., Pichler & Schmitt-Riegraf, 1987].No or only slight opacitization is present in the amphiboles from adakites of the Durika area,indicating faster uprise and cooling for these dacites.Xenoliths and xenocrysts of clinopyroxene and olivine are most probably mantle derived anddocument the passage of these magmas through the mantle wedge. Contaminations of thatkind rendered these adakites andesitic in composition and increased the Mg# (from about 40to 70).

Field relationships and petrography 23
2.5 Backarc group – syn-collisional
2.5.1 Field relationshipsBack arc magmas in Costa Rica erupted from several small centres along the entire length ofthe Caribbean coast (in the Limón basin). The back arc magmatism is exclusively of alkalinenature and the related volcanic and intrusive bodies are N-S aligned [Tournon, 1984]. Theoccurrence of the back arc magmatic features within only a few kilometres behind the activearc in Costa Rica is unusual for convergent margins [Milionis et al., 1986].Three rock suites were found to represent the back arc group of this study, comprising allalkalic magmas.One of these suites outcrops near the village Bribri at the Panamanian border (Fig. 10.7) andcomprises alkaline extrusive rocks and a dike. These occurrences were not published so far.This rock suite consists of alkaline basalts.The second suite was found near the village Guayacán between the cities Turrialba andSiquirres and the rivers Reventazón and Pacuare (Fig. 10.6). Some of the outcrops are nearthe young lava fields of volcano Turrialba. This suite is the most voluminous series ofvolcanic and intrusive alkaline rocks of a large compositional range in Costa Rica. It wasalready described in several studies [Azambre & Tournon, 1977; Tournon, 1984; Stack, 1991;Gargantini, 1993; Luoni, 1993].The third suite is represented by a single sample, an amphibole bearing lamprophyr fromCerro Bola near the town Neily (Fig. 10.5). Though the lamprophyr outcrops in a fore arclocation, it clearly belongs to the back arc group based on geochemical criteria. The linkbetween fore arc and back arc and the geochemical similarity can be explained by plate-tectonic features discussed below. The outcrop is mentioned in Tournon & Alvarado [1997]as a dome of potassic dacite.
2.5.2 Lithology and petrographyHand specimen of the Bribri suite can be described as middle grey to black and pyroxeneporphyritic.Textural characteristics are the porphyritic fabric with large euhedral augite phenocrysts in acrystalline matrix of plagioclase, pyroxene and opaque minerals. Olivine phenocrysts ormicrophenocrysts are present in all samples, except for a more differentiated sample. Brown,anhedral amphibole is found in two samples, where it appears very fresh despite opacitizationat the rims. Biotite was found in two samples that also contain notable amounts of nephelineand sodalite. Minor chloritization occurs in some of the samples.
The Guayacán rock suite comprises alkaline basalts and basanites as well as teschenites(alkali gabbro) in dikes and sills. The former are pyroxene and olivine phyric, the latter appearfine-grained granular. An exception is one sample of light grey colour with abundant large,black, euhedral amphibole, obviously a late stage differentiate.Glomerophyric texture is predominant in all these rocks, although in the intrusive samplesincreased size of groundmass crystals renders this texture slightly granular. The principalmineral assemblage of the rocks is olivine, calcic plagioclase, pyroxene, ore, and analcime.Olivine, occurring as large phenocrysts, is not present in the more differentiated rocks.Plagioclase is almost exclusively restricted to groundmass crystals. Euhedral pyroxene, mostoften in agglomerates of several individuals, is the dominating phenocryst, but alsogroundmass component. By its typical hourglass structure it can easily be identified as (ti-)augite. Opaque minerals are titano-magnetite, however in one case skeletal ilmenite wasidentified. Analcime is present in all samples as anhedral, isotrop component in the interstitialrealm. Further feldspathoids, present in most of the samples are euhedral sodalite andanhedral nepheline. Biotite is always present in variable but minor amounts. Amphibole with

Field relationships and petrography 24
cores of augite was only found in a highly differentiated sample. Other components may bealkali feldspar, and relatively abundant apatite. Alteration is restricted to occasionallyoccurring slight corrosion of olivine along fractures with some patches of chlorite.
The lamprophyric sample from Neily is fine-grained, pale grey coloured and contains, besidecrustal xenoliths, conspicuous megacrysts of biotite.This impression is confirmed in thin sections as the rock has a porphyritic texture withpyroxene and biotite phenocrysts. Feldspar is present only as groundmass constituent. Furtherminerals are fine-grained opaque ore minerals, minor amphibole, abundant apatite, interstitialnepheline and euhedral sodalite.
2.5.3 Interpretation:As it can be deduced from the development of crystal faces, size relations and intergrowths,the Limon backarc samples display a typical alkaline crystallisation sequence: olivinecrystallising first is followed by augite and only thereafter crystallises plagioclase. Thiscrystallisation sequence, the phenocryst assemblage, and of course the content of silica-undersaturated, alkali-rich minerals characterises these rocks as alkaline. Petrographically,they are quite distinct from samples of the other groups. The presence of hydrous primaryminerals points out to low degrees of melting but also to the presence of some water in themagma source.The sample from Neily is identified as a lamprophyr by its porphyritic character and theabundant, exclusively melanocratic phenocrysts. Silica undersaturation is a specialcharacteristics of this lamprophyr. Being a typical dike rock, the occurrence of the lamprophyrmay be bound to the landward projection of the PFZ, a major fracture zone that is traced tothe overriding plate.

Field relationships and petrography 25
San Vito
Rio Lari
Town
PanamericanHighway
Volcano
Mountain
River
3000-4000m2000-3000m
1000-2000m
0-500m500-1000m
Tholeiitic Group
Calc-alkaline Group
Forearc Group
Backarc Group
Adakite Group
2
V.IRAZU
C.URAN
Altitude
Sample location
SAN JOSE
V.POAS
V.BARVA
V.IRAZUV.TURRIALBA
C.KAMUK
C.AKA
C.DURIKA
CS.UTYUM
San Marcos
Santa Maria
Cartago
Heredia
C.BUENAVISTA C.URAN
C.PANDO
C.CHIRRIPO
Turrialba
C.PITTIER
San Vito
PENINSULA DE OSA
CARIBBEAN
Pto.Quepos
Pto. Limon
P.Uvita
SEA
PACIFIC OCEAN
BuenosAires
C.ECHANDI
Neily
Siquirres
SanIsidro
Bribri
Rio Grande de Terraba
N
0 10 20 30 40 50 km
2
2
2
2
1
34
5
6
7
Rio Sixaola
Rio Lari
Rio Reve
ntaz
on
Rio Pacuare
FILA DE M
ATAMA
Rio Telire
84°00' W 83°30' 83°00'
9°30' N
9°00'
8°30'
Figure 9: Topographic map with sample localities in southern Costa Rica. The five samplegroups are distinguished by different symbols. Location of the geological detail maps isindicated in the small inset.

Field relationships and petrography 26
Figure 10.1: Sample locations indicated in the geological map of the Fila Costeña betweenPaso Real and Punta Uvita. Map base from Tournon and Alvarado [1997].

Field relationships and petrography 27
Figure 10.2: Sample locations indicated in the geological map of the north-westernCordillera de Talamanca around Santa Maria de Dota. Map base from Tournon andAlvarado [1997].

Field relationships and petrography 28
Figure 10.3: Sample locations indicated in the geological map of the north-westernCordillera de Talamanca around the Pan-American Highway. Map base from Tournon andAlvarado [1997].
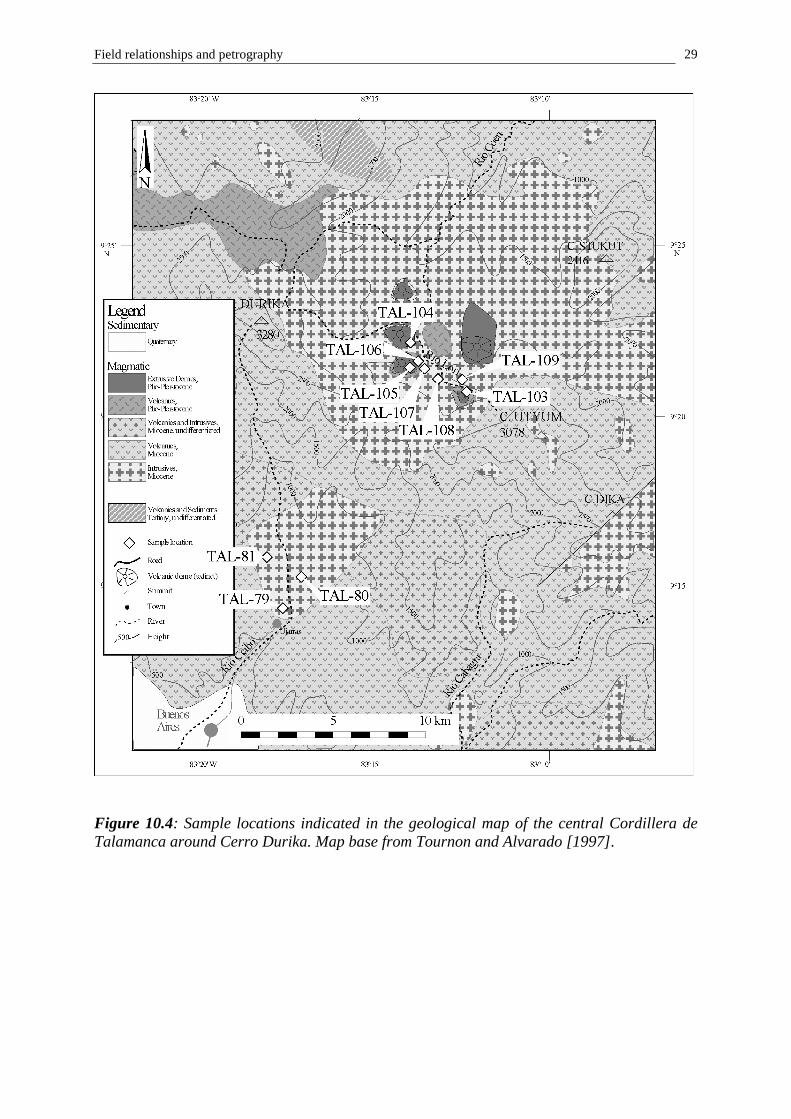
Field relationships and petrography 29
Figure 10.4: Sample locations indicated in the geological map of the central Cordillera deTalamanca around Cerro Durika. Map base from Tournon and Alvarado [1997].

Field relationships and petrography 30
Figure 10.5: Sample locations indicated in the geological map of the south-easternCordillera de Talamanca and Fila Costeña around San Vito. Map base modified fromTournon and Alvarado [1997].

Field relationships and petrography 31
Figure 10.6: Sample locations indicated in the geological map of the north-eastern LimonBasin around Guayacan. Map base from Tournon and Alvarado [1997].

Field relationships and petrography 32
Figure 10.7: Sample locations indicated in the geological map of the north-eastern LimonBasin around Bribri. Map base modified from Tournon and Alvarado [1997].

40Ar/39Ar Age Analyses 33
3 40Ar/39Ar Age Analyses
Radiometric ages of samples from the area of the Cordillera de Talamanca were determinedon amphibole separates by the Ar/Ar method.
The Ar/Ar method is a variant of the K-Ar isotopic dating method. Obtained ages reflect thetime elapsed since cooling of the rock upon magmatic or metamorphic heating events below acritical temperature which is variable for different minerals. This temperature is referred to asthe mineral closure temperature and falling below that temperature results in the prevention ofAr diffusion from the crystal.In contrast to the K-Ar method, no direct determination of K2O contents is necessary. Instead,Ar isotope ratios allow recalculation of the initial K2O content. Thus, the method bears theadvantage of reduced sample amounts, which in turn reduces time consuming and expensiveseparation work. Increased precision and reduced detection limits allow dating of very youngsamples up to Holocene ages.
Four samples, representative for their rock group, were selected for dating. These samples arean andesite from the Alturas suite of the Tholeiitic Group (ALT 16), a dacite from the AdakiteGroup (TAL 104), and a trachytic andesite and a teschenite from the Backarc Group (BRI 25,GUA 28). Petrographic examination shows them to be the least altered. Sample GUA 28 wasselected in order to check consistency of the Ar/Ar ages with published K-Ar ages for thisrock suite [Bellon & Tournon, 1978; Cassel, 1986]. The analysed samples, characteristics ofthe mineral separates, and the applied analytical technique are listed in Table 3-1.
Amphibole separates were dated rather than whole rocks, since mineral separates allow bettercontrol over alteration and metamorphic overprint. Low temperature alteration in the tropicalenvironment leaches the soluble alkalis out of the rock’s minerals and matrix to variabledegrees [e.g., Nesbitt et al., 1980]. Furthermore, some of the rocks are highly susceptible toalteration due to their glassy and vesicular fabric. Age determination on whole rocks that havesuffered K-loss due to alteration will result in erroneously high ages.Though their K-content is not very high (see Table 3-1), hornblendes are very suitableminerals for the Ar/Ar dating method because of their excellent Ar retention properties [e.g.,McDougall & Harrison, 1988]. Hornblende separates were obtained using standard separationtechniques. Robust and euhedral grains of hornblende, free of visible secondary alterationeffects, were selected for analysis.
Table 3-1: STEP: Step-heating experiment with the resistance furnace; CTF: ConventionalTotal Fusion with the resistance furnace; LASER: Laser induced total fusion; LA-STEP: step-heating experiment with a laser. In brackets: method of minor importance for the respectivesample.
Sample Group MineralSeparate
Grain Size Weight K2O (%) Technique
ALT 16 Tholeiitic Hornblende 125 - 315 µm 230 mg 0,25 STEP, (LASER)BRI 25 Backarc Hornblende 200 - 315 µm 210 mg 1,15 LASER, (CTF)GUA 28 Backarc Hornblende 200 - 315 µm 220 mg 1,06 STEP, (LASER)TAL 104 Adakite Hornblende 200 - 500 µm 820 mg 0,53 LASER, LA-STEP, (CTF)

40Ar/39Ar Age Analyses 34
Two different techniques of the Ar/Ar method were applied for dating:1. the resistance furnace step-heating technique; and2. the single crystal laser fusion technique
The step-heating technique is based on incremental heating of the sample material in aresistance furnace until total loss of gas. The released gas proportions are subsequentlymeasured in a mass spectrometer.The number of heating steps and their respective temperature has to be defined prior tomeasurement and is restricted by:• sensitivity of the mass spectrometer• sample weight• radiogen Ar contentThe radiogen Ar content depends on the K content, age, and possibly Ar retentivity of thesample.
Results of the analysis are plotted in total Ar release diagrams that reflect the spatialdistribution of Ar in the crystal lattice. Depending on its site within the crystal, Ar showsdifferent diffusion properties during heating. Ar that is loosely bound in the mineral rim isreleased during the early, low temperature steps, whereas more tightly bound Ar is released inlate steps. Thus, the step-heating technique provides a powerful tool to detect disturbances ofthe K-Ar system. Disturbances may either be caused by Ar-loss or introduction of anextraneous Ar component. Thermally induced Ar-loss could occur upon re-heating of thesample under metamorphic conditions and will result in younger ages for the dated rocks ascompared with their geological age due to loss of the daughter nuclide from the K-Ar system.Release patterns of samples that underwent such a processes are typically curved with youngapparent ages for the first, low temperature, steps. The higher temperature steps ideally havesimilar ages within 2σ variation, defining a so-called plateau-age. This plateau-agecorresponds to the geological age of the sample.Other possibilities of Ar loss are loss of 39Ar during neutron irradiation of the sample. Thiseffect, called recoil, is common for K-rich minerals of high surface/volume ratio and low Arretentivity [e.g., McDougall & Harrison, 1988]. The consequential increase of the 40Ar/39Arratio in these minerals results in erroneously old ages. Neighbouring K-poor minerals, likepyroxenes, may be susceptible to incorporation of recoil 39Ar [e.g., Faure, 1986], loweringtheir 40Ar/39Ar ratio and hence their apparent ages.
Extraneous Ar can be differentiated into:• inherited Ar• excess Ar
Inherited Ar is radiogenic 40Ar (40Ar*), introduced into the sample’s K-Ar system by physicalcontamination with older material, i.e. xenocrysts. Such impurities should be a minor problemin carefully examined mineral separates but they might nevertheless be present as minuteinclusions or adhering phases. Increase of total 40Ar* results in shifting of the apparent ages toolder values.
Excess 40Ar is defined as “40Ar incorporated in rocks and minerals by processes other than thein situ decay of 40K” [Lanphere & Dalrymple, 1976]. The occurrence of excess 40Ar results inanomalously old ages.A process that might explain the incorporation of excess 40Ar into metamorphic rocks andminerals is related to degassing of older rocks and migration of Ar via circulating fluids [c.f.Wartho et al., 1996], resulting in high 40Ar partial pressures in fluid phases during igneous

40Ar/39Ar Age Analyses 35
and metamorphic processes [e.g., Lanphere & Dalrymple, 1971]. Those fluids may then betrapped in fluid inclusions of the metamorphosed rocks and minerals [v. Blanckenburg &Villa, 1988].U-shaped release spectra are indicative of excess 40Ar [Lanphere & Dalrymple, 1971, 1976].Low and high temperature steps yield very little gas and are therefore very susceptible todisturbance of the Ar system. The excess 40Ar component is thus most obvious in these steps.Uptake of excess argon may occur in any mineral. However, it was recognised as a severeproblem in pyroxenes, due to their low potassium content [Hart & Dodd, 1962].
The laser fusion technique uses an IR-laser to heat samples with the option of high localresolution. Very small samples like single crystals can be measured by total fusion, or by step-heating if the radiogenic Ar content is high enough. Dating of individual mineral grainsallows a good control on the involvement of extraneous components. Statistically well definedages can be obtained by analysing multiple minerals of the same sample.
Results of multiple grain analyses with the laser fusion technique can be displayed in a so-called inverse isochron correlation diagram [Turner, 1971; Roddick et al., 1980], where the36Ar/40Ar ratio is plotted versus 39Ar/40Ar or 40K/40Ar. The latter is not commonly used, butallows direct age determination without knowledge of the respective J-values. The age isgiven by the intercept on the 40K/40Ar axis of a regression line through the data points. Theupper intercept of the regression line gives the initial 40Ar/36Ar ratio of the sample, whichcorresponds to the isotopic composition of the trapped, non-radiogenic component in thesample.Thus, the isochron analysis allows direct control on the composition of the non-radiogeniccomponent, as opposed to other methods of age calculation that have to rely on theassumption that the trapped argon is of atmospheric composition (40Ar/36Ar=295.5). The non-radiogenic component has to be subtracted from the total argon when calculating the age.Since the ratio of radiogenic to non-radiogenic argon is lower in younger samples than inolder, error propagation from inaccurately determined non-radiogenic argon results in poorlydefined ages especially for the younger samples. Trapped Ar, with a 40Ar/36Ar ratiosignificantly higher than the atmospheric value of 295.5 signals excess Ar incorporation.
Goodness of fit of the data points to their regression, i.e. the isochron, can be measured by themean square weighted deviate (MSWD). The MSWD is the sum of the squares of theweighted deviations from the best fit isochron, divided by the degrees of freedom, n-2, wheren is the number of data points [McIntyre, 1966]. The expected value is 1 where the data fit thestraight line to within experimental error. A MSWD > 2.5 would indicate that the simpleisochron model is not appropriate for a particular data set [McDougall & Harrison, 1988].
Sometimes, data points of a single sample lie in a wedge shaped area rather than on a singleisochron in the argon isotope correlation diagram. Chen et al. [1996] proposed the namesphenochron for this “wedge of time”. The upper boundary of this sphenochron,characterising the youngest material found in the sample, is thought to indicate the time oferuption. Crystals which plot significantly below this upper isochron of eruption must eitherbe older than the eruption (containing inherited argon in respect to whole rock’s K-Arsystem), or must appear older as a result of selective excess 40Ar incorporation during theirformation. These crystals are most likely xenocrysts if the sphenochron shows dispersion inages with no evidence for a non-atmospheric initial ratio. Excess 40Ar in these crystals wouldinstead be indicated by a 40Ar/36Ar ratio of the trapped argon significantly higher than 295.5.This would not match the definition of a sphenochron as a “wedge of time”. Confining

40Ar/39Ar Age Analyses 36
isochrons of the sphenochron are constrained to pass through the 36Ar/40Ar ratio of modernatmosphere (1/295.5).
3.1 Chemical composition of the amphiboles
Electron microprobe analyses were carried out to determine the K-content of the amphibolesof the four samples that were selected for dating. The K-content of the amphiboles defines theamount of sample material necessary for the dating procedure and gives restrictions to theapplicable dating methods (see above). Average K2O contents of the amphiboles are presentedin Table 3-1, the detailed analytical results are listed in Table xx in the Appendix.Formula calculation of the hornblendes and adjusting of the ferrous/ ferric ratio was doneaccording the procedure outlined in Schumacher [1997]. Guidelines for the adequatenomenclature of the amphiboles are provided by Leake et al. [1997].
Hornblende grains from the four samples show an extremely wide range in chemicalcomposition from pargasite to magnesiohastingsite, and to kaersutite (Fig. 11).For all compositions involved, (Ca + Na)B is above 1.00, Na is between 0.50 and 1.50, CaB isabove 1.50, and (Na + K)A is above 0.50, defining them as a group of calcic amphiboles. Oneof the samples is characterised by Ti above 0.50 (all numbers refer to the standard amphiboleformula, which was taken to contain 8 tetrahedral sites and was calculated to 23 oxygens).Compositions of the hornblendes from three of the samples are internally comparativelyuniform and plot into the fields of either pargasite, magnesiohastingsite, or kaersutite.Hornblendes of sample TAL 104 are however outstanding due to their large compositionalvariability ranging from pargasite to magnesiohastingsite.
Figure 11: Classification of amphiboles according to the recommendations of the Internatio-nal Mineralogical Association (IMA), published by Leake et al. [1997].

40Ar/39Ar Age Analyses 37
The chemical variability of the amphiboles is displayed in diagrams of major elementcompositions (Fig. 12). These correlation diagrams allow a clear discrimination between twohornblende varieties in sample TAL 104. One of the hornblende varieties is enriched in Aland Fe relative to the second phase, which in turn has higher Si, Mg, and K concentrations.All samples exhibit distinct K2O variation over a relatively small CaO range, resulting in aconsiderable spread in the CaO/K2O ratio (Fig. 12). Note that the Al-Fe-rich hornblende ischaracterised by higher CaO/K2O ratios (~34-40) than the Si-Mg-K-rich hornblende (~17-20).
Electron microprobe analyses of hornblendes from sample TAL 104 thus point out theirchemical heterogeneity with a mixture of two hornblende varieties. Pyroxene breakdown intoAl-Fe-rich hornblende occurring within the oceanic crust during prograde metamorphism mayhave resulted in the generation of one of the end-members. The other end-member, Mg-Si-K-rich, could result from subsequent reactions of the silicic, adakitic melt with the mafic mantlewedge during ascent or from reactions with a second melt phase.
Figure 12: Selection of diagrams illustrating the hornblende geochemical data acquired bymicroprobe analyses. The compositional variability displayed by hornblendes of sample TAL104 (circles in grey field) are remarkably large.

40Ar/39Ar Age Analyses 38
3.2 Step heating experiments
Two samples were measured with the step-heating technique: the tholeiitic andesite ALT 16and the teschenite GUA 28. Results are plotted in a diagram of apparent age and Ca/K ratioagainst the fractional release of 39Ar (Figs. 13, 14). The other two samples were fused in asingle step (total fusion) within the resistance furnace apparatus, since they were expected tocontain less argon.
3.2.1 ALT 16Sample ALT 16 was measured in four steps, at 600°C, 1000°C, 1200°C, and 1550°C (Fig.13). The third step, which yielded the largest amount of gas (90%), gave an age of 16.87±0.26 Ma. This is lower than the age obtained by integration of all fractions (the “total-gas”age of the sample: 18.33 ±0.39 Ma). The main release step is embraced by two steps of higherapparent ages. Thus, sample ALT 16 displays a saddle- or U-shaped release spectrum.The 600°C step yields an age value with an extremely large error (2σ), due to the low amountof gas released (0.6% of total 39Ar).
Figure 13: Step heating experiment on sample ALT 16. The diagram shows the apparent agefor each heating step versus the amount of 39Ar released. A comparison with the Ca/K ratioreceived during the steps allows check for chemical disturbances.
Small impurities may still be adhering to the hornblende grains, e.g. small matrix crystals ormore or less altered glass. This material with low Ar-retentivity properties will release its Arduring the lowest temperature steps, as reflected by the Ca/K ratio. The groundmass isgenerally more K-rich than the hornblendes. Thus, in the earliest heating steps the Ca/K ratiois clearly lower than in the higher temperature steps. Even though the 600°C step gave an

40Ar/39Ar Age Analyses 39
essentially meaningless age, it got rid of “impure” Ar, thereby increasing the precision of thefollowing steps as compared to the total fusion data.The U-shaped release spectrum of sample ALT 16 indicates that excess 40Ar was incorporatedin this rock (see above). Therefore, the main release fraction, is closest to the eruption age ofthe tholeiitic sample, but defines a maximum age. This step that released almost 90% of thetotal Ar, may still contain an excess 40Ar component.Rocks of the tholeiitic group show petrographic evidence of a metamorphic overprint, mostlikely from nearby plutonic intrusions. Emplacement of these plutons in the Cordillera deTalamanca may have driven metamorphic fluids that carried excess argon.Ar loss due to thermal affection of the rock could not be detected. A typical release spectrumfrom a sample that suffered Ar loss is differing from the observed one (see above).The Ar degassing spectrum clearly shows that the K-Ar system of sample ALT 16 was(thermally) disturbed. K-Ar dating or total fusion dating could not have detected thisdisturbance, and would have given erroneous ages.
3.2.2 GUA 28Sample GUA 28 was measured in three steps, at 600°, 1200°, and 1550°C (Fig. 14). The firststep of the release spectrum is again virtually undetermined due to the low amount of gasreleased (1%). After degassing of matrix impurities by the first step, the following main step,characterised by a high Ca/K ratio, yields a reliable age. That temperature increment releasedabout 95% of the total Ar and defines an age at 4.39 ±0.14 Ma. The apparent age in the laststep is much higher. The simultaneously increased Ca/K ratio indicates that this increaseresults from a Ca rich component.
Figure 14: Step heating experiment on sample GUA 28. The diagram shows the apparent ageversus the amount of 39Ar released and additionally the related Ca/K ratio received duringthe stepwise heating procedure.

40Ar/39Ar Age Analyses 40
The Ar degassing spectrum of sample GUA 28 characterises a physically disturbed samplecontaining an extraneous component that displays higher apparent ages than the hornblendecrystals. The most likely extraneous component in this case is pyroxene. Petrographicexamination of the samples showed that the amphiboles frequently contain pyroxene cores(Chapter 2). A valid explanation for the release pattern is that these pyroxene corescontributed inherited Ar to the system. However, petrographic examination gives no hint thatthey might be xenocrysts. Another and very likely explanation for the higher 40Ar/39Ar ratio inthese pyroxenes is the incorporation of excess 40Ar. Due to their very low potassium content,pyroxenes are very sensitive to incorporation of excess argon. This is a common problem inpyroxenes.Samples from this rock suite of Guayacan were dated earlier by Bellon & Tournon [1978] andCassel [1986] with the K-Ar whole rock method. Ages provided by theses authors areidentical to the total-gas age of sample GUA 28. The extraneous argon component in therocks of the Guayacan suite was not detected by the K-Ar whole rock analyses, but appears tobe insignificant in respect of the accuracy of the earlier age determinations.
3.3 Laser fusion experiments
The data acquired by laser fusion experiments on all dated samples are presented in Figure 15.Calculated ages are plotted versus R/R+A. Also shown are derived mean ages, weighted meanages, and age of the main release fraction of the step-heating technique and total fusion age,respectively.
3.3.1 ALT 16; GUA 28Few data points are available for the samples ALT 16 and GUA 28 (Figs 15 A, B). Sinceamphiboles of these samples were too small to yield measurable amounts of gas, three crystalswere fused at once. Calculating a mean age from these few data results in a poorly definedvalue with large 2σ variations. The heterogeneous age distribution of sample ALT 16 hintsagain at disturbance of the K-Ar system of the hornblende, but could not decipher its nature.Laser dates from sample GUA 28 give a lower mean age than the step-heating experiment.This may be because pyroxene inclusions were more carefully excluded from the laserseparates. However, the crystals tend to give lower apparent ages with lower R/R+A. Thiscould be explained by weathering of amphiboles or included glass phases.
3.3.2 BRI 25Though individual data points show significant errors for sample BRI 25, the high number ofmultiple grain analyses defines a well constrained age with narrow 2σ confidence intervals(Fig. 15 C). Uncertainties in the individual measurements are a consequence of highproportions of atmospheric argon. These can be contributed to the distinctive opacitisation ofthe amphibole’s rims. Ages derived from the laser fusion technique are considerably lowerthan those from total fusion in the resistance furnace. These higher ages may indicatecontamination of the sample.Hornblende sample BRI 25 defines a well constrained, meaningful age in the inverse isochrondiagram (Fig. 16), with a MSWD value near 1. The isochron age of this sample is 5.88 +23/-22 Ma and the initial 40Ar/36Ar ratio is almost atmospheric in composition.Both independent methods of weighted mean calculation from pooled age data of multiplemeasurements and the inverse isochron correlation diagram reveal a well defined age forsample BRI 25. The data set gives no hints to disturbance of the K-Ar system in this sample.

40Ar/39Ar Age Analyses 41
3 cr y
stals
single
crys
tal010203 04 050607080
Age
(Ma)
01
23
45
67
89
1 0
Horn
blen
deGU
A 28
B R/R+A
0102030405 0607080
1 31 5
1 71 9
2 12 3
1 41 6
1 82 0
2 2A
ge (M
a)
Horn
blen
deAL
T 16
A R/R+A
01
23
45
67
89
1001020304050607080
Age
(Ma)
Horn
blen
deTA
L 10
4D R/R+A
Age
(Ma)
01020304050607080
Horn
blen
deBR
I 25
01
23
45
67
89
10
C R/R+A
2 σ
inte
rval
of m
ean
age
2 σ
inte
rval
of w
eigh
ted
mea
n ag
e2
σ in
terv
al o
f mai
n st
ep a
ge
Figure 15: 40Ar /39Ar laser fusion experiments: Calculated single crystal ages versus R/R+A.

40Ar/39Ar Age Analyses 42
Figure 16: Inverse isochron diagram (36Ar/40Ar vs. 40K/40Ar) for single grain laser fusionexperiments on hornblende of sample BRI 25. Fit of the data to the isochron is very well asconfirmed by the MSWD. Intersection on the abscissa gives the age, intersection on theordinate the trapped argon composition of the rock.
3.3.3 TAL 104Hornblende crystals of sample TAL 104 display extremely variable ages with large errors(Fig. 15 D). This is more a result from sample heterogeneity than from low Ar yield (due toyoung ages and low potassium contents): These amphiboles were large and thereforecontained appreciable amounts of Ar. Though, however, the proportion of trapped non-radiogenic argon was also large, as reflected in the R/R+A ratio.
In the argon isotope correlation diagram (Fig. 17), multiple crystal analyses of sample TAL104 define a wedge shaped area, i.e. a sphenochron. The upper boundary of that sphenochrondefines the eruption age of the volcanic rock at 1.34 ±x Ma. The lower boundary, passingthrough the oldest data found in that sample, gives an age of 3.49 ±x Ma.There is no indication for excess 40Ar incorporation in the sample. The sphenochron includesall data when passing through the atmospheric 40Ar/36Ar ratio (per definition).Independent substantiation is coming from a laser step-heating experiment carried out on alarge hornblende crystal. The derived isochron is almost identical to the lower boundary of thesphenochron, and the initial 40Ar/36Ar ratio of this sample is indistinguishable fromatmospheric argon.A meaningless isochron age derived from a regression through the entire heterogeneous dataset gives a “mixing age” of 1.08 ±x Ma. That isochron would suggest the presence ofextraneous argon in the sample.
Heterogeneity in the age of sample TAL 104 is also obvious in histograms of the calculatedsingle grain laser fusion ages (Fig. 18). The presented histogram shows a peak (of high ageprobability) that can be to assigned to a juvenile component or the eruptive age besides otherpeaks derived from older components.

40Ar/39Ar Age Analyses 43
Figure 17: Sphenochron diagram derived from single grain laser fusion experiments onhornblende of sample TAL 104. That sample gives heterogen age values, definitely not lyingon a single isochron, and possibly documenting the preservation of two distinct ageinformation within the sample.
Figure 18: Histogram of age data compiled from single grain laser fusion ages. It is shown topoint out the heterogeneity of sample TAL 104 as well as to stress findings of data concen-tration around 1.5 and 3 Ma.

40Ar/39Ar Age Analyses 44
Heterogeneity in the hornblende population of sample TAL 104 is reflected in its chemicalcomposition as well. This can be shown in a plot of 37Ar intensities versus 39Ar intensities(Fig. 19). Intensities of these argon isotopes are proportional to the concentration of Ca and K,respectively, from which they are derived by neutron irradiation. All hornblende populationsbut those of sample TAL 104 show good correlation of 37Ar and 39Ar. Scatter of the datapoints of sample TAL 104 is conspicuous and is related neither to systematic potassium lossnor gain.Further evidence of heterogeneity in chemical composition comes from microprobe analysesand was outlined above (Chapter 3.1).
Figure 19: Plot of 37Ar versus 39Ar takes as equivalents for K and Ca to present chemicalvariances of the four samples and to show the heterogeneity of the hornblende in sample TAL104.
Obviously, ages and chemical composition of hornblende grains from sample TAL 104 arevery heterogeneous. The spread of ages is most likely related to variations between a youngeruptive age and an older inherited component. The older component may reflect a signatureinherited from the subducted slab that was partially molten to form these adakite samples. Inthat case, incomplete diffusive loss of the inherited argon during adakite formation would beresponsible for the variable and older ages within some of the hornblende crystals. Sincediffusion in the melt is depending on its temperature, it may be concluded that meltingtemperatures have been too low to get rid of the total amount of inherited argon by effectivediffusion. Partial melting of the oceanic crust to form adakites starts already at temperatureslittle above 700°C [Defant], whereas loss of thermal stability in hornblendes occurs onlybeyond 600-800°C [Gaber et al., 1988]. Heterogeneity in age data detected in this sample maybe a common problem in adakites due to their unusual generation by partial melting ofamphibole bearing, metamorphosed oceanic crust at relatively low temperatures.

40Ar/39Ar Age Analyses 45
3.4 Ages of magmatic rocks from the Cordillera de TalamancaDiscussion of results from new 40Ar/39Ar age determinations and literature age data
New Ar/Ar ages on Talamanca magmatic rocks are reported in Table 3-2. Highlighted arethose values that are considered as most reliable, following the explanations in the precedingchapter. These data, together with K-Ar whole rock ages from literature sources (listed inTable 3-3) are presented in Figure 20, versus their location in the arc profile. The five rockgroups, defined on geochemical criteria, are to some extent also distinct by their ages.
Table 3-2: New Ar/Ar age determinations for magmatic rocks from the Cordillera deTalamanca area. Age differences result from different analytical methods and interpretationmethods. Errors are 2σ of the mean. Highlighted are the most reliable age values.
Sample Furnace totalfusion
Furnace largest-Step-
Laser mean age Laser weightedmean
Inverse Isochron
ALT 16 18.33 +/- 0.40 16.87 +/- 0.27 17.46 +/- 1.05 17.36 +/- 0.37BRI 25 7.42 +/- 0.34 - 5.64 +/- 0.58 5.82 +/- 0.09 5.88 +/- 0.23GUA 28 4.54 +/- 0.15 4.39 +/- 0.14 3.77 +/- 0.61 3.92 +/- 0.11TAL 104 1.92 +/- 0.10 - 1.89 +/- 0.93 1.90 +/- 0.17
Arc-tholeiitic magmatism in the area of the Cordillera de Talamanca is documented byradiometric dating from about 32 to 11 Ma. The data point to increased arc-tholeiiticmagmatic production during the Middle Miocene, with activity taking place within theCordillera de Talamanca sensu strictu (ages between 17 and 11 Ma), as well as within the FilaCosteña (ages between 15 and 11 Ma).These rocks are thus exclusively pre-collisional in respect of the Cocos Ridge arrival andrepresent products of subduction related volcanic activity in a young arc, and not products ofan inserted tholeiitic phase in the volcanic cycle of a mature arc.
Samples of the calc-alkaline group are generally younger, but seem to overlap both, in timeand space with the older tholeiitic group. Ages of these samples range predominantly from 12to 8 Ma. Intrusive activity obviously continued for much longer in the northwestern end of theCordillera de Talamanca than in the remainder areas of the Cordillera (7 to 2 Ma for theEscazu complex). In Panama, at El Baru (31 Ma), and in places east of it [de Boer et al.,1995], calc-alkaline intrusive activity was established earlier than in the Costa Rican part ofthe Cordillera de Talamanca.Dated plutonic complexes from the Cordillera de Talamanca tend to decrease in age towardsthe northwestern end of this mountain chain. This trend is displayed in Figure 21 by the linearregression through the age data, which are plotted in a profile across the magmatic arcaccording to their outcrop locations. Northwestward younging of the intrusive rocks isinversely correlated with absolute heights in this mountain chain (see e.g., de Boer et al.[1988]), and may result from northwestward propagating uplift of the Cordillera deTalamanca. Prerequisites for this interpretation are however:• Simultaneous intrusive activity along the entire length of the Cordillera de Talamanca• Intrusions taking place at comparable crustal levels• Intrusion ages decreasing upwards• Almost constant erosion rates through timeIf this holds true, those parts of the mountain chain that are uplifted earlier will have longerbeen subjected to erosion and hence been cut to deeper crustal levels, exposing older plutonicrocks.

40Ar/39Ar Age Analyses 46
Figure 20: Profile showing radiometric ages for the 5 rock groups. Numbers for new data.

40Ar/39Ar Age Analyses 47
Calc-alkaline volcanics are generally younger than their intrusive counterparts. They outcroponly in the northern region of the Cordillera de Talamanca and range in age between 8 and 3Ma. Other occurrences were probably effectively eroded. A radiometric age of about 17 Maderived for a calc-alkaline volcanic sample [Bellon & Tournon, 1978] was seriouslyquestioned by later investigations [Alvarado et al., 1992].Calc-alkaline magmatic activity takes over the preceding tholeiitic activity during the MiddleMiocene in southern Costa Rica. This change in arc magmatic composition characterises theincreasing arc maturity. This kind of “normal” arc magmatism in the Cordillera de Talamancasensu strictu is pre-collisional, and ended with the time of Cocos Ridge collision.
Figure 21: Age data variations along the Cordillera de Talamanca compiled for samples ofthe calc-alkaline group. The diagram is based on radiogenic age data available from theliterature (see table). As a result of the compilation it becomes evident that ages of datedplutonic complexes decrease to north-east within the Cordillera de Talamanca
Backarc magmatism began during the uppermost Miocene and migrated in time towardsnorthern Costa Rica. This trend of younging of backarc magmatic activity is evidenced by therock suite of Bribri from near the Panamanian border dating to 5.8 Ma, the Guayacan suite incentral Costa Rica of Pliocene age (4.4 to 4.6 Ma), and backarc suites off the investigated areato the north which are Pleistocene (1.2 Ma) to sub-recent.A plot of age variations within alkalic rocks from locations along the backarc in Costa Rica(Fig. 22) presents the obvious younging trend of these complexes towards NW. This trend isemphasised by the linear regression through the available data points. Restricting assumptionsthat limit the interpretability of this trend are not necessary for these volcanic rocks in contrastto the intrusive rocks of the Calc-alkaline Group.

40Ar/39Ar Age Analyses 48
Alkaline backarc magmatic activity is simultaneous with the collision event of the CocosRidge with the Central American Arc. This activity occurs within restricted, relatively short-lived areas, that shift through time in a NW direction. The occurrence of these backarcmagmatic rocks documents drastic changes in the melting regimes within this arc segment,that are related to major changes in plate configurations in southern Central America. Thedirected age trend for this kind of magmatism strongly suggests a northward or northwestwarddirected progression of these changes.
Figure 22: A plot of age data variations for alkaline magmatic rocks along the Costa Ricanback arc presents a distinctive younging towards NE. The diagram utilises radiogenic dataavailable from literature as well as the new data provided by the present study for thebackarc alkaline group.
Calc-alkaline volcanic activity of the Fila Costeña is comparatively young. Samples are datedto the Plio-Pleistocene with most ages ranging from 4 to 1 Ma. Volcanism in this forearc areais localised and believed to be relatively short-lived, though the radiometric ages suggestrepeated activity.Calc-alkaline volcanic activity in the forearc area is post-collisional. From occurrence, extent,and ages it can be concluded that this activity may represent a relatively short phase ofrenewed arc volcanism offset to the trench, or the reflection of a thermal anomaly temporarilyexisting in the mantle underlying that area.
The adakitic samples are of Upper Pliocene to Pleistocene age. Maximal ages of 2.6 Ma and2.8 Ma, respectively [Tournon, 1984; de Boer et al., 1995] are found in the southeastern CostaRican outcrops as well as in the central Cordillera de Talamanca. Younger ages for theadakitic samples are also reported for both locations, ranging up to about 1Ma [de Boer et al.,

40Ar/39Ar Age Analyses 49
1995]. Thus, no systematic age variations are found for these locations of adakite eruptions.However, in the preceding chapter it was demonstrated that heterogeneity in ages may resultfrom inherited components, which could stay undetected by use of an inadequate datingmethod. High susceptibility to alteration additionally limits the applicability of the K-Arwhole rock dating method for these rocks.Further investigation of this rock group with the Ar/Ar method on separates of differentminerals seems to be very promising to confine the problem of sample heterogeneity, and todetermine the eruptive ages of adakites from different locations in southern Costa Rica. If thisproblem could be resolved, the possible establishment of an age sequence within the eruptionsfrom the different locations would give new information on the relationship between adakitegenesis and Cocos Ridge subduction.Samples of the adakite group are post-collisional and restricted to a very short period of time.They are directly related to Cocos Ridge subduction, as they started erupting when thesubduction process had been going on for some time and stopped erupting shortly after that,probably upon changes in the subduction zone geometry.

Geochemistry 50
4 Geochemistry
This chapter discusses the compositional systematics of the magmatic rocks from the area ofthe Cordillera de Talamanca. After classification of the rocks, geochemical criteria for thedistinction of the five rock groups are presented, differentiation trends of the magmatics arediscussed, and source characteristics are presented.Major and trace element data of the 80 analysed rock samples are listed in Appendix X,together with the description of analytical methods.
4.1 Major elements
4.1.1 ClassificationVolcanic and intrusive rocks from the area of the Cordillera de Talamanca can be subdividedinto members of two major magma series: alkalic and sub-alkalic. This distinction ispresented in the Total Alkalis versus Silica (TAS) diagram, the dividing line after Irvine andBaragar [1971] separates the two series (Fig. 23). The alkalic series is represented by only onegroup: samples from backarc locations, the four remainder groups are all sub-alkaline.
Figure 23: Diagram of Na2O+K2O vs. SiO2 (TAS diagram) for the distinction of the alkalicand sub-alkalic rock suites. The boundary is from Irvine & Baragar [1971].
Sub-alkalic rocks can be further subdivided in a diagram of K2O vs. SiO2 (Fig. 24). Thisdiagram shows subdivisions after Le Maître [1989] and Rickwood [1989], separating fields oflow-K tholeiitic series, calc-alkaline series, high-K calc-alkaline series and shoshonite series.Magmatic rocks of southern Costa Rica display differentiation series that cross thesesubdivisions in a steep trend. Recognition of the four distinguished sub-alkalic groups fromthe area of the Cordillera de Talamanca is not feasible using this diagram. However, the“Tholeiitic Group” shows notable tendencies to low alkali contents, whereas the “Calc-
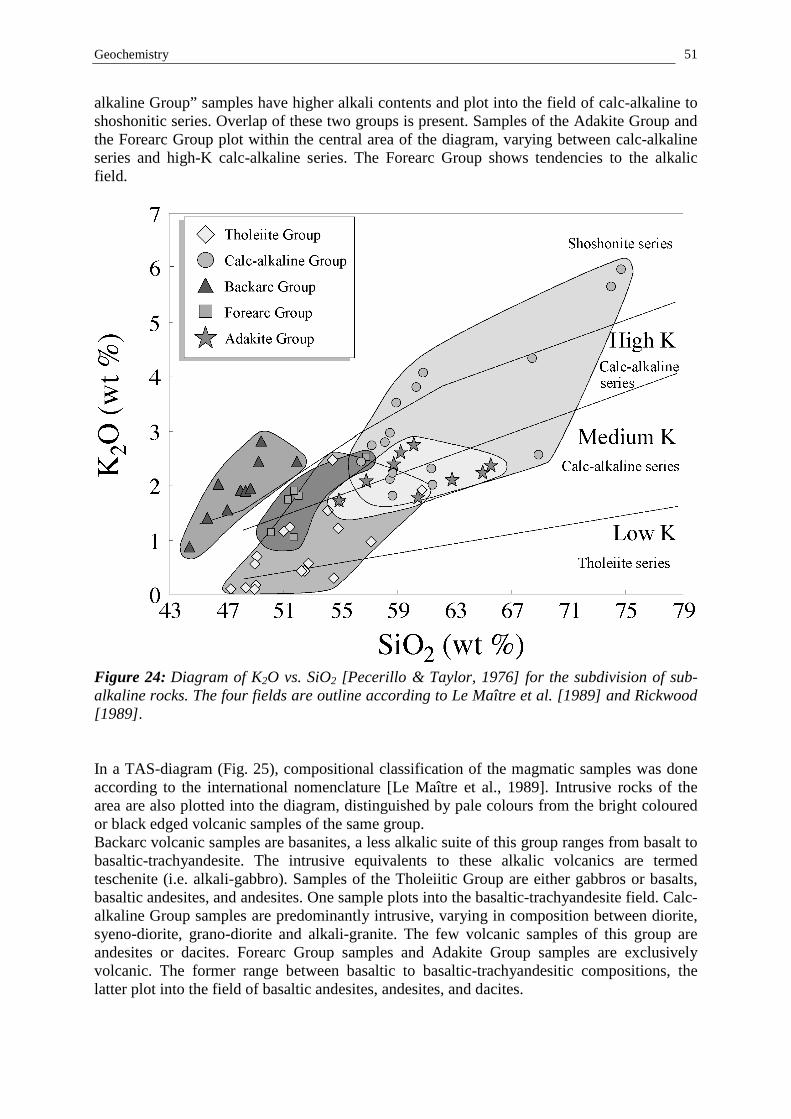
Geochemistry 51
alkaline Group” samples have higher alkali contents and plot into the field of calc-alkaline toshoshonitic series. Overlap of these two groups is present. Samples of the Adakite Group andthe Forearc Group plot within the central area of the diagram, varying between calc-alkalineseries and high-K calc-alkaline series. The Forearc Group shows tendencies to the alkalicfield.
Figure 24: Diagram of K2O vs. SiO2 [Pecerillo & Taylor, 1976] for the subdivision of sub-alkaline rocks. The four fields are outline according to Le Maître et al. [1989] and Rickwood[1989].
In a TAS-diagram (Fig. 25), compositional classification of the magmatic samples was doneaccording to the international nomenclature [Le Maître et al., 1989]. Intrusive rocks of thearea are also plotted into the diagram, distinguished by pale colours from the bright colouredor black edged volcanic samples of the same group.Backarc volcanic samples are basanites, a less alkalic suite of this group ranges from basalt tobasaltic-trachyandesite. The intrusive equivalents to these alkalic volcanics are termedteschenite (i.e. alkali-gabbro). Samples of the Tholeiitic Group are either gabbros or basalts,basaltic andesites, and andesites. One sample plots into the basaltic-trachyandesite field. Calc-alkaline Group samples are predominantly intrusive, varying in composition between diorite,syeno-diorite, grano-diorite and alkali-granite. The few volcanic samples of this group areandesites or dacites. Forearc Group samples and Adakite Group samples are exclusivelyvolcanic. The former range between basaltic to basaltic-trachyandesitic compositions, thelatter plot into the field of basaltic andesites, andesites, and dacites.

Geochemistry 52
Figure 25: TAS diagram after Le Maître et al. [1989] for the classification of igneous rocks.
Figure 26: AFM ternary for the differentiation of tholeiitic and calc-alkaline rock series. Astands for Na2O+K2O, F for total FeO, M for MgO. The dashed separation line is from Irvine& Baragar [1971].

Geochemistry 53
An AFM-diagram (Fig. 26), showing typical differentiation trends of Talamanca tholeiite andcalc-alkaline rocks, can be used to stress the distinct character of these two groups. The Calc-alkaline Group displays a straight differentiation trend below the separation line after Irvineand Baragar [1971]. The trend of the tholeiite group is at higher FeO values and characterisedby an additional ascending branch because of iron enrichment prior to a sudden start ofstabilisation and fractionation of the ore minerals.
4.1.2 Classification of intrusivesIn the following passages of this study,I will abandon a separate discussion ofvolcanic and plutonic rocks, since theyare directly related and geochemicallyuniform.However, for the sake of completeness,the intrusive rocks of the Talamancaarea have to be classified in thischapter. Classification of intrusiverocks is best done in the QAPF diagram(Fig. 27) after Streckeisen [1976] andLe Maître et al. [1989] withrecommendation by the IUGSSubcommission. This classification isfundamentally mineralogical but it mayalso be done by calculations based onthe appropriate compositional analyses.For this purpose, the modal mineralcontent was calculated from the wholerock chemistry and typical mineral dataof the respective plutonic rock type,using the least-square mass balanceprogram Petmix after Le Maître [1979].This method bears the advantage ofbeing applicable also to more fine-grained varieties of intrusive rocks.Calc-alkaline intrusives of SE CostaRica are compositionally the mostvariable rock group, spreading in thediagram from quartz-monzodiorites
over quartz-monzonites and granites to alkali-granites. Granodiorites and monzonites are alsopresent. The tholeiite group comprises primarily gabbros but also a quartz-monzogabbro. Thealkalic intrusives of the backarc group, which are known as teschenites, plot in the field offoidgabbros and foiddiorites.The QAPF diagram contains some additional data points of rocks which had to be omittedfrom further investigation due to their alteration.
Figure 27: QAPF diagram after Streckeisen [1976] and Le Maître et al. [1989] forclassification of plutonic igneous rocks. The modal mineral content is calculated from wholerock and mineral compositions.
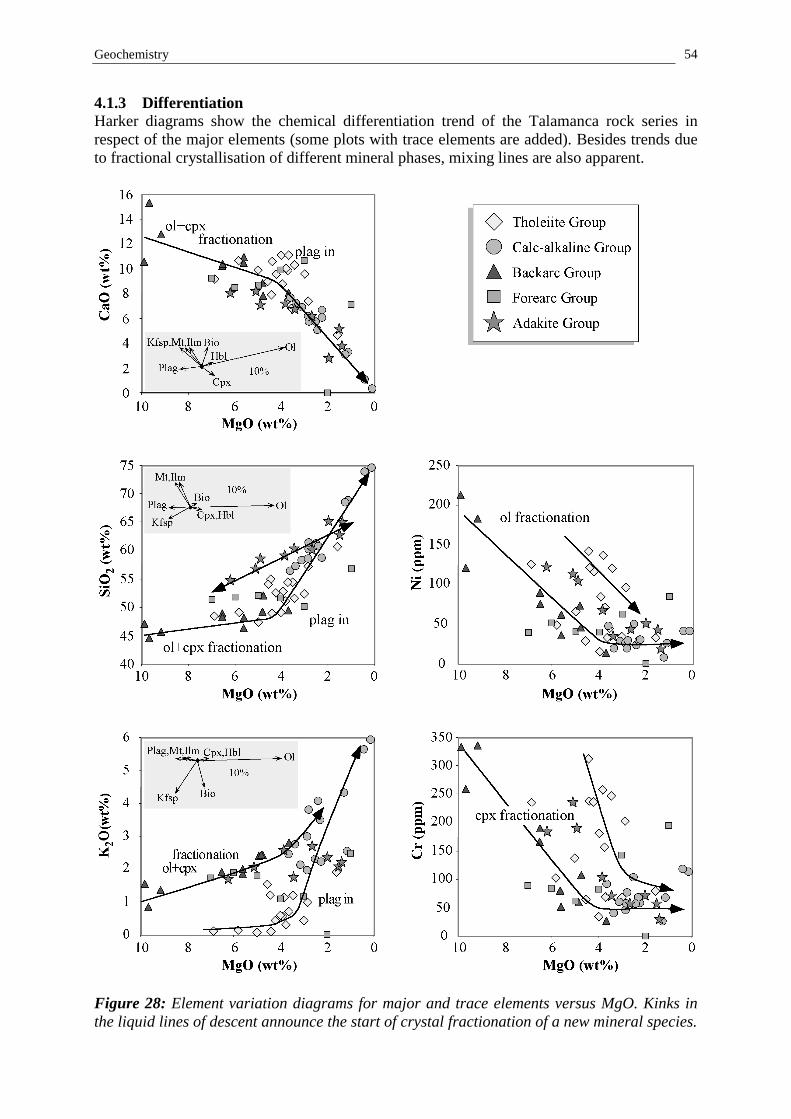
Geochemistry 54
4.1.3 DifferentiationHarker diagrams show the chemical differentiation trend of the Talamanca rock series inrespect of the major elements (some plots with trace elements are added). Besides trends dueto fractional crystallisation of different mineral phases, mixing lines are also apparent.
Figure 28: Element variation diagrams for major and trace elements versus MgO. Kinks inthe liquid lines of descent announce the start of crystal fractionation of a new mineral species.

Geochemistry 55
Figure 29: Harker diagrams showing elemental variations of major elements and some traceelements versus SiO2. The five rock groups of the Talamanca area display liquid lines ofdescent with clear evidence for fractionation and other straight lines due to mixing.

Geochemistry 56
Samples of the tholeiite group and those of the alkaline group are the most primitive of theTalamanca area, i.e. they have undergone the least crystal fractionation. This is obvious fromthe presented element variation diagrams. The alkaline rocks are only affected by someolivine and pyroxene fractionation. Samples of the calc-alkaline group are in contrastextremely differentiated by crystal fractionation. Fractionated to lesser degrees are thesamples of the forearc group. The adakite group samples display however strong evidence formixing. This mixing effect poses difficulties for the estimation of the role of fractionation forthese rocks.
Plots of major and some trace elements versus MgO are the most suitable to show thechemical trend within the more mafic samples. Correlation of Ni with MgO and Cr with MgOare presented in Figure 28, lower right. The course of the liquid line of descent is at firstmainly governed by Ol and Cpx fractionation. Backarc samples and tholeiitic samples showboth considerable fractionation of these two minerals. For the samples of the Forearc Groupand especially for those of the Calc-alkaline Group fractionation of these minerals has becomenegligible. However, the Adakite Group shows also co-variation of Ni and MgO as well as Crand MgO.Plots of CaO, SiO2, and Al2O3 versus MgO present a marked inflection in the liquid line ofdescent that is related to plagioclase fractionation. At high MgO values only Ol and Cpxfractionation occurs, whereas around 4% MgO, plagioclase enters the fractionatingassemblage. These diagrams point out that plagioclase is not a fractionating phase in thealkaline backarc samples.Harker diagrams of major element oxides versus SiO2 and some additional diagrams of traceelements versus SiO2 (Fig. 29) characterise the major fractionating phases olivine,clinopyroxene, plagioclase, as well as alkali-feldspar, magnetite/ilmenite and the accessoryphases like apatite and zircon. These geochemical findings are in accordance with thepetrographical observations.Whereas for most of the rock groups the trends are governed by fractional crystallisation, thetrend of the Adakite group represents a mixing line. This is indicated by a straight line acrossthe normal fractionation trend and is especially striking in diagrams of Al2O3 versus SiO2 andMgO versus SiO2. The high Al2O3- and SiO2-endmember is represented by primary adakiticmelts whereas the high Mg end-member reflects an admixed mafic component.
Extract calculations for several minerals are presented within the small insets in the variationdiagrams. These calculations are useful to find out the principle fractionating minerals for therespective diagrams. Calculation was done after Cox et al. [1979] by starting from the mostprimitive rock of the data set and extracting 10% of the minerals.
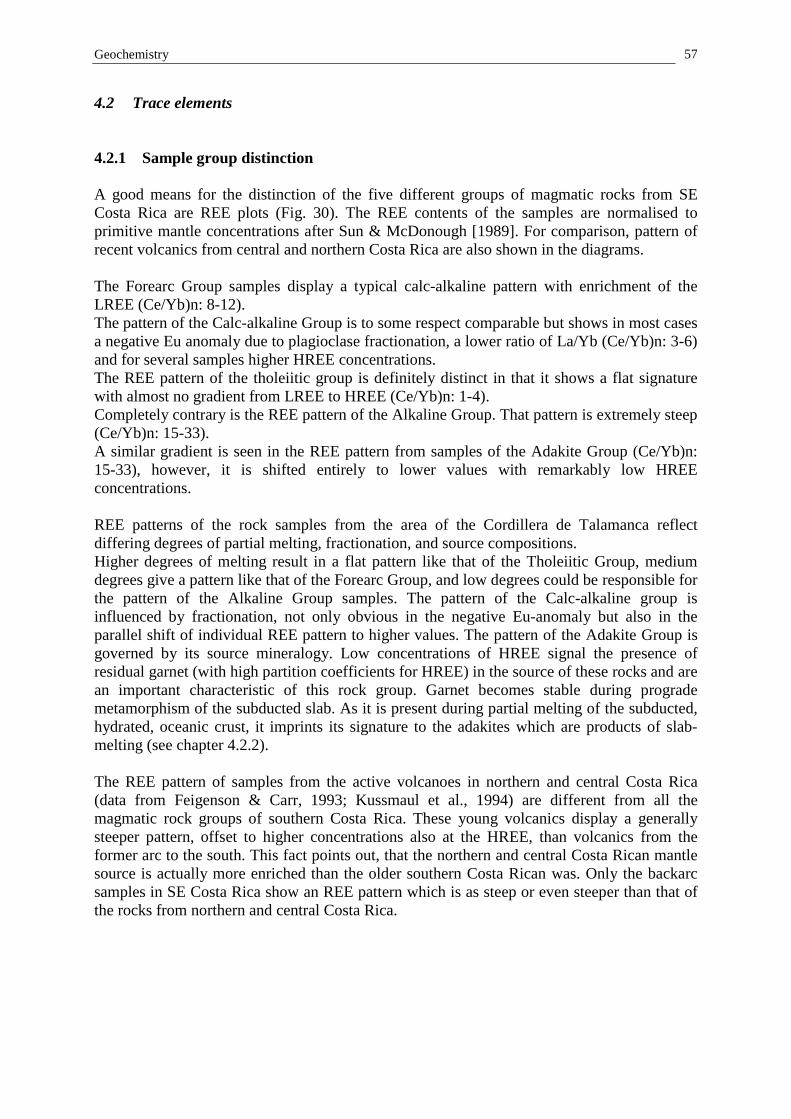
Geochemistry 57
4.2 Trace elements
4.2.1 Sample group distinction
A good means for the distinction of the five different groups of magmatic rocks from SECosta Rica are REE plots (Fig. 30). The REE contents of the samples are normalised toprimitive mantle concentrations after Sun & McDonough [1989]. For comparison, pattern ofrecent volcanics from central and northern Costa Rica are also shown in the diagrams.
The Forearc Group samples display a typical calc-alkaline pattern with enrichment of theLREE (Ce/Yb)n: 8-12).The pattern of the Calc-alkaline Group is to some respect comparable but shows in most casesa negative Eu anomaly due to plagioclase fractionation, a lower ratio of La/Yb (Ce/Yb)n: 3-6)and for several samples higher HREE concentrations.The REE pattern of the tholeiitic group is definitely distinct in that it shows a flat signaturewith almost no gradient from LREE to HREE (Ce/Yb)n: 1-4).Completely contrary is the REE pattern of the Alkaline Group. That pattern is extremely steep(Ce/Yb)n: 15-33).A similar gradient is seen in the REE pattern from samples of the Adakite Group (Ce/Yb)n:15-33), however, it is shifted entirely to lower values with remarkably low HREEconcentrations.
REE patterns of the rock samples from the area of the Cordillera de Talamanca reflectdiffering degrees of partial melting, fractionation, and source compositions.Higher degrees of melting result in a flat pattern like that of the Tholeiitic Group, mediumdegrees give a pattern like that of the Forearc Group, and low degrees could be responsible forthe pattern of the Alkaline Group samples. The pattern of the Calc-alkaline group isinfluenced by fractionation, not only obvious in the negative Eu-anomaly but also in theparallel shift of individual REE pattern to higher values. The pattern of the Adakite Group isgoverned by its source mineralogy. Low concentrations of HREE signal the presence ofresidual garnet (with high partition coefficients for HREE) in the source of these rocks and arean important characteristic of this rock group. Garnet becomes stable during progrademetamorphism of the subducted slab. As it is present during partial melting of the subducted,hydrated, oceanic crust, it imprints its signature to the adakites which are products of slab-melting (see chapter 4.2.2).
The REE pattern of samples from the active volcanoes in northern and central Costa Rica(data from Feigenson & Carr, 1993; Kussmaul et al., 1994) are different from all themagmatic rock groups of southern Costa Rica. These young volcanics display a generallysteeper pattern, offset to higher concentrations also at the HREE, than volcanics from theformer arc to the south. This fact points out, that the northern and central Costa Rican mantlesource is actually more enriched than the older southern Costa Rican was. Only the backarcsamples in SE Costa Rica show an REE pattern which is as steep or even steeper than that ofthe rocks from northern and central Costa Rica.

Geochemistry 58
Figure 30: REE diagrams for the Talamanca rocks. Inclination and shape of the patterntogether with absolute REE concentrations are characteristics that help to separate the fiverock groups. The shaded bar in the background displays the REE pattern of recent volcanicsin northern and central Costa Rica.

Geochemistry 59
4.2.2 Characterisation of Adakites
Melt generation at subduction zones generally takes place within the mantle wedge above thedehydrating slab [Gill, 1981]. However, under certain circumstances some magmas atconvergence zones can be generated by direct melting of the subducting oceanic crust [Defant& Drummond, 1990b]. Prerequisites for the formation of slab melts are ‘hot’ slab geotherms[Peacock, 1990; Rapp & Watson, 1995] like this is achieved by subduction of very youngcrust [Defant & Drummond], at subduction zones with low convergence velocities, high heatflow or high shear stress [Peacock et al., 1994]. Melting of the hydrated, subducting oceaniccrust takes place during the breakdown of amphibole in the stability field of garnet. Theresulting partial melts erupt as high Al2O3 andesites to dacites and are termed adakites [Defant& Drummond, 1990b].Geochemically, adakites are characterised by high Sr, Low Y and HREE, consistent with anorigin by partial melting of eclogite or garnet amphibolite [Defant & Drummond, 1990a,b].
A clear distinction of adakites from normal arc magmatic rocks can be made by their REEpattern with depletion in HREE (Figure 30) and by using a Sr/Y versus Y diagram (Fig. 31).In that diagram, adakites plot at high Sr/Y ratios and low Y contents due to their Y depletionand concomitant Sr enrichment. This geochemical signature is a consequence of their sourcefeatures with garnet stability and plagioclase instability. Plotted in the diagram below areexclusively andesites, dacites, and the corresponding intrusive equivalents. Additionallyrepresented are fields from adakites of localities in southern Chile [Kilian & Stern, 1994] andthe type locality of Adak Island [Kay, 1978]. Mantle-wedge derived island-arc andesites anddacites plot within a field at low Sr/Y ratios and high Y concentrations.
Figure 31: Sr/Y versus Y diagram for the distinction of adakitic andesites and dacites fromnormal andesites and dacites after Defant & Drummond [1993] and Stern and Kilian [1996].

Geochemistry 60
4.2.3 Source Characteristics
Primitive-mantle-normalised [Sun & McDonough, 1989] multi-element diagrams (Fig. 32)show typical island arc signatures for almost all the samples. HFSE (Nb, Ta, Hf, Zr, Ti)depletion is a characteristic for this tectonic environment and most conspicuous with the Nb-Ta trough [Wilson, 1989]. This trough is clearly visible in samples from the Tholeiitic Group,Calc-alkaline Group, Forearc Group and Adakite Group. It is by far less evolved in thesamples of the Backarc Group. Depletion of the entire suite of HFSE is seen throughout therock groups with an exception of Zr that is enriched in samples of the Calc-alkaline Group.
Mobile elements like the LILE (Rb, Ba, K, Sr) are enriched in rocks of all groups but theBackarc Group. Enrichment of these elements is ascribed to fluids from subducted sedimentsor subducted basalts and hence a further characteristic for subduction related magmatic rocks.The pattern of the Backarc Group shows little similarities to magmatic rocks from subductionzones: Depletion of the HFSE is minor and enrichment of fluid-mobile elements incomparison with other elements is absent. Similarities of these rocks with intra-platemagmatic rocks is instead striking. This is demonstrated in the diagram by comparison to thepattern of a HIMU-OIB.
Figure 32: Multielement variationdiagrams for the Talamanca rocks.Normalisation to primitive mantle afterSun & McDonough [1989]. The N-MORB pattern is plotted forcomparison (black line). A HIMU-OIBpattern is additionally shown forcomparison with the backarc samples.

Geochemistry 61
4.2.3.1 Trace element ratios
Trace element ratio plots, presented in the following section, point to source characteristics ofthe five rock groups more easily than the multi-element diagrams.Ratios of fluid mobile elements normalised to immobile elements like Ba/La [McCulloch &Gamble, 1991] or Ba/Th [e.g., Turner et al., 1997] can be a measure of subduction derivedfluid (metasomatic fluid) or sediment subduction into the respective magma sources. Ba ispresent in high concentrations within subducting sediments off Costa Rica (Chapter1.2.3.2.3). Thus, Ba is a very sensitive indicator for the involvement of sediment or fluidsderived therefrom especially in this subduction zone [Leeman et al., 1994].Ratios of immobile elements of differing ionic radii can be a measure of mantle sourcecompositions. A low Nb/Zr ratio for example points to a depleted mantle portion due toprevious melting events [Pearce & Norry, 1979].Figure 33 displays variations of the Nb/Zr ratio versus Ba/Th ratio in the Talamanca rocksamples. Virtually all rock groups but the Backarc Group show large (and variable)contributions of sediments or fluids to their mantle source. An influence of a fluid mobile slabcomponent is absent for the Backarc Group samples. Instead they show less depletion of theirmantle source in respect of the immobile elements.
Figure 33: Trace-element ratio plot of Nb/Zr vs. Ba/Th. The arc magmas show high butvariable Ba/Th ratios indicating the contribution of slab fluids to the source. An exception ismade by samples from the back arc. They vary instead in Nb/Zr ratio, a measure for thedegree of source depletion by former melting events. Melting degrees have a minor influenceon the ratio.
A plot of (Gd/Yb)n versus Nb/Zr shows that the relative source enrichment in the backarcsamples is not correlated with a present garnet signature. The high (Gd/Yb)n of the backarcsamples means higher concentrations of garnet in the mantle source of these rocks ascompared with the other mantle melts and thus a derivation from greater depths. Surprisingly,the forearc volcanic rocks display a garnet signature intermediate between the backarc rocksand the calc-alkaline rocks from the former central arc. The garnet signature is very prominent

Geochemistry 62
for samples of the Adakite group, derived by melting from an eclogite residue. However, theirsignature does not correlate with Nb/Zr ratios.
Figure 34: Plot of (La/Yb)n vs. Nb/Zr indicating different degrees of garnet signature andsource depletion for the rocks of the Talamanca area.
The Th/Yb vs. Ta/Yb discrimination diagram (Fig. 35) after Pearce [1983] can be used topoint out source constraints in subduction zone settings. Variations of both ratiossimultaneously, Th/Yb and Ta/Yb, are related to the enrichment or depletion of the mantlewedge. However, an increase in these ratios can also be recognised during the evolution ofsome subduction zone settings (increasing arc maturity). An increase in the Th/Yb ratio aloneis predominantly related to the addition of a subduction derived sediment component to thearc wedge mantle.The samples from the Talamanca area separate into two groups with respect of Th/Yb andTa/Yb ratio. Precollisional arc magmas display lower ratios than the syncollisional backarcmagmas. This will most probably reflect tapping of a more enriched mantle source for thebackarc magmas. A within plate enrichment can be precluded since these magmas show nosigns of assimilation in the arc crust by other geochemical parameter.
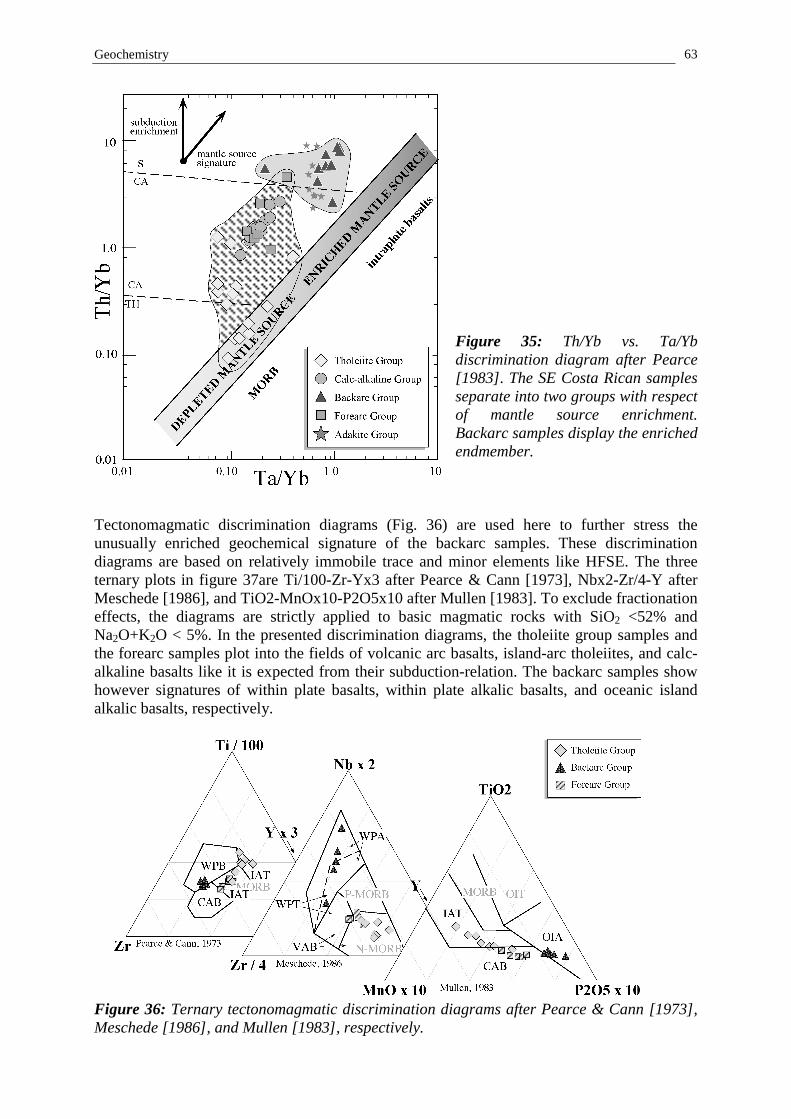
Geochemistry 63
Figure 35: Th/Yb vs. Ta/Ybdiscrimination diagram after Pearce[1983]. The SE Costa Rican samplesseparate into two groups with respectof mantle source enrichment.Backarc samples display the enrichedendmember.
Tectonomagmatic discrimination diagrams (Fig. 36) are used here to further stress theunusually enriched geochemical signature of the backarc samples. These discriminationdiagrams are based on relatively immobile trace and minor elements like HFSE. The threeternary plots in figure 37are Ti/100-Zr-Yx3 after Pearce & Cann [1973], Nbx2-Zr/4-Y afterMeschede [1986], and TiO2-MnOx10-P2O5x10 after Mullen [1983]. To exclude fractionationeffects, the diagrams are strictly applied to basic magmatic rocks with SiO2 <52% andNa2O+K2O < 5%. In the presented discrimination diagrams, the tholeiite group samples andthe forearc samples plot into the fields of volcanic arc basalts, island-arc tholeiites, and calc-alkaline basalts like it is expected from their subduction-relation. The backarc samples showhowever signatures of within plate basalts, within plate alkalic basalts, and oceanic islandalkalic basalts, respectively.
Figure 36: Ternary tectonomagmatic discrimination diagrams after Pearce & Cann [1973],Meschede [1986], and Mullen [1983], respectively.

Geochemistry 64
4.2.4 Across-arc variations
Across arc variations in respect of the above outlined parameters for mantle sourcecomposition (Nb/Zr) and slab fluid involvement (Ba/La) are presented in Figures 37 and 38 topoint to their regional distribution. Some degrees of potential displacements within the olderrock series have to be taken into account.Variations of the fluid (sediment) parameter Ba/La indicates a maximum of this slabcontribution within the central arc (Fig. 37). Striking is the absence of these contributionsonly a few km behind the location of maximal abundance. Backarc magmatism in Costa Ricaoccurred unusually close to the active arc [Milionis et al., 1986] and is nevertheless virtuallyfree from this subduction component.
Figure 37: Plot of Ba/La variations across the arc indicates very different contributions fromslab derived fluids to the magmas.
In a similar plot across the arc, presenting the source parameter Nb/Zr, it is obvious that thebackarc rocks are derived from a considerably less depleted mantle than samples of all theremainder groups (Fig. 38). Since the central magmatic arc was active very close to thebackarc sample location it is surprising that this mantle domain was obviously not affected byformer melting events.

Geochemistry 65
Figure 38: Variations of the Nb/Zr ratio across the arc indicates that the backarc mantle isunusually enriched in immobile trace element concentrations. Note, that the active central arcis as close as about 10 km to the backarc locations though not probed here.
Main results of this chapter are:• Geochemical investigation of the magmatic rocks from the Talamanca area helped to
define five distinct rock groups.• Older rock groups (pre-collisional) are typical arc magmatics showing the trace element
signature of the mantel wedge metasomatised by slab derived fluids. There are found both,arc-tholeiitic and calc-alkaline rocks. The latter are generally highly differentiated.
• Backarc rocks in the area show a geochemical tendency towards within plate magmaticsor OIB with the corresponding HFSE enriched trace-element pattern.
• In modern arcs rarely occurring slab-melting products (adakites) are present in SE CostaRica.

Isotopes 66
5 Isotopes
5.1 Radiogenic Isotopes
5.1.1 Sr- / Nd- isotopic compositions
Isotope data represent a powerful tool to substantiate the findings of considerable sourcecompositional differences between the rock groups of the Talamanca area.In this context, 87Sr/86Sr and 143Nd/144Nd isotope measurements were carried out on 24selected whole rock samples.
The initial isotopic composition of the rocks provides information about the (mantle-) sourcesof the magmatic rocks as well as about processes by which their chemical and isotopiccompositions are modified (e.g. crustal contamination, seawater interaction).When the age of the rock is known, its initial isotopic ratios can be calculated by using thebasic geochronological equations:
[5-1] [5-2]which are transformed to:
[5-3] [5-4]
The overall isotopic variability of the SE Costa Rican magmatic rocks is relatively restrictedwith values ranging between 87Sr/86Sr: 0.70332 – 0.70415 and 143Nd/144Nd: 0.512953 –0.513045. The isotopic data display an unusual trend across the mantle array (Figure 39).Furthermore, the data are not simply trending horizontally across and out of the mantle array,but describe instead a slightly upwards directed trend (a positive correlation). Thus, isotopicvariations cannot be explained by a simple two-component mixing model.The SE Costa Rican data set is consistent with general Central American isotopic variations[Feigenson & Carr, 1986, 1993]: All Central American volcanic samples display isotopicvariations across the mantle array. However, an influence of old continental crust like it canbe seen in Guatemalan volcanics is absent from the investigated area. Incorporation of oldcontinental material in the source of southern Costa Rican rocks does not take place sincesuch a process would result in a negative correlation in Sr-Nd-isotope-space. Exactly thesenegative trends are displayed by the majority of the arcs world-wide (Figure 39). A negativeNd-Sr correlation accounts for the incorporation of varying amounts of terrigenous sedimentin the magma [Faure, 1986].However, in contrast to MORB, the source of SE Costa Rican magmas is isotopically slightlyenriched as evidenced by an offset towards bulk earth composition. This fact demands for anenrichment process that could either be related to an earlier (>200 Ma) stage of melting in thisregion [Feigenson & Carr, 1993] or that could be related to a process of mantle wedgemodification by subducted sediments [Faure, 1986].
)1(86
87
86
87
86
87
−+�
���
�= t
initial
eSrRb
SrSr
SrSr λ )1(144
147
144
143
144
143
−+�
���
�= t
initial
eNdSm
NdNd
NdNd λ
)1(86
87
86
87
86
87
−−=�
���
� t
initial
eSrRb
SrSr
SrSr λ )1(144
147
144
143
144
143
−−=�
���
� t
initial
eNdSm
NdNd
NdNd λ

Isotopes 67
Figure 39 displays the epsilon notations [DePaolo & Wasserburg, 1976] which are calculatedby using the following equations:
[5-1]
[5-2]
Figure 39: Diagram of 143Nd/144Nd vs. 87Sr/86Sr presenting the data set from the Talamancaarea in comparison to data fields from island arcs, continental margins and MORBs ascompiled by Faure [1986]. The trend of the Talamanca data is unusual across the mantlearray.
Figure 40 presents the Nd-Sr isotopic compositions of the SE Costa Rican samples. In thisclose-up view it is evident that the isotopic compositions of the rocks are considerably offsetfrom local MORB and OIB compositions towards higher Sr-isotopic ratios. Offset is largestwithin the Tholeiitic and Calc-alkaline Groups, it is small for samples of the Backarc Group.Adakite Group samples display a simple, almost horizontal trend across the mantle array,varying virtually only in Sr isotopic composition.
4144143
10*1)/( ���
�−= t
CHUR
initialNd I
NdNdε
48687
8687
10*1)/(
)/( ���
�−= t
UR
initialSr SrSr
SrSrε

Isotopes 68
The evolutionary trend of the SE Costa Rican magmatics within this isotope diagram goesfrom higher Nd isotopic values to steadily increasing Sr values and thereafter sharply bendingtowards low Sr- and low Nd-isotopic compositions.Additionally presented are fields from local magmatic systems like the East Pacific Rise(EPR), Galapagos Spreading Centre (GSC), and Galapagos Islands (GI) as well as ridges andseamounts on the Cocos Plate which were produced by the Galapagos hot spot. AdakiteGroup samples clearly reach into the field of ridges which also includes the subducted CocosRidge.
The offset of the arc magmatic samples to higher 87Sr/86Sr isotopic values is related to slabderived contributions to their magma source like subducted seawater and marine sediments. Asecond variation vector in this diagram describes the compositional variations between adepleted MORB source, represented by the EPR and GSC, and an enriched mantle part,displayed by the GI and seamounts. These different mantle compositions are also reflected inthe SE Costa Rican samples. Their generation will be discussed in Chapter 6.
Figure 40: Samples from the Talamanca area in a diagram of 143Nd/144Nd vs. 87Sr/86Sr. Thetrend across the mantle array evolves with time back to the array (indicated by broad arrow).Abbreviations for literature data of Central American volcanics mean: F. & C.’86: Feigenson& Carr [1986], Def.’91: Defant et al. [1991], Dr.’95: Drummond et al. [1995]. The Fields ofEPR, GSC, and GI are from White et al. [1990], the fields of Ridges and Seamounts are fromv. d. Bogaard & Werner [1998].

Isotopes 69
5.1.2 Pb- isotopic compositions
Lead isotopic compositions were determined on carefully selected whole rock samples.The valuesFigure 41 displays the compositional variability of the south Costa Rican samples incomparison with local magmatic systems (EPR, GSC, GI) and pelagic pacific sediments.
SE Costa Rican samples show a clear grouping into two suites that are distinct in their206Pb/204Pb ratios (Fig. 41). The low-206Pb/204Pb group consists of the Tholeiitic Group, Calc-alkaline Group, and Forearc Group. The high-206Pb/204Pb assemblage comprises the BackarcGroup and Adakite Group. Low-206Pb/204Pb members plot near or within the fields of localdepleted mantle sources (EPR, GSC) and in the field of magmas from active volcanoes inGuatemala [Carr et al., 1996]. High-206Pb/204Pb samples plot within the field of the GalapagosIslands, which also characterises the present day volcanism in northern Costa Rica [Carr, pers.comm.].
This grouping clearly reflects the presence of two different mantle sources underneath SECosta Rica. The mantle source of pre-collisional magmatics is more depleted and uniformwith the northern end of the Central American arc system. The other source, showing HIMUtendencies (high 206Pb/204Pb) is clearly influenced by the Galapagos hot spot. Since theadakites seem to be partial melting products of the Cocos Ridge, it is not surprising that theyadopted the Galapagos isotope signature.Variations of the magmatic rock compositions in 207Pb/204Pb and 208Pb/204Pb towards thesediment field are low, which means only small amounts of sediment derived lead admixed totheir sources.

Isotopes 70
Figure 41: Lead isotope diagrams show the Talamanca data in comparison with locallyactive magmatic centres (EPR, GSC, GI [White et al., 1993]) and pelagic pacific sediments[Ben Othmann ]. Two data points for end-member compositions of sediments drilled offGuatemala are from GERM [1997]. The carbonaceous sediment plots outside the sedimentdata field. Shaded fields are active Guatemalan volcanoes [Carr et al., 1996], and activeCosta Rican volcanoes [Carr, pers. comm.].

Isotopes 71
5.2 Stable Isotopes
Oxygen isotopic compositions are determined on phenocrysts (Ol, Cpx, Hbl, Qz) from thevolcanic rocks. This technique bears the advantage that secondary alteration effects arevirtually excluded. All data are fractionation corrected to olivine compositions.
Calculation of the δ18O values in per mil relative to the standard V-SMOW is done accordingto the equation:
[5-3]
δ18O values of the samples vary between 5.1 and 6.9 %o. Variations of the oxygen isotopiccomposition with strontium isotopic compositions are displayed in Figure 42. The majority ofsamples lie above the 5.2 %o value of upper mantle olivine [Eiler et al., 1997]. This is acommon feature for arc volcanics that are easily subdued to source contamination and/orcrustal contamination with a high δ18O component [Taylor, 1986].
Figure 42: Generalised fields depicting the co-variation of oxygen(Ol) and strontium isotopecompositions of the SE Costa Rican samples and oceanic basic lavas. The field for alteredMORB is from Taylor [1986].
The adakites plot right into the field of altered MORB. From Figure 43 it is obvious that theymust be derived from the upper, low temperature altered oceanic crust.Phenocrysts of the backarc volcanic rocks fall below the 5.2 %o value of upper mantle olivinebut within the field of the Galapagos mantle source. Values below 5.2 %o are indicative for aHIMU OIB source [Eiler et al., 1997]. High temperature altered oceanic crust is a furtherpotential source for low δ18O values (see Figure 43). However these backarc samples are
3
standard1618
sample1618
18 10*1)O/O()O/O(
O�
���
�−=δ

Isotopes 72
compositionally almost identical to primary mantle melts with high MgO, Ni, and Cr whichprecludes considerable contamination processes.
Figure 43: Profiles of lithologic unitsand oxygen isotope variations in ODPdrilling Hole 504B near the GalapagosSpreading Centre (GSC) from Alt et al.[1986].
Main results of this chapter:• Older rock groups (arc-tholeiitic and calc-alkaline) show Nd- and Pb-isotopic signatures
of a relatively more depleted mantle source. Their O- and Sr-isotopic signature points tomodification of their source by slab derived fluids and crustal assimilation.
• Backarc rocks in the area show isotopic ratios that are closer to the HIMU endmembercomposition of the Galapagos plume and show no direct fluid or sediment involvement intheir mantle source.
• Adakites show isotopic variations which may reflect different portions of the meltedoceanic crust that was variably altered at low temperatures.

Geochemical Modelling 73
6 Geochemical Modelling
It is now generally accepted that most magmas at subduction zones are generated in themantle wedge above the subducting plate [Gill, 1981; Green, 1982; Wyllie, 1982; Arculus &Powell, 1986].This mantle wedge is significantly modified by the addition of fluids and melts derived fromthe subducting oceanic crust and its sediment cover [White & Patchett, 1984; Tera et al.,1986; Ellam & Hawkesworth, 1988; von Huene & Scholl, 1993; Miller et al., 1994; Ishikawa& Nakamura 1994].The transfer of elements from the subducting plate to the sub-arc mantle takes place viadehydration of the subducting basaltic crust and related sediments or by melting of thesediment cover [Nichols et al., 1994; Elliot et al., 1997; Hawkesworth et al., 1997].Melting of the basaltic crust itself occurs relatively seldom at modern arcs and is confined tolocations with unusually ‘hot’ slab geotherms and young subducting crust [Peacock, 1990;Defant & Drummond, 1990a,b; Peacock et al., 1994; Yodgodzinski et al., 1995; Stern &Kilian, 1996].Further modification of the arc magmas can be expected during their ascent through themantle wedge and overlying crust [DePaolo, 1981; Hildreth & Moorbath, 1988; Kelemen etal., 1990, 1993; Navon & Stolper, 1987; Aitcheson & Forrest, 1994].
In the preceding chapters I have documented that these processes are reflected in thegeochemistry and isotopic composition of the Talamanca rocks. Aim of the present chapter isto use geochemical modelling as a means of hypothesis testing in order to verify the aboveconstrained models.
As a prerequisite to modelling, the samples have to be recalculated to their primary,fractionation free status. 8 wt% MgO were taken to represent the primitive compositions asproposed by Klein and Langmuir [1987]. The backarc samples were recalculated to 10 wt%MgO since they are very primitive rocks and some of them already contain that amount ofMgO. For the correction procedure, a correlation of each element versus MgO was plotted foreach sample suite. Regressions through co-genetic series gave the recalculated concentrationof each element (e.g. La8) at 8wt% MgO.Co-genetic series are in some instances well defined like for the backarc group: a rock suitefrom Bribri (BRI) and a rock suite from Guayacan (GUA). However, for other suites no cleartrends exist. For the forearc group only a few samples define a poor correlation, for thetholeiitic group only those samples displaying definitive tholeiitic chemistry were selected,and for the calc-alkaline group, the entire sample set was taken as co-genetic.With respect to the calc-alkaline group, this method is only a crude approach because allrocks from this group contain less than 4 wt% MgO. Klein & Langmuir [1987] originallyapplied this calculation to rock compositions between 8.5 and 5 wt% MgO.Rocks with strong fractionations, deviating from the general trend (e.g. Eu fractionations intwo samples of the calc-alkaline group) were excluded.

Geochemical Modelling 74
6.1 Partial melting
Mantle source compositions of the different Talamanca rocks were calculated by a forwardbatch partial melting process using REE concentrations of the assumed source types. SourceREE pattern were adjusted to fit the fractionation corrected pattern of each rock group byvarying source composition, source mineralogy, and melting degree.
The basic equation for modal batch melting is [after Shaw, 1970]:
[6-1]
Where Ci0 is the initial source concentration of element i, is the bulk partition
coefficient of the residual solid, and F is the melt fraction.
The REE concentrations for depleted mantle (DM) and primitive mantle (PM) as well as thosefor the sediments are taken from GERM [1998].
Modelling calculations reveal that not only melting degrees are different for the four mantlederived rock groups, but also mineralogy and composition.Mantle source compositions of the four groups vary between strongly depleted and stronglyenriched in LREE. Tholeiite group samples have a slightly depleted source, as have some ofthe forearc rocks suggesting the absence of a sedimentary contribution. The second suite offorearc rocks is instead derived from an enriched mantle, or alternatively, from a sourcecontaminated by considerable amounts of sediment. The source of the calc-alkaline rocks canbe modelled by a mantle that contains up to 1-2 % of marine sediment. The amount ofsediment contribution depends on the primary degree of mantle depletion. The source of thealkalic backarc rocks is highly enriched in LREE by intra-mantle enrichment since sedimentassimilation could be ruled out in the preceding chapter.
Figure 44: Batch melting models calculated to the REE pattern of the rocks point to differentsource mineralogy, geochemistry and melting degrees necessary to fit the curves.Fig. 44a: Model for the tholeiitic group
)1(0
iRS
iRS
ii
DFDCC
−+=
iRSD

Geochemical Modelling 75
Figure 44b: Batch melting modelfor the forearc group, suite PEJ.
Figure 44c: Batch melting modelfor the forearc group, suite PAS.
Figure 44d: Batch melting modelfor the calc-alkaline group.
Figure 44e: Batch melting modelfor the backarc group.
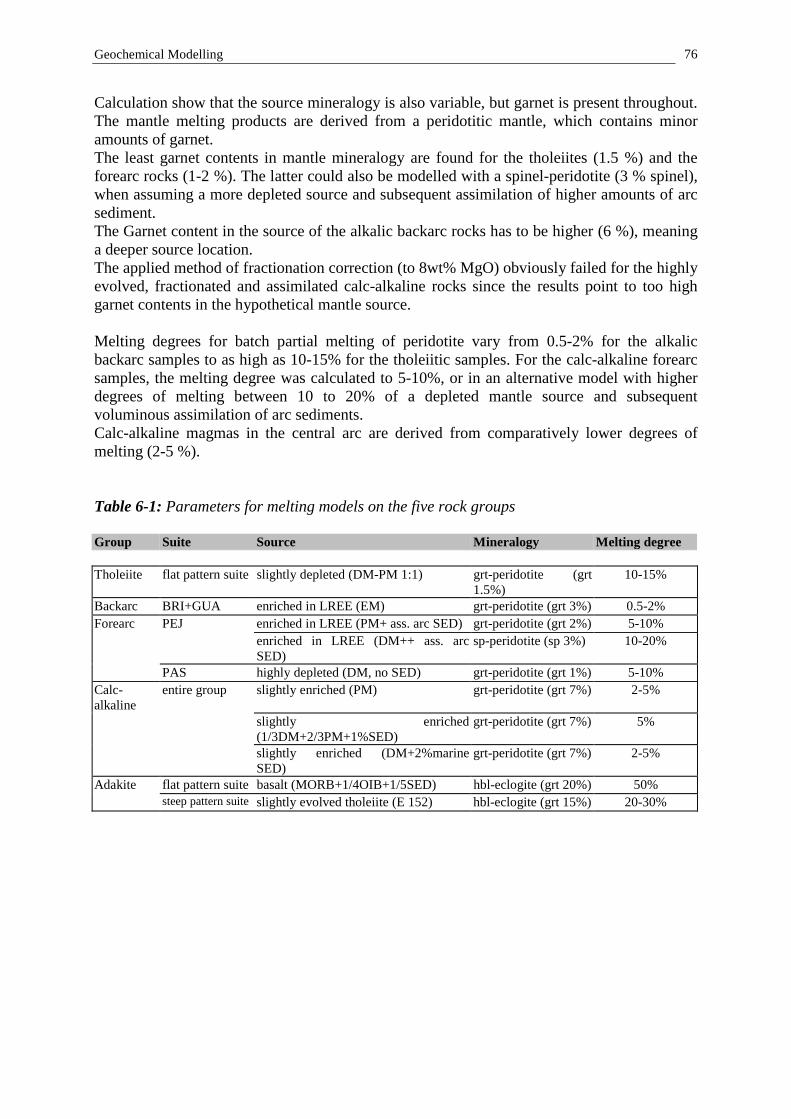
Geochemical Modelling 76
Calculation show that the source mineralogy is also variable, but garnet is present throughout.The mantle melting products are derived from a peridotitic mantle, which contains minoramounts of garnet.The least garnet contents in mantle mineralogy are found for the tholeiites (1.5 %) and theforearc rocks (1-2 %). The latter could also be modelled with a spinel-peridotite (3 % spinel),when assuming a more depleted source and subsequent assimilation of higher amounts of arcsediment.The Garnet content in the source of the alkalic backarc rocks has to be higher (6 %), meaninga deeper source location.The applied method of fractionation correction (to 8wt% MgO) obviously failed for the highlyevolved, fractionated and assimilated calc-alkaline rocks since the results point to too highgarnet contents in the hypothetical mantle source.
Melting degrees for batch partial melting of peridotite vary from 0.5-2% for the alkalicbackarc samples to as high as 10-15% for the tholeiitic samples. For the calc-alkaline forearcsamples, the melting degree was calculated to 5-10%, or in an alternative model with higherdegrees of melting between 10 to 20% of a depleted mantle source and subsequentvoluminous assimilation of arc sediments.Calc-alkaline magmas in the central arc are derived from comparatively lower degrees ofmelting (2-5 %).
Table 6-1: Parameters for melting models on the five rock groups
Group Suite Source Mineralogy Melting degree
Tholeiite flat pattern suite slightly depleted (DM-PM 1:1) grt-peridotite (grt1.5%)
10-15%
Backarc BRI+GUA enriched in LREE (EM) grt-peridotite (grt 3%) 0.5-2%Forearc PEJ enriched in LREE (PM+ ass. arc SED) grt-peridotite (grt 2%) 5-10%
enriched in LREE (DM++ ass. arcSED)
sp-peridotite (sp 3%) 10-20%
PAS highly depleted (DM, no SED) grt-peridotite (grt 1%) 5-10%Calc-alkaline
entire group slightly enriched (PM) grt-peridotite (grt 7%) 2-5%
slightly enriched(1/3DM+2/3PM+1%SED)
grt-peridotite (grt 7%) 5%
slightly enriched (DM+2%marineSED)
grt-peridotite (grt 7%) 2-5%
Adakite flat pattern suite basalt (MORB+1/4OIB+1/5SED) hbl-eclogite (grt 20%) 50%steep pattern suite slightly evolved tholeiite (E 152) hbl-eclogite (grt 15%) 20-30%

Geochemical Modelling 77
)1()1(
fXfXfXRfXRR
BA
BXBA
XAX
M −+−+=
6.2 Mantle source – constraints from isotopes
The 87Sr/86Sr ratios of magmatic rocks in island arcs are primarily determined by the isotopiccharacteristic of the mantle wedge [Faure, 1986]. However, it is further modified by thesubducted hydrothermally altered oceanic crust, the terrigeneous sediment of the oceaniccrust, the country rocks in the overriding crust, and seawater that could interact with the hotvolcanic rocks during their submarine eruption.
These effects can be quantified for the Talamanca rocks by modeling their isotopiccompositions. Calculations in the Sr-Nd-isotope system point to different primary mantlesource compositions and different degrees of sediment involvement (Fig. 45). Mantle sourcecompositions vary along an array between a more depleted end-member (DM) on the onehand and a more enriched one (EM) on the other hand (Fig. 45, negative trend on the left).The depleted end-member displays isotopic compositions that are currently probed by theEPR or GSC. Older rocks in the Talamanca area, i.e. samples from the tholeiitic group andfrom the calc-alkaline group, own characteristics that derive from such mantle compositions.The enriched end-member is represented by the Galapagos plume material. Galapagos plumederived rocks themselves display intermingling of enriched and depleted source components.The enriched end-member source composition is present in the Talamanca rocks within thesamples of the backarc group. Except for one sample (NEI 18), the enriched source of thesebackarc rocks seems to document some degree of intermingling with the local arc wedgemantle (Fig. 45, positive trend in the centre).Incorporation of sediment (or sediment derived fluids) in the magma supplied by thesubducting oceanic plate shifted the mantle wedge composition to higher Sr isotopic ratios,away from the mantle array (Fig. 45, horizontal trend). The resulting, sediment enriched sub-arc mantle may be called a modified mantle (MM). The effect is clearly displayed in samplesof both older rock groups, the tholeiitic and the calc-alkaline group. The more pronounceddisplacement of the relatively younger calc-alkaline samples points out that the sourceenrichment process is time related.
The adakite samples show a remarkably linear arrangement in the diagram with almostexclusively variations in the Sr-isotopic composition. The non-radiogenic end of this trendplots into the field of Galapagos basalts, the radiogenic end reaches out of that field. Thislinear arrangement of the adakite samples can be interpreted as a mixing array betweendiffering relative proportions of low temperature seawater altered and unaltered basalt fromthe oceanic crust pile that was melted to form the adakites (Fig. 45, short horizontal trend).The higher the degree of melting of the oceanic slab, the more will the adakite isotopiccomposition be governed by the composition of the (unaltered) basaltic source rock. Thelower the degree of melting, the higher will be the relative proportion of altered material (andmarine sediments) in the composition of the newly formed adakite.
Binary mixtures of the two elements Sr and Nd with different isotope ratios are calculatedwith the equation (Faure, 1986):
[6-2]
Where A and B are the two mixing endmembers, X is the element of interest, RX is the isotoperatio of X and f is the weight fraction of A. RX
M is the isotope ratio of the mixture.
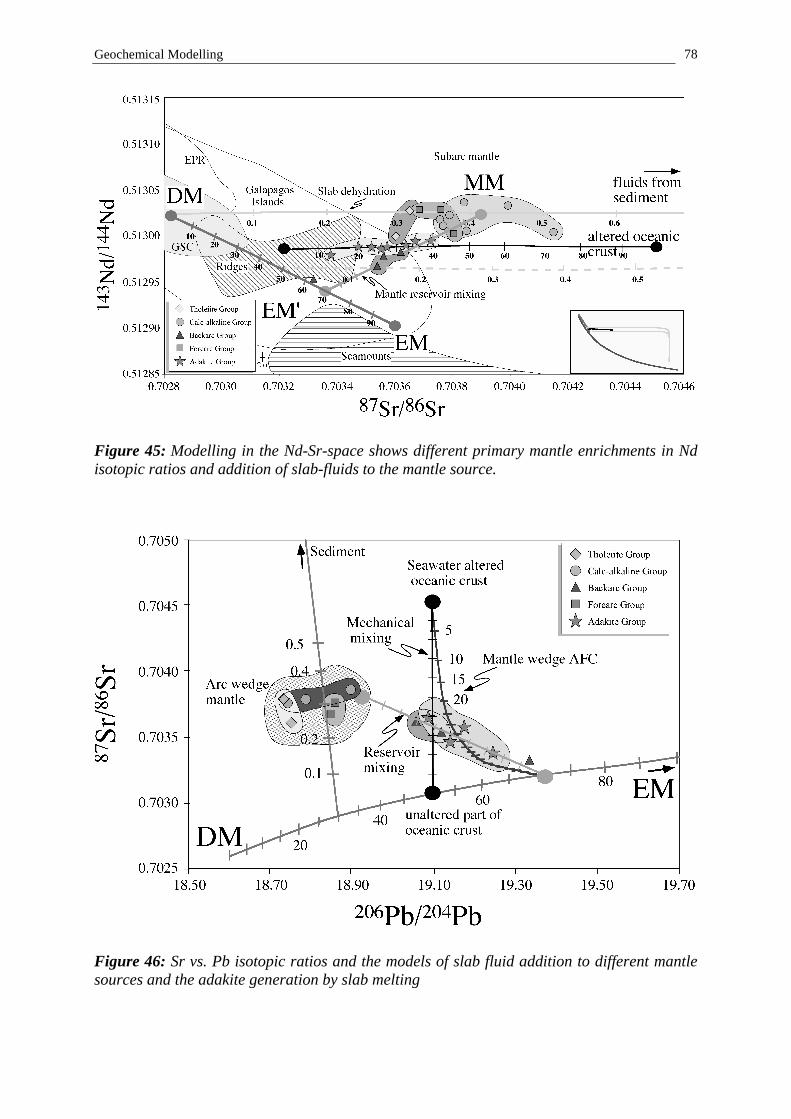
Geochemical Modelling 78
Figure 45: Modelling in the Nd-Sr-space shows different primary mantle enrichments in Ndisotopic ratios and addition of slab-fluids to the mantle source.
Figure 46: Sr vs. Pb isotopic ratios and the models of slab fluid addition to different mantlesources and the adakite generation by slab melting

Geochemical Modelling 79
In the δ18O vs. Sr isotopic space (Fig. 47), forearc and arc-tholeiitic samples display evidencefor source contamination as well as crustal contamination. Free from these effects areobviously the backarc samples. They may be derived from unmetasomatised plume mantlematerial. The adakitic samples show about 15 to 25 % of highly altered basalts in theirparental source rocks.
Figure 47: δ18O variations with 87Sr/86Sr and models of source contamination, crustalassimilation for the tholeiites and forearc rocks. Melting of altered basalt is favoured for theadakites, backarc rocks show no variations with these components.

Geochemical Modelling 80
6.3 Mantle source – constraints from trace elements
A plot of (La/Yb)n versus Ba/La can be used to outline the compositional variability ofmagmatic rocks in the Talamanca area and to obtain melting and source constraints (Fig. 48).In addition to the samples of the five rocks groups, fractionation corrected averagecompositions of each rock group are displayed by the dark coloured symbols. Large circlesmark mantle source compositions and contaminating marine sediments after GERM [1998].The spread of the data in respect of the Ba/La ratio that is observed for samples of thetholeiitic group, calc-alkaline group, and forearc group can be explained by an admixture of asmall amount of sediment (up to 1%) to the mantle source of those magmatic rocks (Fig. 48,lower curve).Subsequent melting of this modified source is responsible for the variations in (La/Yb)n ofthis data array (Fig. 48, curve in the centre). The higher the melting degrees are, the lower isthe (La/Yb)n ratio. This fact is displayed by the relative differences in the ratio of samplesfrom the tholeiitic group and samples from the calc-alkaline group. In chapter 6.1 it wasshown, that the tholeiites are essentially products of higher degrees of melting than the calc-alkaline rocks.Modelling of the backarc rocks which are characterised by high (La/Yb)n ratios and lowBa/La ratios show that these rocks can only be derived from an enriched source that isessentially free of sedimentary contribution (Fig. 48, curve on the left). Otherwise, themodelled curve would not pass through the backarc data and would instead bend with a flatangle to higher Ba/La ratios. It is also obvious, that melting degrees have to be low (0.5 to2%), to obtain the prominent (La/Yb)n ratio of the backarc samples. By plotting the correctedconcentrations it can be shown that fractionation affects the (La/Yb)n ratio only to minordegrees, and could not obscure the effect of low degree melting of an enriched source.
Figure 48: (La/Yb)n vs Ba/La with the outlined melting models, showing different meltingdegrees, source enrichment and sediment content.
Adakites could successfully be modelled in respect of these trace element variations by partialmelting of a basaltic rock with some additional percentages of marine sediment (Fig. 48,negative curve). Derived melting degrees point to 25% and 55%, respectively for thefractionation corrected average compositions. These suggested high degrees could however

Geochemical Modelling 81
also be displayed due to the offset of the data points as a consequence of mantle AFCprocesses (Fig. 48, curve F). Mantle AFC processes lower the (La/Yb)n ratio, and dependingon the type of assimilated mantle material (DM/EM or MM including the sedimentcontribution), a slight shift of the data may occur towards higher or lower Ba/La ratios.
Figure 49: (La/Yb)n vs Ba/La shows melting degrees for the adakites, which are howeversimultaneously covered by the effect of mantle wedge assimilation.
Table 6-2: Modelling parameters for mixing models. Data are from GERM [1998]
DM EM SED SEDDiat Mud Carb
Sr 13.2 17.9 336 1504Ba 1.2 4.77 3941 2145La 0.31 0.66 20.66 14.22Nd 0.86 1.11 19.00 10.13Yb 0.4 0.3 2.68 1.5787Sr/86Sr 0.70261 0.70338 0.70763 0.70858143Nd/144Nd 0.513115 0.512931 0.51274 0.51242206Pb/204Pb 18.54 19.65 18.783 18.314207Pb/204Pb 15.51 15.64 15.631 15.463208Pb/204Pb 38.06 39.43 38.673 37.940

Geochemical Modelling 82
6.4 Adakites- Eclogite partial melting and mantle wedge assimilation
Since adakites are partial melts of subducted oceanic crust, batch melting calculations startedwith a basaltic parental material in the garnet stability field.Modelling calculations were done on the REE (Fig. 50), like before for the mantle meltproducts, and additionally for Sr and Y (Fig. 51). Fitting of the model to the REE curve of theadakites showed that the basaltic parent was melted to 20 to 30 %. Results for the Sr/Y ratiopointed to 10 to 30%.Calculations showed that the present adakites have a basaltic parental rock derived from aMORB or OIB source. Up to 20% marine sediment can be compound of the molten rockcolumn. Taking Galapagos Island rock compositions [White et al., 1993] for the modellingprocess exactly matches the REE curve of the partial melting product.
Figure 50: Sr/Y vs Y is a discrimination plot for adakites. The melting curve for an eclogitepoints to 10 to 20% in the degree of melting for the generation of these adakites.
Figure 51: The batch melting modelon the REE results in 20 to 30%melting of garnet amphibolite oreclogite.

Geochemical Modelling 83
Some of the adakites have suffered considerable interaction with the mantle material duringtheir ascent through the mantle wedge. This fact is documented by their high MgO contents ofup to 6 wt% and Mg# up to about 70 (Fig. 52). It is also conspicuous in form of mixing trendsdisplayed by samples of the adakite group in various element correlation diagrams presentedabove (Figs. 28, 29).
Modelling calculations of AFC processes point to as high as 20% assimilation of mantlematerial for some adakite samples (Fig. 52). In this diagram of Mg# versus SiO2, mantlemelts and their differentiates delineate a hyperbolic, decreasing trend from high Mg#/lowSiO2 to low Mg#/high SiO2. This trend of chemical evolution is related to fractionation of themineral assemblage as outlined in Chapter 4, and assimilation of crustal rocks. Samples of thecalc-alkline group obviously follow this trend.The almost perpendicular trend formed by the adakites is primarily related to assimilation ofmantle material. This assimilation process affects more the Mg# than the SiO2 content of theslab melting products. Mixing of adakitic melts and mantle melts lowers insteadsimultaneously the SiO2 content. Fractionation of plagioclase and amphibole shifts theadakite composition into the opposite direction.The mantle-AFC process severely affects the chemical composition of these rocks. Contentsof compatible elements like Ni, Cr, and Co and Mg increase in the rock, whereas for examplethe REE contents are less affected. At least, the adakite characteristics of HREE depletion inrespect to “normal” mantle melting products is still preserved.
Figure 52: Plot of Mg# vs. SiO2 shows the assimilation trend of the adakitic melts in themantle wedge.
Discussion 84
7 Discussion
The above described diversity of magma-types in south-east Costa Rica cannot be derivedfrom a single, homogeneous magma source. Thus, a more complex arc evolution has to beexpected in southern Central America with variations in major subduction parameterscompared with northern Central America. Since the magmatic changes coincideapproximately with the event of ridge-arc collision, a causal relationship is very likely.
A geodynamic model for the evolution of the subduction zone in south-east Costa Rica has toaccount for:1. extinction of calc-alkaline volcanism in the main magmatic arc2. occurrence of localised backarc magmatic activity3. tapping of a mineralogically and geochemically distinct mantle source region (for
backarc magmatism)4. generation of slab melts
7.1 Geodynamic models
Potential models for the geochemical characteristics of Costa Rican magmas:
7.1.1 Locally enriched mantleSome published models invoke an early generated more enriched mantle compositionunderneath Costa Rica in comparison with northern Central America. The mantle wedge isthought to be locally heterogeneous like a plum pudding [Herrstrom et al., 1995] or containsveins of frozen melt from a preceding melting event [Feigenson & Carr, 1993]. Theenrichment could be derived from the Galapagos hot spot tracing its way from the formerCaribbean position to its present Pacific position [Carr, pers. comm.]. An alternative to this isthe enrichment of the mantle wedge by a flow of asthenosphere originating in South America[Herrstrom et al., 1995]. These enrichment models account for the geochemistry of recentnorthern Costa Rican lavas but cannot account for the trace-element pattern and isotopicvalues of pre-collisional magmas in south-eastern Costa Rica. Pre-collisional magmas werederived from a mantle source similar to that of the currently active northern Central Americanarc. Furthermore, the enormous transport path (~4000 km) makes the proposed asthenospheremigration model doubtful.
7.1.2 Slab angle variationsA slab roll back could induce changes in the mantle wedge counter flow and create anextensional regime resulting in decompressional melting of the deeper mantle to produce thebackarc magmas. In this model the roll back would be a consequence of ridge-arc collisionand temporarily reduced convergence rates. However, slab angle variations are rather slowand wide-ranging processes as long as the subducting slab is a coherent plate. A slowlyadjusting, coherent plate could be expected for the Cocos Plate since it is stretching as fardown into the mantle as to the core mantle boundary [van der Hilst et al., 1997].Shallowing of the subduction angle with Cocos Ridge subduction would equally take a longtime and would be evolved to only limited degrees in case that the respective slab segment isnot fault bounded.Variations in the slab angle normally result in shifts of the volcanic chain simultaneously withshifts of the slab dehydration zone. Carr [1984] documented the relationship betweensubduction angle and the location of the volcanic chain for Central America. Such continuousshifts in the location of the volcanic arc are not observed in south-eastern Costa Rica.

Discussion 85
7.1.3 Slab windowMy preferred model implies a slab break-off or the formation of a slab window, respectively.In this case, areas along the convergent margin evolve that are not underlain by subductedoceanic lithosphere. Such windows into the asthenosphere were first described by Dickinson& Snyder [1979] and are found at various convergent margins [ Thorkelson, 1996].This model is able to explain the cessation of normal arc volcanism, the time related signal ofthe enriched mantle source and provides favourable conditions for the generation of adakites.
The geodynamic evolution within the south-eastern Costa Rican arc segment can beenvisaged as follows (Fig. 53):
1. Pre-collisional stageFluids are released during prograde metamorphism of the subducting oceanic lithosphere andenter the overlying mantle wedge. Consequently, melt generation takes place upon the fluidinduced solidus lowering.Magmas within the young convergence zone are arc tholeiitic. With time and increasingcrustal thickness, the melting column reduces which leads to reduced melting degrees [Plank& Langmuir, 1988]. These magmas assimilate increasingly more crust during their ascentthrough the thickened crust, fractionate extensively during storage in magma chambers anderupt or intrude as calc-alkaline magmas.
2. Collision stageA slab window (i.e. a slab free space) forms, either upon Cocos Ridge collision and slabbreak-off or by subduction of a spreading ridge (see below).Above the slab window, arc volcanism ceases as a response to decreasing hydration of theupper mantle. With decreasing fluid saturation the solidus temperatures rise and meltingwithin the mantle wedge stops.An upflow of asthenospheric material occurs through the slab window underneath theCordillera de Talamanca. It is either driven by the mantle material deficit due to the uplift ofthe Cordillera or more probably, resulting from the considerably hotter and less dense sub-slab mantle, itself increasing the Cordillera uplift. Asthenospheric upwelling through a slabwindow may generally also take place simply as a response to the incipient void left byextending or separating of the subducting slab [Hole et al., 1991]. In case that the adiabaticascent was great enough, melting of the mantle material would occur [cf. Ormerod et al.,1988].Low degree mantle melts generated by decompression melting of the upwelling sub-slabasthenosphere extrude in the backarc area where the overriding plate is sufficiently thinned orfractured in the extensional regime.These melts display an OIB signature derived from the sub-slab mantle reservoir. The sub-slab asthenosphere between the Galapagos Islands and the Central American convergencezone may be interspersed by Galapagos plume material like a marble cake. The omnipresenceof the Galapagos plume influence in this area is substantiated for example by recent volcanicactivity on the Cocos Islands. Transport of the plume material through the slab window intothe mantle wedge realm takes place with the general mass flux. Low degree melts areobviously preferentially generated from this plume derived mantle material.A temporal and spatial association of mafic alkaline volcanism with slab window formationwas also found in the Antarctic Peninsula, British Columbia, and northern Baja California[Hole et al., 1991].

Discussion 86
The presence of a slab window may be substantiated by the observed lack of seismicity in thatspecific area: Protti et al. [1995] found that deep earthquakes associated with a subductingslab disappear entirely east of Turrialba volcano. This zone of seismic inactivity below theCordillera de Talamanca could also result from a subducting plate that is either too young toproduce earthquakes or, from one that has broken up [e.g., Reagan et al., 1986].
3. Post-collisional stageBuoyant forces, resulting from lower density of the crustal material, young age and thereforehigher thermal structure (high heat flow), lead to a relatively shallow subduction of the CocosRidge. Since dehydration depths are not achieved, the oceanic crust does not loose its water tothe mantle wedge. Formation of the slab window brings inevitably hot, anhydrous sub-slabasthenosphere in contact with the still hydrated oceanic crust. The consequence is thermalerosion of the window margins which means partial melting of the hydrated oceanic crustresulting in the generation of adakites. At the Costa Rican convergent margin the generationof adakitic melts is only possible as a consequence of slab window formation providing anadditional heat source. Otherwise, the very high convergence rates of about 90 mm/a, wouldhave dragged the isotherms deep into the mantle so that heating of the subducted crust tosupra-solidus temperatures would not have occurred prior to dehydration of the slab. Meltingreactions during amphibole breakdown in the subducting plate depend on the relationship ofthe basalt solidus with the slab geotherm, which itself depends on promoting factors like theconvergence rate [Rapp & Watson, 1995]. Experiments by Peacock et al. [1994] showed thatslab melting is favoured at subduction zones with very low convergence rates.A slab window is a very likely location for the formation of adakites. Adakites (high-Mgandesites and dacites) related to window-margin melting are also described in other places ofslab window formation like Baja California and southern Chile [Kay et al., 1993; Rogers &Saunders, 1989; Stern & Kilian, 1996].
Fore arc volcanism occurs, probably related to local dehydration of the leading edge of thesubducting slab and triggered by additional shear heating. Post-collisional calc-alkaline forearc magmatism in southern Costa Rica may also be related to the influence of the slabwindow. Asthenospheric upwelling from the sub-slab mantle to the mantle wedge may haveinduced melting with the production of mafic magmatism in the fore arc region. Voluminousassimilation or anatexis of the (wet, sediment rich) fore arc wedge could have resulted in theformation of the more intermediate rocks of the Costa Rican fore arc volcanics. The OIBsignal of the intruding mantle material may be hidden due to the larger melting degrees in themarble cake mantle material or as a consequence of insufficient dissemination of that mantlematerial in the arc wedge.Granitoitic rocks found in the fore arc, about 30 km away from the magmatic arc, wereinitially interpreted as tectonically and glacially displaced from their original emplacementlocality in the Cordillera de Talamanca. Now they could well be interpreted as in situgenerated by anatectic melts of the wet fore arc sediments, induced by the slab windowconcomitant magmatism.Intermediate to granitic fore arc magmatism resulting from slab window formation wasdescribed from various places like the Solomon Islands [Johnson et al., 1987], Japan [Hibbard& Karig, 1990], California [Johnson et al., 1987], southern Alaska [Sisson & Pavlis, 1993;Haeussler et al., 1995], and Chile [Forsythe et al., 1986].Cocos Ridge subduction is going on with a very shallow angle upon the fault bounded slabslice. A present cessation of volcanism may either be due to displacement of theasthenospheric mantle wedge or due to a lack of fluids in the mantle wedge provided by thesubducting plate which does not reach depths of dehydration.

Discussion 87
Figure 53: Three stage evolution model in a profile through the subduction zone. A: Intactslab, production of arc-tholeiitic and calc-alkaline magmas. B: Ridge collision and slabdisruption, production of backarc magmatics. C: Shallow subduction of the Cocos Ridge,production of adakites and forearc volcanism.
Discussion 88
The volcanic and geochemical evolution in SE Costa Rica is best explained by the formationof a slab window underneath that arc segment. However, the exact mechanism of formation ofthis window may be a matter of debate.Two modes of slab window formation may be possible for the subducting plate beneath theCordillera de Talamanca:
7.1.3.1 Slab window opening by subduction of an active rift
A slab window develops when a spreading ridge is subducted in a convergence zone. Thewindow forms due to suppression of crustal growth on the spreading plate edges of the activerift segment [Thorkelson, 1996]. Shape and dimensions of slab windows are dependent onrelative plate motions, angle of subduction, and plate geometry prior to and at the time ofridge crest-trench interaction [Hole et al., 1991].Slab window formation as a consequence of rift subduction were described for Northern BajaCalifornia [Dickinson & Snyder, 1979; Thorkelson & Taylor, 1989], Southern Chile [Cande& Leslie, 1986; Forsythe et al., 1986] British Columbia [Thorkelson & Taylor, 1989] and theAntarctic Peninsula [Hole et al., 1991; Hole & Larter, 1993].
For Costa Rica, Johnston and Thorkelson [1997] suggest the possibility of slab windowformation resulting from subduction of a series of segments of the Cocos-Nazca spreadingcentre. In that model, the Panama Fracture Zone (PFZ) is separating the currently subductedridge segments from the Ecuador Rift, a segment of the Cocos-Nazca spreading centre whichis still far from the trench. The slab window opened from SW to NE in accordance withgeneral plate motions. Currently, the window will be below western Panama with the PFZbordering it to the west. Adakitic volcanism in Panama at La Yeguada [Defant et al., 1991,Defant et al., 1992] and El Valle [Defant et al., 1991; Defant et al., 1992] which could resultfrom melting of the plate edges would then have followed adakitic volcanism in Costa Ricaand may give the latest constraints on timing and shape of the slab window formation. Sinceconvergence rates along Panama are very low, the slab window is now relatively stationarycompared to the subducting Cocos Plate. However, the leading edge of the Nazca Plate has tobe that far subducted below the arc that recent volcanism could occur at El Baru in WPanama. The Cocos Ridge is delimited by the PFZ so that on geometric reasons it can beconcluded that only about 100 km of the ridge are currently subducted. This in turn impliesthat in this case the Cocos Ridge collided with the arc since little more than about 1 Ma as itwas proposed by Lonsdale and Klitgord [1978] and Corrigan et al. [1990]. The earlierbeginning exhumation of the Cordillera de Talamanca which is ascribed to collision andshallow subduction would then result from subduction of a precursor of the Cocos Ridge. Themodel proposed by Johnston and Thorkelson [1997] does not account for the formation ofalkaline volcanism in the Costa Rican back arc as a direct result of slab window opening. Theobserved sequential occurrence of these magmas would only be related to NW migration ofsub slab asthenospheric material opposite to the direction of slab window movement. Themodel could also not account correctly for the formation of the Costa Rican adakites whichwould require subduction of the Cocos Ridge for at least 3 Ma.

Discussion 89
Figure 54: Three stage model of slab window generation by subduction of rift segments fromthe active Cocos-Nazca spreading centre (after Johnston and Thorkelson, 1997).

Discussion 90
7.1.3.2 Slab break off induced by aseismic ridge collision
Disruption of the subducting slab may result from collision of an aseismic ridge with aconvergence zone [e.g., McGeary et al., 1985]. This slab break off will lead to the formationof a slab window by subsequent slab roll back. An example of slab window formation uponcollision of an aseismic ridge or plateau is described for the Lesser Antilles [Bouysse &Westercamp, 1990]. The aseismic ridge is acting as a buttress, temporarily resisting tosubduction, while the slab is constantly pulling down into the mantle. Slab pull forces actingon the Cocos Plate seem to be large if they are reflected in the high convergence ratesmeasured along Central America [e.g., DeMets et al., 1990]. On physical reasons, it should bevalid that the longer the slab, the greater the slab pull. A correlation between slab length andconvergence rate was for example found by Isacks et al. [1968]. Subduction as deep as thecore-mantle boundary was attested for Central America by seismic tomography [van der Hilstet al., 1997].As the resistant forces are superseded, the ridge is finally subducting. These fault boundedslices of the oceanic plate are subducting unusually shallow due to buoyancy of the aseismicridge and lack of slab pull forces on the leading plate edge. Therefore, in a vertical projectionto the arc, the slab window becomes rapidly covered by this shallow subducting slice of thedown-going plate. Assuming an (initially) oblique subduction of the ridge or a large anglebetween ridge front and trench, several slab windows could be formed en echelon. In thismodel, the Cocos Ridge is subducting in a sequence of several fault bounded slices from eastto west. The easternmost slices, which represent the leading end of the Cocos Ridge, arealready subducted below Panama. They may be bordered by faults like the Balboa FractureZone and the Coiba Fracture Zone which parallel the PFZ to the east and are believed to berelated to the currently active PFZ [Moore & Sender, 1995]. The PFZ is obviously delimitingthe actually subducting part of the Cocos Ridge to the east. This model of slab-windowformation and propagation following Cocos Ridge collision accounts for the observed north-westward younging of back arc alkalic volcanism marking the margin of the evolving slabwindow.Bathymetric structures and magnetic anomaly pattern of the Panama basin are still enigmatic.Some authors [e.g., de Boer et al., 1995] assume spreading ridges (e.g., Sandra Rift, Fig. 2)south of Panama. If these ridges were once part of the Cocos-Nazca spreading system [e.g.Lonsdale & Klitgord, 1978], they would argue against the slab window model proposed byJohnston & Thorkelson [1997].
Slab rupturing and finally slab window formation upon aseismic ridge collision could befacilitated in southern Central America due to the strong segmentation of the plates bytransform faults like the PFZ. Driving forces for the separation of the Cocos and the NazcaPlates or their segments within the subduction zone are differences in subduction direction,angles, and rates. Therefore, the slab window along the Cocos - Nazca plate boundary ispassively developing by slab pull.

Discussion 91
Figure 55: Three stage model of slab window generation by slab break-off upon Cocos Ridgecollision

Discussion 92
Figure 56: Slab window presence behind the location of Cocos Ridge collision and windowopening in a north-western direction is documented by the eruption sequence in backarcmagmatics. Radiometric ages measured in this study are indicated, (1) is from Tournon[1984].
7.2 Regional effects
The formation of a slab window, whether it formed as a consequence of active rift subductionor Cocos Ridge collision or a combination of both, doubtlessly means anomalous thermal,physical and chemical effects within the respective arc section. This generally results inanomalous magmatism from fore arc to back arc, sometimes fore arc metamorphism, strikeslip faulting, uplift and extension [e.g., Hole et al., 1991]. Magmatic-geochemical effectsinduced by the slab window formation in SE Costa Rica were discussed above. In addition tothis, the slab window has also appreciable effects on the regional arc volcanic evolution ofCentral America up to southern Nicaragua and Panama.
Figure 57 of the Central American volcanic arc demonstrates the distinct geochemicalevolution of south-eastern Costa Rica and points out that probably slab window relatedadakites are also present in Panama. Figure 58 presents the evolution of the Central Americanvolcanic arc with its decreasing activity in the southern end of the Central American arcsystem.

Discussion 93
Figure 57: Geochemical composition of volcanoes in Central America.
Figure 58: Evolution of active volcanism along the Central American arc system. Shown isthe cumulative activity during the respective time interval.

Discussion 94
Opening of a slab window gives potential pathway for an asthenospheric flow between thetwo mantle reservoirs that were formerly effectively isolated.The OIB-like geochemical and isotopic signature of the back arc magmas in SE Costa Ricadirectly points to the sudden accessibility of sub-slab mantle after Cocos Ridge collision andsubsequent slab window formation.Present-day along-arc geochemical variations in Central America suggest a more enrichedmantle source but also minor input of subducted material for Costa Rica than elsewhere in thearc [Carr et al., 1990; Leeman et al., 1994]. Variations from central Costa Rica to centralNicaragua are for example increasing 87Sr/86Sr and decreasing 143Nd/144Nd [Feigenson &Carr, 1986], increasing 10Be/9Be ratios [Leeman et al., 1994], increasing 230Th/232Th[Herrstrom et al., 1995], decreasing 206Pb/204Pb [Carr, pers. comm.], increasing Ba/La anddecreasing La/Yb [Carr et al., 1990].This geochemically and isotopically enriched mantle signature can be explained by anupwelling flow of asthenosphere through the window leading to an irreversible and increasingcontamination of the Central American mantle wedge by the Galapagos plume component.North-westward propagation of this slab-window enhances lateral migration of thiscontaminant over time.The slab window could also have caused the enhanced volcanic productivity observed innorthern Costa Rica as compared with the rest of the Central American arc [Carr, 1984].
The present study shows that the enriched mantle source or plume signal in the CentralAmerican arc source is time dependent and its evolution is recorded by the magmatic rocks ofthe Talamanca area.

Conclusion 95
8 Conclusion
The Cordillera de Talamanca in SE Costa Rica, its related forearc (Fila Costena) and backarcarea (Limon basin) constitute a segment of the Central American arc system which is activesince about the Eocene/Oligocene [de Boer et al., 1995]. However, samples of this study dateonly back to the Miocene when volcanism increased considerably [de Boer et al., 1995]. Earlymagmatic products until mid-Miocene times are generally arc-tholeiitic in this area.Later (mid- to upper Miocene) volcanic and intrusive activity produces calc-alkalinemagmatics. This change correlates with decreased melting degrees, increased subductioncontribution and increased degrees of fractionation and assimilation of the magmas within anincreasingly thickened arc crust. This evolution from arc-tholeiitic to calc-alkalinemagmatism is in accordance with general observations of increasing arc maturity atsubduction zones world-wide [Wilson, 1989] and with findings in northern Costa Rica in theMontes del Aguacate [Tournon & Alvarado, 1997].‘Normal’ arc volcanism ends when a slab window forms underneath this segment of theCentral American arc system. This slab window may be a result of supposed subduction of arift segment of the active Galapagos spreading centre (GSC) preceding the Cocos Ridgearrival at the Central American arc [Johnston & Thorkelson, 1997], or a consequence ofCocos Ridge-arc collision and subsequent slab break-off. The former model is substantiatedby an apparent hiatus between the cessation of ‘normal’ arc volcanism and the assumed timeof Cocos Ridge-arc collision, whereas the latter model is substantiated by the location anddirection of opening of the slab window. A combination of both models with a slab windowinitiated by subduction of an active rift and extension due to ridge-arc collision may be mostlikely.Coincidentally with the Cocos Ridge-arc collision, magmatics erupt and intrude in the CostaRican backarc. An age sequence from SE to NW displayed by these rocks traces the directionof slab window widening. Compositional signatures of those backarc magmatics point to theirderivation from the Galapagos plume infiltrated sub-slab asthenosphere and mark thus thebeginning asthenospheric flow that increasingly contaminates the Central American arcwedge.The generation of adakite magmas in SE Costa Rica is likely related to window marginmelting when the young, hydrated, basaltic Cocos Ridge crust is subducted to depths andcomes in contact with the hotter upwelling sub-slab asthenosphere.Forearc calc-alkaline volcanics are formed where raised temperatures favour melting abovethe leading edge of the advancing, subducting plate. This forearc volcanic activity in the FilaCostena and the volcanic activity in western Panama producing El Baru may indicate thatvolcanic activity will resume in this segment of the Central American arc after displacementof the slab window. However, very shallow subduction of the Cocos Ridge will inhibit meltgeneration in the area for several million years.
Tasks remaining for future investigations in the area of SE Costa Rica and W Panama are:
• Testing the two different slab window models by structural and seismic investigations andby plate-tectonic reconstruction.
• Determination of the direction of slab window opening by determining the extinctionsequence in calc-alkaline volcanism and by more high-precision dating of the window-margin related adakites in Costa Rica and Panama.
• Geochemical investigation of El Baru volcanics to test if this volcano is related toresuming (propagating slab) or fading (slab window) volcanic activity, e.g. bydetermining if the volcanic sequence contains the plume mantle signature from slabwindow opening.

Conclusion 96
• Substantiation of the apparently SE – NW directed exhumation of the Cordillera deTalamanca which would indicate oblique subduction of the Cocos Ridge.
• Final determination of the time of Cocos Ridge collision to test the model of slab windowformation upon ridge collision.
• Search for alkalic backarc magmatics in Panama and dating of these rocks series tosubstantiate the observation of a directed eruption sequence.
• Geochemical investigation and dating of the forearc granitoitic complex in the FilaCosteña for a detailed test of the hypothesis of forearc magmatism induced by slabwindow formation.

References 97
9 References
Adamek S., Tajima F., and Wiens D.-A. (1987) Seismic rupture associated with subduction ofthe Cocos Ridge. Tectonics 6(6), Pages 757-774.
Ahmedali S. T. (1989) X-ray fluorescence analysis in the geological sciences; advances inmethodology. Min. Assoc. Canada, Montreal, Short Course 7, 252 pp.
Aitcheson S. J. a. F., A.H. (1994) Quantification of Crustal Contamination in Open MagmaticSystems. Journal of Petrology 35, Part 2, 461-488.
Alt J. C., Muehlenbachs K., and Honnorez J. (1986) An oxygen isotopic profile through theupper kilometer of the oceanic crust, DSDP Hole 504B. Earth Planet. Sci. Lett. 80, 217-229.
Alvarado G. E., Kussmaul S., Chiesa S., Gillot P. Y., Appel H., Woerner G., and Rundle C.(1992) Resumen cronoestratigrafico de las rocas igneas de Costa Rica basado endataciones radiometricas Translated Title: Chronostratigraphic review of igneous rocksof Costa Rica based on radiometric dates. Journal of South American Earth Sciences6(3), Pages 151-168.
Alvarado G.-E., Denyer P., and Sinton C.-W. (1997) The 89 Ma Tortugal komatiitic suite,Costa Rica; implications for a common geological origin of the Caribbean and easternPacific region from a mantle plume. Geology (Boulder) 25(5), Pages 439-442.
Appel H., Wörner G., Alvarado G., Rundle C., and Kussmaul S. (1994) Age relations inigneous rocks from Costa Rica. In Geology of an Evolving Island Arc. The Isthmus ofSouthern Nicaragua, Costa Rica, and Western Panama, Vol. 7 (ed. H. Seyfried and W.Hellmann), pp. 63-69. Profil.
Arculus R.-J. and Powell R. (1986) Source component mixing in the regions of arc magmageneration. Jgr Journal of Geophysical Research. B. 91(6), Pages 5913-5926.
Asahara Y., Tanaka T., Kamioka H., and Nishimura A. (1995) Asian continental nature of87Sr / 86Sr ratios in north central Pacific sediments. Earth and Planetary ScienceLetters 133, 105-116.
Astorga A. (1987) El Cretácio Superior y el Paleógeno de la vertiente Pacifica de Nicaraguameridional y Costa Rica septenreional: orígen, evolutión y dinámica de las cuencasprofundas relacionadas con el margen convergente de Centroamérica. Thesis deLicenciatura (unpublished), Universidad de Costa Rica.
Azambre B. and Tournon J. (1977) Les intrusions basiques alcalines du Rio Reventazon( Costa Rica ). Société géologique de France 2, 104 - 107.
Ballmann P. (1976) Eine geologische Traverse des Ostteils der Cordillera de Talamanca,Costa Rica (Mittelamerika) Translated Title: A geological traverse of the eastern part ofthe Cordillera de Talamanca, Costa Rica, Central America. Neues Jahrbuch fuerGeologie und Palaeontologie. Monatshefte. 8, 502-512.

References 98
Bellon H. and Tournon J. (1978) Contribution de la géochronométrie K-Ar à l'étude dumagmatisme de Costa Rica, Amérique Centrale / Contribution of K-Ar geochronologyto the study of magmatism in Costa Rica, Central America. Bulletin de la SociétéGéologique de France 20(6), Pages 955-959.
Ben Othman D., White W. M., and Patchett J. (1989) The geochemistry of marine sediments,island arc magma genesis, and crust-mantle recycling. Earth and Planetary ScienceLetters 94, 1-21.
Bentley L. R. (1974) Crustal structure of the Carnegie Ridge, Panama Basin, and CocosRidge. M.S. thesis, University of Hawaii.
Bergoeing G. P., Mora C., and Jimenez R. R. (1978) Evidencias de vulcanismo Plio-Cuaternario en la fila Costena, Terraba, Costa Rica Translated Title: Evidence of Plio-Quaternary volcanism in the coastal chain near Terraba, Costa Rica. Informe SemestralInstituto Geografico Nacional. Julio a Diciembre.
Bergoeing J.-P. (1982) Dataciones radiometricas en algunas muestras de Costa RicaTranslated Title: Radiometric dating of some samples in Costa Rica. Informe SemestralInstituto Geografico Nacional. Enero a junio.
Bogaard v. d. P. and Werner R. (1998) GEOMAR Annual Report 1997.
Bouysse P. and Westercamp D. (1990): Subduction of Atlantic aseismic ridges and lateCenozoic evolution of the Lesser Antilles island arc. Tectonophysics. 175; 4, 349-380.
Bowin C. O. (1976) The Caribbean: Gravity field and plate tectonics. Geological Society ofAmerica Special Paper 169, 79p.
Burbach G.-V., Frohlich C., Pennington W.-D., and Matumoto T. (1984) Seismicity andtectonics of the subducted Cocos Plate. Jgr Journal of Geophysical Research. B. 89(9),Pages 7719-7735.
Calvo C. and Bolz A. (1994) Der älteste kalkalkaline Inselbogen-Vulkanismus in Cota Rica.Marine Pyroklastika der Formation Loma Chumico ( Alb bis Campan ) / The oldestcalcalkaline island island arc volcanism in Costa Rica. Marine tephra deposits from theLoma Chumico Formation ( Albian to Campanian ). In Geology of an Evolving IslnadArc. The Isthmus of Southern Nicaragua, Costa Rica, and Western Panama, Vol. 7 (ed.H. Seyfried and W. Hellmann), pp. 235-264. Profil.
Cande S. C. and Leslie R. B. (1986) Late Cenozoic tectonics of the southern Chile trench.Journal of Geophysical Research 91, 471 - 496.
Carr M.-J. (1984) Symmetrical and segmented variation of physical and geochemicalcharacteristics of the Central American volcanic front. Journal of Volcanology andGeothermal Research 20(3-4), Pages 231-252.
Carr M. J., Feigenson M. D., and Bennett E. A. (1990) Incompatible element and isotopicevidence for tectonic control of source mixing and melt extraction along the CentralAmerican arc. Contributions to Mineralogy and Petrology 105(4), Pages 369-380.

References 99
Carr M. J., Rose W. I., and Mayfield D. G. (1979) Potassium content of lavas and depth to theseismic zone in Central America. Journal of Volcanology and Geothermal Research5(3-4), Pages 387-401.
Carr M. J. and Stoiber R. E. (1990) Volcanism. In The Caribbean Region, Vol. The Geologyof North America, Vol. H (ed. G. Dengo and J. E. Case), pp. 375-391. GeologicalSociety of America.
Case J. E., MacDonald W. D., and Fox P. J. (1990) Caribbean crustal provinces; Seismic andgravity evidence. In The Caribbean Region, Vol. The Geology of North America, Vol.H (ed. G. Dengo and J. E. Case), pp. 15-36. Geological Society of America.
Cassel D. T. and Sen Gupta B. K. S. (1989) Foraminiferal stratigraphy and paleoenvironmentsof the Tertiary Uscari formation, Limon basin, Costa Rica. Journal of ForaminiferalResearch 19, 52-71.
Castillo P., Batiza R., Vanko D., Malavassi E., Barquero J., and Fernandez E. (1988)Anomalously young volcanoes on old hot-spot traces; I, Geology and petrology ofCocos Island; with Suppl. Data 88-18. Geological Society of America Bulletin 100(9),Pages 1400-1414.
Castillo P. R. (1984) Geology and geochemistry of Cocos Island, Costa Rica: Implications forthe evolution of the aseismic Cocos Ridge. Ph.D. thesis, Washington University.
Chen J. H. and Wasserburg G. J. (1985) U, Th and Pb isotopes in hydrothermal fluids fromthe Juan de Fuca Ridge. Eos, Transactions, American Geophysical Union 66(46), Pages929.
Chung W. Y. and Kanamori H. (1978) A mechanical model for plate deformation associatedwith aseismic ridge subduction in the New Hebrides Arc. Tectonophysics 50(1), 29-40.
Collins L.-S., Coates A.-G., Jackson J.-B. C., and Obando J.-A. (1995a) Timing and rates ofemergence of the Limon and Bocas del Torro basins; Caribbean effects of Cocos Ridgesubduction? Special Paper Geological Society of America 295, 263-289.
Collins L.-S., Geary D.-H., and Lohmann K. C. (1995b) A test of the prediction of decreasedCaribbean coastal upwelling caused by emergence of the Isthmus of Panama, usingstable isotopes of neritic foraminifera. Abstracts with Programs - Geological Society ofAmerica 27(6), Pages 156.
Corrigan J., Mann P., and Ingle J.-C. r. (1990) Forearc response to subduction of the CocosRidge, Panama-Costa Rica. Geological Society of America Bulletin 102(5), Pages 628-652.
Cox K. G., Bell J. D., and Pankhurst R. J. (1979) The interpretation of igneous rocks.Chapman & Hall.
Dalrymple G. B. and Duffield W. A. (1988): High precision (super 40) Ar/ (super 39) Ardating of Oligocene rhyolites from the Mogollon-Datil volcanic field using a continuouslaser system. Geophysical Research Letters. 15; 5, 463-466.
de Boer J. Z., Defant M. J., Stewart R. H., Restrepo J. F., Clark L. F., and Ramirez A. H.(1988) Quaternary calc- alkaline volcanism in western Panama. regional variation and

References 100
implication for the plate tectonic framework. Journal of South American Earth Sciences1(3), 275-293.
de Boer J. Z., Drummond M.-S., Bordelon M. J., Defant M.-J., Bellon H., and Maury R.-C.(1995b) Cenozoic magmatic phases of the Costa Rican island arc (Cordillera deTalamanca). Special Paper Geological Society of America 295, 35-55.
de Boer J. Z., Drummond M.-S., Bordelon M. J., Defant M.-J., Bellon H., and Maury R.-C.(1995a) Cenozoic magmatic phases of the Costa Rican island arc (Cordillera deTalamanca). In Geologic and Tectonic Development of the Caribbean Plate Boundaryin the Southern Central America, Vol. Special Paper. Vol. 295 (ed. P. Mann), pp. 35-55.Geological Society of America.
de Boer J.-Z., Defant M.-J., Stewart R.-H., and Bellon H. (1991) Evidence for activesubduction below western Panama. Geology (Boulder) 19(6), Pages 649-652.
Deer, W.A., Howie, R.A. and Zussmann, J. (1966): An introduction to rock forming minerals.Longman, Harlow. 528 p.
Defant M. J. and Drummond M. S. (1990a) Derivation of some modern magmas throughmelting of young subducted lithosphere. Eos, Transactions, American GeophysicalUnion 71(43), Pages 1715.
Defant M.-J. and Drummond M.-S. (1990b) Derivation of some modern arc magmas bymelting of young subducted lithosphere. Nature (London) 347(6294), Pages 662-665.
Defant M. J., Richerson P. M., De Boer J. Z., Stewart R. H., Maury R. C., Bellon H.,Drummond M. S., Feigenson M. D., and Jackson T. E. (1991a) Dacite genesis via bothslab melting and differentiation: petrogenisi of La Yeguada volcanic complex, Panama.Journal of Petrology 32(6), 1101-1142.
Defant M.-J., Clark L.-F., Stewart R.-H., Drummond M.-S., de B.-J. -. Z., Maury R.-C.,Bellon H., Jackson T.-E., and Restrepo J.-F. (1991b) Andesite and dacite genesis viacontrasting processes; the geology and geochemistry of El Valle Volcano, Panama.Contributions to Mineralogy and Petrology 106(3), Pages 309-324.
Defant M. J., Jackson T. E., Drummond M. S., De Boer J. Z., Bellon H., Feigenson M. D.,Maury R. C., and Stewart R. H. (1992) The geochemistry of young volcanismthroughout western Panama and southeastern Costa Rica. Journal of the GeologicalSociety , London 149, 569-579.
Defant M. J. and Drummond M. S. (1993): Subducted lithosphere-derived andesitic anddacitic rocks in young volcanic arc setting. Nature 347: 662-665.
DeMetz C., Gordon R. G., Argus D. F., and Stein S. (1990) Current plate motions.Geophysical Journal International 101, 425-478.
Dengo G. (1962) Tectonic- Igneous Sequence in Costa Rica. Geological Society of AmericaSpecial Paper, 133-161.
DePaolo D. J. (1981) Trace element and isotopic effects of combined wallrock assimilationand fractional crystallization. Earth and Planetary Science Letters 53, 189-202.

References 101
DePaolo D. J. and Wasserburg G. J. (1976) Nd isotopic variations and petrogenetic models.Geophys. Res. Lett. 3, 249-252.
Dickinson W. R. and Snyder W. S. (1979) Geometry of subducted slabs related to San Andeastransform. Journal of Geology 87, 609 - 627.
Diebold J. B., Stoffa P. L., Buhl P. and Truchan. M. (1981): Venezuela Basin crustalstructure. JGR. Journal of Geophysical Research. B. 86; 7901-7923.
Donnelly T. W., Beets D., Carr M. J., Jackson T., Klaver G., Lewis J., Maury R.,Schellenkens H., Smith A. L., Wadge G., and Westercamp D. (1990) History andtectonic setting of Caribbean magmatism. In The Caribbean Region, Vol. The Geologyof North America, Vol. H (ed. G. Dengo and J. E. Case), pp. 339-374. GeologicalSociety of America.
Draper G. and Dengo G. (1990) History of geological inverstigation in the Caribbean region.In The Caribbean Region, Vol. The Geology of North America, Vol. H (ed. G. Dengoand J. E. Case), pp. 1-14. Geological Society of America.
Drummond M. S., Bordelon M., de B.-J. Z., Defant M. J., Bellon H., and Feigenson M. D.(1994) Igneous petrogenesis and tectonic setting of the Cordillera de Talamanca, CostaRica-Panama, Central American arc. Abstracts with Programs - Geological Society ofAmerica 26(7), Pages 331.
Drummond M.-S., Bordelon M., de B.-J. -. Z., Defant M.-J., Bellon H., and Feigenson M.-D.(1995) Igneous petrogenesis and tectonic setting of plutonic and volcanic rocks of theCordillera de Talamanca, Costa Rica-Panama, Central American arc. American Journalof Science 295(7), Pages 875-919.
Duncan R. A. and Hargraves R. B. (1984) Plate tectonic evolution of the Caribbean region inthe mantle reference frame. Geol. Soc. America, Memoir 162, 81-93.
Eiler J. M., Farley K. A., Valley J. W., Hauri E., Craig H., Hart S. R., and Stolper E. M.(1997) Oxygen isotope variations in ocean island basalt phenocrysts. Geochimica etCosmochimica Acta 6(11), 2281-2293.
Ellam R. M. and Hawkesworth C. J. (1988) Elemental and isotopic variations in subductionrelated basalts; evidence for a three-component model. Contributions to Mineralogy andPetrology 98(1), Pages 72-80.
Elliot T., Planck T., Zindler A., White W., and Bourdon B. (1997) Element transport fromslab to volcanic front at the Mariana arc. Journal of Geophysical Research 102(7),14,991-15,019.
Escalante G. (1990) The geology of southern Central America and western Colombia. In TheCaribbean Region, Vol. The Geology of North America, Vol. H (ed. G. Dengo and J. E.Case), pp. 201-230. Geological Society of America.
Faure G. (1986) Principles of isotope geology. John Wiley & Sons, New York, 2nd edition,589pp.
Feigenson M.-D. and Carr M.-J. (1986) Positively correlated Nd and Sr isotope ratios of lavasfrom the Central American volcanic front. Geology (Boulder) 14(1), Pages 79-82.

References 102
Feigenson M.-D. and Carr M.-J. (1993) The source of Central American lavas; inferencesfrom geochemical inverse modeling. Contributions to Mineralogy and Petrology113(2), Pages 226-235.
Fisher S. P. and Pessagno E. A. (1965) Upper Cretaceous strata of north-western Panama.American Association of petroleum Geologists Bulletin 49, 433-444.
Forsythe R. D., Nelson E. P., Carr M. J., Kaeding M. E., Herve M., Mpodozis C., Soffia J.M., and Harambour S. (1986) Pliocene near- trench magmatism in southern Chile: Apossible manifestation of ridge collision. Geology 14, 23 - 27.
Gabb W. M. (1874a) Note on the Geology of Costa Rica. American Journal of Science 7,438-439.
Gabb W. M. (1874b) Notes on the geology of Costa Rica. American Journal of Science 8,388-390.
Gabb W. M. (1875) Notes on the geology of Costa Rica. American Journal of Science 9, 198-204.
Gaber L. J., Foland K. A. and Corbato C. E. (1988): On the significance of argon releasefrom biotite and amphibole during 40Ar/39Ar vacuum heating. Geochim. Cosmochim.Acta. 52; 2457-2465
Gardner T. W. and others a. (1987) Central America and Caribbean. Geological Society ofAmerica Centennial Special Volume.
Gardner T.-W., Verdonck D., Pinter N.-M., Slingerland R.-L., Furlong K.-P., Bullard T.-F.,and Wells S.-G. (1992) Quaternary uplift astride the aseismic Cocos Ridge, PacificCoast, Costa Rica. Geological Society of America Bulletin 104(2), Pages 219-232.
Gargantini M. (1993) Analisi petrologica em geochimica di un sill differenziato dellaformazione alcalina di Guyacan, Squirres, Costa Rica. Tesi di Laurea, Universita´deglistudi di Milano.
GERM. (1998) Global Earth Reference Model - online data bank: F. Albarede, W.McDonough, H. Shaw, H. Staudigel, W. White, A. Zindler (eds.). http://www.-ep.es.llnl.gov/germ/germ-home.html .
Ghosh N., Hall S. A. and Casey J. F. (1984): Seafloor spreading magnetic anomalies in theVenezuelan Basin. In: Bonini W. E., Hargraves R. B. and Shagam R. (eds.) TheCaribbean-South American plate boundary and regional tectonics. Memoir - GeologicalSociety of America. 162; 65-80.
Gill, J.B. (1981): Orogenic andesites and plate tectonics. Springer Verlag, Berlin. 358 pp.
Goedde H. (1998) Study results presented on annual TICOSECT meeting Göttingen.
Graefe K. (1998) Study results presented on annual TICOSECT meeting Göttingen.
Green, T.H. (1982): Anatexis of mafic crust and high pressure crystallisation of andesite. InThorpe, R.S. (Ed.): Andesites: orogenic andesites and related rocks. Wiley, Chichester:465-487.

References 103
Guendel F. D. (1986) Seismotectonics of Costa Rica: An analytical view of the southernterminus of the Middle American trench. Ph.D. thesis, University of California.
Haeussler P.-J., Bradley D.-C., Goldfarb R.-J., Snee L.-W., and Taylor C.-D. (1995) Linkbetween ridge subduction and gold mineralization in Southern Alaska. Geology(Boulder) 23(11), Pages 995-998.
Handschuhmacher D. W. (1976) Post-Eocene plate tectonics of the Eastern Pacific. In:Sutton, G.H.; Manghnani, M.H. & Moberly, R. (ed.): The Geophysics of the PacificOcean and its margins; American Geophys Union, 177-202.
Hart S. R. and Dodd R. T. Jr (1962): Excess radiogenic argon in pyroxenes. J. Geophys. Res.67; 2998-2999.
Hauff F. (1998) Study results presented on annual TICOSECT meeting Göttingen.
Hauff F., Hoernle K., Schminke H.-U., and Werner R. (1997) A Mid Cretaceaous Origin forthe Galápagos Hotspot: Volcanological, Petrological and Geochemical Evidence fromCosta Rican Oceanic Crustal Segments. Geologische Rundschau, 86, 141-155
Hawkesworth C. J., Turner S. P., McDermott F., Peate D. W., and Van Calsteren P. (1997) U-Th Isotopes in Arc Magmas: Implications for Element Transfer from the SubductedCrust. Science 276, 551-555.
Heezen B. C. and Rawson M. (1977) Visual observations of contemporary current erosionand tectonic deformation on the Cocos Ridge crest. Marine Geology 23, 173-196.
Heinrichs H. and Herrmann A. G. (1990) Praktikum der Analytischen Geochemie. Springer-Verlag, 669pp.
Henningsen D. (1966a) Die pazifische Küstenkordillere (Cordillera Costena) Costas Ricasund ihre Stellung innerhalb des süd-zentralamerikanischen Gebirges. GeotektonischeForschungen 23, 3-66.
Henningsen D. (1966b) Estratigrafia y paleogeografia de los sedimentos del Cretacico . . .-Terciario en el sector sureste de Costa Rica. Inst. Centroamericano Inv. y TecnologiaIndus. Pub. Geol. ICAITI 1, 53-57.
Herrstrom E. A., Reagan M. K., and Morris J. D. (1995) Variations in lava compositionassociated with flow of asthenosphere beneath southern Central America. Geology(Boulder) 23(7), Pages 617-620.
Hey R. (1977) Tectonic evolution of the Cocos-Nazca spreading center. Geological Society ofAmerica Bulletin 88, 1404-1420.
Hey R., Johnson G. L., and Lowrie A. (1977) Recent plate motions in the Galapagos area.Geological Society of America Bulletin 88, 1385-1403.
Heywood C. E. (1984) Forearc deformation in southern Costa Rica: A consequence of thecollision of the aseismic Cocos Ridge. M.S. thesis, University of California.
Hibbard J. P. and Karig D. E. (1990) Structural and magmatic responses to spreading ridgesubduction; an example from Southwest Japan. Tectonics 9(2), Pages 207-230.

References 104
Hildreth W. and Moorbath S. (1988) Crustal contributions to arc magmatism in the Andes ofcentral Chile. Contributions to Mineralogy and Petrology 98(4), Pages 455-489.
Hole M. J. and Larter R. D. (1993) Trench- proximal volcanism following ridge crest- trenchcollision along the antartic peninsula. Tectonics 12(4), 897 - 910.
Hole M. J., Rogers G., Saunders A. D., and Storey M. (1991) Relation between alkalicvolcanism and slab-window formation. Geology (Boulder) 19(6), Pages 657-660.
Irvine T. N. and Baragar W. R. A. (1971) A guide to the chemical classification of commonvolcanic rocks. Canadian Journal of Earth Sciences 8, 523-548.
Ishikawa T. and Nakamura E. (1994) Origin of the slab component in arc lavas from across-arc variation of B and Pb isotopes. Nature (London) 370(6486), Pages 205-208.
Johnson R. W., Jaques A. L., Langmuir C. H., Perfit M. R., Staudigel H., Dunkley P. N.,Chappell B. W., Taylor S. R., and Baekisapa M. (1987) Ridge subduction and forearcvolcanism; petrology and geochemistry of rocks dredged from the western Solomon Arcand Woodlark Basin. Circum Pacific Council for Energy and Mineral Resources, EarthScience Series 7, 155-226.
Johnston S.-T. and Thorkelson D.-J. (1997) Cocos-Nazca slab window beneath CentralAmerica. Earth and Planetary Science Letters 146(3-4), Pages 465-474.
Kay R. W. (1978) Aleutian magnesian andesites; melts from subducted Pacific Ocean crust.Journal of Volcanology and Geothermal Research 4(1-2), Pages 117-132.
Kay S. M., Ramos V. A., and Marquez M. (1993) Evidence in Cerro Pampa volcanic rocksfor slab-melting prior to ridge-trench collision in southern South America. Journal ofGeology 101(6), Pages 703-714.
Keigwin L. D., Jr. (1982) Late Cenozoic isotope stratigraphy of DSDP Site 157 (PanamaBasin); onset of Northern Hemisphere glaciation. Eos, Transactions, AmericanGeophysical Union 63(45), Pages 1143.
Kelemen P.-B., Johnson K. T. M., Kinzler R. J., and Irving A. J. (1990) High-field-strengthelement depletions in arc basalts due to mantle-magma interaction. Nature (London)345(6275), Pages 521-524.
Kelemen P.-B., Shimizu N., and Dunn T. (1993) Relative depletion of niobium in some arcmagmas and the continental crust; partitioning of K, Nb, La and Ce during melt/ rockreaction in the upper mantle. Earth and Planet. Sci. Lett. 120(3-4), Pages 111-133.
Kelleher J. and McCann W. (1976): Buoyant zones, great earthquakes, and unstableboundaries of subduction. J. Geophys. Res. 81; 4885-4896.
Kelleher J. and McCann W. (1977) Bathymetric highs and the development of convergentplate boundaries. In Island Arcs, Deep Sea Trenches and Back-Arc Basins, Vol. 1 (ed.M. Talwani and W. C. Pitman III), pp. 115-122. Am. Geophys. Union, Maurice EwingSer.
Kepezhinskas P., McDermott F., Defant M.-J., Hochstaedter A., Drummond M.-S.,Hawkesworth C.-J., Koloskov A., Maury R.-C., and Bellon H. (1997) Trace element
References 105
and Sr-Nd-Pb isotopic constraints on a three-component model of Kamchatka Arcpetrogenesis. Geochimica et Cosmochimica Acta 61(3), Pages 577-600.
Kesel R.-H. (1983) Quaternary history of the Rio General Valley, Costa Rica. ResearchReports National Geographic Society 15, 339-358.
Kilian R. and Stern C. (1994) New trace element and isotopic constraints on the genesis ofandesites and dacites of the Quaternary Austral Volcanic Zone of the Andes.Mineralogical Magazine 58A(A-K), Pages 477-478.
Kimura G., Silver E. A., Blum P., and al. e. (1997) Proccedings of the Ocean DrillingProgram, Initial Reports. 170(College Station, Texas), 7-17.
Klein E. M. and Langmuir C. H. (1987) Global correlations of ocean ridge basalt chemistrywith axial depth and crustal thickness. J. Geophys. Res. 92, 8089-8115.
Kolarsky R.-A., Mann P., and Montero W. (1995a) Island arc response to shallow subductionof the Cocos Ridge, Costa Rica. In Geologic and Tectonic Development of theCaribbean Plate Boundary in Southern Central America, Vol. Special Paper. Vol.295(ed. P. Mann), pp. 235-262. Geological Society of America.
Kolarsky R.-A., Mann P., and Montero W. (1995b) Island arc response to shallow subductionof the Cocos Ridge, Costa Rica. Special Paper Geol. Society of America 295, 235-262.
Kruckow T. (1974) Landhebung im Valle Central und Wachstum der Küstenebenen in CostaRica (Mittelamerika). Jahrbuch Wittheit zu Bremen 18, 247-263.
Kuijpers E. P. (1979) Analisis sedimentológico de la Formación Punta Caballo (Mioceno),Costa Rica. Geogr. Nac., Informe Semest. 1979/2, 77-94.
Kussmaul S. (1987) Petrologia de las rocas intrusivas Neogenas de Costa Rica TranslatedTitle: Petrology of the Neogene intrusive rocks of Costa Rica. Revista Geologica deAmerica Central 7, 83-111.
Kussmaul S., Tournon J., and Alvarado G. (1994) Evolution of the Neogene to Quaternaryigneous rocks of Costa Rica. In Geology of an Evolving Island Arc. The Isthmus ofSouthern Nicaragua, Costa Rica, and Western Panama, Vol. 7 (ed. H. Seyfried and W.Hellmann), pp. 97-123. Profil.
Lanphere M. A. and Dalrymple G. B. (1971) A test of the 40Ar/39 Ar age spectrum techniqueon some terrestrial materials. Earth Planet. Sci. Lett. 12, 359-372.
Lanphere M. A. and Dalrymple G. B. (1976) Identification of excess 40Ar by the 40Ar/39Arage spectrum technique. Eart Planet. Sci. Lett. 32, 141-148.
Le Maitre, R.W. (1989): A classification of igneous rocks and glossary of terms.Recommendations of the International Union of Geological Sciences, subcommissionon the systematics of igneous rocks. Blackwell Scientific Publications, Oxford,London, Edinburgh, Boston, Melbourne.
Leake, B.E., Woolley, A.R., Arps, C.E.S., Birch, W.D., Gilbert, M.C., Grice, J.D.,Hawthorne, F.C., Kato, A., Kisch, H.J., Krivovichev, V.G., Linthout, K., Laird, J.,Mandarino, J., Maresch, W.V., Nickel, E.H., Rock, N.M.S., Schumacher, J.C., Smith,

References 106
D.C., Stephenson, N.C.N., Ungaretti, L., Whittaker, E.J.W. and Youzhi, G. (1997):Nomenclature of amphiboles. Report on the subcommittee on amphiboles of theinternational mineralogical association commision on new minerals and mineral names.European Journal of Mineralogy 9: 623-651.
Leeman W.-P. and Carr M.-J. (1995) Geochemical constraints on subduction processes in theCentral American volcanic arc; implications of boron geochemistry. In Geologic andTectonic Development of the Caribbean Plate Boundary in the Southern CentralAmerica, Vol. Special Paper. Vol. 295 (ed. P. Mann), pp. 57-73. Geological Society ofAmerica.
Leeman W.-P., Carr M.-J., and Morris J.-D. (1994) Boron geochemistry of the CentralAmerican volcanic arc; constraints on the genesis of subduction-related magmas.Geochimica et Cosmochimica Acta 58(1), Pages 149-168.
Lundberg N. (1991) Detrital record of the early Central American magmatic arc; petrographyof intraoceanic forearc sandstones, Nicoya Peninsula, Costa Rica. Geological Society ofAmerica Bulletin 103(7), Pages 905-915.
Luoni F. (1993) Petrologica e geochemica dei prodotti effusivi e subvulcanici dellaFormazione alcalina di Guayacan, Squirres ( Costa Rica ). Tesi di Laurea, Universita´Degli Studi di Milano.
Longerich, H.P. (1993): Oxychlorine ions in inductively coupled plasma-mass spectrometry:effect of chlorine speciation as Cl- and ClO4. Journal of Analytical Atomic Spectrometry8: 439-444.
Lonsdale P. and Klitgord K. D. (1978) Structure and tectonic history of the eastern PanamaBasin. Geological Society of America Bulletin 89, 981-999.
Malfait B. T. and Dinkelman M. G. (1972) Circum-Caribbean Tectonic and Igneous Activityand the Evolution of the Caribbean Plate. Geological Society of America Bulletin 83,251-272.
Mann P. and Burke K. (1984) Neotectonics of the Caribbean. Reviews of Geophysics andSpace Physics 22, 309-362.
Mann P., Schubert C., and Burke K. (1990) Review of Caribbean neotectonics. In TheCaribbean Region, Vol. The Geology of North America, Vol. H (ed. G. Dengo and J. E.Case), pp. 307-338. Geological Society of America.
McCulloch M.-T. and Gamble A. J. (1991) Geochemical and geodynamical constraints onsubduction zone magmatism. Earth and Planetary Science Letters 102(3-4), 358-374.
McDougall I. and Harrison T. M. (1988) Geochronology and Thermochronology by the40Ar/39Ar method. Oxford University Press.
McGeary S., Nur A., and Ben Avraham Z. (1985) Spatial gaps in arc volcanism: the effect ofcollision or subduction of oceanic plateaus. Tectonophysics 119, 195-221.
McIntyre G. A., Brooks C., Compston W., and Turek A. (1966) The statistical assessment ofRb-Sr isochrons. J. Geophys. Res. 71, 5459-5468.

References 107
Meschede M. (1986) A method of discriminating between different types of mid-ocean ridgebasalts and continental tholeiites with the Nb-Zr-Yb diagram. Chem. Geol. 56, 207-218.
Meschede M. (1998) Neue Erkenntnisse zur plattentektonischen Entwicklung der Cocos-Platte als Ergebnis einer multidisziplinären Studie. Ocean Drilling Programm- DeepSea Drilling, 4.-6. March 1998, Abstract Volume, 38-39.
Milionis P. N., Feigenson M. D., Carr M. J., and Alvarado G. E. (1986) Constraints on theSource of Central Costa Rica Alkalic Lavas. EOS.
Miller D.-M., Goldstein S.-L., and Langmuir C.-H. (1994) Cerium/ lead and lead isotoperatios in arc magmas and the enrichment of lead in the continents. Nature (London)368(6471), Pages 514-520.
Miyamura S. (1975) Recent crustal movements in Costa Rica disclosed by relevellingsurveys. Tectonophysics 29, 191-198.
Montero W. (1994) Neotectonics and related stress distribution in a subduction-collisionalzone: Costa Rica. In Geology of an Evolving Island Arc. The Isthmus of SouternNicaragua, Costa Rica, and Western Panama, Vol. 7 (ed. H. Seyfried and W.Hellmann), pp. 125-141. Profil.
Moore G. F. and Sender K. L. (1995) Fracture zone collision along the South Panama margin.In Geologic and Tectonic Development of the Caribbean Plate Boundary in theSouthern Central America, Vol. Special Paper. Vol. 295 (ed. P. Mann), pp. 201-212.Geological Society of America.
Morgan W. J. (1971) Convecting plumes in the lower mantle. Nature 230, 42-43.
Morris J. D., Leeman W. P., and Tera F. (1990) The subducted component in island arc lavas;constraints from B-Be isotopes and Be systematics. Nature (London) 344(6261), Pages31-36.
Mullen E. D. (1983) MnO/TiO2/P2O5: a minor element discriminant for basaltic rocks ofoceanic environments and its implications for petrogenesis. Earth Planet. Sci. Lett. 62,53-62.
Navon, O. and Stolper, E. (1987): Geochemical consequences of melt percolation: the uppermantle as a chromatographic column. Journal of Geology 95: 285-307.
Nesbitt H. W., Markovics G., and Price R. C. (1980) Chemical processes affecting alkalis andalkaline earths during continental weathering. Geochimica et Cosmochimica Acta 44,1659 - 1666.
Nichols G.-T., Wyllie P.-J., and Stern C.-R. (1994) Subduction zone melting of pelagicsediments constrained by melting experiments. Nature (London) 371(6500), Pages 785-788.
Ormerod D.-S., Hawkesworth C.-J., Rogers N.-W., Leeman W.-P., and Menzies M.-A. (1988)Tectonic and magmatic transitions in the western Great Basin, USA. Nature (London)333(6171), Pages 349-353.

References 108
Peacock S. M. (1990): Numerical simulation of metamorphic pressure-temperature-timepaths and fluid production in subducting slabs. Tectonics. 9; 5
Peacock S.-M., Rushmer T., and Thompson A.-B. (1994) Partial melting of subductingoceanic crust. Earth and Planetary Science Letters 121(1-2), Pages 227-244.
Pearce J. A. (1983) Role of the sub-continental lithosphere in magma genesis at activecontinental margins. In Continental basalts and mantle xenoliths (ed. Hawkesworth andNorry), pp. 230-272. Shiva.
Pearce J. A. and Cann J. R. (1973) Tectonic setting of basic volcanic rocks determined usingtrace element analysis. Earth Planet. Sci. Lett. 19, 290-300.
Pearce J. A. and Norry M. J. (1979): Petrogenetic implications of Ti, Zr, Y, and Nb variationsin volcanic rocks. Contrib. Min. Pet. 69, 33-47.
Peccerillo, A. and Taylor, S.R. (1976): Geochemistry of Eocene calc-alkaline volcanic rocksfrom the Kastamonu area, Northern Turkey. Contributions to Mineralogy and Petrology58: 63-81.
Pichler H. and Schmitt-Riegraf C. (eds) (1987): Gesteinsbildende Minerale im Dünnschliff,Translated Title: Rock-forming minerals in thin-section. Enke Verlag. Stuttgart, 230 pp.
Pindell J. L. and Barrett S. F. (1990) Geological evolution of the Caribbean region; a plate-tectonic perspective. In The Caribbean Region, Vol. The Geology of North America,Vol. H (ed. G. Dengo and J. E. Case), pp. 405-432. Geological Society of America.
Plank T. and Langmuir C.-H. (1988) An evaluation of the global variations in the majorelement chemistry of arc basalts. Earth and Planetary Science Letters 90(4), 349-370.
Potts P. J. (1987) A handbook of silicate rock analysis. Blackie, London, 669p.
Protti M., Güendel F., and McNally K. (1995) Correlation between the age of the subductingCocos plate and the geometry of the Wadati- Benioff zone under Nicaragua and CostaRica. In Geologic and Tectonic Development of the Caribbean Plate Boundary inSouthern America, Vol. Special Paper. No. 295 (ed. P. Mann), pp. 309-326. GeologicalSociety of America.
Rapp R. P. (1994) Partial melting of metabasalts at 2-7 GPa: Experimental results andimplications for lower crustal and subduction zone processes. Mineral. Mag. 58A, 760-761.
Rapp, R.P. and Watson, E.B. (1995): Dehydration melting of metabasalt at 8-32 kbar:implications for continental growth and crust-mantle recycling. Journal of Petrology 35:891-931.
Rea D. K. and Malfait B. T. (1974) Geologic Evolution of the Northern Nazca Plate. Geology,317-320.
Reagan M.-K., Gill J.-B., and Mattinson J.-M. (1986) The origin of "intraplate" basalt in anarc setting at Turrialba Volcano, Costa Rica. Eos, Transactions, American GeophysicalUnion 67(44), Pages 1280.

References 109
Rickwood P. C. (1989) Boundary lines within petrologic diagrams which use oxides of majorand minor elements. Lithos 22, 247-263.
Rivier S.-F. (1985) Seccion geologica del Pacifico al Atlantico a traves de Costa RicaTranslated Title: Geologic section across Costa Rica from the Pacific to the Atlantic.Revista Geologica de America Central 2, 23-32.
Robin C. and Tournon J. (1978) Spatial relations of andesitic and alkaline provinces inMexico and Central America. Can. J. Earth Sci. 15, 1633 - 1641.
Rogers G. and Saunders D. (1989) Magnesian andesites from Mexico, Chile and the AleutianIslands: implications for magmatism associated with ridge- trench collision. InBoninites and related Rocks (ed. A. J. Crawford), pp. 416-445.
Roddick J. C., Cliff R. A., and Rex D. C. (1980) The evolution of excess argon in alpinebiotites - A 40Ar-39Ar analysis. Earth Planet. Sci. Lett. 48, 185-208.
Saenz R.-R. (1982) Edades radiometricas de algunas rocas en Costa Rica Translated Title:Radiometric ages of some rocks in Costa Rica. Boletin de Vulcanologia 12, 8-10.
Sapper K. (1937) Mittelamerika. Steinmann and Wikkens.
Schumacher J. C. (1997) The estimation of ferric iron in electron microprobe analysis ofamphiboles. Eur. J. Mineral. 9, 643-651.
Seebach K. v. (1892) Über Vulkane Zentralamerikas. Dieterische Verlags-Buchhandlung.
Shaw D. M. (1970) Trace element fractionation during anatexis. Geochim. Cosmochim. Acta34, 237-243.
Shi Y. (1992) Induced mantle flow and back-arc opening due to roll-back subduction.International Geological Congress, Abstracts Congres Geologique Internationale,Resumes 29(131).
Shi Y. and Wang Y.-c. (1979) Roll-back subduction and back-arc opening. Diqiu WulixueBao = Acta Geophysica Sinica 36(1), Pages 37-43.
Shipboard Sci. Party; Kimura G., Silver E. A., Blum P., et al.. (1997) Proccedings of theOcean Drilling Program, Initial Reports. Vol 170, 458 pp.
Sisson V.-B. and Pavlis T.-L. (1993) Geologic consequences of plate reorganization; anexample from the Eocene Southern Alaska fore arc. Geology (Boulder) 21(10), Pages913-916.
Stack C. M. (1991) Inverse modeling of alkaline lavas from Guyacan, Costa Rica. Master ofScience, Rutgers, University of New Jersey.
Stern C. R. and Kilian R. (1996) Role of the subducted slab, mantle wedge and continentalcrust in the generation of adakites from the Andean Austral Volcanic Zone. Contrib.Mineral. Petrol. 123, 263-281.
Stoiber R. E. and Carr M. J. (1973) Quaternary Volcanic and Tectonic Segmentation ofCentral America. Bulletin Volcanologique 37, 304-325.

References 110
Streckeisen A. (1976) To each plutonic rock its proper name. Earth Sci. Rev. 12, 1-33.
Sun, S.S. and Mc Donough, W.F. (1989): Chemical and isotopic systematics of oceanicbasalts. In Saunders, A.D. and Norry, M.J. (Eds.): Magmatism in the Ocean basins.Geological Society of London Special Publication 42: 313-345.
Tajima F. and Kikuchi M. (1995) Tectonic implications of the seismic ruptures associatedwith the 1983 and 1991 Costa Rica earthquakes. In Geologic and Tectonic Developmentof the Caribbean Plate Boundary in the Southern Central America, Vol. Special Paper.Vol. 295 (ed. P. Mann), pp. 327-340. Geological Society of America.
Taylor H. P., Jr. (1986) Igneous Rocks II: Isotopic case studies of circumpacific magmatism.In Stable Isotopes in high temperature geological processes, Vol. 16 (ed. J. W. Valley,H. P. Taylor, Jr., and J. R. O'Neil).
Tera F., Brown L., Morris J., Sacks I. S., Klein J., and Middleton R. (1986) Sedimentincorporation in island-arc magmas: Inferences from 10Be. Geochim. Cosmochim. Acta50, 535-550.
Thorkelson D.-J. (1996) Subduction of diverging plates and the principles of slab windowformation. Tectonophysics 255(1-2), Pages 47-63.
Thorkelson D. J. and Taylor R. P. (1989) Cordilleran slab windows. Geology 17, 833-836.
Thorpe R. S., Francis P. W., and Moorbath S. (1979) Strontium isotope evidence forpetrogenesis of Central American andesites. Nature (London) 277(5691), Pages 44-45.
TICOSECT. (1998) Annual meeting, unpub. meeting report.
Tiedemann R., Franz S. O., Haug G., and Zahn R. (1998) Pliocene closure of the CentralAmerican Isthmus and its impact on the formation of North Atlantic deep andintermediate water. Ocean Drilling Programm- Deep Sea Drilling Project, 61-62.
Tournon J. (1972) Présence de Basaltes Alcalins Récents au Costa Rica (Amérique Centrale).Bulletin volcanologique 36, 140 - 147.
Tournon J. (1984) Magmatismes du mésozoique à l´actuel en Amérique Centrale. L´exemplede Costa Rica, des ophiolites aux andesites. Ph.D. thesis, Université Pierre et MarieCurie. 335p
Tournon J. and Alvarado G. (1997) Carte géologique du Costa Rica / Mapa geológico deCosta Rica. Notice explicative / Folleto explicativo. Instituto tecnológico de Costa Rica,80p.
Turner G. (1971) 40Ar-39Ar ages from the lunar maria. Earth. Planet. Sci. Lett. 11, 169-191.
Turner S., Hawkesworth C., van C.-P., Heath E., Macdonald R., and Black S. (1996) U-seriesisotopes and destructive plate margin magma genesis in the Lesser Antilles. Earth andPlanetary Science Letters 142(1-2), Pages 191-207.
Van Andel T. H., Heath G. R., Malfait B. T., Heinrichs D. F., and Ewing J. I. (1971)Tectonics of the Panama Basin, Eastern Equatorial Pacific. Geological Society ofAmerica Bulletin 82, 1489-1508.
References 111
Van der Hilst R. D., Widiyantoro S., and Engdahl E. R. (1997) Evidence for deep mantlecirculation from global tomography. Nature 386, 578-584.
Vogt P. R., Lowrie A., Bracey D. R., and Hey R. N. (1976) Subduction of Aseismic OceanicRidges: Effects on Shape, Seismicity, and Other Characteristics of Consuming PlateBoundaries. The Geological Society of America Special Paper 172, 1 - 59.
Von Huene R. and Scholl D. W. (1993) The return of sialic material to the mantle indicatedby terrigeneous material subducted at convergent margins. Tectonophys. 219, 163-175.
Wartho J. A., Rex D. C. and Guise P. G. (1996): Excess argon in amphiboles linked togreenschist facies alteration in the Kamila amphibolite belt, Kohistan island arc system,northern Pakistan; insights from (super 40) Ar/ (super 39) Ar step-heating and acidleaching experiments. Geolog. Mag. 133, 595-609.
Werner R. (1998) Report on study results, annual TICOSECT meeting Göttingen.
Weyl R. (1957) Beitraege zur Geologie der Cordillera de Talamanca Costa Ricas(Mittelamerika). Neues Jahrbuch fuer Geologie und Palaeontologie. Abhandlungen.Pages.
Weyl R. (1961) Volcanoes and Volcanic Landscapes in Central America. Germany- theMagazine of the Federal Republic 6(25), 1-5.
Weyl R. (1980) Geology of Central America. Gebrüder Bornträger, Berlin, 410p.
White, W.M. and Patchett, P.J. (1984): Hf-Nd-Sr isotopes and incompatible elementabundances in island arcs: implications for magma origin and crust mantle evolution.Earth and Planetary Science Letters 67: 167-185.
White W.-M., McBirney A.-R., and Duncan R.-A. (1993) Petrology and geochemistry of theGalapagos Islands; portrait of a pathological mantle plume. Journal of GeophysicalResearch, B, Solid Earth and Planets 98(11), Pages 19,533-19,563.
Wiechert U. and Hoefs. J. (1995): An excimer laser-based micro analytical preparationtechnique for in-situ oxygen isotope analysis of silicate and oxide minerals. In: Vankoand Brown (eds) Papers presented at PACROFI V; 5th biennial Pan-American Conf. onResearch on fluid inclusions. Geochim. Cosmochim. Acta. 59, 4093-4101.
Wilson J. T. (1963): Age and location of islands and aseismic ridges as a key to behavior ofthe upper mantle. Transactions, American Geophysical Union. 44; 97pp.
Wilson M. (1989) Igneous Petrogenesis. Unwin Hyman, London, 466p.
Wyllie P. J. (1982) Subduction products according to experimental prediction-. GeologicalSociety of America Bulletin 93, 468 - 476.
Yogodzinski G. M., Kay R. W., Volynets O. N., Koloskov A. V., and Kay S. M. (1995)Magnesian andesite in the western Aleutian Komandorsky region; implications for slabmelting and processes in the mantle wedge. Geol. Soc. America Bull. 107(5), 505-519.

Appendix 112
10 Appendix
10.1 Analytical Methods
110 igneous rock samples were collected in Costa Rica for the present study. After a firstrevision, 80 of these rocks were analysed by XRF. Based on the acquired geochemical data, anumber of 60 samples was chosen for ICP-MS analysis, and a subset of 30 of these wasadditionally selected for isotope analyses.All analyses were carried out at the Geochemisches Institut and the Institut für Geologie undDynamik der Lithosphäre, University of Göttingen except for the 40Ar/39Ar dating which wasdone in co-operation with the German Geological Survey, BGR, at Hanover.
10.1.1 Sample PreparationThe sample size varies from about 500 g to 20 kg, depending on availability, grain size, andanalytical processing (e.g. mineral separation). To minimise secondary contamination of thesamples, removal of alteration rims and splitting up into suitable chips was done directly attheir sampling location.Remaining alteration rims were cut off with a diamond saw, sawmarks were raped off withSi-carbide grinding paper and the samples were all carefully cleaned.Hand-specimen were kept from all samples and thin sections were made from those sampleswhich were selected to be analysed. The entire rest of the sample material was crushed in Fe-Mn-steel-jaw crushers. About 250 g of that material was separated using a rotation-separator.These aliquots of each sample were grinded in agate ball mills until grain-sizes were <65 µm.
Sample preparation for those analytical procedures not using the powder fraction (e.g. mineralseparation) are described in the respective chapters.
10.1.2 Analysis of Ferrous Iron (Fe2+)Since ferrous iron could not be distinguished from ferric iron by XRF analysis, it had to bedetermined separately by titration of the HF-H2SO4 dissolved sample powder against KMnO4(method after Pratt). For details refer to Heinrichs and Herrmann 1990.
10.1.3 Determination of Loss On Ignition (LOI)The volatile content of the samples (mainly H2O, CO2) was determined by heating of about 1gof rock powder to more than 1000°C in a muffle oven for about 4 hours. The resulting weightloss in percent is called loss on ignition.
10.1.4 X-Ray Fluorescence Spectroscopy (XRF)XRF spectroscopy uses characteristic x-rays (secondary fluorescence), generated byexcitation of inner shell electrons with primary x-rays to specify elements and concentration.For details of the method refer to Potts [1987]- This analytical method was used to determinemajor- and minor elements (Si, Ti, Al, Fe, Mn, Mg, Ca, Na, K, P) of the rocks as well as sometrace elements (Rb, Sr, Ba, Sc, V, Cr, Ni, Zn, Ga, Y, Zr, Nb, Pb). The analysis was done onglass tablets [Ahmedali, 1989], prepared by melting of 1g of sample powder with 5.5gspectroflux (Li2B4O7) and 0.5g LiF at 1100°C using a semi-automated melting apparatus.Measurements were carried out on a Philips PW 1408 with calibration against multiple

Appendix 113
international standards and internal correction for matrix effects. A check for correctness andreproducibility was provided by simultaneous measurement of standards.
10.1.5 Inductively Coupled Plasma Mass Spectrometry (ICPMS)
10.1.5.1 Whole Rock AnalysisThe ICPMS technique provides the advantage of simultaneous determination of a wide rangeof trace elements from Li to U, low detection limits and good analytical precision especiallyfor masses >80. Fundamentals of this method are described in Potts 1987, Garbe-Schönberg1993. For the present purpose, trace elements like REE (La – Lu), HFSE (Nb, Ta, Zr, Hf),LILE (Rb, Sr, Ba, Tl, Cs), and others (Li, Be, Cu, Y, Pb, Th, U, Sc, V, Cr, Co, Ni, Zn) of 78selected samples were analysed on an ICPMS VG-PlasmaQuad STE. Selection of respectiveisotopes was done on criteria of abundance and exclusion of isobaric interference. Calibrationof the intensities against concentration values for each element is provided by measuringmulti-element calibration solutions prior to sample acquisition. These calibration solutionswere prepared from stock solutions by aiming to span the total range of expectedconcentrations and by the attempt to keep the elemental ratios close to natural conditions. Acontrol for contaminations due to dissolution processes is obtained by measurement ofsimultaneously prepared blank solutions, a correction for the machine drift is provided byrepeated measurement of one of the calibration solutions and by the internal standards of Rh,Re, In. Co-processed lab-internal and international standards provided an external check foraccuracy and reproducibility.Sample preparation: About 100 mg of sample powder was weighed into Teflon beakers afterHeinrichs and Herrmann [1990] and dissolved under pressure in a mixture of acids composedof 3 ml HF, 3ml HClO4, and 1 ml HNO3. After cessation of gas formation, the beakers weretightly closed and heated in a muffle oven at 200°C for 14 hours. After cooling to ambienttemperatures, the beakers were opened and placed on a hot plate for evaporation at 180°C.The dried sample was re-dissolved in 2 ml HNO3 and once again put onto the hot plate. Afterthe second stage of evaporation, 2 ml HNO3, 5 ml de-ionised water and the internal standardwere added to the sample. This solution was rinsed into a 100ml quartz-glass flask and theremaining volume was filled with de-ionised water. The resulting solution contained thesample in a dilution 1:1000 in 2 % HNO3 with 20 ppb Rh, Re, In as internal standard. It waskept in polyethylene bottles and measured within two days to minimise the risk ofprecipitation or interchange with the container. For each batch of fifteen samples a blanksolution and a lab-intern or international standard were prepared. All reagents used were threetimes distilled to suppress blank values.
10.1.5.2 Mineral Analysis (LA-ICPMS)To obtain in-situ trace element analysis of single minerals, ICPMS analysis in combinationwith laser ablation technique was applied.The Nd:YAG-laser of type Fisons VG UV-Microprobe is operating at 266 nm wavelength inpulsating mode. Ablated particles from polished mineral surfaces in thick sections aretransported by an argon gas stream into the Fisons VG PlasmaQuad 2+ (with S-option)ICPMS. Trace elements (REE and Ba) of amphibole, plagioclase and biotite were measured inthree samples. Calibration was done against the international standard glass NIST 612. Bawas measured as internal standard but turned out as not suitable. Operating parameters were:large aperture, full energy of 3 mJ, beam frequency 5 Hz, acquisition time 40 sec., uptakedelay 20 sec. Sensitivity is around 5000 cps/ppm for 140Ce, background is at about 10 – 20counts/sec (Simon, pers. comm.). A detailed descriptions of the method can be found inLongerich et al., 1996.

Appendix 114
10.1.6 Isotope Analysis
10.1.6.1 Radiogenic Isotopes (TIMS)Rb-, Sr-, Sm-, Nd- isotope ratios were determined on 24 whole rock samples.Prior to dissolution, the sample powder (~100 mg) has been leached for half an hour at 60°Cin 2.5 N HCl to remove surface alteration and radiogenic 87Sr derived from seawater-interaction during submarine eruption. Leaching experiments with 6 N HCl have been madefor comparison but showed no further improvements. The leaching method is described byAsahara et al. [1995]After rinsing and drying, the leaching residue was dissolved in 6 ml HF:HNO3 (1:1) for 16hours at 110°C within Savillex© vials on a hot plate. The solution was evaporated tocomplete dryness and baked at 180°C. After dissolution of the cake in 1 ml HNO3, followingevaporation, dissolution in 2 ml HCl 6 N, and evaporation for the last time, it was re-dissolvedin 3.2 ml 2.6 N HCl and stored in PE vials. For separation, the sample solution was rinsedwith 2.6 N HCl through columns containing ion-exchange resin BIORAD AG 50W-X8 Resin,200-400 mesh. The strontium rich eluation fraction was caught in a vial, evaporated todryness and stored until measuring.For Nd separation, the REE rich fraction gained from the above separation sequence wasseparated in a second set of columns containing Teflon powder which is impregnated withion-exchanging HDEHP Bis-(2-etylhexyl)-Phosphate. Eluation of Nd was done with 0.18 NHCl, after that eluation of Sm with 0.5 N HCl.For measurement, Sr was dissolved in 0.5 N H3PO4 and mounted on Ta-single filaments (~2µg), Sm and Nd were dissolved in 2 N HCl and mounted on Re-double-filaments (~1 µg).The strontium isotopic ratios were corrected to 86Sr/88Sr=0.1194, according to therecommendations of the IUGS Subcommission. Sr-Standard NBS 987 gave an average valueof 87Sr/86Sr=0.71025±1. Measurement of a single sample was carried on until 2σ 87Sr/86Sr wasless than 2*10-5. Reproducibility (n=105) of 87Sr/86Sr=0.71024±4(1σ). Total proceduralblanks: 2-4 ng.143Nd/144Nd ratios have been corrected for isotope fractionation to 146Nd/144Nd=0.7219. TheNd-standard La Jolla had an ideal value of 143Nd/144Nd=0.51185±1. Measurement of a Ndsample was done until 2σ 143Nd/144Nd was less than 6*10-6. Reproducibility (n=42) of143Nd/144Nd=0.511851±1(1σ). Total procedural blanks: 0.7-1 ng.
For lead isotopic determination about 100 mg rock chips were used for each dissolutionprocess. These chips of about 1 to 2 mm diameter were received by hand-picking from thecrushed rock in order to exclude admixture of altered material. To remove contaminations, thesample was leached in 6 N HCl for ½ hour.Lead separation was done according to the HBr-HCl method (e.g. Chen and Wasserburg,1981) on anion exchange columns containing 100 µl resin (Biorad AG1-X8, 200-400 mesh).The samples were dissolved in 1 ml 2N HCl and washed into the columns, afterwards rinsedwith 2 ml 0.6N HBr and finally eluated with 1ml 6N HCl. To get rid of alkalis and earth-alkalis, the separation process was repeated. The entire processing was carried out within alaminar flow box to exclude contamination by lead which is bound to dust particles. Totalblanks were 50-100 pg. Pb was mounted on Re-single-filaments using 0.5N H3PO4 + silica-gel.Measurements of Sr-, Nd-, Sm-, and Pb-isotopes were carried out on a MAT 262 RPQ+ TIMSin static mode. Ionisation temperature for Pb measurement was held constant at 1180°C.Correction of sample measurements according to multiple measurement of standard NBS 981yielding fractionation factors of 0.451, 0.465, 0.478 *amu-1 (206Pb/204Pb, 207Pb/204Pb,208Pb/204Pb)

Appendix 115
10.1.7 Stable Isotopes (LA-SIRMS)Oxygen isotope measurements were done with the laser probe on mineral separates. Suitableseparates consisted of hand-picked olivine, clinopyroxene, amphibole, or quartz grains of atleast 1 mm size. Measurements were carried out on a SIRMS type Finigan MAT 251 fittedwith a KrF-excimer laser (COMPex, 193nm). With help of the pulsating laser beam themineral separate is vaporised in a stainless steel reaction chamber. The chamber is filled withgaseous fluorine (ClF3) which prevents recombination of released oxygen atoms. Within thepreparation line, oxygen is converted into CO2 which can be measured in the gas source massspectrometer. For a detailed description of this method refer to Wiechert and Hoefs [1995].
10.1.8 40Ar/39Ar Dating (LA-Noble-Gas-MS)Mineral separation:Datable rocks of the suites of interest were selected by checking for datable amphiboles inthin-sections and hand-specimen. In this case, biotites were not suitable for dating since theywere either absent or suspected to be altered. K-feldspar was also not present or not fresh inthe rocks of interest. The pre-crushed material of the selected rocks was repeatedly crushedand sieved to gain the appropriate grain sizes. Depending on the size of the amphiboles,material between 500 and 125 µm was kept. This material, comprising between 2 and 10 kg,was pre-enriched on a Wilfrey-table. Mineral separation was done in a processing sequenceconsisting of gravity precipitation in bromoform and diiodmethane, separation in a magnetic-separator and finally handpicking.
Irradiation:Placed in a vacuum sealed quartz vial, alternating with the biotite standard HD-B1 (K-Ar age24.21 Ma) as irradiation monitor to obtain the J-curve [Dalrymple and Duffield, 1988],irradiation of the samples was done in the FRG-2 GKSS Geesthacht reactor.
Analytical procedure:40Ar/39Ar analysis were carried out at the BGR, Hannover with the laser probe consisting of aFisons VG 3600 mass spectrometer fitted with a 12 W Nd:YAG IR-laser system (BaaselLasertech), a low volume ultra high vacuum inlet line, and a Johnston secondary electronmultiplier. The IR laser ( λ= 1064nm) was operated in continuous mode with a beam diameterof 200 µm. Argon gas was released by total fusion of amphibole separates, and by stepwiseheating with de-focussed laser in one instance. Due to low Ar contents of certain samples itwas necessary to fuse three grains at once. Sample gas purification was achieved by lettingthe gas pass a cold trap (dry ice/alcohol) and two Zr-Al getter elements (350°C, SAES).Analyses of amphibole separates were also done in a conventional step-heating apparatus withresistance furnace. Gas cleaning stage and measurement in the mass spectrometer (VG 1200)are comparable to the above described technique, the only major difference is the argonextraction technique. In a resistance furnace, the sample is degassed in discrete intervals of 30min duration at successively higher temperatures between 600° and 1550°C.
Method:An excellent description of the 40Ar/39Ar method can be found in McDougall and Harrison[1988].Here is only a brief outline of the method:The 40Ar/39Ar technique is a variant of the K-Ar dating method, using the basic equation ingeochronology:
���
� +=NDt 1ln1
λ

Appendix 116
Of principal necessity is the measurement of:40Ar* produced by natural decay of 40K39ArK produced by bombardment of 39K with fast neutrons.
Simultaneous measurement of 36Ar and 37Ar is indispensable to correct for atmospheric andinterfering Ar from K and Ca, respectively.Mineral standards of known age, irradiated together with the samples are used to obtain a J-curve where J is a function of the neutron dose received by the samples. The above equationrearranges to:
Data presentation:Results obtained from the resistance furnace technique are displayed as 40Ar/39Ar releasespectra, where the plateau statistically defines an age. The shape of the release spectrum maysignal argon loss or inheritance (metamorphism/contamination). Simultaneous presentation ofthe Ca/K ratio provides control of the degassing phases.An inverse isochron correlation diagram used for multiple crystal analyses by the laser fusionmethod gives an age by its lower intercept. The upper intercept gives the pure trapped, non-radiogenic component, i.e. initial Ar. Initial Ar values deviating from the atmospheric value of295.5 indicates extraneous Ar, i.e. excess or inherited Ar.A sphenochron is displayed by a wedge shaped distribution of the data in the isotopecorrelation diagram, confined by an upper isochron that corresponds to the eruption age and alower isochron that corresponds to the age of inherited xenocrysts [Chen et al., 1996]. Theintercept of initial 40Ar/36Ar is defined to pass through the atmospheric value.
10.1.9 Electron Microprobe Analysis (EMP)Microprobe analysis is typically applied for quantitative chemical analysis with demand forhigh local resolution as for example for the analysis of single minerals.Here, this method was used mainly to determine the K-content of amphiboles from samplesselected for Ar/Ar dating. (For the dating technique the K-content is as important to know asthe assumed ages to estimate the necessary amount of mineral separate for a successfulprocedure.) Three single grains from each sample were taken from the mineral separateswhich were ready for the dating procedure. The grains were mounted in epoxy resin and thesurface of sample-holder and grains was polished and graphite coated.Measurements were carried out on the newly acquired JEOL 8900 RL under the followingoperating conditions:Acceleration Voltage: 15kV, Probe Current: 12nA, Probe Diameter: 2µm, Take-off Angle:40°, Absorption Correction: φρz; Background Correction: Off-Peak
����
�+=
KArArJt 39
*40
1ln1λ

Appendix 117
sample lithology locality map right high kg
thin-s
XRF
ICP-M
Sr/Nd
Pb
ALT-01 Tholeiite basalt Cerro Irkibi Uniòn 3642-IV 592 975 324 950ALT-02 Tholeiite basalt Cerro Chai Uniòn 3642-IV 592 250 324 540 1 x x x x xALT-03 Tholeiite basalt Cerro Chai Uniòn 3642-IV 592 145 324 400 4.5 x x xALT-04 Tholeiite andesite Cerro Chai Uniòn 3642-IV 592 300 324 115 1.4 x x xALT-05 Tholeiite bas.trachyand. Cerro Bellavista Uniòn 3642-IV 595 510 322 580 1.5 x x xALT-06 Tholeiite trachyandesite Cerro Bellavista Uniòn 3642-IV 595 540 323 420 1.7 x x xALT-07 Tholeiite andesite Cerro Bellavista Uniòn 3642-IV 595 545 323 095ALT-08 Tholeiite andesite Cerro Bellavista Uniòn 3642-IV 595 545 323 095ALT-09 Tholeiite bas.andesite Cerro Bellavista Uniòn 3642-IV 595 490 322 925 1 x x xALT-10 Tholeiite basalt Cerro Bellavista Uniòn 3642-IV 595 465 322 785 1.8 x x xALT-11 Tholeiite bas.andesite Brus Uniòn 3642-IV 594 350 322 570 2.5 x xALT-12 Tholeiite basalt Brus Uniòn 3642-IV 594 350 322 570 3 x x x x xALT-13 Tholeiite basalt Brus Uniòn 3642-IV 594 285 322 510ALT-14 Tholeiite basalt Brus Uniòn 3642-IV 594 285 322 510 3 x x x xALT-15 Tholeiite basalt Brus Uniòn 3642-IV 593 870 322 500 3.6 x x xALT-16 Tholeiite bas.andesite Brus Uniòn 3642-IV 593 870 322 500 3 x x xUVI-19 Tholeiite gabbro Punta Uvita Coronado 3443-II 495 250 342 500 4 x xNUE-76 Tholeiite gabbro Alto Correviento Changuena 3542-IV 540 300 326 620 5.9 x x xNUE-77 Tholeiite gabbro Interamericana Changuena 3542-IV 540 775 325 510INA-82 Tholeiite bas.andesite General Viejo San Isidro 3444-II 503 260 369 190 3 x xINA-83 Tholeiite gabbro Division San Isidro 3444-II 496 725 382 350INA-84 Tholeiite gabbro Alto Macho Mora Cuerici 3444-I 495 800 386 400 2.5 x x x xINA-88 Tholeiite gabbro Int.am. Km 90 Vueltas 3444-IV 490 825 391 225 3.9 x xNUE-92 Tholeiite gabbro Quebr. Boruca Changuena 3542-IV 539 510 325 550 5.3 x x x xDOT-99 Tholeiite basalt San Jeronimo Dota 3344-I 450 650 398 000DOT-102 Tholeiite gabbro San Josecito Dota 3344-I 448 500 397 450CHI-113 Tholeiite bas.andesite Cerro Pyramida Durika 3544-III 519 500 381 075 3 x x x xCHI-117 Tholeiite bas.andesite Cerro Sin Fe San Isidro 3444-II 515 105 377 185 6 x x x x xCHI-118 Tholeiite andesite Fila C.d.l.Maquina San Isidro 3444-II 514 350 377 200
TAL-79 Calc-alkal tonalite Ujarraz Buenos Aires 3543-IV 540 450 354 400 3.3 x x x x xTAL-80 Calc-alkal tonalite Quebr. Tirgra Buenos Aires 3543-IV 541 050 355 900 3 x x xTAL-81 Calc-alkal monzogranite Rio Skra Buenos Aires 3543-IV 539 300 357 040 3.6 x x xINA-67 Calc-alkal dacite Cerro Jaboncillo Vueltas 3444-IV 486 575 394 925 5.3 x x xINA-85 Calc-alkal alkali granite Siberia Cuerici 3444-I 494 825 388 175 5.6 x x x xINA-86 Calc-alkal andesite La Ese San Isidro 3444-II 494 560 375 480INA-87 Calc-alkal andesite Cerr. de la Muerte Vueltas 3444-IV 490 075 390 175 2.5 x x xINA-89 Calc-alkal granite Division-Piedra Cuerici 3444-I 497 175 384 350INA-90 Calc-alkal granite Division-Piedra Cuerici 3444-I 498 950 384 400INA-91 Calc-alkal tonalite Piedra Cuerici 3444-I 499 575 384 300ALT-95 Calc-alkal monzodiorite Sitio Coto Brus Uniòn 3642-IV 599 540 325 725 7.2 x x x xINA-96 Calc-alkal andesite Rivas San Isidro 3444-II 500 900 375 900DOT-97 Calc-alkal alkali granite Copey Vueltas 3444-IV 469 350 400 300 2.5 x x xDOT-98 Calc-alkal monzodiorite Santa Maria Vueltas 3444-IV 469 250 400 525 7 x x xTAL-103 Calc-alkal trachyandesite Rio Lori Siola 3544-II 550 000 366 700 2.5 x x x xTAL-108 Calc-alkal trachyandesite Rio Lori Siola 3544-II 548 750 367 850 4.8 x xTAL-109 Calc-alkal monzonite Rio Lori Siola 3544-II 549 850 367 775 0.5 x x xCHI-110 Calc-alkal diorite Alaska Cuerici 3444-I 500 875 386 200 6.5 x xCHI-111 Calc-alkal diorite San Juan Norte San Isidro 3444-II 500 350 381 750 4.7 x x xCHI-112 Calc-alkal diorite San Juan Norte San Isidro 3444-II 500 390 381 700 4 x xCHI-114 Calc-alkal diorite Cerro Pyramida Durika 3544-III 519 300 381 350CHI-115 Calc-alkal tonalite Cerro Chirripo Durika 3544-III 519 300 381 725 5.5 x x xCHI-116 Calc-alkal tonalite Cerro Uran Cuerici 3444-I 514 625 384 350 4.5 x x x x xCHI-119 Calc-alkal diorite Fila C.d.l.Maquina San Isidro 3444-II 510 485 379 400 4.5 x x xCHI-120 Calc-alkal diorite San Gerardo San Isidro 3444-II 506 650 379 010 3 x x x
NEI-18 Backarc CA-lamprophyr Cerro Bola, Neily Canoas 3641-IV 582 350 286 850 12.2 x x x x xBRI-20 Backarc trachybasalt s. Piedra Grande Amubri 3644-IV 586 200 393 275 5.2 x xBRI-21 Backarc basalt s. Piedra Grande Amubri 3644-IV 586 200 393 275 16.2 x x x x xBRI-22 Backarc basalt Shiroles Amubri 3644-IV 574 100 393 400 xBRI-23 Backarc basalt s. Piedra Grande Amubri 3644-IV 586 200 393 275 16.5 x x x xBRI-24 Backarc trachybasalt s. Piedra Grande Amubri 3644-IV 586 250 393 475 9.8 x x xBRI-25 Backarc bas.trachyand. Piedra Grande Amubri 3644-IV 586 300 393 775 5.6 x x xGUA-26 Backarc teschenite Linda Vista Bonilla 3446-II 583 050 220 990 4.7 x x xGUA-27 Backarc teschenite Bajo Tigre Bonilla 3446-II 585 750 221 825 7 x x x xGUA-28 Backarc teschenite Bajo Tigre Bonilla 3446-II 585 750 221 825 8 x x xGUA-29 Backarc teschenite Bajo Tigre Bonilla 3446-II 585 650 222 800GUA-30 Backarc bas.andesite Bajo Tigre Bonilla 3446-II 585 650 222 800 2 x xGUA-31 Backarc teschenite Bajo Tigre Bonilla 3446-II 585 725 222 700 xGUA-32 Backarc alkali basalt Guayacan Bonilla 3446-II 585 750 225 060GUA-34 Backarc teschenite Petroleo Bonilla 3446-II 582 485 224 075
group

Appendix 118
sample lithology locality map right high kg
thin-s
XRF
ICP-M
Sr/Nd
Pb
GUA-35 Backarc teschenite Petroleo Bonilla 3446-II 582 735 223 250GUA-36 Backarc teschenite Petroleo Bonilla 3446-II 582 760 223 600GUA-37 Backarc alkali basalt Petroleo Bonilla 3446-II 583 045 223 500GUA-38 Backarc teschenite Petroleo Bonilla 3446-II 583 760 223 450 2.6 x xGUA-39 Backarc teschenite Petroleo Bonilla 3446-II 584 700 223 700GUA-40 Backarc alkali basalt Moravia Bonilla 3446-II 585 250 227 860GUA-41 Backarc teschenite Fila Tunel Bonilla 3446-II 579 890 224 960 5 x x xGUA-42 Backarc teschenite Rio Blanco Bonilla 3446-II 578 210 225 750 3 x x x x xGUA-43 Backarc alkali basalt Rio Blanco Bonilla 3446-II 578 400 225 600GUA-44 Backarc teschenite Fila Tunel Bonilla 3446-II 579 890 224 960GUA-45 Backarc alkali basalt Moravia Bonilla 3446-II 585 850 229 000GUA-46 Backarc alkali basalt Moravia Bonilla 3446-II 585 700 228 910GUA-47 Backarc alkali basalt Moravia Bonilla 3446-II 585 380 228 665GUA-49 Backarc alkali basalt Moravia Bonilla 3446-II 585 565 228 230GUA-50 Backarc alkali basalt Rio Siquirres Bonilla 3446-II 585 500 227 550 xGUA-51 Backarc alkali basalt Rio Siquirres Bonilla 3446-II 585 500 227 550
ALT-17 Adakite andesite Alturas Uniòn 3642-IV 591 260 321 950ALT-56 Adakite andesite Cerro Chivo Uniòn 3642-IV 599 840 321 300ALT-57 Adakite andesite Cerro Chivo Uniòn 3642-IV 599 760 321 350ALT-58 Adakite andesite Cerro Chivo Uniòn 3642-IV 599 800 321 500 9 x x xALT-59 Adakite bas.andesite Tajo Cerro Pelon Uniòn 3642-IV 596 690 319 000 7 x xALT-60 Adakite bas.andesite Tajo Cerro Pelon Uniòn 3642-IV 596 690 319 000 4 x x x x xALT-61 Adakite andesite Tajo Cerro Pelon Uniòn 3642-IV 596 745 319 060 3 x xALT-62 Adakite andesite Tajo Cerro Pelon Uniòn 3642-IV 596 585 319 020 16.6 x x x xALT-63 Adakite andesite Fila Coton Uniòn 3642-IV 599 380 320 400 8 x x x x xALT-94 Adakite andesite Tajo Cerro Pelon Uniòn 3642-IV 596 585 319 020VIT-52 Adakite andesite north of San Vito Uniòn 3642-IV 579 300 312 175 2 x x x xVIT-53 Adakite andesite north of San Vito Uniòn 3642-IV 578 595 312 110VIT-54 Adakite bas.andesite San Bosco Canas Gordas 3642-III 580 450 304 500 5 x x x x xVIT-55 Adakite andesite San Bosco Canas Gordas 3642-III 580 450 304 575 14 x x xVIT-93 Adakite andesite San Bosco Canas Gordas 3642-III 580 550 305 100
TAL-104 Adakite dacite northern Dome Siola 3544-II 546 900 368 450 8 x x x x xTAL-105 Adakite dacite southern Dome Siola 3544-II 546 650 367 800 3.5 x x x xTAL-106 Adakite bas.trachyand. southern Dome Siola 3544-II 546 950 367 925 6 x x x xTAL-107 Adakite dacite Rio Lori Siola 3544-II 547 600 367 875 5 x x
PAS-74 Forearc bas.trachyand. Mano de Tigre General 3543-III 540 390 333 380 5.1 x x xPAS-75 Forearc basalt San Antonio General 3543-III 540 895 331 870 2.5 x x x x xPAS-78 Forearc basalt Paso Real Cabagra 3543-II 548 225 328 750 3.2 x x xPEJ-68 Forearc basalt Ojo de Agua General 3543-III 524 650 340 210 6 x x xPEJ-69 Forearc basalt Alto de Agua General 3543-III 524 980 329 440 3.4 x x x x xPEJ-70 Forearc basalt Pejibaye General 3543-III 524 330 341 020 2.9 x x x xPEJ-71 Forearc basalt Pejibaye General 3543-III 524 330 341 020PEJ-72 Forearc basalt Cerro las Bolas General 3543-III 521 080 341 820 3.5 x xPEJ-73 Forearc granite China Kicha Repunta 3443-I 516 300 349 650
GUA-33 active arc basalt Guayacan Bonilla 3446-II 582 900 224 830 3 x x xGUA-48 active arc basalt Moravia Bonilla 3446-II 585 470 228 440 2 x xTUR-64 active arc trachyandesite Rio Reventazon Tucurrique 3445-I 574 825 207 250 5.1 x x xTUR-65 active arc andesite Rio Reventazon Tucurrique 3445-I 574 850 208 550TUR-66 active arc bas.trachyand. Rio Reventazon Tucurrique 3445-I 575 175 208 350 5 x x xTUR-100 active arc andesite Rio Guayabo Tucurrique 3445-I 569 075 217 575 8 x x xTUR-101 active arc bas.andesite Rio Guayabo Tucurrique 3445-I 569 500 217 700 8 x x
group

Appendix 119
Sam
ple
ALT0
2A
LT03
ALT0
4A
LT05
ALT0
6A
LT09
ALT1
0A
LT12
ALT
14A
LT15
ALT
16C
HI1
13CH
I117
SiO
247
.38
50.7
056
.27
59.4
253
.55
53.6
248
.13
48.5
045
.95
50.0
751
.82
53.8
651
.43
TiO
21.
071.
031.
071.
201.
181.
131.
021.
081.
101.
011.
160.
910.
81A
l2O
318
.82
19.4
015
.16
14.7
615
.47
14.8
620
.46
19.4
019
.54
18.7
418
.36
16.8
118
.17
FeO
5.83
6.35
6.65
4.33
6.40
7.09
7.16
4.85
5.84
5.81
5.89
6.64
5.70
Fe2O
35.
122.
853.
754.
903.
934.
583.
355.
845.
994.
183.
992.
774.
56M
nO0.
200.
180.
250.
270.
250.
260.
210.
210.
190.
190.
230.
150.
23M
gO6.
733.
402.
821.
553.
513.
684.
305.
744.
853.
753.
874.
354.
13C
aO9.
0210
.12
7.23
4.51
6.65
9.67
10.3
210
.48
9.63
9.83
8.57
7.74
9.33
Na2
O2.
852.
333.
204.
013.
892.
172.
151.
963.
222.
552.
902.
832.
36K
2O0.
121.
200.
951.
882.
430.
300.
080.
160.
081.
120.
561.
180.
44P2
O5
0.13
0.30
0.35
0.46
0.42
0.27
0.23
0.12
0.07
0.31
0.17
0.19
0.13
LOI
2.11
1.18
1.22
1.50
1.21
1.11
1.20
1.34
2.37
1.30
1.88
1.35
1.56
Sum
99.3
899
.04
98.9
398
.78
98.8
898
.75
98.6
199
.67
98.8
398
.86
99.4
098
.77
98.8
4
FeO
t10
.66
9.05
10.1
88.
9310
.10
11.3
910
.36
10.2
111
.56
9.75
9.66
9.30
10.0
2N
a2O
+K2O
3.04
3.58
4.22
6.02
6.42
2.51
2.27
2.17
3.40
3.74
3.52
4.08
2.86
Mg#
5744
4029
4543
4754
4845
4852
49
LiIC
P12
.14
6.51
5.95
3.58
5.94
1.85
3.44
9.38
12.4
78.
596.
2817
.01
4.70
Be
ICP
0.38
0.88
1.12
1.26
0.89
0.61
0.38
0.37
0.20
1.04
0.42
1.34
0.53
ScIC
P36
.55
19.6
927
.36
22.5
223
.76
28.2
120
.78
23.9
225
.86
25.5
219
.60
34.7
630
.57
VXR
F34
1.00
246.
0016
6.00
16.3
325
1.00
351.
0026
7.00
344.
0039
3.00
273.
0021
6.00
235.
0027
6.00
Cr
XRF
235.
0024
7.00
203.
0079
.00
89.0
015
6.00
236.
0010
1.00
138.
0025
8.00
181.
0031
2.50
237.
50C
oXR
F47
.00
27.0
024
.00
8.67
29.0
031
.00
34.0
029
.67
35.0
029
.00
24.0
027
.00
32.0
0N
iXR
F12
6.00
120.
0097
.00
33.6
745
.00
71.0
012
1.00
49.0
066
.00
137.
0084
.00
142.
5011
6.50
Cu
ICP
46.6
826
0.70
28.3
923
.93
153.
0123
1.29
144.
3111
0.11
130.
4122
0.17
53.8
361
.27
111.
86Zn
XRF
78.0
085
.00
122.
0014
3.00
116.
0012
2.00
76.0
078
.33
68.0
071
.00
83.0
098
.00
86.5
0G
aXR
F17
.00
17.0
017
.00
16.0
015
.00
18.0
015
.00
18.0
017
.00
<516
.00
18.0
016
.50
Rb
ICP
2.25
20.4
313
.70
27.2
748
.06
4.77
1.72
2.30
1.42
17.4
15.
6924
.03
6.50
SrXR
F38
8.00
548.
0042
2.00
431.
3332
2.00
726.
0045
6.00
400.
3338
1.00
588.
0041
5.00
430.
5044
0.00
YIC
P18
.56
27.5
335
.73
59.2
132
.18
27.4
920
.37
18.6
615
.41
25.0
523
.83
24.5
719
.12
ZrXR
F37
.00
99.0
092
.00
150.
6799
.00
67.0
055
.00
42.0
036
.00
75.0
053
.00
81.0
033
.00
Nb
ICP
3.08
7.63
5.69
8.07
5.95
3.32
3.58
1.92
1.30
5.15
3.52
7.11
1.72
Cs
ICP
0.11
0.10
0.10
0.32
0.92
0.05
0.36
0.17
0.14
0.32
0.25
0.22
0.07
Ba
XRF
193.
0050
8.00
698.
0016
06.3
316
07.0
021
7.00
191.
0020
2.67
164.
0070
3.00
416.
0062
0.50
414.
50La
ICP
3.64
13.9
313
.93
21.2
814
.61
10.9
26.
293.
821.
9712
.15
5.33
12.7
83.
86C
e*IC
P9.
7033
.14
32.7
051
.06
34.8
825
.96
16.2
110
.10
5.81
29.2
214
.29
29.0
710
.28
PrIC
P1.
514.
584.
457.
134.
843.
592.
451.
570.
994.
092.
243.
801.
60N
dIC
P7.
8619
.49
20.6
332
.71
22.2
616
.94
11.9
37.
845.
3318
.71
11.5
317
.18
7.76
SmIC
P2.
344.
925.
408.
365.
714.
563.
402.
421.
804.
613.
544.
022.
36Eu
ICP
0.89
1.53
1.66
2.45
1.55
1.42
1.06
0.89
0.69
1.44
1.22
1.32
0.93
Gd
ICP
2.62
4.70
5.52
8.47
5.33
4.53
3.34
2.61
2.08
4.36
3.67
3.77
2.69
TbIC
P0.
450.
740.
901.
330.
830.
710.
540.
450.
360.
700.
620.
630.
48D
yIC
P2.
933.
925.
478.
195.
064.
583.
392.
892.
304.
253.
994.
253.
04H
oIC
P0.
590.
811.
131.
650.
980.
890.
680.
580.
480.
810.
810.
780.
58Er
ICP
1.72
2.50
3.37
4.66
2.91
2.61
2.01
1.78
1.43
2.37
2.39
2.12
1.82
TmIC
P0.
250.
370.
510.
640.
410.
370.
290.
270.
210.
360.
340.
360.
29Yb
ICP
1.73
2.18
3.29
3.95
2.70
2.33
1.83
1.65
1.36
2.33
2.23
2.50
1.85
LuIC
P0.
250.
340.
510.
570.
390.
350.
270.
250.
200.
330.
330.
340.
27H
fIC
P0.
842.
262.
512.
731.
761.
211.
030.
880.
631.
951.
392.
080.
92Ta
ICP
0.42
0.38
0.27
0.48
0.31
0.19
0.29
0.16
0.18
0.36
0.26
0.44
0.15
TlIC
P0.
000.
050.
070.
150.
180.
020.
010.
020.
000.
080.
040.
110.
02Pb
ICP
1.26
14.4
34.
599.
623.
833.
551.
770.
771.
222.
512.
383.
652.
21Th
ICP
0.48
3.29
3.92
1.64
0.96
0.89
0.34
0.15
0.18
2.54
0.30
3.54
0.82
UIC
P0.
080.
770.
881.
020.
600.
530.
270.
100.
040.
620.
170.
880.
21
INA
82IN
A84
NU
E76
NUE
92
51.1
753
.60
47.3
449
.44
0.90
0.80
0.83
0.95
20.0
916
.25
19.7
514
.99
5.75
6.55
5.96
7.60
2.94
3.07
3.58
3.77
0.19
0.19
0.19
0.21
2.95
4.50
3.53
6.45
9.34
8.82
10.6
710
.51
3.19
2.81
2.89
2.47
0.44
1.53
0.68
1.12
0.15
0.20
0.18
0.27
1.46
0.62
3.52
1.33
98.5
698
.92
99.1
199
.11
8.59
9.40
9.53
9.42
3.71
4.38
3.70
3.15
4452
4547
3.88
7.18
7.83
3.22
0.35
0.85
0.36
0.40
17.1
923
.78
21.5
521
.30
188.
0026
9.00
310.
0029
9.00
67.0
063
.00
69.0
033
.50
19.0
031
.00
30.0
028
.00
34.0
030
.00
33.0
016
.00
702.
2216
0.97
244.
2413
8.46
68.0
082
.00
78.0
076
.00
16.0
015
.00
17.0
022
.00
3.86
34.4
79.
144.
7963
1.00
494.
0010
07.0
052
6.00
17.2
424
.31
17.5
016
.09
32.0
010
9.00
27.0
035
.50
1.35
3.21
1.94
1.49
0.03
0.84
0.25
0.02
566.
0074
5.00
563.
0045
8.50
4.56
12.1
26.
384.
8811
.70
27.9
315
.23
12.0
61.
763.
712.
121.
748.
7516
.25
9.84
8.37
2.49
4.11
2.98
2.38
1.01
1.03
1.08
0.87
2.54
3.86
3.00
2.38
0.42
0.60
0.45
0.40
2.65
3.74
2.61
2.47
0.53
0.74
0.54
0.51
1.56
2.22
1.62
1.48
0.22
0.34
0.22
0.22
1.49
2.13
1.45
1.42
0.22
0.31
0.22
0.21
0.85
0.77
0.82
0.86
0.24
0.23
0.61
0.14
0.02
0.11
0.01
0.02
2.56
2.67
2.21
2.72
0.22
2.22
1.17
0.40
0.20
1.38
0.27
0.27

Appendix 120
Sam
ple
ALT
95C
HI1
11C
HI1
15C
HI1
16C
HI1
19CH
I120
DO
T97
DO
T98
INA
67IN
A85
INA
87TA
L79
TAL8
0
SiO
257
.91
55.9
460
.85
60.4
958
.08
57.1
673
.56
57.6
165
.85
74.0
256
.80
59.2
059
.63
TiO
20.
760.
720.
620.
620.
770.
720.
280.
790.
430.
260.
690.
670.
62A
l2O
316
.98
16.6
216
.59
16.4
316
.50
16.7
313
.46
16.2
414
.39
13.2
916
.93
15.6
616
.13
FeO
4.51
4.51
2.97
3.11
3.43
4.33
0.95
4.22
2.36
0.64
5.02
4.44
3.05
Fe2O
32.
283.
813.
313.
233.
623.
311.
003.
331.
371.
292.
262.
303.
47M
nO0.
150.
200.
160.
120.
130.
190.
040.
180.
100.
130.
160.
150.
10M
gO2.
243.
582.
502.
813.
113.
370.
412.
801.
080.
132.
172.
752.
36C
aO5.
947.
655.
656.
066.
897.
160.
996.
043.
150.
216.
485.
605.
00N
a2O
3.38
2.91
3.78
3.19
3.54
3.07
2.96
3.75
4.05
3.12
3.37
3.04
3.21
K2O
3.46
2.43
2.28
1.97
2.12
2.74
5.61
2.93
2.43
5.90
2.16
3.74
3.99
P2O
50.
280.
200.
180.
160.
180.
170.
050.
180.
110.
040.
290.
190.
18LO
I0.
680.
890.
791.
610.
600.
180.
681.
003.
910.
652.
560.
640.
73Su
m98
.55
99.4
699
.68
99.7
899
.40
99.8
299
.98
99.0
799
.22
99.6
798
.87
98.3
998
.47
FeO
t6.
678.
016.
006.
117.
337.
671.
867.
323.
761.
827.
286.
636.
29N
a2O
+K2O
6.96
5.39
6.10
5.23
5.69
5.82
8.62
6.78
6.78
9.10
5.70
6.90
7.34
Mg#
4550
5052
4748
3648
4216
4251
48
LiIC
P14
.10
3.86
12.6
26.
514.
568.
266.
093.
931.
712.
591.
6918
.61
7.17
Be
ICP
1.77
0.82
1.09
0.91
0.88
0.87
1.47
1.20
1.06
1.90
0.97
1.38
1.19
ScIC
P14
.95
19.5
114
.39
15.6
020
.00
19.2
33.
9919
.27
7.90
4.19
14.2
816
.54
15.5
9V
XRF
128.
5021
4.00
145.
0016
5.00
201.
5021
1.50
25.0
020
0.00
59.6
016
.00
133.
0014
9.00
140.
00C
rXR
F69
.00
91.0
010
5.50
59.0
060
.00
41.0
011
8.00
46.0
069
.00
113.
0057
.50
77.0
057
.00
Co
XRF
17.0
028
.00
18.0
015
.50
18.5
023
.50
3.14
23.0
08.
601.
8721
.00
21.0
011
.00
Ni
XRF
29.5
048
.00
50.0
027
.50
29.0
019
.00
42.0
019
.00
26.2
041
.00
30.5
029
.00
24.0
0C
uIC
P65
.42
143.
1359
.64
18.2
525
7.54
125.
9912
.77
111.
1739
.73
7.14
74.4
696
.36
74.6
8Zn
XRF
60.0
096
.00
106.
5040
.00
51.5
010
4.00
23.0
058
.00
51.4
050
.00
90.5
096
.00
43.0
0G
aXR
F16
.00
17.0
020
.50
24.0
015
.50
16.5
023
.00
13.0
013
.40
12.0
016
.00
15.0
015
.00
Rb
ICP
109.
7154
.42
44.4
738
.06
43.6
466
.92
125.
5356
.84
82.1
414
1.60
34.7
610
4.53
150.
56Sr
XRF
496.
5053
0.00
623.
5066
2.50
601.
0055
5.00
165.
0050
3.00
280.
4083
.00
771.
5039
7.00
396.
00Y
ICP
42.8
122
.41
20.1
317
.68
22.6
221
.69
19.0
125
.35
28.2
638
.97
28.2
729
.05
23.9
8Zr
XRF
212.
0012
1.00
97.0
075
.50
138.
0020
6.00
149.
0015
1.00
184.
6027
5.00
117.
5019
8.00
263.
00N
bIC
P15
.34
5.49
4.78
4.89
5.65
6.70
13.9
17.
426.
4112
.90
4.83
9.47
8.75
Cs
ICP
2.52
1.44
1.28
0.64
0.71
2.17
1.77
0.55
2.92
0.77
3.96
3.51
1.13
Ba
XRF
1234
.00
1280
.00
1328
.50
1171
.50
1123
.00
1045
.50
713.
0019
69.0
018
06.4
010
26.0
013
14.5
013
24.0
013
21.0
0La
ICP
27.7
117
.32
15.3
416
.40
15.9
017
.91
19.1
414
.65
14.8
327
.12
15.4
823
.29
17.2
5C
e*IC
P64
.10
38.1
433
.79
35.6
135
.38
39.1
840
.84
32.9
833
.47
59.7
636
.04
51.2
338
.50
PrIC
P8.
564.
774.
224.
364.
494.
854.
874.
254.
337.
484.
856.
394.
91N
dIC
P35
.12
19.5
117
.48
17.7
918
.61
19.3
717
.72
17.8
117
.71
28.7
820
.63
25.3
719
.59
SmIC
P7.
974.
333.
793.
804.
344.
313.
404.
204.
146.
185.
065.
534.
39Eu
ICP
1.46
1.12
1.07
1.06
1.17
1.06
0.57
1.30
0.97
0.63
1.38
1.20
1.06
Gd
ICP
6.88
3.89
3.41
3.30
3.79
3.71
2.86
3.89
3.78
5.47
4.55
4.88
3.89
TbIC
P1.
050.
590.
520.
470.
560.
550.
430.
610.
630.
860.
700.
750.
59D
yIC
P6.
223.
452.
982.
753.
473.
322.
523.
793.
875.
094.
184.
293.
56H
oIC
P1.
240.
680.
590.
520.
680.
660.
520.
740.
811.
040.
850.
860.
69Er
ICP
3.78
1.97
1.73
1.53
1.99
1.93
1.61
2.22
2.58
3.25
2.55
2.60
2.06
TmIC
P0.
580.
280.
260.
220.
280.
280.
260.
340.
410.
510.
370.
390.
31Yb
ICP
3.78
1.83
1.66
1.37
1.84
1.83
1.66
2.19
2.74
3.25
2.47
2.46
2.02
LuIC
P0.
540.
270.
240.
190.
270.
270.
250.
330.
420.
460.
370.
360.
29H
fIC
P0.
780.
400.
300.
430.
530.
730.
780.
814.
902.
093.
110.
770.
87Ta
ICP
0.81
0.33
0.28
0.28
0.38
0.39
1.03
0.41
0.45
0.82
0.33
0.57
0.51
TlIC
P0.
380.
230.
090.
150.
150.
270.
430.
170.
420.
470.
130.
340.
27Pb
ICP
6.06
11.0
37.
163.
764.
498.
517.
244.
827.
928.
586.
817.
676.
60Th
ICP
6.04
2.62
1.90
2.07
2.35
2.58
9.50
2.93
3.25
7.83
2.04
4.19
3.74
UIC
P2.
781.
410.
800.
801.
111.
433.
951.
462.
522.
981.
542.
201.
87
BRI2
1B
RI2
3B
RI24
47.2
947
.18
46.3
51.
441.
581.
7316
.14
16.4
816
.89
6.57
5.79
6.36
3.10
3.99
3.05
0.17
0.17
0.16
6.32
6.37
5.42
9.86
10.1
210
.03
2.97
2.79
3.06
1.85
1.84
1.83
0.65
0.80
0.74
1.89
1.85
2.45
98.2
698
.94
98.0
9
9.64
9.59
9.52
4.97
4.74
5.06
5959
56
9.03
4.20
8.86
2.30
2.32
2.20
22.8
720
.23
13.4
126
1.40
247.
0026
1.00
166.
2019
0.00
80.0
038
.40
34.0
033
.50
74.4
089
.00
61.0
076
.10
103.
0311
1.70
81.6
088
.00
96.5
017
.20
18.0
018
.50
42.5
242
.66
34.7
998
8.00
1101
.00
1195
.00
25.3
425
.78
24.6
816
6.00
174.
5018
1.50
34.7
930
.03
13.8
00.
392.
830.
5668
0.20
663.
5080
9.50
47.1
947
.48
48.3
510
0.37
101.
4310
2.39
11.9
212
.12
12.0
745
.20
47.2
646
.58
8.45
8.58
8.61
2.42
2.43
2.56
6.66
6.98
6.98
0.89
0.89
0.91
4.51
4.54
4.55
0.80
0.78
0.81
2.19
2.16
2.21
0.30
0.29
0.29
1.88
1.75
1.81
0.27
0.25
0.25
3.63
3.58
3.80
1.64
1.77
0.42
0.04
0.02
0.09
3.57
6.51
3.49
13.3
34.
359.
452.
442.
081.
78
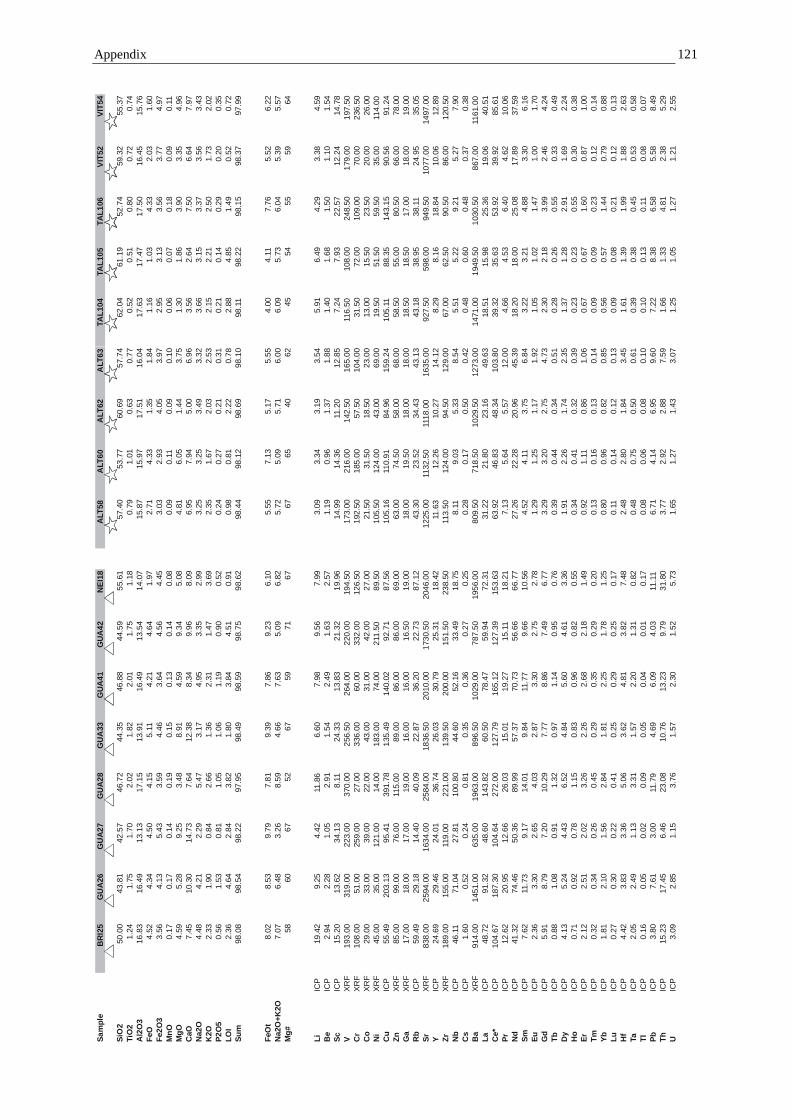
Appendix 121
Sam
ple
BRI
25G
UA
26G
UA2
7G
UA
28G
UA
33G
UA41
GUA
42N
EI18
ALT
58A
LT60
ALT
62A
LT63
SiO
250
.00
43.8
142
.57
46.7
244
.35
46.8
844
.59
55.6
157
.40
53.7
760
.69
57.7
4Ti
O2
1.24
1.75
1.70
2.02
1.82
2.01
1.75
1.18
0.79
1.01
0.63
0.77
Al2
O3
16.8
316
.49
13.1
317
.15
13.9
116
.49
13.5
414
.07
15.8
715
.97
17.5
116
.04
FeO
4.52
4.34
4.50
4.15
5.11
4.21
4.64
1.97
2.71
4.33
1.35
1.84
Fe2O
33.
564.
135.
433.
594.
463.
644.
564.
453.
032.
934.
053.
97M
nO0.
170.
170.
140.
190.
150.
130.
140.
080.
090.
110.
090.
10M
gO4.
595.
289.
253.
488.
914.
599.
345.
084.
816.
051.
443.
75C
aO7.
4510
.30
14.7
37.
6412
.38
8.34
9.96
8.09
6.95
7.94
5.00
6.96
Na2
O4.
484.
212.
295.
473.
174.
953.
352.
993.
253.
253.
493.
32K
2O2.
331.
900.
842.
661.
362.
311.
473.
692.
351.
672.
032.
53P2
O5
0.56
1.53
0.81
1.05
1.06
1.19
0.90
0.52
0.24
0.27
0.21
0.31
LOI
2.36
4.64
2.84
3.82
1.80
3.84
4.51
0.91
0.98
0.81
2.22
0.78
Sum
98.0
898
.54
98.2
297
.95
98.4
998
.59
98.7
598
.62
98.4
498
.12
98.6
998
.10
FeO
t8.
028.
539.
797.
819.
397.
869.
236.
105.
557.
135.
175.
55N
a2O
+K2O
7.07
6.48
3.26
8.59
4.66
7.63
5.09
6.82
5.72
5.09
5.71
6.00
Mg#
5860
6752
6759
7167
6765
4062
LiIC
P19
.42
9.25
4.42
11.8
66.
607.
989.
567.
993.
093.
343.
193.
54B
eIC
P2.
942.
281.
052.
911.
542.
491.
632.
571.
190.
961.
371.
88Sc
ICP
15.2
013
.62
34.1
38.
1124
.33
13.8
321
.32
19.9
614
.99
14.3
611
.20
12.8
5V
XRF
193.
0031
9.00
223.
0037
0.00
256.
5026
4.00
220.
0019
4.50
173.
0021
6.00
142.
5016
5.00
Cr
XRF
108.
0051
.00
259.
0027
.00
336.
0060
.00
332.
0012
6.50
192.
5018
5.00
57.5
010
4.00
Co
XRF
29.0
033
.00
39.0
022
.00
43.0
031
.00
42.0
027
.00
21.5
031
.50
18.5
023
.00
Ni
XRF
45.0
035
.00
121.
0014
.00
183.
0074
.00
211.
5089
.50
105.
5012
4.00
43.0
069
.00
Cu
ICP
55.4
920
3.13
95.4
139
1.78
135.
4914
0.02
92.7
187
.56
105.
1611
0.91
84.9
615
9.24
ZnXR
F85
.00
99.0
076
.00
115.
0089
.00
86.0
086
.00
69.0
063
.00
74.5
058
.00
68.0
0G
aXR
F17
.00
18.0
017
.00
19.0
016
.00
16.0
016
.50
19.0
018
.00
19.5
018
.00
18.0
0R
bIC
P59
.49
29.1
814
.40
40.0
922
.87
36.2
022
.73
87.1
243
.30
23.5
234
.43
43.1
3Sr
XRF
838.
0025
94.0
016
34.0
025
84.0
018
36.5
020
10.0
017
30.5
020
46.0
012
25.0
011
32.5
011
18.0
016
35.0
0Y
ICP
24.6
929
.46
24.0
136
.74
26.0
330
.79
25.3
118
.42
11.6
312
.26
10.2
714
.12
ZrXR
F18
9.00
155.
0011
9.00
221.
0013
9.50
200.
0015
1.50
238.
5011
3.50
124.
0094
.50
129.
00N
bIC
P46
.11
71.0
427
.81
100.
8044
.60
52.1
633
.49
18.7
58.
119.
035.
338.
54C
sIC
P1.
600.
520.
240.
810.
350.
360.
270.
250.
280.
170.
500.
42B
aXR
F91
4.00
1451
.00
635.
0019
63.0
089
6.50
1029
.00
787.
5019
56.0
080
9.50
718.
5010
29.5
012
73.0
0La
ICP
48.7
291
.32
48.6
014
3.82
60.5
078
.47
59.9
472
.31
31.2
221
.80
23.1
649
.63
Ce*
ICP
104.
6718
7.30
104.
6427
2.00
127.
7916
5.12
127.
3915
3.63
63.9
246
.83
48.3
410
3.80
PrIC
P12
.62
20.9
512
.66
26.0
315
.01
19.2
715
.11
18.2
17.
135.
645.
5712
.00
Nd
ICP
41.3
274
.46
50.3
689
.99
57.3
770
.73
56.6
666
.77
27.2
622
.28
20.9
645
.39
SmIC
P7.
6211
.73
9.17
14.0
19.
8411
.77
9.66
10.5
64.
524.
113.
756.
84Eu
ICP
2.36
3.30
2.65
4.03
2.87
3.30
2.75
2.78
1.29
1.25
1.17
1.92
Gd
ICP
5.91
8.79
7.20
10.2
97.
778.
867.
496.
773.
293.
202.
754.
73Tb
ICP
0.88
1.08
0.91
1.32
0.97
1.14
0.95
0.76
0.39
0.44
0.34
0.51
Dy
ICP
4.13
5.24
4.43
6.52
4.84
5.60
4.61
3.36
1.91
2.26
1.74
2.35
Ho
ICP
0.71
0.92
0.78
1.15
0.83
0.96
0.82
0.55
0.34
0.41
0.32
0.39
ErIC
P2.
122.
512.
023.
262.
262.
682.
181.
490.
921.
110.
861.
06Tm
ICP
0.32
0.34
0.26
0.45
0.29
0.35
0.29
0.20
0.13
0.16
0.13
0.14
YbIC
P1.
812.
101.
562.
841.
812.
251.
781.
250.
800.
960.
820.
85Lu
ICP
0.27
0.30
0.22
0.41
0.25
0.29
0.25
0.17
0.11
0.14
0.12
0.13
Hf
ICP
4.42
3.83
3.36
5.06
3.62
4.81
3.82
7.48
2.48
2.80
1.84
3.45
TaIC
P2.
052.
491.
133.
311.
572.
201.
310.
820.
480.
750.
500.
61Tl
ICP
0.16
0.05
0.02
0.09
0.05
0.04
0.01
0.17
0.08
0.06
0.08
0.10
PbIC
P3.
807.
613.
0011
.79
4.69
6.09
4.03
11.1
16.
714.
146.
959.
60Th
ICP
15.2
317
.45
6.46
23.0
810
.76
13.2
39.
7931
.80
3.77
2.92
2.88
7.59
UIC
P3.
092.
851.
153.
761.
572.
301.
525.
731.
651.
271.
433.
07
TAL1
04TA
L105
TAL1
06VI
T52
VIT5
4
62.0
461
.19
52.7
459
.32
55.3
70.
520.
510.
800.
720.
7417
.63
17.4
717
.50
16.4
515
.76
1.16
1.03
4.33
2.03
1.60
2.95
3.13
3.56
3.77
4.97
0.06
0.07
0.18
0.09
0.11
1.30
1.86
3.90
3.35
4.96
3.56
2.64
7.50
6.64
7.97
3.66
3.15
3.37
3.56
3.43
2.15
2.21
2.50
1.73
2.02
0.21
0.14
0.29
0.20
0.35
2.88
4.85
1.49
0.52
0.72
98.1
198
.22
98.1
598
.37
97.9
9
4.00
4.11
7.76
5.52
6.22
6.09
5.73
6.04
5.39
5.57
4554
5559
64
5.91
6.49
4.29
3.38
4.59
1.40
1.68
1.50
1.10
1.54
7.24
7.93
22.5
712
.24
14.7
811
6.50
108.
0024
8.50
179.
0019
7.50
31.5
072
.00
109.
0070
.00
236.
5013
.00
15.5
023
.50
20.0
026
.00
19.5
051
.50
59.5
035
.00
114.
0010
5.11
88.3
514
3.15
90.5
691
.24
58.5
055
.00
80.5
066
.00
78.0
018
.50
18.5
017
.00
18.0
019
.00
43.1
838
.95
38.1
124
.95
35.0
592
7.50
598.
0094
9.50
1077
.00
1497
.00
8.29
8.16
18.8
410
.06
12.8
967
.00
62.5
090
.50
86.0
012
0.50
5.51
5.22
9.21
5.27
7.90
0.48
0.60
0.48
0.37
0.38
1471
.00
1949
.50
1030
.50
867.
0011
61.0
018
.51
15.9
825
.36
19.0
640
.51
39.3
235
.63
53.9
239
.92
85.6
14.
664.
536.
404.
6210
.06
18.2
018
.00
25.0
817
.89
37.5
93.
223.
214.
883.
306.
161.
051.
021.
471.
001.
702.
302.
183.
992.
464.
240.
280.
260.
550.
330.
491.
371.
282.
911.
692.
240.
230.
230.
550.
300.
380.
670.
671.
600.
871.
000.
090.
090.
230.
120.
140.
560.
571.
440.
790.
880.
090.
080.
210.
120.
131.
611.
391.
991.
882.
630.
390.
380.
450.
530.
580.
100.
130.
110.
080.
077.
228.
386.
585.
588.
491.
661.
334.
812.
385.
291.
251.
051.
271.
212.
55

Appendix 122
Sam
ple
VIT5
5PA
S74
PAS7
5PA
S78
PEJ6
8PE
J69
PEJ7
0TA
L103
TAL1
09TU
R100
TUR6
4TU
R66
SiO
258
.48
55.7
948
.30
50.3
249
.99
51.7
751
.08
55.5
654
.05
58.5
255
.46
55.4
1Ti
O2
0.76
0.73
0.86
0.67
0.99
1.05
1.01
0.56
0.69
1.14
1.10
1.07
Al2O
316
.97
17.5
020
.69
18.6
117
.46
17.3
717
.84
20.3
418
.09
15.7
117
.27
17.0
6Fe
O1.
113.
725.
834.
965.
835.
635.
402.
473.
684.
023.
244.
46Fe
2O3
4.69
3.45
3.83
3.95
3.60
4.10
3.96
1.95
3.10
2.12
3.95
2.50
MnO
0.10
0.14
0.19
0.17
0.18
0.25
0.18
0.10
0.16
0.10
0.11
0.12
MgO
2.59
3.26
3.94
4.46
4.94
4.78
5.05
1.42
2.73
4.07
3.25
3.95
CaO
6.04
6.99
10.9
19.
638.
908.
479.
096.
386.
176.
336.
447.
06Na
2O3.
423.
432.
532.
612.
722.
862.
783.
733.
263.
793.
693.
52K2
O2.
652.
440.
571.
061.
681.
881.
724.
114.
122.
202.
352.
47P2
O5
0.30
0.35
0.15
0.25
0.41
0.45
0.41
0.33
0.41
0.49
0.42
0.41
LOI
1.21
0.77
1.45
1.82
1.36
0.10
0.52
0.98
2.20
0.35
1.16
0.89
Sum
98.2
998
.58
99.2
598
.52
98.0
699
.90
99.4
897
.91
98.6
798
.85
98.4
498
.91
FeO
t5.
486.
9511
.15
8.76
9.72
9.91
9.32
4.35
6.68
5.99
6.96
6.81
Na2O
+K2O
6.24
5.98
3.64
3.78
4.73
4.75
4.52
8.06
7.62
6.06
6.19
6.08
Mg#
5353
5552
4950
5345
5162
5458
LiIC
P3.
818.
5910
.49
2.34
6.08
3.13
7.51
5.63
3.74
4.55
5.46
8.02
BeIC
P2.
201.
470.
580.
771.
141.
441.
403.
863.
091.
341.
431.
39Sc
ICP
12.6
815
.50
32.3
821
.95
21.3
522
.56
23.3
79.
5414
.00
11.9
616
.10
17.6
5V
XRF
166.
0020
1.00
346.
0026
0.00
273.
0029
6.50
273.
0099
.00
178.
0014
0.00
190.
0019
6.00
CrXR
F56
.50
194.
0014
3.00
83.0
062
.00
84.5
089
.00
102.
0056
.00
190.
0075
.00
110.
00Co
XRF
18.5
022
.00
43.0
035
.00
27.0
033
.50
32.0
010
.50
20.0
020
.00
23.0
023
.00
NiXR
F44
.00
84.0
062
.00
41.0
040
.00
51.0
041
.00
44.5
019
.00
92.0
035
.00
56.0
0Cu
ICP
137.
2213
2.73
239.
0514
8.74
270.
7429
4.79
267.
0665
.15
173.
2561
.04
119.
3615
8.49
ZnXR
F66
.00
79.0
099
.00
75.0
010
0.00
105.
5091
.00
61.0
089
.00
76.0
077
.00
79.0
0G
aXR
F21
.00
17.0
016
.00
17.0
017
.00
16.5
015
.00
17.5
017
.00
17.0
019
.00
18.0
0Rb
ICP
45.0
145
.20
19.7
318
.05
42.5
037
.30
36.3
386
.56
99.0
752
.23
59.4
559
.71
SrXR
F15
20.5
011
03.0
056
5.00
848.
0099
0.00
927.
5097
5.00
1751
.00
1252
.00
822.
0086
1.00
878.
00Y
ICP
18.0
221
.47
23.3
414
.72
24.0
626
.10
23.7
019
.12
19.3
219
.45
21.4
220
.43
ZrXR
F13
4.50
93.0
067
.00
47.0
093
.00
105.
5077
.00
155.
0018
4.00
214.
0019
9.00
197.
00Nb
ICP
8.19
11.3
93.
953.
396.
016.
336.
6418
.94
15.4
630
.61
19.7
924
.51
CsIC
P0.
440.
330.
670.
261.
221.
000.
550.
420.
700.
530.
810.
75Ba
XRF
1471
.50
1107
.00
834.
0070
5.00
1229
.00
1200
.50
1038
.00
1482
.50
1242
.00
957.
0010
23.0
096
4.00
LaIC
P66
.41
29.1
110
.15
16.2
825
.78
27.1
524
.47
47.9
745
.36
48.1
544
.46
42.1
7Ce
*IC
P13
8.27
61.4
123
.58
36.1
156
.41
59.7
354
.33
98.9
096
.05
100.
3094
.28
84.7
5Pr
ICP
15.8
77.
203.
174.
566.
997.
466.
7811
.16
11.3
311
.52
11.1
49.
15Nd
ICP
60.4
727
.99
14.5
719
.23
29.4
330
.58
28.0
840
.70
41.9
742
.31
41.1
437
.61
SmIC
P9.
325.
333.
904.
076.
206.
375.
796.
957.
887.
137.
186.
76Eu
ICP
2.44
1.59
1.26
1.20
1.66
1.75
1.71
2.04
1.88
1.85
1.76
1.63
Gd
ICP
6.45
4.29
3.92
3.23
4.92
5.33
4.93
5.13
5.59
5.29
5.33
5.09
TbIC
P0.
670.
580.
580.
450.
690.
750.
690.
640.
680.
670.
690.
61Dy
ICP
2.92
3.03
3.47
2.49
3.87
4.17
3.78
3.16
3.33
3.40
3.62
3.43
HoIC
P0.
470.
580.
720.
460.
730.
800.
720.
550.
560.
590.
650.
67Er
ICP
1.32
1.70
2.24
1.32
2.13
2.30
2.09
1.55
1.55
1.60
1.85
1.80
TmIC
P0.
170.
250.
300.
180.
310.
330.
300.
230.
200.
220.
250.
23Yb
ICP
1.00
1.65
1.99
1.17
1.95
2.10
1.92
1.46
1.29
1.39
1.64
1.68
LuIC
P0.
150.
260.
310.
180.
290.
310.
290.
220.
180.
200.
240.
26Hf
ICP
3.37
2.38
1.24
1.32
2.19
2.31
2.02
3.67
1.36
4.43
4.46
3.90
TaIC
P0.
580.
570.
340.
280.
340.
340.
380.
890.
701.
711.
061.
20Tl
ICP
0.18
0.06
0.02
0.05
0.06
0.07
0.05
0.13
0.29
0.11
0.10
0.08
PbIC
P12
.05
4.97
3.45
4.09
8.87
7.74
7.47
10.8
814
.15
6.15
7.36
6.34
ThIC
P9.
097.
642.
341.
132.
452.
935.
1316
.65
7.76
5.60
6.73
18.1
1U
ICP
3.22
1.42
0.56
0.67
1.46
1.58
1.32
5.07
3.54
3.24
3.70
3.21

Appendix 123
Sam
ple
Rb
SrSm
NdPb
nam
e87
Sr/86
Srul
2σ(p
pm)
(ppm
)87
Sr/86
Sri
143 N
d/14
4 Nd
2σ(p
pm)
(ppm
)14
3 Nd/14
4 Ndi
εNd
(ppm
)20
6 Pb/20
4 Pb20
7 Pb/20
4 Pb20
8 Pb/20
4 Pb
ALT
-02
0.70
380
6.0E
-06
338
80.
7037
81.
318
.734
15.5
4738
.411
ALT
-12
0.70
373
1.1E
-05
340
00.
7036
00.
5129
994.
9E-0
63
80.
5129
997.
100.
818
.751
15.5
4638
.420
ALT
-14
0.70
369
1.9E
-05
238
10.
7036
50.
5130
276.
0E-0
62
60.
5130
277.
65C
HI-1
130.
7042
91.
4E-0
525
431
0.70
415
0.51
3012
2.9E
-06
418
0.51
3004
7.36
CH
I-117
0.70
382
2.3E
-05
744
00.
7037
90.
5130
325.
0E-0
63
90.
5130
227.
702.
618
.789
15.5
4238
.442
INA
-84
0.70
390
2.0E
-05
5149
40.
7038
40.
5130
459.
4E-0
64
170.
5130
368.
01N
UE-
920.
7038
31.
6E-0
524
565
0.70
380
0.51
3015
5.0E
-06
415
0.51
3002
7.43
ALT
-95
0.70
389
1.5E
-05
160
497
0.70
377
0.51
3019
5.4E
-06
836
0.51
3010
7.50
CH
I-116
0.70
390
4.9E
-06
5566
30.
7038
50.
5130
134.
7E-0
64
180.
5130
057.
403.
718
.899
15.5
6038
.593
INA
-85
0.70
473
2.1E
-05
202
830.
7039
90.
5130
425.
8E-0
67
300.
5130
347.
97TA
L-79
0.70
390
1.1E
-05
154
397
0.70
376
0.51
3025
5.5E
-06
626
0.51
3017
7.64
7.4
18.7
4515
.520
38.3
28
BR
I-21
0.70
363
1.2E
-05
4798
80.
7035
40.
5129
672.
9E-0
69
480.
5129
676.
543.
719
.12
15.5
4838
.725
BR
I-23
0.70
381
1.1E
-05
6311
010.
7035
60.
5129
775.
4E-0
69
480.
5129
776.
75G
UA-2
70.
7036
71.
4E-0
521
1634
0.70
366
0.51
3022
1.2E
-05
1054
0.51
3022
7.61
GUA
-42
0.70
379
8.3E
-06
2717
310.
7036
20.
5129
826.
4E-0
611
630.
5129
826.
834.
519
.058
15.5
5538
.692
NEI
-18
0.70
341
1.5E
-05
110
2046
0.70
332
0.51
2953
5.0E
-06
1273
0.51
2953
6.14
12.2
19.3
3515
.578
38.9
81
ALT
-60
0.70
352
1.5E
-05
3511
330.
7034
70.
5129
885.
4E-0
65
230.
5129
886.
904.
219
.137
15.5
9438
.852
ALT
-62
0.70
354
1.0E
-05
5111
180.
7035
20.
5129
884.
4E-0
64
220.
5129
886.
89A
LT-6
30.
7034
02.
0E-0
564
1635
0.70
338
0.51
2979
5.2E
-06
746
0.51
2979
6.72
9.6
19.2
4515
.600
38.9
71TA
L-10
30.
7037
91.
7E-0
587
1751
0.70
377
0.51
3000
9.0E
-06
741
0.51
2995
7.16
TAL-
104
0.70
371
1.4E
-05
6392
80.
7036
40.
5129
906.
3E-0
64
190.
5129
906.
927.
019
.085
15.5
5538
.731
TAL-
105
0.70
370
1.8E
-05
5659
80.
7036
70.
5129
956.
9E-0
64
180.
5129
957.
02TA
L-10
60.
7037
01.
6E-0
538
950
0.70
368
0.51
2976
3.2E
-06
525
0.51
2970
6.69
VIT-
520.
7035
61.
8E-0
536
1077
0.70
355
0.51
2985
6.3E
-06
419
0.51
2985
6.84
VIT-
540.
7035
71.
3E-0
551
1497
0.70
357
0.51
2987
5.7E
-06
739
0.51
2987
6.87
8.4
19.1
7415
.552
38.7
81
PAS-
750.
7037
81.
6E-0
57
526
0.70
376
0.51
3034
6.1E
-06
39
0.51
3029
7.75
2.6
18.8
5915
.584
38.6
15PE
J-69
0.51
2998
3.7E
-06
631
0.51
2994
7.06
18.8
5215
.730
38.5
83PE
J-70
0.70
428
1.9E
-05
4997
50.
7036
80.
5130
339.
2E-0
66
290.
5130
287.
747.
2
subs
crip
t ul i
ndic
ates
unl
each
ed v
alue
ssu
bscr
ipt i
indi
cate
s in
itial
val
ues

Appendix 124
δ 18
O O
lδ
18O
Px
δ 18
O A
mph
Sam
ple
δ 18
O O
lδ
18O
Ol
δ 18
O O
lm
ean
δ 18
O P
xδ
18O
Px
mea
nδ
18O
Am
phδ
18O
Am
phδ
18O
Am
phδ
18O
Am
phm
ean
δ 18
O O
l cal
cδ
18O
WR
calc
ALT-
026.
886.
636.
766.
366.
86AL
T-12
5.8
5.80
5.40
5.90
CH
I-117
5.94
5.94
5.54
6.04
PEJ-
695.
795.
795.
796.
29BR
I-21
5.14
4.79
5.25
5.06
5.69
5.69
5.06
5.56
GU
A-27
5.06
5.06
5.06
5.56
GU
A-42
5.01
5.2
5.11
5.69
5.69
5.11
5.61
ALT-
627.
116.
846.
986.
687.
18AL
T-63
5.94
7.07
7.16
6.09
6.57
6.27
6.77
TAL-
104
5.99
7.6
7.5
7.03
6.73
7.23
NEI
-18
5.58
5.58
5.28
5.78
" δ 18
O O
l cal
c" a
nd "δ
18O
WR c
alc"
is c
alcu
late
d fro
m th
e m
easu
red
valu
es a
nd th
e ap
prop
riate
min
eral
-min
eral
and
min
eral
-who
le ro
ck fr
actio
natio
n co
effic
ient
saf
ter B
ottin
ga &
Jav
oy [1
975]
; Chi
ba e
t al.
[198
9]

Appendix 125
CO
RR
. IN
TEN
SITI
ES (e
rrors
: 2SD
/abs
.)R
ESU
LTS
(err
ors:
2SD
/abs
.)
Sam
ple
40A
r*+/
-39
Ar
+/-
37A
r+/
-40
K/ 4
0Ar
+/-
36/ 4
0Ar
+/-
37A
r 39A
r+/
-R
/ R+A
+/-
Dat
e M
aA
MPH
"A
LT"
- -
- Sam
ple
ALT-
16 -
- -
ALT
001
19.9
30.
272.
530.
0344
.56
0.20
17.6
20.
222.
58E-
032.
2E-0
417
.62
0.22
23.7
55.
8118
.33
ALT
002
87.5
80.
3412
.32
0.04
229.
750.
2918
.65
0.06
1.93
E-03
1.0E
-04
18.6
50.
0642
.97
2.49
16.5
4A
LT00
310
1.27
0.93
13.4
40.
0625
8.38
0.54
19.2
30.
102.
76E-
037.
2E-0
519
.23
0.10
18.5
81.
3317
.53
ALT
004
71.7
90.
269.
120.
0516
8.64
0.21
18.4
90.
112.
14E-
038.
6E-0
518
.49
0.11
36.6
81.
9318
.30
ALT
005
86.9
60.
3810
.81
0.04
199.
040.
3118
.41
0.08
2.03
E-03
9.2E
-05
18.4
10.
0840
.06
2.20
18.7
0A
LT00
654
.81
0.26
7.32
0.04
133.
960.
2718
.29
0.10
2.04
E-03
1.3E
-04
18.2
90.
1039
.62
3.32
17.4
0A
LT00
762
.39
0.27
9.09
0.06
170.
690.
3718
.77
0.12
1.94
E-03
1.6E
-04
18.7
70.
1242
.67
4.26
15.9
6A
LT00
880
.43
0.45
11.6
60.
0421
7.18
0.53
18.6
30.
082.
05E-
038.
5E-0
518
.63
0.08
39.4
11.
9216
.05
ALT
009
107.
040.
5613
.57
0.03
258.
200.
3419
.02
0.05
2.06
E-03
7.5E
-05
19.0
20.
0539
.07
1.66
18.3
4
To
tal-G
as67
2.19
1.39
89.8
70.
1316
80.4
01.
0818
.70
0.03
2.25
E-03
5.3E
-05
18.7
00.
0333
.47
0.76
17.4
0W
eigh
t. M
EAN
17.3
6M
EAN
± 1
SD18
.57
0.46
35.8
78.
6417
.46
Min
imum
17.6
218
.58
15.9
6M
axim
um19
.23
42.9
718
.70
AM
PH
"GUA
" - -
- Sa
mpl
e G
UA-2
8 - -
-G
UA0
0165
.45
0.17
34.6
80.
0516
7.74
0.32
4.84
0.01
1.75
E-03
1.4E
-04
4.84
0.01
48.2
13.
374.
44G
UA0
0254
.75
0.26
32.8
50.
0515
6.49
0.23
4.76
0.01
2.28
E-03
1.0E
-04
4.76
0.01
32.7
62.
443.
92G
UA0
0358
.48
0.11
32.5
00.
0615
9.77
0.33
4.92
0.01
1.16
E-03
2.1E
-04
4.92
0.01
65.8
54.
624.
24G
UA0
0453
.70
0.27
34.3
40.
0816
4.91
0.31
4.80
0.01
2.62
E-03
9.1E
-05
4.80
0.01
22.6
82.
103.
68G
UA0
0561
.60
0.15
37.1
80.
0518
4.59
0.23
4.96
0.01
1.79
E-03
1.3E
-04
4.96
0.01
47.2
13.
043.
90G
UA0
0668
.90
0.41
41.9
30.
0821
0.08
0.17
5.01
0.01
2.86
E-03
6.6E
-05
5.01
0.01
15.3
50.
953.
87G
UA0
0770
.48
0.24
44.4
60.
0822
4.16
0.46
5.04
0.01
1.73
E-03
1.2E
-04
5.04
0.01
48.9
82.
923.
73si
ngle
cry
stal
G
UA0
0824
.54
0.23
12.9
60.
0562
.20
0.18
4.80
0.02
1.75
E-03
3.2E
-04
4.80
0.02
48.2
57.
854.
46G
UA0
098.
860.
118.
030.
0542
.85
0.15
5.34
0.04
2.09
E-03
6.0E
-04
5.34
0.04
38.2
314
.53
2.60
GU
A010
37.1
80.
2420
.70
0.06
110.
150.
265.
320.
021.
63E-
032.
3E-0
45.
320.
0251
.96
5.45
4.23
GU
A011
11.3
10.
1311
.33
0.03
58.0
60.
135.
120.
022.
50E-
032.
7E-0
45.
120.
0225
.99
6.80
2.35
GU
A012
16.3
60.
0910
.56
0.04
52.2
20.
104.
940.
021.
41E-
035.
9E-0
44.
940.
0258
.19
13.1
13.
65G
UA0
1336
.30
0.25
20.1
10.
0694
.69
0.23
4.71
0.02
1.47
E-03
2.9E
-04
4.71
0.02
56.6
46.
814.
25G
UA0
1419
.46
0.22
11.1
00.
0755
.16
0.15
4.97
0.03
1.67
E-03
4.5E
-04
4.97
0.03
50.5
110
.46
4.13
GU
A015
17.9
80.
2310
.97
0.06
54.2
20.
184.
940.
031.
78E-
034.
3E-0
44.
940.
0347
.53
10.0
63.
86G
UA0
1616
.76
0.22
12.8
10.
0563
.45
0.14
4.95
0.02
1.73
E-03
4.8E
-04
4.95
0.02
48.8
110
.92
3.08
Tota
l-Gas
622.
110.
8837
6.54
0.24
1860
.73
0.96
4.94
0.00
2.18
E-03
5.5E
-05
4.94
0.00
35.6
80.
923.
89W
eigh
t. M
EAN
3.92
MEA
N ±
1SD
4.96
0.18
44.2
013
.69
3.77
Min
imum
4.71
15.3
52.
35M
axim
um5.
3465
.85
4.46

Appendix 126
CO
RR
. IN
TEN
SIT
IES
(erro
rs: 2
SD
/abs
.)R
ESU
LTS
(err
ors:
2SD
/abs
.)
Sam
ple
40A
r*+/
-39
Ar
+/-
37A
r+/
-40
K/ 4
0Ar
+/-
36/ 4
0Ar
+/-
37A
r 39A
r+/
-R
/ R+A
+/-
Dat
e M
aA
MPH
"TA
L" -
- - S
ampl
e TA
L-10
4 - -
-TA
L_01
1.89
0.14
11.8
30.
0410
0.55
0.19
5203
.355
.22.
99E-
038.
5E-0
48.
500.
0411
.70
24.3
90.
39TA
L_02
9.42
0.24
17.1
70.
0617
4.73
0.37
1158
.27.
53.
08E-
032.
3E-0
410
.18
0.04
8.96
6.64
1.33
TAL_
0319
.55
0.34
29.9
70.
2024
1.35
0.48
5057
.158
.51.
81E-
035.
3E-0
48.
050.
0646
.53
15.2
91.
58TA
L_04
60.3
10.
9547
.75
0.39
405.
461.
6616
82.6
18.0
2.37
E-03
1.7E
-04
8.49
0.08
29.9
84.
903.
06Ta
l_05
26.6
71.
0023
.95
0.17
302.
401.
1791
5.6
9.4
2.90
E-03
1.1E
-04
12.6
20.
1014
.37
3.25
2.70
TAL_
0646
.03
1.92
26.0
20.
1723
1.37
0.95
557.
95.
72.
91E-
039.
2E-0
58.
890.
0713
.92
2.64
4.29
TAL_
07
TAL_
0815
.91
1.03
21.3
70.
1928
9.30
0.95
1010
.312
.33.
03E-
031.
9E-0
413
.54
0.13
10.6
15.
361.
81TA
L_09
10.7
10.
3115
.92
0.11
123.
880.
2225
17.6
27.4
2.58
E-03
4.3E
-04
7.78
0.05
23.8
812
.30
1.63
TAL_
105.
850.
3411
.79
0.08
114.
330.
3318
71.8
21.3
2.94
E-03
3.8E
-04
9.70
0.07
13.1
010
.86
1.20
TAL_
114.
870.
3212
.70
0.08
112.
580.
2219
39.7
20.9
3.03
E-03
3.5E
-04
8.87
0.06
10.4
910
.14
0.93
TAL_
1212
.96
0.32
10.8
50.
1010
3.99
0.39
1789
.123
.72.
36E-
034.
3E-0
49.
580.
1030
.14
12.4
22.
90TA
L_13
16.0
30.
3424
.42
0.19
199.
440.
6328
67.8
30.7
2.49
E-03
3.1E
-04
8.17
0.07
26.5
48.
761.
59TA
L_14
9.71
0.26
17.1
40.
1516
3.22
0.30
2011
.721
.82.
84E-
033.
3E-0
49.
520.
0816
.07
9.43
1.37
TAL_
1523
.70
0.34
33.7
70.
1525
3.11
0.66
4209
.937
.71.
97E-
033.
8E-0
47.
500.
0441
.67
10.9
51.
70TA
L_16
26.5
20.
4526
.64
0.18
192.
770.
7333
35.6
38.8
1.80
E-03
4.3E
-04
7.24
0.06
46.8
312
.33
2.41
TAL_
172.
850.
3411
.78
0.09
138.
910.
3218
12.6
21.6
3.17
E-03
4.6E
-04
11.7
90.
106.
1913
.23
0.59
TAL_
1810
.85
0.20
17.2
70.
1314
2.28
0.27
2022
.019
.32.
78E-
033.
5E-0
48.
240.
0617
.91
9.90
1.52
TAL_
19TA
L_20
9.90
0.29
10.9
30.
0719
0.04
0.50
611.
95.
13.
12E-
031.
9E-0
417
.38
0.12
7.82
5.55
2.20
TAL_
213.
670.
2711
.39
0.06
91.2
80.
1826
31.3
29.8
2.98
E-03
6.5E
-04
8.01
0.04
11.9
718
.73
0.78
TAL_
228.
080.
2912
.58
0.06
98.1
60.
2826
44.2
29.0
2.57
E-03
5.5E
-04
7.80
0.04
23.9
615
.84
1.56
TAL_
23a
TAL_
23b
TAL_
24TA
L_25
13.5
90.
2324
.25
0.14
145.
630.
3424
75.8
20.3
2.72
E-03
2.3E
-04
6.01
0.04
19.5
66.
641.
36TA
L_26
a13
.35
0.28
12.2
00.
0710
4.12
0.22
965.
38.
22.
88E-
032.
6E-0
48.
530.
0514
.90
7.39
2.65
TAL_
26b
21.3
70.
3218
.66
0.08
162.
300.
3118
68.4
15.1
2.36
E-03
2.5E
-04
8.70
0.04
30.1
77.
312.
78TA
L_26
c26
.24
0.37
21.1
60.
1318
3.34
0.33
2212
.721
.22.
07E-
033.
9E-0
48.
670.
0538
.70
11.3
03.
01To
tal-G
as40
0.01
2.92
471.
500.
7242
64.5
43.
0114
52.4
7.8
2.83
E-03
4.7E
-05
9.04
0.02
16.3
81.
351.
94W
eigh
t. M
EAN
1.90
MEA
N ±
2SD
9.32
2.41
21.5
012
.34
1.89
Min
imum
6.01
6.19
0.39
Max
imum
17.3
846
.83
4.29

Appendix 127
CO
RR
. IN
TEN
SITI
ES (e
rrors
: 2S
D/a
bs.)
RES
ULT
S (e
rror
s: 2
SD/a
bs.)
Sam
ple
40A
r*+/
-39
Ar
+/-
37A
r+/
-40
K/ 4
0Ar
+/-
36/ 4
0Ar
+/-
37A
r 39A
r+/
-R
/ R+A
+/-
Dat
e M
aA
MPH
"B
RI"
- - -
Sam
ple
BR
I-25
- - -
BRI
25_2
55.8
80.
8824
.17
0.25
77.9
60.
5251
1.6
5.9
2.82
E-03
1.2E
-04
3.23
0.04
16.6
83.
485.
60B
RI25
_02b
12.2
60.
135.
700.
0919
.19
0.11
1868
.733
.31.
47E-
035.
9E-0
43.
370.
0656
.69
17.0
65.
21B
RI25
_03
20.9
50.
199.
170.
0549
.19
0.15
1323
.511
.31.
94E-
034.
6E-0
45.
360.
0342
.64
13.2
45.
54B
RI25
_04
19.4
30.
249.
550.
0637
.87
0.15
1602
.215
.51.
83E-
034.
0E-0
43.
970.
0345
.99
11.4
44.
93B
RI25
_4b
9.65
0.17
4.69
0.07
19.6
10.
1315
27.2
25.7
1.88
E-03
1.1E
-03
4.18
0.07
44.3
330
.37
4.99
B
RI25
_06
30.3
60.
3715
.36
0.09
75.6
60.
2965
6.3
5.3
2.76
E-03
1.1E
-04
4.93
0.04
18.3
03.
194.
79B
RI25
_07
26.2
60.
3211
.71
0.09
51.7
30.
2611
72.7
12.3
2.13
E-03
2.6E
-04
4.42
0.04
37.0
87.
595.
43B
r25_
0828
.95
0.26
12.0
00.
0760
.65
0.15
1391
.612
.51.
78E-
032.
5E-0
45.
050.
0347
.35
7.27
5.85
BRI
_09
31.5
40.
2714
.68
0.09
73.5
20.
2310
32.4
8.4
2.33
E-03
1.6E
-04
5.01
0.03
31.2
84.
555.
21B
RI_1
078
.29
1.82
30.6
20.
1915
1.14
0.62
568.
95.
32.
69E-
037.
6E-0
54.
940.
0420
.51
2.18
6.19
BRI
_11
41.6
10.
4116
.17
0.09
85.7
20.
2610
44.3
8.9
2.10
E-03
1.7E
-04
5.30
0.03
37.9
04.
816.
24B
RI_1
252
.58
0.56
20.3
00.
1295
.87
0.36
628.
15.
12.
61E-
031.
0E-0
44.
720.
0322
.94
2.92
6.28
BRI
_13
57.7
50.
1925
.52
0.10
103.
040.
1713
53.6
8.7
1.92
E-03
1.1E
-04
4.04
0.02
43.2
03.
265.
48B
RI_1
441
.54
0.26
16.0
90.
1074
.06
0.17
1386
.311
.91.
68E-
032.
2E-0
44.
600.
0350
.46
6.38
6.25
BRI
_15
25.8
10.
2511
.48
0.07
61.1
40.
3211
05.1
9.6
2.20
E-03
2.9E
-04
5.33
0.04
35.0
48.
475.
45B
RI_1
627
.71
0.42
11.1
70.
0950
.11
0.20
654.
46.
62.
61E-
031.
9E-0
44.
490.
0422
.89
5.48
6.01
BR_
18(b
)58
.66
0.27
24.2
50.
1398
.70
0.29
1743
.513
.51.
37E-
031.
8E-0
44.
070.
0259
.49
5.21
5.86
BRI
_19
13.5
20.
205.
690.
0825
.83
0.11
985.
514
.82.
27E-
033.
4E-0
44.
540.
0633
.00
9.65
5.75
BRI
_20
65.9
80.
3026
.02
0.12
96.8
40.
2318
09.0
13.6
1.19
E-03
1.7E
-04
3.72
0.02
64.7
04.
936.
15B
RI_2
144
.97
0.25
18.8
80.
0683
.78
0.29
1935
.513
.51.
18E-
032.
3E-0
44.
440.
0265
.01
6.72
5.77
BRI
_22
24.5
40.
299.
560.
1143
.92
0.16
427.
05.
22.
86E-
031.
1E-0
44.
590.
0515
.45
3.06
6.22
BRI
_23
35.5
90.
3313
.04
0.08
64.5
70.
1511
20.3
9.9
1.93
E-03
2.2E
-04
4.95
0.03
43.1
16.
296.
61B
RI_2
419
.63
0.24
8.56
0.06
38.5
00.
1512
19.4
12.3
2.05
E-03
3.9E
-04
4.50
0.04
39.4
511
.07
5.56
BRI
_25a
8.68
0.24
4.55
0.04
21.6
60.
1660
5.0
6.7
2.83
E-03
3.1E
-04
4.76
0.05
16.2
58.
904.
62B
RI_2
5b35
.81
0.27
17.4
80.
1084
.48
0.18
2002
.817
.41.
43E-
033.
1E-0
44.
830.
0357
.85
8.89
4.96
BRI
_26
54.8
10.
2820
.41
0.09
89.2
70.
2616
23.0
12.2
1.30
E-03
1.7E
-04
4.37
0.02
61.4
74.
886.
51B
RI_2
732
.02
0.56
15.6
90.
1174
.68
0.29
411.
83.
72.
98E-
038.
2E-0
54.
760.
0411
.85
2.34
4.95
BRI
_28
26.8
20.
7212
.08
0.10
54.0
30.
1720
0.1
1.9
3.17
E-03
9.2E
-05
4.47
0.04
6.26
2.63
5.38
BRI
_29
38.7
30.
4513
.96
0.11
63.1
80.
1772
7.8
7.3
2.42
E-03
1.5E
-04
4.53
0.04
28.4
74.
436.
72B
RI_3
0a12
.91
0.43
6.80
0.08
34.5
30.
1835
8.9
4.8
3.06
E-03
2.1E
-04
5.07
0.07
9.60
6.05
4.60
BRI
_30b
13.4
90.
265.
560.
0530
.11
0.11
1708
.425
.71.
41E-
038.
6E-0
45.
410.
0558
.41
24.9
25.
87B
RI_3
136
.08
0.33
16.1
80.
0876
.54
0.25
1001
.67.
42.
32E-
032.
9E-0
44.
730.
0331
.51
8.47
5.41
Tota
l-Gas
1082
.80
2.74
457.
120.
5820
67.0
91.
4383
6.5
4.3
2.45
E-03
3.2E
-05
4.52
0.01
27.4
60.
915.
64W
eigh
t. M
EAN
5.82
MEA
N ±
2SD
4.58
0.53
36.7
217
.30
5.64
Min
imum
3.23
6.26
4.60
Max
imum
5.41
65.0
16.
72

Appendix 128
CO
RR
. IN
TEN
SITI
ESR
ESU
LTS
Sam
ple
40A
r*+/
-39
Ar
+/-
37A
r+/
-40
K/ 4
0Ar
+/-
36/ 4
0Ar
+/-
37A
r 39A
r+/
-R
/ R+A
+/-
Dat
e M
a+/
-int.
+/-e
xt.
AM
PH A
LT60
0°1.
921.
681.
260.
068.
540.
1333
.01.
63.
36E-
032.
0E-0
46.
790.
350.
695.
933.
5830
.52
30.5
210
00°
199.
414.
1313
.28
0.06
211.
790.
5784
.60.
52.
80E-
034.
0E-0
515
.94
0.08
17.2
91.
2034
.84
2.46
2.47
1200
°13
89.9
29.
9119
2.13
0.74
3469
.11
8.69
505.
12.
71.
70E-
032.
2E-0
518
.06
0.08
49.7
50.
6516
.87
0.26
0.27
1550
°11
7.31
6.56
10.6
00.
0955
.07
0.21
480.
019
.89.
38E-
043.
7E-0
45.
190.
0572
.29
10.9
425
.74
4.07
4.07
1550
°
tota
l gas
1708
.57
12.7
021
7.28
0.75
3744
.51
8.71
363.
61.
72.
07E-
032.
6E-0
517
.23
0.07
38.9
20.
7718
.33
0.39
0.40
AM
PH B
RI
1550
°22
86.2
618
.72
745.
152.
6634
97.5
47.
7810
80.1
5.7
1.81
E-03
7.0E
-05
4.69
0.02
46.6
52.
097.
420.
330.
3415
50°
to
tal g
as22
86.2
618
.72
745.
152.
6634
97.5
47.
7810
80.1
5.7
1.81
E-03
7.0E
-05
4.69
0.02
46.6
52.
097.
420.
330.
34
AM
PH G
UA60
0°7.
671.
617.
680.
064.
010.
1422
2.3
2.3
3.28
E-03
2.1E
-04
0.52
0.02
3.06
6.15
2.37
4.70
4.70
1200
°13
28.2
59.
1471
6.14
2.55
3444
.28
8.81
2092
.610
.71.
57E-
035.
4E-0
54.
810.
0253
.47
1.63
4.39
0.14
0.14
1550
°11
3.87
6.48
32.8
50.
1418
2.49
0.48
943.
824
.51.
86E-
032.
1E-0
45.
560.
0345
.07
6.20
8.20
1.18
1.18
1550
°
1550
°
tota
l gas
1449
.79
11.3
275
6.67
2.56
3630
.78
8.83
1838
.49.
41.
74E-
035.
2E-0
54.
800.
0248
.53
1.54
4.54
0.15
0.15
AM
PH T
AL
1550
°10
59.0
217
.28
1338
.17
5.03
1288
3.89
28.5
524
59.7
13.6
2.45
E-03
4.6E
-05
9.63
0.04
27.4
81.
381.
920.
100.
1015
50°
15
50°
15
50°
to
tal g
as10
59.0
217
.28
1338
.17
5.03
1288
3.89
28.5
524
59.7
13.6
2.45
E-03
4.6E
-05
9.63
0.04
27.4
81.
381.
920.
100.
10

Appendix 129
Name TAL 104_1 TAL 104_2 TAL 104_3_1 TAL 104_3_2 TAL 104_1_R1 TAL 104_1_R2 TAL 104_1_M1SiO2 43.16 40.66 42.95 42.70 43.52 43.41 43.65TiO2 1.81 1.68 1.77 1.78 1.79 1.64 1.77Al2O3 11.67 13.69 12.45 12.32 11.89 11.78 11.71Cr2O3 0.22 0.01 0.03 0.09 0.04 0.05 0.18FeO 8.46 14.15 10.57 10.37 8.67 8.50 8.55MnO 0.07 0.25 0.11 0.08 0.13 0.11 0.08MgO 16.49 11.85 14.72 14.96 16.27 16.62 16.84CaO 11.67 11.86 11.29 11.45 11.53 11.55 11.61BaO 0.01 0.01 0.03 0.00 0.00 0.10 0.01Na2O 2.46 2.64 2.65 2.65 2.37 2.35 2.48K2O 0.63 0.30 0.59 0.59 0.63 0.64 0.66Total 96.65 97.10 97.17 96.99 96.85 96.74 97.54
cations on basis of 23 oxygenSi 6.325 6.103 6.310 6.287 6.356 6.349 6.335Al 2.016 2.422 2.155 2.137 2.047 2.030 2.004Ti 0.199 0.190 0.196 0.198 0.197 0.180 0.193Cr 0.026 0.001 0.004 0.011 0.005 0.006 0.020Mg 3.603 2.652 3.225 3.284 3.542 3.624 3.643X (Zn,Ni,Li) 0.000 0.000 0.000 0.000 0.000 0.000 0.000Fe 1.037 1.776 1.299 1.276 1.059 1.040 1.038Mn 0.009 0.032 0.014 0.010 0.017 0.013 0.010Ca 1.832 1.907 1.776 1.806 1.805 1.811 1.805Na 0.699 0.768 0.754 0.758 0.670 0.668 0.698K 0.117 0.057 0.111 0.110 0.117 0.119 0.122Ba 0.001 0.001 0.002 0.000 0.000 0.006 0.000Total 15.863 15.909 15.846 15.877 15.815 15.845 15.869
ideal site formularSi 6.26 6.05 6.26 6.24 6.30 6.28 6.27
AlIV 1.74 1.95 1.74 1.76 1.70 1.72 1.73TiIV
sum T 8.000 8.000 8.000 8.000 8.000 8.000 8.000AlVI 0.26 0.44 0.40 0.36 0.32 0.29 0.25
Ti 0.20 0.19 0.19 0.20 0.20 0.18 0.19Fe3+ 0.44 0.43 0.36 0.36 0.43 0.50 0.50
Cr 0.03 0.00 0.00 0.01 0.00 0.01 0.02Mg 3.57 2.63 3.20 3.26 3.51 3.58 3.60
X (Zn,Ni,Li)Fe2+ 0.50 1.29 0.84 0.81 0.53 0.43 0.43Mn 0.00 0.02 0.01 0.00 0.01 0.01 0.01
sum C 5.000 5.000 5.000 5.000 5.000 5.000 5.000Fe2+ 0.08 0.04 0.09 0.09 0.09 0.09 0.10Mn 0.00 0.02 0.01 0.00 0.01 0.01 0.01Ca 1.81 1.89 1.76 1.79 1.79 1.79 1.79Na 0.10 0.059 0.136 0.111 0.113 0.111 0.114
sum B 2.000 2.000 2.000 2.000 2.000 2.000 2.000Na 0.59 0.70 0.61 0.64 0.55 0.55 0.58K 0.12 0.06 0.11 0.11 0.12 0.12 0.12
Ba 0.00 0.00 0.00 0.00 0.00 0.01 0.00sum A 0.710 0.759 0.724 0.751 0.667 0.673 0.698total 15.71 15.76 15.72 15.75 15.67 15.67 15.70
CaB 1.81 1.89 1.76 1.79 1.79 1.79 1.79(Na+K)A 0.71 0.76 0.72 0.75 0.67 0.67 0.70Ti 0.199 0.190 0.196 0.198 0.197 0.180 0.193Si(formular) 6.26 6.05 6.26 6.24 6.30 6.28 6.27Mg/(Mg+Fe2+) 0.86 0.66 0.77 0.78 0.85 0.87 0.87AlVI/Fe3+ 0.59 1.03 1.12 0.98 0.76 0.57 0.50name magnesiohastings pargasite pargasite magnesiohastingsmagnesiohastingsmagnesiohastingsmagnesiohastings
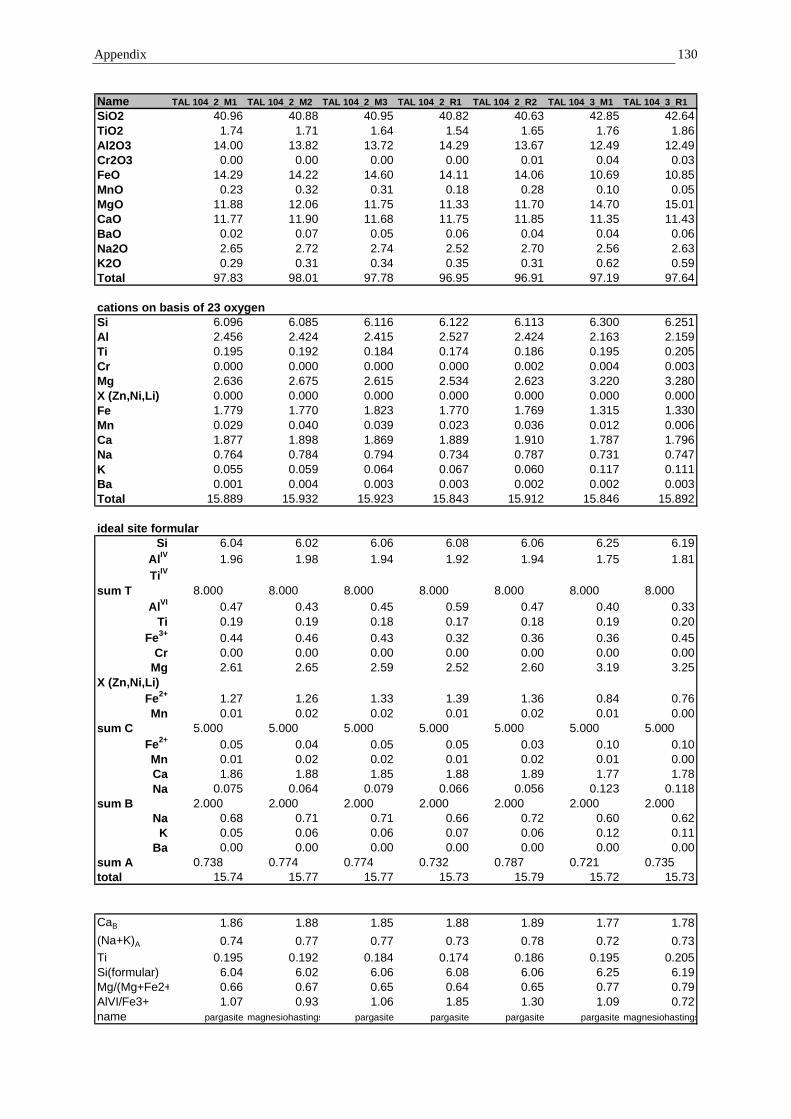
Appendix 130
Name TAL 104_2_M1 TAL 104_2_M2 TAL 104_2_M3 TAL 104_2_R1 TAL 104_2_R2 TAL 104_3_M1 TAL 104_3_R1SiO2 40.96 40.88 40.95 40.82 40.63 42.85 42.64TiO2 1.74 1.71 1.64 1.54 1.65 1.76 1.86Al2O3 14.00 13.82 13.72 14.29 13.67 12.49 12.49Cr2O3 0.00 0.00 0.00 0.00 0.01 0.04 0.03FeO 14.29 14.22 14.60 14.11 14.06 10.69 10.85MnO 0.23 0.32 0.31 0.18 0.28 0.10 0.05MgO 11.88 12.06 11.75 11.33 11.70 14.70 15.01CaO 11.77 11.90 11.68 11.75 11.85 11.35 11.43BaO 0.02 0.07 0.05 0.06 0.04 0.04 0.06Na2O 2.65 2.72 2.74 2.52 2.70 2.56 2.63K2O 0.29 0.31 0.34 0.35 0.31 0.62 0.59Total 97.83 98.01 97.78 96.95 96.91 97.19 97.64
cations on basis of 23 oxygenSi 6.096 6.085 6.116 6.122 6.113 6.300 6.251Al 2.456 2.424 2.415 2.527 2.424 2.163 2.159Ti 0.195 0.192 0.184 0.174 0.186 0.195 0.205Cr 0.000 0.000 0.000 0.000 0.002 0.004 0.003Mg 2.636 2.675 2.615 2.534 2.623 3.220 3.280X (Zn,Ni,Li) 0.000 0.000 0.000 0.000 0.000 0.000 0.000Fe 1.779 1.770 1.823 1.770 1.769 1.315 1.330Mn 0.029 0.040 0.039 0.023 0.036 0.012 0.006Ca 1.877 1.898 1.869 1.889 1.910 1.787 1.796Na 0.764 0.784 0.794 0.734 0.787 0.731 0.747K 0.055 0.059 0.064 0.067 0.060 0.117 0.111Ba 0.001 0.004 0.003 0.003 0.002 0.002 0.003Total 15.889 15.932 15.923 15.843 15.912 15.846 15.892
ideal site formularSi 6.04 6.02 6.06 6.08 6.06 6.25 6.19
AlIV 1.96 1.98 1.94 1.92 1.94 1.75 1.81TiIV
sum T 8.000 8.000 8.000 8.000 8.000 8.000 8.000AlVI 0.47 0.43 0.45 0.59 0.47 0.40 0.33
Ti 0.19 0.19 0.18 0.17 0.18 0.19 0.20Fe3+ 0.44 0.46 0.43 0.32 0.36 0.36 0.45
Cr 0.00 0.00 0.00 0.00 0.00 0.00 0.00Mg 2.61 2.65 2.59 2.52 2.60 3.19 3.25
X (Zn,Ni,Li)Fe2+ 1.27 1.26 1.33 1.39 1.36 0.84 0.76Mn 0.01 0.02 0.02 0.01 0.02 0.01 0.00
sum C 5.000 5.000 5.000 5.000 5.000 5.000 5.000Fe2+ 0.05 0.04 0.05 0.05 0.03 0.10 0.10Mn 0.01 0.02 0.02 0.01 0.02 0.01 0.00Ca 1.86 1.88 1.85 1.88 1.89 1.77 1.78Na 0.075 0.064 0.079 0.066 0.056 0.123 0.118
sum B 2.000 2.000 2.000 2.000 2.000 2.000 2.000Na 0.68 0.71 0.71 0.66 0.72 0.60 0.62K 0.05 0.06 0.06 0.07 0.06 0.12 0.11
Ba 0.00 0.00 0.00 0.00 0.00 0.00 0.00sum A 0.738 0.774 0.774 0.732 0.787 0.721 0.735total 15.74 15.77 15.77 15.73 15.79 15.72 15.73
CaB 1.86 1.88 1.85 1.88 1.89 1.77 1.78(Na+K)A 0.74 0.77 0.77 0.73 0.78 0.72 0.73Ti 0.195 0.192 0.184 0.174 0.186 0.195 0.205Si(formular) 6.04 6.02 6.06 6.08 6.06 6.25 6.19Mg/(Mg+Fe2+ 0.66 0.67 0.65 0.64 0.65 0.77 0.79AlVI/Fe3+ 1.07 0.93 1.06 1.85 1.30 1.09 0.72name pargasite magnesiohastings pargasite pargasite pargasite pargasite magnesiohastings

Appendix 131
Name TAL 104_3_R2 TAL 104_3_M2 BRI 25_1_M1 BRI 25_1_R2 BRI 25_2_M1 BRI 25_2_R1 BRI 25_3_M1SiO2 42.78 42.95 39.44 40.33 40.05 40.34 40.39TiO2 1.77 1.77 2.69 3.13 3.19 3.10 3.38Al2O3 12.43 12.45 15.00 14.07 13.31 13.16 13.05Cr2O3 0.00 0.05 0.00 0.02 0.00 0.02 0.00FeO 10.57 10.38 10.93 10.02 10.59 10.76 11.75MnO 0.01 0.11 0.11 0.11 0.13 0.08 0.14MgO 14.62 14.83 13.62 13.96 14.11 13.93 13.39CaO 11.34 11.52 12.14 12.10 11.78 11.97 12.01BaO 0.05 0.00 0.10 0.08 0.06 0.02 0.05Na2O 2.64 2.64 2.25 2.59 2.52 2.40 2.66K2O 0.57 0.58 1.40 1.06 0.95 0.98 0.99Total 96.78 97.29 97.68 97.47 96.69 96.76 97.81
cations on basis of 23 oxygenSi 6.310 6.300 5.848 5.956 5.977 6.015 5.996Al 2.161 2.152 2.621 2.450 2.340 2.313 2.284Ti 0.197 0.195 0.300 0.347 0.358 0.347 0.377Cr 0.000 0.006 0.000 0.002 0.000 0.002 0.000Mg 3.214 3.244 3.011 3.073 3.140 3.097 2.962X (Zn,Ni,Li) 0.000 0.000 0.000 0.000 0.000 0.000 0.000Fe 1.303 1.273 1.356 1.238 1.322 1.342 1.458Mn 0.001 0.014 0.014 0.014 0.017 0.010 0.018Ca 1.792 1.811 1.929 1.915 1.884 1.913 1.910Na 0.755 0.750 0.647 0.742 0.730 0.694 0.765K 0.106 0.109 0.265 0.199 0.180 0.186 0.188Ba 0.003 0.000 0.006 0.004 0.003 0.001 0.003Total 15.842 15.854 15.996 15.941 15.952 15.920 15.960
ideal site formularSi 6.27 6.26 5.80 5.94 5.93 5.98 5.97
AlIV 1.73 1.74 2.20 2.06 2.07 2.02 2.03TiIV
sum T 8.000 8.000 8.000 8.000 8.000 8.000 8.000AlVI 0.41 0.39 0.40 0.38 0.26 0.28 0.25
Ti 0.20 0.19 0.30 0.35 0.36 0.34 0.38Fe3+ 0.33 0.32 0.38 0.14 0.32 0.28 0.18
Cr 0.00 0.01 0.00 0.00 0.00 0.00 0.00Mg 3.19 3.22 2.99 3.06 3.12 3.08 2.95
X (Zn,Ni,Li)Fe2+ 0.88 0.86 0.93 1.06 0.94 1.01 1.24Mn 0.00 0.01 0.01 0.01 0.01 0.00 0.01
sum C 5.000 5.000 5.000 5.000 5.000 5.000 5.000Fe2+ 0.09 0.09 0.03 0.03 0.05 0.04 0.04Mn 0.00 0.01 0.01 0.01 0.01 0.00 0.01Ca 1.78 1.80 1.91 1.91 1.87 1.90 1.90Na 0.128 0.110 0.046 0.051 0.069 0.053 0.052
sum B 2.000 2.000 2.000 2.000 2.000 2.000 2.000Na 0.62 0.64 0.60 0.69 0.66 0.64 0.71K 0.11 0.11 0.26 0.20 0.18 0.18 0.19
Ba 0.00 0.00 0.01 0.00 0.00 0.00 0.00sum A 0.731 0.743 0.864 0.892 0.838 0.823 0.900total 15.73 15.74 15.86 15.89 15.84 15.82 15.90
CaB 1.78 1.80 1.91 1.91 1.87 1.90 1.90(Na+K)A 0.73 0.74 0.86 0.89 0.83 0.82 0.90Ti 0.197 0.195 0.300 0.347 0.358 0.347 0.377Si(formular) 6.27 6.26 5.80 5.94 5.93 5.98 5.97Mg/(Mg+Fe2+ 0.77 0.77 0.76 0.74 0.76 0.75 0.70AlVI/Fe3+ 1.26 1.21 1.04 2.67 0.80 0.98 1.41name pargasite pargasite pargasite pargasite magnesiohastingsmagnesiohastings pargasite

Appendix 132
Name BRI 25_3_R1 ALT 16_1_M1 ALT 16_1_R1 ALT 16_2_M1 ALT 16_2_R1 ALT 16_3_M1 ALT 16_3_R1SiO2 39.52 42.28 42.19 42.73 42.91 42.50 43.06TiO2 3.65 2.57 2.56 2.56 2.66 2.58 2.39Al2O3 14.01 11.65 11.47 11.69 11.83 10.93 10.81Cr2O3 0.00 0.00 0.00 0.01 0.00 0.00 0.02FeO 11.11 13.16 13.35 13.15 12.94 16.83 16.64MnO 0.05 0.36 0.39 0.29 0.29 0.52 0.68MgO 13.45 13.71 13.57 13.62 13.46 11.33 11.57CaO 11.74 11.13 11.17 11.09 11.10 10.26 10.25BaO 0.00 0.01 0.02 0.05 0.02 0.06 0.00Na2O 2.68 2.60 2.68 2.47 2.44 2.40 2.57K2O 0.95 0.28 0.27 0.25 0.27 0.23 0.22Total 97.16 97.75 97.67 97.91 97.92 97.64 98.22
cations on basis of 23 oxygenSi 5.884 6.258 6.261 6.299 6.315 6.385 6.422Al 2.459 2.032 2.007 2.032 2.051 1.936 1.901Ti 0.409 0.286 0.285 0.284 0.294 0.291 0.268Cr 0.000 0.000 0.000 0.001 0.000 0.000 0.002Mg 2.986 3.026 3.001 2.994 2.952 2.536 2.572X (Zn,Ni,Li) 0.000 0.000 0.000 0.000 0.000 0.000 0.000Fe 1.383 1.629 1.657 1.621 1.593 2.114 2.076Mn 0.006 0.045 0.049 0.036 0.036 0.066 0.086Ca 1.873 1.765 1.776 1.752 1.751 1.652 1.639Na 0.773 0.747 0.772 0.707 0.695 0.700 0.742K 0.180 0.052 0.052 0.047 0.050 0.045 0.043Ba 0.000 0.001 0.001 0.003 0.001 0.003 0.000Total 15.953 15.842 15.861 15.776 15.738 15.729 15.751
ideal site formularSi 5.86 6.18 6.19 6.23 6.26 6.31 6.34
AlIV 2.14 1.82 1.81 1.77 1.74 1.69 1.66TiIV
sum T 8.000 8.000 8.000 8.000 8.000 8.000 8.000AlVI 0.30 0.19 0.18 0.24 0.29 0.22 0.22
Ti 0.41 0.28 0.28 0.28 0.29 0.29 0.26Fe3+ 0.22 0.54 0.51 0.50 0.42 0.57 0.56
Cr 0.00 0.00 0.00 0.00 0.00 0.00 0.00Mg 2.97 2.99 2.97 2.96 2.93 2.50 2.54
X (Zn,Ni,Li)Fe2+ 1.09 0.97 1.04 1.00 1.06 1.39 1.37Mn 0.00 0.02 0.02 0.02 0.02 0.03 0.04
sum C 5.000 5.000 5.000 5.000 5.000 5.000 5.000Fe2+ 0.06 0.10 0.09 0.11 0.10 0.13 0.12Mn 0.00 0.02 0.02 0.02 0.02 0.03 0.04Ca 1.86 1.74 1.76 1.73 1.74 1.63 1.62Na 0.073 0.136 0.129 0.142 0.145 0.204 0.217
sum B 2.000 2.000 2.000 2.000 2.000 2.000 2.000Na 0.70 0.60 0.63 0.56 0.54 0.49 0.52K 0.18 0.05 0.05 0.05 0.05 0.04 0.04
Ba 0.00 0.00 0.00 0.00 0.00 0.00 0.00sum A 0.876 0.655 0.686 0.607 0.595 0.535 0.558total 15.88 15.65 15.69 15.61 15.60 15.53 15.56
CaB 1.86 1.74 1.76 1.73 1.74 1.63 1.62(Na+K)A 0.88 0.65 0.69 0.60 0.59 0.53 0.56Ti 0.409 0.286 0.285 0.284 0.294 0.291 0.268Si(formular) 5.86 6.18 6.19 6.23 6.26 6.31 6.34Mg/(Mg+Fe2+ 0.72 0.74 0.72 0.73 0.72 0.62 0.63AlVI/Fe3+ 1.34 0.36 0.35 0.49 0.69 0.39 0.39name pargasite magnesiohastingsmagnesiohastingsmagnesiohastingsmagnesiohastingsmagnesiohastingsmagnesiohastings
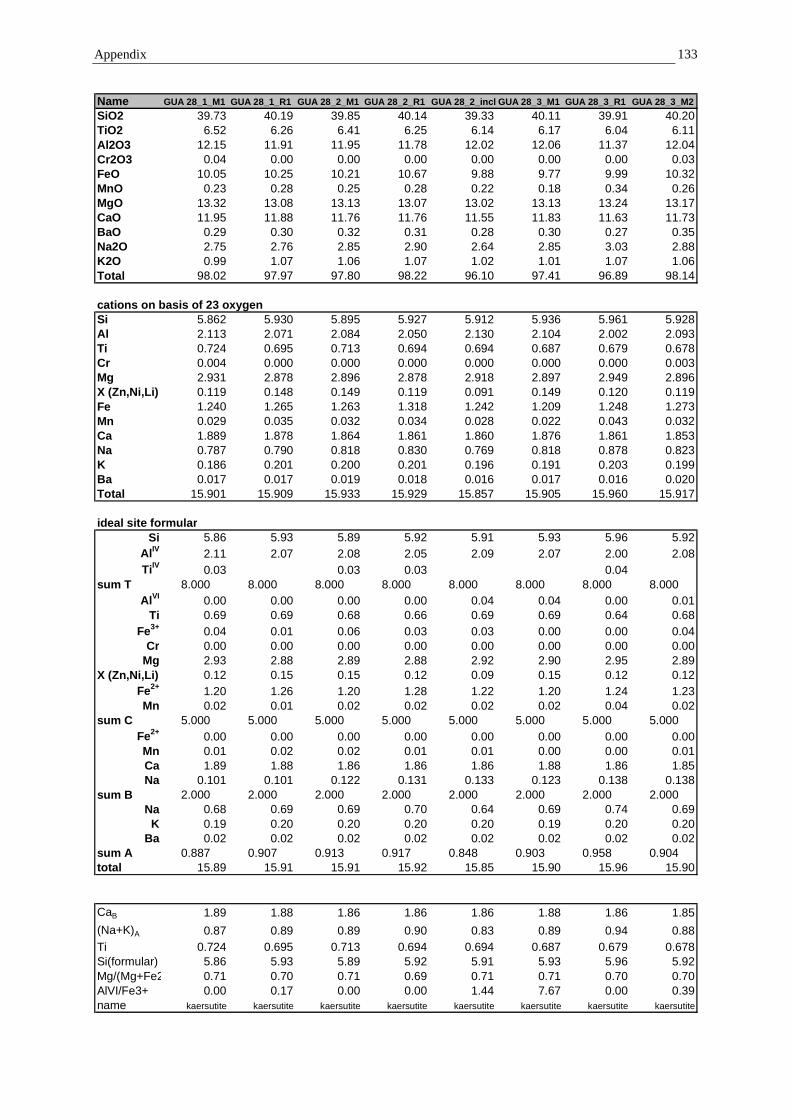
Appendix 133
Name GUA 28_1_M1 GUA 28_1_R1 GUA 28_2_M1 GUA 28_2_R1 GUA 28_2_incl GUA 28_3_M1 GUA 28_3_R1 GUA 28_3_M2SiO2 39.73 40.19 39.85 40.14 39.33 40.11 39.91 40.20TiO2 6.52 6.26 6.41 6.25 6.14 6.17 6.04 6.11Al2O3 12.15 11.91 11.95 11.78 12.02 12.06 11.37 12.04Cr2O3 0.04 0.00 0.00 0.00 0.00 0.00 0.00 0.03FeO 10.05 10.25 10.21 10.67 9.88 9.77 9.99 10.32MnO 0.23 0.28 0.25 0.28 0.22 0.18 0.34 0.26MgO 13.32 13.08 13.13 13.07 13.02 13.13 13.24 13.17CaO 11.95 11.88 11.76 11.76 11.55 11.83 11.63 11.73BaO 0.29 0.30 0.32 0.31 0.28 0.30 0.27 0.35Na2O 2.75 2.76 2.85 2.90 2.64 2.85 3.03 2.88K2O 0.99 1.07 1.06 1.07 1.02 1.01 1.07 1.06Total 98.02 97.97 97.80 98.22 96.10 97.41 96.89 98.14
cations on basis of 23 oxygenSi 5.862 5.930 5.895 5.927 5.912 5.936 5.961 5.928Al 2.113 2.071 2.084 2.050 2.130 2.104 2.002 2.093Ti 0.724 0.695 0.713 0.694 0.694 0.687 0.679 0.678Cr 0.004 0.000 0.000 0.000 0.000 0.000 0.000 0.003Mg 2.931 2.878 2.896 2.878 2.918 2.897 2.949 2.896X (Zn,Ni,Li) 0.119 0.148 0.149 0.119 0.091 0.149 0.120 0.119Fe 1.240 1.265 1.263 1.318 1.242 1.209 1.248 1.273Mn 0.029 0.035 0.032 0.034 0.028 0.022 0.043 0.032Ca 1.889 1.878 1.864 1.861 1.860 1.876 1.861 1.853Na 0.787 0.790 0.818 0.830 0.769 0.818 0.878 0.823K 0.186 0.201 0.200 0.201 0.196 0.191 0.203 0.199Ba 0.017 0.017 0.019 0.018 0.016 0.017 0.016 0.020Total 15.901 15.909 15.933 15.929 15.857 15.905 15.960 15.917
ideal site formularSi 5.86 5.93 5.89 5.92 5.91 5.93 5.96 5.92
AlIV 2.11 2.07 2.08 2.05 2.09 2.07 2.00 2.08TiIV 0.03 0.03 0.03 0.04
sum T 8.000 8.000 8.000 8.000 8.000 8.000 8.000 8.000AlVI 0.00 0.00 0.00 0.00 0.04 0.04 0.00 0.01
Ti 0.69 0.69 0.68 0.66 0.69 0.69 0.64 0.68Fe3+ 0.04 0.01 0.06 0.03 0.03 0.00 0.00 0.04
Cr 0.00 0.00 0.00 0.00 0.00 0.00 0.00 0.00Mg 2.93 2.88 2.89 2.88 2.92 2.90 2.95 2.89
X (Zn,Ni,Li) 0.12 0.15 0.15 0.12 0.09 0.15 0.12 0.12Fe2+ 1.20 1.26 1.20 1.28 1.22 1.20 1.24 1.23Mn 0.02 0.01 0.02 0.02 0.02 0.02 0.04 0.02
sum C 5.000 5.000 5.000 5.000 5.000 5.000 5.000 5.000Fe2+ 0.00 0.00 0.00 0.00 0.00 0.00 0.00 0.00Mn 0.01 0.02 0.02 0.01 0.01 0.00 0.00 0.01Ca 1.89 1.88 1.86 1.86 1.86 1.88 1.86 1.85Na 0.101 0.101 0.122 0.131 0.133 0.123 0.138 0.138
sum B 2.000 2.000 2.000 2.000 2.000 2.000 2.000 2.000Na 0.68 0.69 0.69 0.70 0.64 0.69 0.74 0.69
K 0.19 0.20 0.20 0.20 0.20 0.19 0.20 0.20Ba 0.02 0.02 0.02 0.02 0.02 0.02 0.02 0.02
sum A 0.887 0.907 0.913 0.917 0.848 0.903 0.958 0.904total 15.89 15.91 15.91 15.92 15.85 15.90 15.96 15.90
CaB 1.89 1.88 1.86 1.86 1.86 1.88 1.86 1.85(Na+K)A 0.87 0.89 0.89 0.90 0.83 0.89 0.94 0.88Ti 0.724 0.695 0.713 0.694 0.694 0.687 0.679 0.678Si(formular) 5.86 5.93 5.89 5.92 5.91 5.93 5.96 5.92Mg/(Mg+Fe2 0.71 0.70 0.71 0.69 0.71 0.71 0.70 0.70AlVI/Fe3+ 0.00 0.17 0.00 0.00 1.44 7.67 0.00 0.39name kaersutite kaersutite kaersutite kaersutite kaersutite kaersutite kaersutite kaersutite

Appendix 134
Group Sample locality Sample Lithology Source Isotopic Age (Ma)
Tholeiitic La Ese C4-47-88 Basalt de Boer et al 1995 21.61 +/- 1.08Division CR27 tholeiitic Gabbro de Boer et al 1995 31.65 +/- 2.00Division (5-10km S) CR-88-73 Gabbro Berrange & Whittaker 1977 11.4 +/- 0.60C. Kamuk (near Sukut) KAM-052 Gabbro Appel 1990 18.8 +/- 1.60
(amph 22,7 +/- 3,6)F. Costena (Boruca) Gabbro Heywood, 1984 11.1F. Costena (Boruca) Gabbro and 11.6F. Costena (Boruca) Gabbro Woodward-Clyde 1990 13.1F. Costena (Boruca) Gabbro --"-- 14.8
Calc-Alkaline Escazu (C. La Cruz) 72 Monzogabbro-M.Diorite Bergoeing, 1982 5.33 +/- 0.61Escazu CR34 Granodiorite de Boer et al 1995 6.3 +/- 0.24Cerros de Escazu Granodiorite Saenz, 1982 7.2near Empalme PA 4 Andesite with Px Bellon & Tournon 1978 8.3 +/- 0.40El Empalme CR1 Andesite de Boer et al 1995 3.37 +/- 0.08Santa Maria de Dota B-4 Qz Monzogabbro w/ Amph Bergoeing, 1982 9.13 +/- 0.33Tapanti intrusive rock Tournon 1984 9.3Tapanti CR-86-73 Plag-Diorite Berrange & Whittaker 1977 11.5 +/- 0.50Tajo Jaboncillo PA 12 Andesite/Dacite Bellon & Tournon 1978 16.9 +/- 2.50Division CR-87-73 Diorite with Amph Berrange & Whittaker 1977 9.6 +/- 0.40Division (0.5km S) CR-87A-73 Fsp-plutonic rock Berrange & Whittaker 1977 9.3 +/- 0.30Division 49 Quartz-Diorite Bellon & Tournon 1978 8.5 +/- 0.40Division TA 1 Granophyr Bellon & Tournon 1978 10.1 +/- 0.50near Division intrusive rock de Boer 1981, unpublished 9.3 +/- 0.34near Division intrusive rock de Boer 1981, unpublished 9.4 +/- 0.28near Division intrusive rock de Boer 1981, unpublished 10.3 +/- 0.21near Division intrusive rock de Boer 1981, unpublished 10.7 +/- 0.25near Division intrusive rock de Boer 1981, unpublished 11.2 +/- 0.27near Division intrusive rock de Boer 1981, unpublished 12.4 +/- 0.40south of Division CR-87B-73 Plag-plutonic rock Berrange & Whittaker 1977 9.8 +/- 0.40C. Chirripo C4-1-88 Dacite de Boer et al 1995 9.4 +/- 0.47San Isidro (S) C4-6-88 Dacite de Boer et al 1995 11.79 +/- 0.59C. Chirripo 14-3-90 Diorite de Boer et al 1995 9.3 +/- 0.18C. Chirripo 18-3-90 Diorite de Boer et al 1995 7.81 +/- 0.31Buenos Aires CR10 Quartz Monzonite de Boer et al 1995 10.22 +/- 0.20Buenos Aires CR9 Granodiorite de Boer et al 1995 10.37 +/- 0.21south of C. Durika CR8B Gabbro de Boer et al 1995 9.83 +/- 0.23south of C. Durika plutonic rock Ballmann 1976 10.3 +/- 0.50C. Kamuk (3000m asl) KAM-066 Granodiorite Appel 1990 7.9 +/- 0.90
(Bio 9,2 +/- 1,2)(Plag 30,1 +/- 0,9)
C. Aka CR13M Quartz Monzonite de Boer et al 1995 11.05 +/- 0.31El Baru P40 Diorite de Boer et al 1995 31.15 +/- 2.25
Fore Arc Terraba C4-39-88 Andesite de Boer et al 1995 3.56 +/- 0.08Mano de Tigre C3-16-89 Andesite de Boer et al 1995 4.31 +/- 0.07Cerro Mano de Tigre R-3969 Basalt Kesel 1983 5.0 +/- 0.4Paso Real C4-37-88 Basalt de Boer et al 1995 1.25 +/- 0.03
Alkaline C. Coronel, Caribbean C 14 a Basanite Bellon & Tournon 1978 1.2 +/- 0.40Qda. Guayabo, TurrialbaTU13 Alkali Basalt Bellon & Tournon 1978 5.1 +/- 0.75Guayacan, Siquirres S25 Basanite Bellon & Tournon 1978 4.6 +/- 0.25Qda. Terciopelo Teschenite Cassel 1986 4.5 +/- 0.50Rio Chirripo CH-14 Nephelinite Tournon 1984 5.2
Adakite Rio Xikiaria, F. Matama Pc 2c Andesite with Amph Bellon & Tournon 1978 2.4Durika Area de Boer 85 unpublished 0.95 +/- 0.01Durika Area de Boer 85 unpublished 2.8 +/- 0.05San Vito (NW) CR 17A Andesite de Boer et al 1995 1.07 +/- 0.04San Vito (NW) C4-62-88 Andesite de Boer et al 1995 1.1 +/- 0.06San Vito (N) Pc 2c Andesite with Amph Bellon & Tournon 1978 2.6 +/- 0.40San Vito (SE) C4-4-88 Andesite de Boer et al 1995 1.71 +/- 0.09

Acknowledgements 135
Acknowledgements
The present study was sponsored by the German Science Foundation (DFG) under the projectnumber Wo 362/10 and is part of the multidisciplinary TICOSECT research program.
Foremost I am greatly indebted to Prof. Dr. G. Wörner, who initiated this fascinating project,supported me with constructive discussions and prepared a fertile ground for high qualityscientific work. - During our field campaign in 1995 he introduced me to Costa Rican rocks,plants and beaches and gave lessons in white-water rafting and -swimming.
Prof. Dr. B. Hansen has to be thanked for doing the co-referate for my thesis.
I particularly thank Dr. G. I. Alvarado for his intense aid and interest in my field work andfruitful discussions. I want to thank Prof. Dr. S. Kussmaul for his support during my stay inCosta Rica, and for sure I will not forget Luis, Jose, Miguel, Raquel, Adolfo and Mayela whohelped me much during my field work or gave me friendly lodging.
This work profited much from discussions and exchange with Dr. M. Meschede, Prof. M. J.Carr, F. Hauff, Dr. R. Werner, F. Dorendorf.
Dr. B. Bock and P. Bogaard are especially thanked for doing a hard job with criticism of theearlier versions of this thesis.
Many colleges from the Geochemisches Institut Göttingen have to be thanked for supportingme during my lab work and for introducing me to the instruments, among them P.D. Dr. A.Eisenhauer, Dr. K. Simon, Dr. G. Hartmann, Dr. A. Kronz, Dr. E. Gohn, Dr. U. Wiechert, E.Schiffczyk, A. Reitz, L. Reese, R. Przybilla, A. Gerdes, T. Agemar, H. Ehrig.
The geochronological work was made possible thanks to good co-operation with Dr. F.Henjes-Kunst, BGR. I want to thank him and H. Klappert very much for having made my staysuccessful and comfortable.
Finally, I want to thank Catherine, my wife, for her continual encouragement, patience andmoral support.

Lebenslauf 136
LEBENSLAUF
Am 06.11.1966 wurde ich als erstes Kind von Harald Abratis (Diplom-Ingenieur) und GretelAbratis, geb. Müller (Erzieherin) in Oldenburg in Holstein geboren.Seit 1997 bin ich mit der Historikerin Catherine Abratis, geb. Fauconnier verheiratet.
Nach dem Besuch der Grundschule und des Carl-Maria-von-Weber Gymnasiums in Eutin,erwarb ich 1986 meine Allgemeine Hochschulreife.
Im Anschluss an den Wehrdienst, studierte ich von 1987 bis 1988 Chemie an der Christian-Albrechts Universität zu Kiel.Zum Wintersemester 1988/1989 immatrikulierte ich mich an der Georg-August Universität zuGöttingen für das Fach Geologie-Paläontologie. Meine Diplomarbeit mit dem Titel “Geology,Petrology and Geochemistry of Vonarskard, Central Iceland” fertigte ich unter der Betreuungvon Dr. A. Schneider, Prof. Dr. H.-J. Behr und Prof. Dr. G. Sigvaldason am Institut fürGeologie und Dynamik der Lithosphäre an der Universität Göttingen an. Im Februar 1994schloss ich das Studium der Geologie mit der Diplomprüfung ab.
Bis Ende 1994 arbeitete ich in der angewandten Geologie bei der Firma Getec in Dransfeldbei Göttingen.
Seit Oktober 1994 beschäftige ich mich am Geochemischen Institut der Universität Göttingenunter Anleitung von Prof. Dr. G. Wörner mit der vorliegenden Arbeit.