geochemical characterization of chromate contamination in the
TRANSCRIPT

PNNL-17674
Prepared for the U.S. Department of Energy Under Contract DE-AC05-76RL01830
Geochemical Characterization of Chromate Contamination in the 100 Area Vadose Zone at the Hanford Site P.E. Dresel C.C. Ainsworth N.P. Qafoku C. Liu J.P. McKinley E.S. Ilton J.S. Fruchter J.L. Phillips July 2008


PNNL-17674
Geochemical Characterization of Chromate Contamination in the 100 Area Vadose Zone at the Hanford Site P.E. Dresel C.C. Ainsworth N.P. Qafoku C. Liu J.P. McKinley E. Ilton J. Fruchter J.L Phillips July 2008 Prepared for the U.S. Department of Energy under Contract DE-AC05-76RL01830 Pacific Northwest National Laboratory Richland, Washington 99352


Summary
At the Hanford Site, chromate was used throughout the 100 Areas (100-B, 100-C, 100-D/DR, 100-F, 100-H, and 100-K) as a corrosion inhibitor in reactor cooling water. Chromate was delivered to various water treatment plants in rail cars, tanker trucks, barrels, and local pipelines as dichromate granular solid or stock solution. Chromate was inevitably discharged to surface or near-surface ground through spills during handling, pipeline leaks, or during disposal to cribs.
The major objectives of this study were to 1) determine the leaching characteristics of hexavalent chromium [Cr(VI)] from contaminated sediments collected from 100 Area spill sites; 2) elucidate possible Cr(VI) mineral and/or chemical associations that may be responsible for Cr(VI) retention in the Hanford Site 100 Areas through the use of macroscopic leaching studies, and microscale characterization of contaminated sediments; and 3) provide information to construct a conceptual model of Cr(VI) geochemistry in the Hanford 100 Area vadose zone that can be used for developing options for environmental remediation.
In addressing these objectives, additional benefits accrued were as follows: 1) a more complete understanding of Cr(VI) entrained in the vadose zone that can be utilized in modeling potential Cr(VI) source terms; and 2) accelerating the 100 Area Columbia River Corridor cleanup by providing valuable information to develop remedial action based on a fundamental understanding of Cr(VI) vadose zone geochemistry.
A series of column experiments were conducted with contaminated and uncontaminated sediments to study Cr(VI) desorption patterns in aged and freshly contaminated sediments; evaluate the transport characteristics of dichromate liquid retrieved from old pipelines in the 100 Area; and estimate the effect of strongly reducing liquid on the reduction and transport of Cr(VI). Column experiments used the <2-mm fraction of the sediment samples and simulated Hanford Site groundwater solution. Periodic stop-flow events were applied to evaluate the change in elemental concentration during time periods of no flow and greater fluid residence time. The results were fit using a two-site, one-dimensional reactive transport model.
Sediments were characterized for the spatial and mineralogical associations of the contamination using an array of microscale techniques including X-ray diffraction, scanning electron microscopy, energy dispersive spectroscopy, X-ray photoelectron spectroscopy, X-ray microprobe, and X-ray absorption near-edge structure.
The following are conclusions and implications:
1. Results from column experiments indicated that most of the contaminant chromium traveled quickly through the sediments and appeared as Cr(VI) in the effluents. However, the fine-grained surface coatings on sediment clasts acted as a porous but restricted medium that was accessible to chromate by diffusion from migrating chromate-laden water.
2. The Cr(VI) concentration remained above the drinking water standard of 100 μg/L for many pore volumes. However, the significance of this for groundwater concentrations would depend on the mass flux of recharge to the water table.
iii

iv
3. Adsorption of Cr(VI) to sediments from spiked Cr(VI) solution was low; calculated retardation coefficients were close to one. During desorption experiments, sediment-dependent tailing was observed.
4. Results from column experiments conducted with a strong reductant, such as calcium polysulfide solutions, to characterize and measure solution and sediment reductive capacity, indicated that Cr(VI) reduced only partially to Cr(III). However, a significant amount of the Cr(VI) was mobilized ahead of the polysulfide solution front under the tested flow conditions. This may have significant implications for in-situ reductive remediation techniques. The experiments suggest that it would be difficult to design a remedial measure using infiltration of liquid phase reductants without increasing transport of Cr(VI) toward the water table.
5. The microscopic characterization results were consistent with the column studies. Cr(VI) was found as ubiquitous coatings on sediment grain surfaces. Small, higher concentration chromium sites were associated with secondary clay mineral inclusions, with occasional barium chromate minerals, and reduced to Cr(III) in association with iron oxides that were most likely magnetite primary minerals. Within the restricted-access domains of sediment matrix, ferrous iron could also diffuse from in situ, high-surface-area minerals to cause the reductive immobilization of chromate. This process may be favored at microscale geochemical zones where ferrous iron could be supplied. Once nucleated, micrometer-scale precipitates are favored as growing locales for further accumulation, causing the formation of discrete zones of Cr(III).
6. In summary, results indicated that at least four pools of Cr(VI) with different leaching behavior are present in the tested contaminated sediments.
a. The first pool contains the majority of the Cr(VI) mass (over 95% of chromium total mass based on model calculations) in a highly mobile form that is easily removed from the contaminated sediments in the first pore volumes of leaching experiments.
b. The second pool represents Cr(VI) material held in physical and mineralogical remote sites that provide a longer-term continuing source of contaminant chromium.
c. The third pool consists of reduced Cr(III) most likely by surface-mediated redox reaction of aqueous Cr(VI) and Fe(II) bearing soil minerals present in the sediments. This pool does not contribute to the transport of contaminant chromium through sediments.
d. The fourth pool is comprised of Cr(VI) in the form of BaCrO4 that most likely precipitated out of the oversaturated soil solution. Under the tested conditions, BaCrO4 is insoluble and does not contribute to the overall transport of Cr(VI).

Acronyms
bgs below ground surface
BTC breakthrough curve
CPT cone penetrometer
Cr(III) trivalent chromium (the most common valence state in natural sediments)
Cr(VI) hexavalent chromium (the valence state of chromate and dichromate)
DOE U.S. Department of Energy
EDS energy dispersive spectroscopy
EMP electron microprobe
EPA U.S. Environmental Protection Agency
ISRM in situ redox manipulation
MCL maximum contaminant level
PDF powder diffraction files
PNNL Pacific Northwest National Laboratory
redox reduction/oxidation
SEM scanning electron microscopy
SF stop-flow
SGW synthetic groundwater
XANES X-ray absorption near-edge structure
XMP X-ray microprobe
XPS X-ray photoelectron spectroscopy
XRD X-ray diffraction
WMA waste management area
WCH Washington Closure Hanford
WIDS Waste Inventory and Disposal System
v


Contents
Summary ........................................................................................................................................... iii Acronyms............................................................................................................................................v 1.0 Introduction .............................................................................................................................1.1
1.1 Background .....................................................................................................................1.1 1.2 Overall Objectives...........................................................................................................1.2 1.3 Hanford Site History .......................................................................................................1.2 1.4 Geologic Setting and Sediment Mineralogy ...................................................................1.3 1.5 Groundwater Contamination ...........................................................................................1.4 1.6 Waste Sources and Vadose Zone Contamination............................................................1.5 1.7 Chromium Geochemical Behavior at the Hanford Site...................................................1.6
2.0 Sample Collection and Characterization .................................................................................2.1 2.1 Near-Surface Sample Collection.....................................................................................2.1 2.2 100-B Area Borehole Samples ........................................................................................2.1 2.3 100-D Area Uncontaminated Sediments.........................................................................2.2 2.4 Dichromate Pipeline Liquid ............................................................................................2.2 2.5 Sample Characterization .................................................................................................2.2
2.5.1 Size-Fraction Characterization .............................................................................2.2 2.5.2 Meso-Scale (Mineralogical) Characterization......................................................2.2 2.5.3 Laboratory Analysis .............................................................................................2.2 2.5.4 Results ..................................................................................................................2.3
2.6 Summary of Sample Collection and Characterization ...................................................2.3 3.0 Transport Studies.....................................................................................................................3.1
3.1 Introduction .....................................................................................................................3.1 3.2 Materials and Method......................................................................................................3.1
3.2.1 Column Experiment Methodology.......................................................................3.1 3.2.2 Leaching Solutions...............................................................................................3.2 3.2.3 Chemical Analyses...............................................................................................3.2 3.2.4 Transport Parameters Calculation ........................................................................3.2 3.2.5 Reactive Transport Modeling of Cr(VI) Desorption ............................................3.3
3.3 Results and Discussion....................................................................................................3.4 3.3.1 Cr(VI) Transport Behavior and Overall Mobility ................................................3.4 3.3.2 Role of Aging, Initial Cr(VI) Concentration, and Mineralogical, Physical and
Chemical Properties .............................................................................................3.5 3.3.3 Modeling Results..................................................................................................3.7 3.3.4 Results from Four Additional Small Column Experiments .................................3.8 3.3.5 Cr(VI) Adsorption in Uncontaminated Sediments and Desorption from
Short-Term Contaminated Sediments ..................................................................3.8
vii

3.3.6 Cr(VI) Desorption from Two Borehole Contaminated Sediments.......................3.9 3.3.7 Cr(VI) Reaction with Strong Reductant Solutions.............................................3.10 3.3.8 Effluent Solution Composition...........................................................................3.10
3.4 Summary of Transport Experiment Results ..................................................................3.11 4.0 Microscopic Investigation of Sediments: Chromium Spatial Distribution.............................4.1
4.1 Introduction .....................................................................................................................4.1 4.2 Materials and Methods ....................................................................................................4.1
4.2.1 X-Ray Microprobe and X-Ray Absorption Near Edge Structure Measurements 4.1 4.2.2 Scanning Electron Microscopy and Energy Dispersive Spectrometry Analyses
and Measurements................................................................................................4.2 4.2.3 X-Ray Photoelectron Spectroscopy Measurements .............................................4.2
4.3 Microscale Investigation Results and Discussion ...........................................................4.2 4.3.1 X-Ray Microprobe Elemental Maps, X-Ray Absorption Near Edge Structure
Speciation, and Chromium Distribution Within Sediment Matrix.......................4.2 4.3.2 Scanning Electron Microscopy and Energy Dispersive Spectrometry
Measurements.......................................................................................................4.3 4.3.3 Results from X-Ray Photoelectron Spectroscopy Measurements........................4.4 4.3.4 Summary of Microscale Characterization ............................................................4.5
5.0 Conclusions .............................................................................................................................5.1 6.0 References ...............................................................................................................................6.1 Appendix A - Results from the XRD and SEM Analyses ..............................................................A.1 Appendix B - Results from SEM Analyses Performed in Post-Treatment Sediments Exposed to
Calcium Polysulfide Concentrated Liquids............................................................. B.1
viii

Figures
1.1. Cr(VI) Concentration Data with Depth from Sediment Beneath the 100-C Process Water Treatment Plant Head House (dashed line denotes shift from backhoe excavation to borehole sample collection; Figure 1a is an expanded view of borehole collected data) Site Description...............................................................................................................................1.8
1.2. Location of the Hanford Site Showing Groundwater Chromium Contamination at the 100 Areas .................................................................................................................................1.9
1.3. Generalized Stratigraphy of the Hanford Site........................................................................1.10 1.4. Hydrologic Units Present at the Water Table of the Hanford Site.........................................1.11 1.5. Results of Cr(VI) Sampling from Borehole C4957, Located Near the 183-C Water
Treatment Facility .................................................................................................................1.12 2.1. 100-B/C Area Chromium Sampling Sites................................................................................2.8 2.2. Location B is at the Bottom of a Previous Excavation ............................................................2.9 2.3. Rocks Stained Yellow About 2 ft Below the Surface at Location B2 .....................................2.9 2.4. The Site D Sampling Location was at a Pipeline Rupture at the Northern Terminus of an
Excavation that was Under the Head House of the Water Processing Plant Associated with the 100-C Reactor (Figure 2.3) ..............................................................................................2.10
2.5. Results from the X-Ray Diffraction Analyses in the <53-µm Fraction of the Sediments .....2.11 3.1. Cr(VI) Desorption Profiles in Sediment D and B2................................................................3.20 3.2. Leaching Profiles of Two Contaminated Hanford Site Sediments. .......................................3.21 3.3. Br Transport in Columns 3, 4, 5, and 6..................................................................................3.23 3.4. The Results from Fitting the Two-Site (two-region) Model to the Experimental Data of
Column Experiments 3, 4, 5, and 6........................................................................................3.24 3.5. Results from Four Column Experiments (column 7, 8, 9, and 10) ........................................3.25 3.6. Br and Cr(VI) Breakthrough Curves in Column 11 (sediment PNNL 003) ..........................3.26 3.7. Br and Cr(VI) Breakthrough Curves in Column 12 (sediment PNNL 004) ..........................3.27 3.8. Br and Cr(VI) Breakthrough Curves in Columns 13 (sediment PNNL 003) and 14 (sediment
PNNL 004).............................................................................................................................3.28 3.9. Cr(VI) Desorption Profiles Obtained in Column 11 (A), 12 (B), 13 (C), and 14 (D) After
Injection of the Cr(VI) Input Solution Followed by the Cr(VI)-Free Input Solution ............3.29 3.10. Cr(VI) Desorption Profiles from Two Borehole Sediments (column 15 and 16)..................3.31 3.11. Cr(VI) Desorption in the Columns Leached with Synthetic Groundwater and Calcium
Polysulfide .............................................................................................................................3.32 4.1. XMP Elemental Abundance Maps for Sediments A2 (old spill, 134 mg Cr kg-1), B2 (old
spill, 476 mg Cr kg-1), and D (new spill, 824 mg Cr kg-1) Before Leaching .........................4.11 4.2. XMP Elemental Abundance Maps for Sediment 71-1 and 72-1............................................4.13 4.3. XMP Elemental Mapping Taken in the Samples of Sediment A2, B2, D, After Leaching
with 5 Pore Volume of a Synthetic Groundwater Water .......................................................4.16 4.4. XANES Measurements in Sediment D Before Leaching ......................................................4.19
ix

x
4.5. Chromium XMP Elemental Mapping and Micro-XANES Analyses Performed in a Sample of Sediment 71-1 Showing the Presence of Insoluble Cr(III)................................................4.20
4.6. Chromium XMP Elemental Mapping and Micro-XANES Analyses Conducted in Samples of Sediment B2 and D After Leaching with 5 Pore Volumes of a Cr-Free Synthetic Groundwater. .........................................................................................................................4.22
4.7. SEM Micrographs and XMP Elemental Mapping Taken in a Sample of Sediment D Before Leaching.................................................................................................................................4.23
4.8. SEM Micrographs of Regions A, B, and C Depicted in Figure 4.7 (sediment D).................4.24 4.9. SEM Image of Sediment 71-1................................................................................................4.25 4.10. SEM Image and EDS Spectrum of the Soil Particle of Area A in Figure 4.7.......................4.26 4.11. SEM Image and EDS Spectrum of the Soil Particle of Area B in Figure 4.7........................4.27 4.12. EDS Spectra Collected in the Boxed Areas K and F of Figure 4.7. .....................................4.28 4.13. SEM Image (up) of a Sample from Sediment B2 Leached with 5 Pore Volume of a Cr-Free
Synthetic Groundwater. .........................................................................................................4.29 4.14. XPS of One Spot in the Sample of Sediment D Before Leaching Showing Progressive
Reduction of Cr6+ to Cr3+ with Increasing Beam Exposure ................................................4.30 4.15. XPS of the Sample of Sediment D After Leaching Showing Lower Chromium Signal and
Higher Cr3+:Cr6+ Ratio ........................................................................................................4.31 4.16. XPS Measurement of a Sample of Sediment D Before Leaching. ........................................4.32
Tables 2.1. Water Content and Cr(VI) Concentration of Samples from Excavations in the 100-B Area ..2.5 2.2. Macroscopic Studies: Pore-Water Anion Analyses(a) .............................................................2.5 2.3. Inductively Coupled Plasma Optical Emissions Spectroscopy Analysis: Macroscopic
Studies Samples: Pore-Water Cation Analysis .......................................................................2.6 2.4. Sediment Size-Fractions Separated from Some Sediments Used During
These Investigations ................................................................................................................2.7 3.1. Composition of the Synthetic Groundwater Used in the Chromium and Bromine Leaching
Experiments ...........................................................................................................................3.12 3.2. Selected Measured and Calculated Physical Properties in Column Experiments 1, 2, 3, 4, 5,
and 6.......................................................................................................................................3.13 3.3. Cr(VI) Release Rates During the Stop-Flow Events Applied in Column Experiments 3, 4, 5,
and 6.......................................................................................................................................3.14 3.4. Results from Modeling the Cr(VI) Desorption Data Using a Two-Site Equilibrium and
Kinetic Model ........................................................................................................................3.15 3.5. Selected Measured and Calculated Physical Properties in Columns 7, 8, 9, and 10 .............3.16 3.6. Selected Measured and Calculated Physical Properties in Each Column..............................3.17 3.7. Cr(VI) Release Rates During the Stop-Flow Events Applied in Column Experiments 11, 12,
13, and 14...............................................................................................................................3.18 3.8. Effluent Composition at Different Times During Leaching in Different Column
Experiments ...........................................................................................................................3.19 4.1. X-Ray Photoelectron Spectroscopy .........................................................................................4.6

1.0 Introduction
1.1 Background
Hexavalent chromium [Cr(VI)] is a groundwater contaminant at numerous U.S. Department of Energy (DOE) sites across the nation. Chromate (CrO4
-2) is one of the major contaminants of concern near the Columbia River at the Hanford Site. Chromate is a highly mobile form of Cr(VI), which has higher toxicity than reduced forms such as trivalent chromium. In particular, aquatic water quality criteria are lower than drinking water standards. A water quality criterion of 11 µg/L is currently applied in remediation decision making, and the drinking water standard is 100 µg/L (or 0.1 mg/L).
Sodium dichromate (Na2Cr2O7•2H2O) was used throughout the 100 Areas (100-B, 100-C, 100-D/DR, 100-F, 100-H, and 100-K) as a corrosion inhibitor in reactor cooling water at concentrations of 2.0 mg/L (0.7 mg/L as Cr) (Foster 1957). After passing through the reactor, cooling water was transported through large-diameter underground pipes to retention basins for thermal and radioactive cooling prior to release to the Columbia River.
Until approximately 1953, the sodium dichromate solutions were made up in a batch system using 100-lb bags of granular dichromate manually hoppered into large (~3600 gal) tanks to obtain a final solution concentration of 15% Na2Cr2O7 by weight (wt) (Whipple 1953). After 1953, 70% by wt Na2Cr2O7 solutions were delivered to the site, stored in large tanks, and diluted as required (Schroeder 1966). These concentrated solutions were delivered to various water treatment plants in rail cars, tanker trucks, barrels, and local pipelines as stock solutions.
The solid and concentrated dichromate solutions were inevitably discharged to surface or near-surface ground through spills during handling, pipeline leaks, or discarded to cribs. While the exact acidity of Hanford Site chromate stock solutions is not well known, a 10% Na2Cr2O7 (0.82 mol L-1 Cr) has a pH of 3.5, and a 70% Na2Cr2O7 (8.96 mol L-1 Cr) will be lower (~1.5 to 2). Additional chromate was discharged to the environment from decontamination operations, likely after mixing with sulfuric acid to form chromic acid (Peterson et al. 1996b). The pH of these solutions, buffering capacity, and counter-ion concentration is critical to Na2Cr2O7 solution vadose zone geochemistry, and may determine leaching characteristics of the Cr(VI) .
One example of Cr(VI) in the vadose zone was discovered in the 100-C Area after removal of the 100-C process water treatment head house. Below the concrete slab, a patch of yellow, stained soil was observed at approximately 15-ft below ground surface (bgs). The sediment was excavated with a backhoe to approximately 32 ft with Cr(VI) analysis at about 1-ft intervals (Figure 1.1). At this point, a borehole was sunk approximately 10- to 15-ft east of the excavation site all the way to groundwater (~80 ft bgs). From the shape of the depth versus Cr(VI) plot in Figure 1.1, it appears the borehole missed or just caught the edge of the upper part of the vadose zone plume until about 60 ft (the insert in Figure 1a is an enlargement of the 40- to 88-ft section of the borehole). Other examples of small vadose zone plumes have been found and remediated. While these small-spill sites and associated data clearly indicate that Cr(VI) is being retained in the vadose zone and possibly connected to the groundwater, the mechanism(s) by which Cr(VI) is retained is not well understood.
1.1

In the 100-D Area, chromate concentrations at >4000 µg/L have been measured in the groundwater, indicating the chromate is from a more concentrated source than the cooling water. In addition, chromate concentrations upgradient of the in situ redox manipulation (ISRM) barrier have remained high since the plume was discovered in 1999, indicating there is a chromate source associated with the vadose zone. Understanding the nature of the vadose zone contamination is important to evaluating options for remediation and protection of groundwater and environmental receptors.
1.2 Overall Objectives
The research was conducted with the following primary objectives:
1. Determine leaching characteristics of Cr(VI) from contaminated sediments collected in the 100 Areas at the Hanford Site.
2. Elucidate possible Cr(VI) mineral and/or chemical associations that may be responsible for Cr(VI) retention through the use of a) macroscopic desorption studies, and b) microscale characterization of contaminated sediments.
3. Collect experimental data to develop a conceptual model of Cr(VI) geochemistry in the Hanford Site’s 100 Area vadose zone to provide a basis for testing and selecting potential remedial measures.
These objectives were based on locating and obtaining contaminated sediment with depth and at varying Cr(VI) concentrations as researchers hypothesized that mineral/chemical-Cr(VI) associations should be related to the total chromium concentration and other master geochemical variables (e.g., pH, counter-cation type and concentration, and water content). In addressing these objectives, additional benefits accrued will be 1) a fuller understanding of Cr(VI) entrained in the vadose zone that can be utilized in modeling potential Cr(VI) source terms; and 2) accelerating the 100 Area Columbia River Corridor cleanup by developing remedial action based on a fundamental understanding of Cr(VI) vadose zone geochemistry.
A number of geochemical processes may affect the mobility of Cr(VI) in the vadose zone. These include reduction/oxidation (redox), sorption, and mineral precipitation or coprecipitation in other mineral phases. This study presents site-specific data on the geochemical form and mobility of Cr(VI) contamination in Hanford Site vadose zone sediments from the 100 Areas where reactor operations occurred along the Columbia River. Column-transport studies using contaminated sediments and spiked uncontaminated sediments were used to assess transport characteristics. Several microscopic-scale techniques were also used to identify the physical form of Cr(VI) in the sediments and the valence state.
1.3 Hanford Site History
The DOE’s Hanford Site is located in south-central Washington State. The Hanford Site produced plutonium for the government’s weapons programs between 1944 and 1989 (Figure 1.2). A series of graphite-moderated nuclear reactors in the 100 Areas along the Columbia River in the northern part of the site irradiated uranium fuel, producing plutonium and byproduct radionuclides. Plutonium was chemically extracted from the irradiated fuel in the 200 Areas, located in the central part of the site. The 300 Area, in the southeast, was used for production of fuel rods and research purposes.
1.2

Nine nuclear reactors operated at the Hanford Site during its operational period; an overview of reactor operations is provided in Gerber (1996). The reactors in the 100-B Area (also referred to as the 100-B/C Area), the 100-K Area, 100-D Area, 100-H Area, and 100-F Area used single-pass cooling water. Columbia River water was treated to remove particulate matter, and a corrosion inhibitor was added to the water prior to passing it through cooling tubes surrounding the fuel rods. The water was typically retained in retention basins for thermal cooling and to allow short-lived radionuclides to decay prior to discharge back to the Columbia River. The 100-N Reactor recirculated its cooling water. In addition to discharges of the cooling water, discharges from cleaning “purges” for the reactor tubes and discharges from fuel element failures also occurred. Liquid waste disposal facilities, such as cribs or trenches, were used to prevent discharge of higher-activity water directly to the Columbia River.
Chromate was used extensively in Hanford Site production operations. It was primarily used as a corrosion inhibitor in the reactor cooling water, for valence state manipulation during separations processes, and for equipment decontamination. The corrosion inhibitor consisted of sodium dichromate (Na2Cr2O7·2H2O) added to the cooling water to produce a chromate concentration of 2.0 mg/L or approximately 700 μg/L as Cr(VI) (Foster 1957). The dichromate originally was delivered to the Hanford Site in granular form but later was delivered in railcars of 70% liquid dichromate solution (Foster 1957, Pearl and Whipple 1953, Whipple 1953). Cooling water leaked from the piping and retention basins, producing groundwater contamination. Other contamination was produced from leaks and spills of the stock dichromate solid and liquid. Additional chromate was discharged to the environment from decontamination operations likely after mixing with sulfuric acid to form chromic acid (Peterson et al. 1996b).
1.4 Geologic Setting and Sediment Mineralogy
The Hanford Site is located in the Pasco Basin of south-central Washington State. Numerous reports on Hanford Site geology and hydrogeology have been published. Reports relevant to the 100 Areas include the following publications and references therein: Delaney et al. (1991), Hartman (2000), Horton et al. (2001, 2002), Lindberg (1995), Lindsey (1995), Peterson et al. (1996b), Reidel and Chamness (2007), Spane and Webber (1995), and Thorne et al. (1993). A general stratigraphy of the site is shown in Figure 1.3. The stratigraphic column on the left groups the formations into hydrologic units for the purposes of groundwater flow modeling and interpretation; the column on the right presents a more depositional-lithologic based organization. The unconfined aquifer under the Hanford Site 100 Areas occurs in the Hanford and Ringold Formation sands and gravels. The hydrologic unit present at the water table is shown in Figure 1.4. The vadose zone in the 100 Areas is almost entirely in the Hanford formation.
The informally named Hanford formation consists of deposits from a series of cataclysmic floods during the Pleistocene Age. The floods occurred when ice dams broke, releasing water from Lake Missoula, a large glacial lake that formed in the Clark Fork River valley. Flood episodes may have occurred as many as 40 times, with the released water spreading across eastern Washington State. The floodwaters collected in the Pasco Basin and formed Lake Lewis, which is estimated to have drained in about a week through the gap in the Horse Heaven Hills called Wallula Gap (Allison 1933). Three principal types of deposits were left behind by the floods:
• high-energy deposits consisting of gravel
1.3

• low-energy slackwater deposits consisting of rhythmically bedded silt and sand of the Touche Beds
• coarse- to fine-sand deposits, representing an energy transition environment.
Fluvial pre-Missoula (flood) gravels underlie the Hanford formation gravel deposits in the central part of the Hanford Site. The pre-Missoula deposits are difficult to distinguish from the Hanford formation gravels, so they are usually grouped together. Gravel-dominated strata consists of coarse-grained sand and granule to boulder gravel that display massive bedding, plane to low-angle bedding, and large-scale cross-bedding in outcrop. Matrix is commonly lacking from the gravels, giving them an open framework appearance. The sand-dominated faces consists of fine- to coarse-grained sand and granules that display plane lamination and bedding and, less commonly, plane and trough cross-bedding in outcrop. Small pebbles and pebbly interbeds (less than 20-cm thick) may be encountered. The silt-dominated facies consists of silt and fine- to coarse-grained sand that form normally graded rhythmites. Plane lamination and ripple cross-lamination are common in outcrop (Hartman 2000).
The Hanford Site vadose zone material (Hanford and upper Ringold Formations) is characterized by Pleistocene-age, catastrophic flood deposits, and riverine and lucustrine deposits, respectively, with very low natural organic matter content. While sediment texture varies with depth (from coarse to silty sand), X-ray diffraction (XRD) and optical microscopic analyses indicate that sediment mineral composition remains relatively constant from the upper to lower Hanford formation. The sand mineralogy is dominated by quartz, plagioclase, hornblende, and mica (muscovite, biotite) with minor magnetite, orthoclase, ilmenite; and the silt and clay mineralogy contains micas, vermiculite, chlorite (clinochlore), and ferrigenous biedellite (Serne et al. 2001). The natural pH of these sediments ranges between pH 7.5 to 8.5 in the absence of caliche, which is found occasionally in the Hanford formation. At neutral and alkaline pH, chromate is reported to move nearly unretarded (no adsorptive retardation) through the sediments of the Hanford vadose and saturated zones (Ginder-Vogel et al. 2005, Poston et al. 2001, Fruchter et al. 2000).
1.5 Groundwater Contamination
Chromate contamination is found at levels above drinking water standards (100 μg/L) in the 100-K Area, 100-D Area, and 100-H Area and at lower concentrations in the 100-B Area, 100-N Area, and 100-F Area (Hartman et al. 2007). The highest groundwater concentrations are found in the 100-D Area, with concentrations greater than 1500 μg/L in 2006. Concentrations considerably less than the drinking water standard are also of concern because the Washington State ambient water quality standard for chronic exposure is 11 μg/L for aquatic biota. An interim remedial action goal for groundwater contamination has been set at 20-22 μg/L under the Comprehensive Environmental Response, Liability, and Compensation Act of 1980 (CERCLA). Groundwater pump-and-treat systems are active for chromate remediation in the 100-K, 100-D, and 100-H Areas. At the 100-D Area, chromate contamination is also being treated by ISRM (Hartman et al. 2007, DOE-RL 2006).
The persistence of groundwater chromate contamination indicates ongoing sources from the deep vadose zone (DOE-RL 2006). Ongoing drainage of reactor cooling water discharged to the vadose zone is one possible contaminant source (Peterson et al. 1996b). However, groundwater chromate concentrations found in the 100-D Area at levels greater than that in the cooling water and the contaminant distribution in the 100-D, 100-K, and other areas implicate dichromate leaks or spills and/or
1.4

liquid waste disposal facilities as likely additional continuing vadose zone sources for groundwater contamination (Hartman et al. 2007, Peterson et al. 1996b, Rohay et al. 1999).
1.6 Waste Sources and Vadose Zone Contamination
Potential waste and vadose zone sources for groundwater chromate contamination have been identified through process documents and field characterization (e.g., Carpenter and Cote 1994, Connelly 1997, Lerch 1998, Peterson et al. 1996b, Thornton 1992).
The Waste Inventory and Disposal System (WIDS) is a database of Hanford Site waste sites and related characteristics; this database is maintained by the site operating contractor. Shallow vadose zone chromate contamination; i.e., < ~6 m bgs has been found in the vicinity of offloading facilities for solid or liquid sodium dichromate, near water treatment plants, and along underground dichromate pipelines.
Location of vadose zone chromate contamination through sampling campaigns has been extremely difficult in the 100 Areas, particularly for the deep vadose zone. For example, no vadose zone contamination has been definitively associated with the groundwater plumes in the 100-D Area, even though the groundwater contamination is more extensive and reaches higher concentrations than in other areas. Researchers investigated an area near the 183-DR Water Treatment Facility in the 100-D Area and found a maximum of 0.5 mg/kg hexavalent chromium contamination; one area of discolored near-surface soil contained elevated total chromium, ~650 mg/kg (Thornton et al. 2000).
Subsequent work did not identify significant chromate contamination, although one sample collected at a depth of ~68 ft contained 0.13 mg/kg of hexavalent chromium and ~132 mg/kg of total chromium (Thornton et al. 2001).
Test pits excavated to 3-5 m bgs were sampled for water extractable hexavalent chromium at targeted sites in the 100-D Area without finding major areas of soil contamination. The maximum hexavalent chromium concentration detected was 18.4 mg/kg, with most samples less than 2 mg/kg (Lerch 1998). Sampling conducted along rail lines between the 183-DR Water Treatment Facility and 100-D-12 sodium dichromate transfer station also did not identify major soil contamination; the maximum concentration was 3.8 mg/kg of hexavalent chromium in one sample (Anselm et al. 2004).
Elevated levels of hexavalent chromium were detected down to the water table in a borehole drilled at the 100-C-7 site in the 100-B Area (Thompson 2007). This borehole was drilled within an area of prior near-surface remediation north of the 183-C headhouse, part of the water filtration and treatment plant for the 100-C and 100-B Reactors. An area of yellow, stained soil was noted in this area and appeared to be associated with chemical storage tanks used for sodium dichromate and for sulfuric acid. During excavation, hexavalent chromium concentrations up to 1620 mg/kg were detected down to the bottom of a test pit at a depth of ~10 m. Borehole C4957 was drilled to provide deep vadose zone characterization but was inadvertently located approximately 10 m northeast of the high concentration chromate after emplacing gravel to stabilize the location for the drill rig. The borehole encountered lower levels of hexavalent chromium contamination with a maximum of 112 mg/kg at a depth of ~20 m bgs and ~5.5 m above the water table (Figure 1.5). However, the contamination at depth is higher than recorded in most other characterization boreholes. No samples from the C4957 borehole were available for characterization by this project.
1.5

1.7 Chromium Geochemical Behavior at the Hanford Site
The sediments used for this investigation were collected near the ground surface in the 100 Area at the Hanford Site. As described in Section 1.4, the sand mineralogy of these sediments is dominated by quartz, plagioclase, hornblende, and mica (muscovite, biotite) with minor magnetite, orthoclase, ilmenite; and the silt and clay mineralogy contains micas, vermiculite, chlorite (clinochlore), and ferrigenous biedellite. The natural pH of these sediments ranges between pH 7.5 to 8.5 in the absence of caliche, which is found occasionally in the Hanford formation.
Chromate (CrO42-) is a highly mobile oxyanion, and a mutagen, teratogen, and carcinogen. Three
mechanisms of aqueous Cr(VI) attenuation are possible in the sediments: adsorption (partition) to soil minerals, precipitation and formation of solid phases, and reduction to less mobile trivalent chromium [Cr(III)] phases.
Previous studies demonstrated that CrO42- formed a relatively weak outer-sphere surface complex,
and adsorption of this anion was suppressed by other co-anions⎯mainly NO3-, HCO3
-, SO42- (Zachara
et al. 1987, Zachara et al. 1988).
For this reason, Cr(VI) retardation via adsorption is unlikely to occur under the conditions of the Hanford Site vadose zone. At neutral and alkaline pH, chromate moves nearly unretarded (no adsorptive retardation) through the sediments of the Hanford Site vadose and saturated zones (Ginder-Vogel et al. 2005, Poston et al. 2001, Fruchter et al. 2000).
Investigations of CrO42- contamination in the Hanford Site vadose zone sediment beneath the
SX Tank Farm revealed evidence of formation of soluble CrO42- salts that would not normally form in an
aqueous environment (Zachara et al. 2004). These sediments were exposed to originally caustic Cr(VI) waste solutions for decades, and when leached with a 0.5 mol L-1 solution, showed that a fraction of the Cr(VI) present (between 15% and 43%) was either adsorbed or precipitated, and resistant to leaching (Zachara et al. 2004).
High concentrations of CrO42- may induce precipitation of a moderately soluble mineral (hashemite:
BaCrO4) and/or the formation of the lower solubility solid solution of BaCrO4-BaSO4 (Rai and Zachara 1986, Rai et al. 1989). These phases may control Cr(VI) solubility and mobility in aged contaminated sediments. A single SX-108 tank sediment leached with a 0.5 mol L-1 solution exhibited a CrO4
2- release profile that could be fit to a nonreactive transport model, suggesting that all the CrO4
2- associated with this particular sediment was freely soluble and unretarded. The CrO4
2- was possibly held in the sediment by matrix forces, or as a very soluble salt like sodium chromate whose precipitation was induced by low-water potential and high sodium and CrO4
2- concentrations.
Conditions under which sediments at the SX Tank Farm and the 100 Areas were exposed to CrO42-
contamination are substantially different; however, retention of CrO42- in the vadose zone does occur.
The mechanism(s) associated with the 100 Area CrO42- retention may be of a similar nature to those
observed in the aforementioned study (Zachara et al. 2004).
Another attenuation pathway is the reduction of Cr(VI) to Cr(III) that can occur in the presence of aqueous and sorbed Fe(II), reduced sulfur compounds, soil organic matter, and via microbial processes
1.6

(Ginder-Vogel et al. 2005 [and references therein], Fendorf and Li 1996, Fendorf et al. 2000), although Cr(VI) in arid sediments remains poorly described and understood.
The Hanford Site vadose zone is an oxic, very low organic carbon content oligotrophic environment, and any substantive microbial reduction of Cr(VI) requires major additions of both NO3
- and organic carbon (Oliver et al. 2003). While there are Fe(II)-bearing minerals present in the Hanford formation and upper Ringold Formations, Ginder-Vogel et al. (2005) demonstrated no retardation of Cr(VI) occurred in these sediments except after pretreatment with a strong acid (0.5 mol L-1 HCl).
Similar studies with these sediments demonstrated no Cr(VI) retardation in the absence of a strong base (simulating the leaching of highly alkaline, saline underground storage tank leaks) (Qafoku et al. 2003, 2007; Zachara et al. 2004). In these studies, Fe(II) solubilized by mineral dissolution (acid or base) subsequently reduced Cr(VI) to Cr(III). Hence, low pH stock dichromate solutions spilled and/or discharged to the ground could result in solubilization of ferrous iron from dissolution of Fe(II)-bearing mineral phases.
As the pH of an infiltrating Na2Cr2O7 solution is neutralized, the potential for Fe(II) solubilization and CrO4
-2 reduction becomes limited. Retention of CrO4-2 in the vadose zone would require other physico-
chemical processes. While there is little or no mechanistic data related to Cr(VI) retardation in the oxic vadose zone or aquifer sediments in the 100 Areas of the Hanford Site prior to this study, vadose zone retention of CrO4
-2 in the 100 Areas of the Hanford Site may from physical matrix potential effects that hold CrO4
-2 contaminated pore water against gravimetric force. With time (up to 40 or 50 years), water content reduces to more typical vadose zone conditions (~15% by wt), thereby creating conditions under which normally very soluble and slightly soluble CrO4
-2 phases form. These soluble forms could then act as continual sources of groundwater CrO4
-2 contamination.
1.7

40 60 80 100
Approximate groundwater level
Figure 1a
90 80 70 60504030
120100806040200
200 0
-20
2000
1500 C
r(V
I) (m
g kg
-1)
1000
500
Depth (ft bgs)
Figure 1.1. Cr(VI) Concentration Data with Depth from Sediment Beneath the 100-C Process Water Treatment Plant Head House (dashed line denotes shift from backhoe excavation to borehole sample collection; Figure 1a is an expanded view of borehole collected data) Site Description
1.8

Figure 1.2. Location of the Hanford Site Showing Groundwater Chromium Contamination at the
100 Areas (Source: Hartman et al. 2006)
1.9

Figure 1.3. Generalized Stratigraphy of the Hanford Site (Source: Hartman 2000)
1.10

Figure 1.4. Hydrologic Units Present at the Water Table of the Hanford Site (Source: Hartman 2000)
1.11

1.12
C49570
5
10
15
20
25
30
0 50 100 150
Cr(VI), mg/kg
Dep
th, m
Water Table
Figure 1.5. Results of Cr(VI) Sampling from Borehole C4957, Located Near the 183-C Water Treatment
Facility (Source: Thompson 2007)

2.0 Sample Collection and Characterization
Samples for this study were collected from active source operable unit remediation sites in the 100-B Area. Four types of samples were collected: 1) near-surface contaminated sediments exposed during remedial activities, 2) borehole sediment samples collected during characterization of deeper contamination in the 100-B Area, 3) uncontaminated sediments collected near contaminated areas in the 100-D Area, and 4) liquid dichromate solution recovered during excavation of a sodium dichromate pipeline in the 100-D Area.
2.1 Near-Surface Sample Collection
Vadose zone soil samples were collected from areas exposed to chromate contamination during source-area remediation performed by Washington Closure Hanford (WCH). Samples were collected with shovels or plastic scoops and transported in plastic or glass containers. Large rocks were removed with a bucket sieve (0.5- to 0.75-in. openings) or through selective digging. Sample collection depended on exposure of contaminated soil through remedial actions during the project duration. Near-surface contaminated soils were obtained from the 100-B Area.
The 100-B Area soil samples from excavations are summarized in Figure 2.1. Location A samples are from the 100-C-7:1 site on the west side of the water treatment facility for the 100-C Reactor, north of the 183-C headhouse (Thompson 2007). This location included above-ground storage tanks for sodium dichromate solution and sulfuric acid. Two samples, A1 and A2, were collected from an area of yellow, stained soil located at the bottom of a pit, approximately 3.7 m bgs.
Location B samples were collected from the 100-B-27 unplanned release (surface spill) near railway tracks in the northeastern part of the 100-B Area (Figures 2.2 and 2.3). The suspected source is from delivery of bagged, granular sodium dichromate. Sodium dichromate was received in dry form until ~1955. Two samples, B1 and B2, were collected from ~1.2 to 1.8 m bgs.
Location D samples were collected from the 100-C-7 site on the north side of the 100-C Reactor water treatment facility (Figure 2.4). The samples were collected from an area of contamination released during excavation of a sodium-dichromate pipeline in March 2005. The liquid spilled is presumably similar to the liquid dichromate sample collected from the 100-D Area pipeline. Three samples were collected less than 1 m apart but based on initial screening data only the highest concentration sample, hereafter called sample D, was used in the study.
2.2 100-B Area Borehole Samples
Boreholes C5671 and C5674 were drilled for characterization of vadose zone Cr(VI) at the 100-C-7:1 and 100-C-7 sites, respectively (see Figure 2.1). The borings were located over backfill from previous excavations. The boreholes were drilled to groundwater and completed as monitoring wells 199-B8-7 and 199-B8-8. Split-spoon samples from the borehole were collected at ~1.5-m intervals starting at the depth of the backfill and sieved. The 4-2 mm fraction was screened for Cr(VI) content. Concentrations were generally low with Cr(VI) detection only in the uppermost two samples from each borehole.
2.1

Samples of the <2-mm fraction of the uppermost sample from each borehole were submitted for microscopic characterization. These samples are referred to as 71-1 and 72-1, respectively.
2.3 100-D Area Uncontaminated Sediments
Two samples of uncontaminated Hanford formation sediments were collected from open excavations in the 100-D Area. The first sample, PNNL 003, was a fine-grained, tan sand collected from ~1.5-m bgs along an east-west trench, excavated to remove a dichromate pipeline. The second sample, PNNL 004, was black sand collected from an excavation pit to remove a former pipeline near the 100-D Area water treatment facility. The sample was collected from the bottom of the pit, ~1.5-m bgs.
2.4 Dichromate Pipeline Liquid
A sample of dichromate liquid stock was recovered from a pipeline excavated in the 100-D Area. This liquid had been sequestered in the pipeline since the reactor was shut down in the mid-1960s. Analytical results provided by WCH indicated the liquid had a Cr(VI) concentration of 47,100 mg/L, and a total chrome concentration in reasonable agreement at 40,800 mg/L. The sample was not analyzed for sodium.
2.5 Sample Characterization
2.5.1 Size-Fraction Characterization
Fraction-size separation: 5 g of the <2-mm size fraction from the sediments (see Section 5.2.5) were air-dried overnight at room temperature. A 53-µm sieve was used to separate the <53-µm (silt and clay) from >53-µm (sand) fractions. The sediment materials were placed on top of the sieve and shaken by hand for 15 minutes.
2.5.2 Meso-Scale (Mineralogical) Characterization
Sediment samples were particle-size separated into sand and silt + clay fractions, and the latter fractions were characterized by XRD analyses. Each sample was analyzed using a Scintag Pad V XRD equipped with a Peltier thermoelectrically-cooled detector and a copper X-ray tube. The diffractometer was operated at 45 kV and 40 mA. Diffractograms were obtained from 2 to 65° 2θ using a step-scan increment of 0.2 degrees and a dwell time of 2 seconds. Scans were collected electronically and processed using JADE® XRD pattern-processing software.1 Minerals identification was based on comparison of the measured XRD patterns to those of mineral powder diffraction files (PDF™) published by the Joint Committee on Powder Diffraction Standards International Center for Diffraction Data.
2.5.3 Laboratory Analysis
Sediment samples A1, A2, B1, B2, and D were sieved to <2 mm, mixed, and Cr(VI) analyses were performed using U.S. Environmental Protection Agency (EPA) SW-846 Method 7196A (EPA 1992) after
1 JADE is a trademark of Jade Software Corporation Limited.
2.2

centrifugation, extraction into water at water: soil ratio of 3:1, or through the EPA SW-836 Method 3060A (EPA 1996) alkaline digestion. Centrifugation to extract soil moisture was performed at 10,000 or 16,000 revolutions per minute (rpm) for 22.5 to 27 hours. Moisture contents were determined gravimetrically. Soil moisture was also extracted by high-speed centrifuge and analyzed for Cr(VI). Results of the laboratory analysis are listed in the Table 2.1.
2.5.4 Results
Results from chromium analyses confirmed that sediments had appreciable amounts of Cr(VI) contamination (Table 2.1). The Cr(VI) concentrations in three ultrafiltration samples closely matched the water extractions; however, the centrifuged sample of sediment A-2 had a significantly lower concentration, and sediment D had a significantly higher Cr(VI) concentration.
The alkaline digestion method is designed to extract both solid and soluble Cr(VI). Spike recovery for the alkaline digestion insoluble spike was low at 40%, and the soluble spike recovery was slightly high at 129% (acceptable range is 75-125%). Therefore, it is possible the alkaline extraction underestimated the presence of insoluble Cr(VI) phases. However, alkaline digestion results consistently showed higher levels of Cr(VI) than the water extractions. Thus, the alkaline digestion results provided the best measurement of total Cr(VI) in the samples.
The pore-water analyses indicated sulfate and nitrate were present in relatively high concentrations (Table 2.2). Sediment samples from the B site had significantly greater nitrate concentration than other samples. Chloride was also present in the pore water (Table 2.2). Appreciable amounts of calcium, magnesium, sodium, and sulfur were also present in pore water (Table 2.3).
Results from the fraction-size separation analyses (Table 2.4) demonstrated that the easily separated silt and clay fraction varied in these sediments. The largest amount of sand was separated from the < 2-mm fraction of sediment PNNL 004 (over 99%), and the smallest amount was in sediment A2 (about 71%).
Results from the XRD analyses indicate the sediments had similar silt and clay fraction mineralogy (Figure 2.5), although the XRD patterns exhibited some differences. A semiquantitative or quantitative analyses would likely show these differences more clearly. The full set of results from the XRD analyses is presented in Appendix A.
2.6 Summary of Sample Collection and Characterization • The contaminated sediments collected in the 100 Area had appreciable amounts of the contaminant
chromium.
• Similar chromium concentrations were measured in the sediments after they were exposed to different extractants. This implies the vast majority of the Cr(VI) mass was soluble in water.
• In addition to chromate, other anions such as sulfate and nitrate, were present in high concentrations in the pore water; these anions (especially sulfate) may successfully compete with chromate for the available sorption sites; the pore water of the sediments from the site B had significantly greater concentrations of nitrate than other sediments.
2.3

• Pore water had appreciable amounts of cations such calcium, sodium, and magnesium. Chromate salts in the pore water were most likely sodium chromate, calcium chromate, and magnesium chromate.
• Silt and clay particles are considered the most reactive surfaces in soils and sediments. The differences among sediments were significant in terms of their sand, silt, and clay fraction content. For example, sediment A2 had the greatest amount of silt and clay particles, and sediment PNNL 004 had the greatest sand content. The differences among sediments may influence chromium transport patterns.
• Sediments had similar silt and clay fraction mineralogy. A deeper semiquantitative or quantitative analysis may reveal differences in the sediments.
2.4

Table 2.1. Water Content and Cr(VI) Concentration of Samples from Excavations in the 100-B Area
Waste Site Sample Description Sample
Designation
Moisture Content (wt %)
Centrifuge Extracted
Cr(VI) (mg/kg)
Water-Extractable
Cr(VI) (mg/kg)
Alkaline-Leach Cr(VI) (mg/kg)
A1 5.95 104.8 99.2 102.6 100-C-7:1 ~3.7 m bgs. Near-surface concentration prior to excavation was ~1200 mg/kg Cr(VI).
A2 11.14 52.6 117.2 350.2
B1 7.46 387.6 339.7 520.1 100-B-26 ~1.2-1.8 m bgs. Surface stain near railway track. Samples ~40 cm apart.
B2 6.88 477.7 465.8 649.4
D 6.66 1240.7 810.4 1042.3
D2 Not analyzed
Not analyzed
Not analyzed Not analyzed
100-C-7 Location of pipeline rupture during excavation near 183-C-7 Filter Building. Samples ~75 cm apart.
D3 Not analyzed
Not analyzed
Not analyzed Not analyzed
Table 2.2. Macroscopic Studies: Pore-Water Anion Analyses(a)
Bromide Chloride Fluoride Nitrate Nitrite Phosphate Sulfate Sample Dilution mg/L A-1 100x <100 164 <20.0 396 <100 <150 2711 A-2 100x <100 50 <20.0 82 <100 <150 1960 B-1 100x <100 193 <20.0 1759 <100 <150 2045 B-1 1000x <100 196(b) <20.0 1602 <100 <150 2069 B-2 100x <100 365 <20.0 2189 <100 <150 2210 B-2 1000x <100 363(b) <20.0 2071 <100 <150 2195 D-1 100x <100 226 <20.0 364 <100 <150 2218 D-1 1000x <100 226(b) <20.0 336 <100 <150 2241 (a) Reference: Determinations by Ion Chromatography(IC) (PNNL 2004)2, EPA SW-846 Method 9056 (EPA 2007), modified by use of hydroxide eluent. (b) Standards not within ±10%; values for reference only.
2PNNL. 2004, as revised. Determinations by Ion Chromatography (IC). PNNL-AGG-IC-001, Pacific Northwest National Laboratory, Richland, Washington.
2.5

Table 2.3. Inductively Coupled Plasma Optical Emissions Spectroscopy Analysis: Macroscopic Studies Samples: Pore-Water Cation Analysis
Sample Number A-1 A-2 B-1 B-2 D-1
Analyte mg/l
As <10 <10 <10 13 27 Bi 2.2 <2.0 6.5 9.1 22.1 Ca 1379 773 3040 3616 7530 Cr 1612 437 4793 6814 16,846 Cu 1.25 0.25 <0.2 <0.2 <0.2 K 37 24 36 32 121
Mg 421 118 889 1440 1014 Na 490 412 1067 1511 4979 Ni 0.52 <0.5 0.52 <0.5 <0.5 S 741 648 700 777 816
Sb 27 7.2 80 114 292 Se 11 <10.0 17 18 23 Sr 5.2 2.3 14.7 19.0 39.7 Si 31 7 26 29 26 Zn 0.61 0.39 0.71 1.13 1.22 Zr 0.13 0.12 <0.1 <0.1 <0.1
Analyte Det. Limit
(mg/l) Analyte Det. Limit (mg/l)
Ag 0.20 Mn 0.05 Al 0.20 Mo 2.00 B 1.00 P 5.00 Ba 0.03 Pb 1.00 Be 0.03 Re 0.50 Cd 0.05 Ti 0.10 Co 0.50 Tl 2.00 Fe 1.00 V 1.00 Li 0.20 -- --
Note: Silver, aluminum, boron, barium, beryllium, cadmium, cobalt, iron, lithium, manganese, molybdenum, phosphorous, lead, rhenium, titanium, thallium, and vanadium in all samples were below detection limits (PNNL-AGG-ICP-AES, Rev. 2 [PNNL 2008]).3
3PNNL. 2008, as revised. Inductively Coupled Plasma -Optical Emission Spectrometry (ICP-OES) Analysis. PNNL-AGG-ICP-AES, Rev. 2, Pacific Northwest National Laboratory, Richland, Washington.
2.6
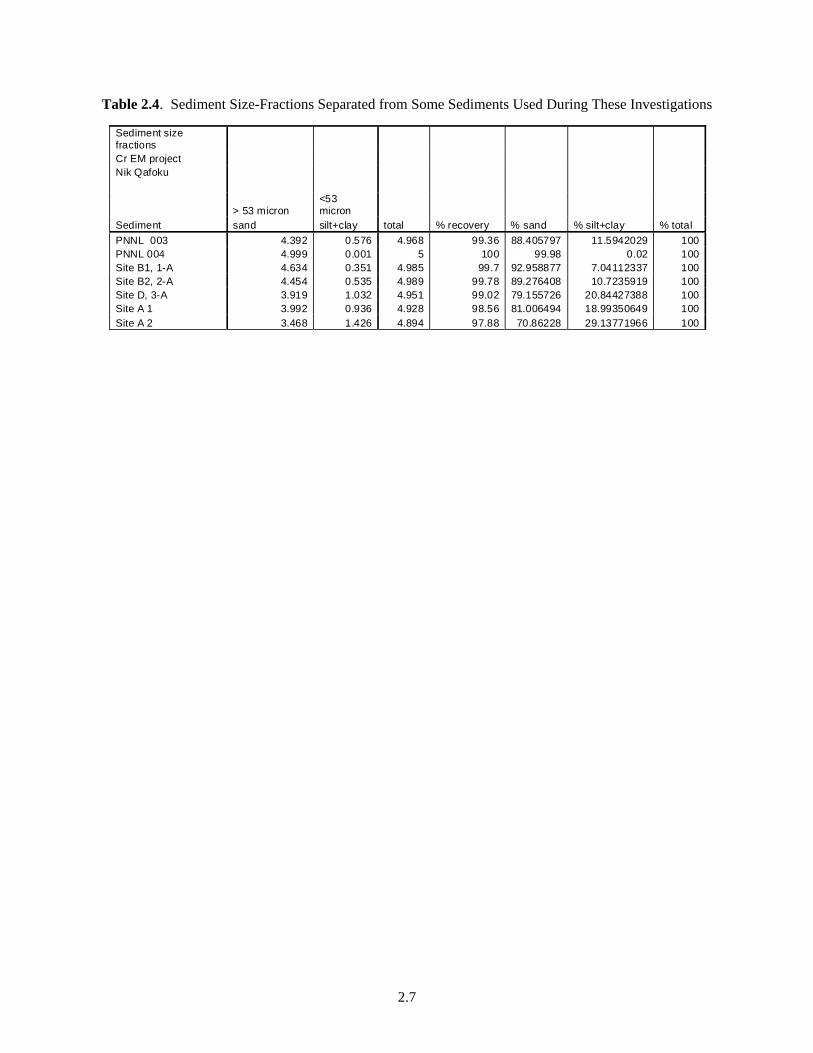
Table 2.4. Sediment Size-Fractions Separated from Some Sediments Used During These Investigations
Sediment size fractions Cr EM project Nik Qafoku
> 53 micron <53 micron
Sediment sand silt+clay total % recovery % sand % silt+clay % total PNNL 003 4.392 0.576 4.968 99.36 88.405797 11.5942029 100PNNL 004 4.999 0.001 5 100 99.98 0.02 100Site B1, 1-A 4.634 0.351 4.985 99.7 92.958877 7.04112337 100Site B2, 2-A 4.454 0.535 4.989 99.78 89.276408 10.7235919 100Site D, 3-A 3.919 1.032 4.951 99.02 79.155726 20.84427388 100Site A 1 3.992 0.936 4.928 98.56 81.006494 18.99350649 100Site A 2 3.468 1.426 4.894 97.88 70.86228 29.13771966 100
2.7

Figure 2.1. 100-B/C Area Chromium Sampling Sites
2.8

Figure 2.2. Location B is at the Bottom of a Previous Excavation (to about 4 to 6 ft; excavated in 2005).
This site was excavated to about 4 to 6 ft after finding a surface stain that was continuous down to the current pit floor. The pocket knife is about 7-cm long.
Figure 2.3. Rocks Stained Yellow About 2 ft Below the Surface at Location B2
2.9

Figure 2.4. The Site D Sampling Location was at a Pipeline Rupture at the Northern Terminus of an Excavation that was Under the Head House of the Water Processing Plant Associated with the 100-C Reactor (Figure 1.4). A clear, yellow stain was evident on the surface (middle hole in right picture).
2.10

2.11
Figure 2.5. Results from the X-Ray Diffraction Analyses in the <53-µm Fraction of the Sediments. Detailed results from these analyses are presented in Appendix A.


3.0 Transport Studies
3.1 Introduction
PNNL researchers conducted a series of column and batch experiments to investigate Cr(VI) mobility during advective transport under saturated conditions. Researchers studied Cr(VI) adsorption to uncontaminated sediments leached with chromate solutions with different concentrations. Researchers also studied Cr(VI) desorption in short-term and long-term contaminated sediments from the 100 Area.
While the transport of chromate through uncontaminated sediments is not expected to exhibit retardation due to adsorption (sediments will exhibit minimum adsorption capacity under the given conditions of neutral or slightly basic pH), Cr(VI) release from short-term and aged (long-term) contaminated sediments may exhibit the following characteristics:
1. Cr(VI) release may be kinetically controlled and the release rate may be a function of the pore-water velocity; i.e., fluid residence time, the effect of which was tested during the stop-flow events.
2. Cr(VI) concentration may rebound during the stop-flow events, but it will decrease quickly to concentration values observed before the stop-flow.
3. The rate of rebounding will decrease with leaching time because sorbed Cr(VI) mass will significantly decrease with leaching time.
4. During late phases of leaching, rebounded concentrations, if observed, will likely be limited by the solubility of Cr(VI) solid phases.
Attenuation pathways of Cr(VI) in arid and oxic natural systems, such as vadose zone sediments, and in the presence of high concentrations of aqueous Cr(VI), are not well described in the literature. While there are publications on Cr(VI) reduction and retention processes in the altered sediments by waste fluids, there are a lack of studies on interactions between concentrated chromate or dichromate liquids and soil minerals present in the sediments.
3.2 Materials and Method
3.2.1 Column Experiment Methodology
The column apparatus and methodology is described in Qafoku et al. (2003, 2004). For this study, polyvinyl-chloride columns were packed uniformly with the contaminated or uncontaminated sediments from the 100 Area. Column packing was performed in about 10-g increments that were then tamped by hand with a plastic dowel to as high a density as possible. The tamped portion surface was lightly scratched before adding the next increment to minimize layering inside the columns. Porous plates (0.25-cm thick and 10-μm pore diameter) were used at the top and bottom of each column to distribute the leaching solution and to collect fines (that were found to be minimal) at the column exit. High-performance liquid chromatography pumps or medical pumps were used to control advective flow and yield preselected fluid residence times. Column effluent was collected in a fraction collector. Selected measured and calculated physical properties in each column were summarized in different tables
3.1
(see other sections). The stop-flow (SF) technique (Brusseau et al. 1997) was frequently used to test whether nonequilibrium conditions were affecting Cr(VI)aq transport at different times during breakthrough, and to measure rates of Cr(VI)aq release from the contaminated sediment.
3.2.2 Leaching Solutions
A synthetic groundwater (SGW) with a pH = 8.05 (± 0.04) and a total inorganic carbon ([CO3]TOT) concentration of 1.05 × 10⁻³ mol L-1 was used in all experiments. The SGW simulated vadose zone pore-water composition. The chemical composition of the SGW is presented in Table 3.1. The solution was continuously bubbled with air for at least 1 week before use and stored in plastic bottles. Thermodynamic aqueous speciation and saturation index calculations were performed for this electrolyte using the computer program MINTEQA2 (Allison et al. 1991, 1998). The solution was undersaturated with respect to all possible secondary phases that might form when Hanford formation sediments were exposed to this solution, indicating the solid phase speciation was not quantitatively altered during column experiments.
3.2.3 Chemical Analyses
A bromide combination ion-selective electrode (Accumet®) was used to measure aqueous bromide concentrations.1 Frequent pH measurements were taken in all column experiments; the pH was determined by immersing a combined pH microelectrode (Microelectrodes Inc., Bedford, New Hampshire) in supernatant, or by transferring 0.5 ml of supernatant to a polystyrene tube. Some representative effluent samples collected in different column experiments and at selected times during leaching were analyzed for different elements using a Perkin Elmer model 3300 DV inductively coupled plasma optical emission spectroscopy (ICP-OES) with detection limits (μg L-1) of aluminum, 1; calcium, 0.05; copper, 0.4; iron, 0.1; potassium, 1.0; magnesium, 0.04; manganese, 0.1; nickel, 0.5; strontium, 0.05; sodium, 0.5; sulfur, 10; and silicon, 10. Anions (such as fluoride, formate, chloride, nitrite, nitrate, bromide, carbonate, sulfate, oxalate, and phosphate) were determined using a Dionex® model DX600 ion chromatography analytical system.2
3.2.4 Transport Parameters Calculation
The CXTFIT code (Parker and van Genuchten 1984, Toride et al. 1999) was used to calculate transport parameters based on the bromide breakthrough curve (BTC) of each column. Mean pore-water velocity V was calculated as the experimental water flux divided by the volumetric water content (θ), and CXTFIT was used to calculate the values of D (dispersion coefficient) and R (retardation coefficient) (Table 3.2). The experimental water flux was calculated using the average of several flow rate measurements made during experiments, divided by the surface area of the column.
The equilibrium adsorption model of CXTFIT assumes that all water in the column is mobile and the column is at physical equilibrium. Researchers tested the veracity of this hypothesis for several columns by fitting the two-region, physical nonequilibrium model for flux concentration to the bromide BTC data using R as a known parameter and D, β (the mobile water fraction), and ω (the mobile-immobile region exchange term) as unknown parameters (Leij and Dane 1992). 1 Accumet is a registered trademark of Accumet Engineering Corporation. 2 Dionex is a registered trademark of the Dionex Corporation.
3.2

The effect of the physical nonequilibrium was assumed to be negligible on R but not on D. Retardation, which affects the average travel time of first moment of BTC, is usually independent of structure (Jury and Roth 1990, Leij and Dane 1992). The values of D, which affect the spreading or second moment of the BTC, may be affected by structure. The results indicated that bromide behaved as a conservative tracer, and the entire aqueous phase volume was mobile. Therefore, physical nonequilibrium did not play a significant role in bromide transport in these columns, and the values of D calculated with the deterministic equilibrium adsorption model represented true values of the dispersion coefficient (Table 3.2).
3.2.5 Reactive Transport Modeling of Cr(VI) Desorption
Governing equations for chemical components can be seen in Equations (3.1, 3.2, and 3.3):
xxttt ss ∂∂∂∂∂ 2
Cv
CD
qqC iikii
eqii ∂
−∂
=∂
−+∂
−+∂
θθρθρθθ2
)1()1( , i =1, 2, …, N (3.1)
where Ci = Total aqueous concentration of component i in the mobile domain = Total sorbed concentration of component i in equilibrium with aqueous compositions in the mobile domain
eqiq
= Total sorbed concentration of component i controlled by kinetic sorption processes kiiq
θ = Porosity ρs = Solid density D = Dispersion coefficient v = Pore velocity N = Total number of components in the system.
According to this model, the reactive surface sites were divided into two groups: equilibrium and kinetic sites. The equilibrium sorbed concentration was modeled with the Kd model. The kinetic sorbed concentration was assumed to be controlled by either mass transfer between the mobile and immobile domains, as seen in Equation (3.2) or by the first-order mass exchange between aqueous and solid phases as seen in Equation (3.3):
)()1( imimi
imi
kii CC iimisiis
qCt
q−=
∂−+
∂=
∂∂
αθρθθρ , (3.2) tt ∂∂
)( kii
kiisk
kii
s qSt
q−=
∂∂
ραρ (3.3)
In Equation (3.2):
and = Aqueous and sorbed concentrations of component i in the immobile region imiC im
iq θi = Intragrain porosity αm = Mass transfer coefficient.
The sorbed concentration in the immobile region was also assumed to be in equilibrium with immobile aqueous compositions.
3.3

In Equation (3.3), is the maximum sorption capacity of component i on the kinetic sorption site. Parameter αk is the kinetic rate constant.
kiiS
Adsorption and desorption reaction half-lives (the time required for half of the reactant to react) [ln(2)/rate constant], and characteristic reaction time or mean lifetime of a reaction (1/rate constant) were calculated using the data from the stop-flow events applied in some of the column experiments conducted as part of this investigation (Brezonik 1993).
3.3 Results and Discussion
3.3.1 Cr(VI) Transport Behavior and Overall Mobility
The role and contribution of different Cr(VI) forms or “pools” on Cr(VI) desorption was initially studied in two column experiments conducted with sediment D (column 1) and sediment B2 (column 2) (Figure 3.1 and Table 3.2). These experiments were run for about 25 pore volume. Similar Cr(VI) leaching profiles were observed in both sediments, although sediment D (column 1) took longer to reach the pseudo steady-state (i.e., after ~ 5 PV). Although effluent Cr(VI) concentration remained low after the first PVs, desorption profiles showed prolonged tailing in both experiments. The effluent pH changed little during leaching and was similar in both columns. In addition, similar maximum pH values were observed during leaching (e.g., pHmax = 8.56 at 0.7 PV, and pHmax = 8.40 at 9.96 PV, respectively in columns 1 and 2).
Two SF with durations of 24 and 247 hours were applied at similar times during leaching in both experiments, after the pseudo steady-state was achieved. The aqueous Cr(VI) concentration was perturbed during the SF as indicated by an increase in Cr(VI) in the effluent collected after reestablishment of flow. This observation, together with the long tailing of the Cr(VI) release curve, clearly indicated a portion of the Cr(VI) total mass present in the sediments exhibited slow release and time dependency during the late stages of leaching.
Total mass of desorbed and subsequently released Cr(VI) in the column effluents calculated by integration was 17.47 and 8.77 mmol kg-1 in columns 1 (sediment D) and column 2 (sediment B2), respectively. These values were similar to the ones obtained from Cr(VI) water extraction in batch experiments (15.58 and 8.96 mmol kg-1, respectively) (Table 2.1), but were smaller than the values of total Cr(VI) obtained from the alkaline extractions (20.045 and 12.490 mmol kg-1, respectively) (Table 2.1). About 87.1 and 70.2% of Cr(VI) total mass was released in the effluent during these column experiments, and a substantial amount of Cr(VI) initial mass was not removed from the sediments during the leaching experiments.
Because a greater Cr(VI) mass remained associated with the old spill sediment B2 at the end of the experiments, this indicates that aging had some effect and modified Cr(VI) behavior during leaching in this sediment.
Most of the Cr(VI) mass present in the sediments traveled quickly through columns during leaching and was removed with the first PV of effluent [about 65.3 and 64.8% of total Cr(VI) mass in sediment D and B2, respectively], confirming the presence of a highly soluble Cr(VI) pool in both sediments. However, approximately 3.7 and 3.3% of total Cr(VI) mass was removed in the next 5 PV (from 1 to
3.4

6 PV), and similar amounts were also released during the 24-h SF [0.46 and 0.50% of total Cr(VI)] and 247 h SF [0.43 and 0.52% of total Cr(VI)], confirming the presence of another Cr(VI) pool in both sediments, which released Cr(VI) more slowly than the first pool.
These data and calculations indicated that Cr(VI) present in the slow-release pool exhibited similar behavior and mobility in both sediments (the new and old spills), and most likely similar retention mechanisms were controlling Cr(VI) desorption in the slow release pools of both sediments. The calculated rates of Cr(VI) desorption during the stop flows were similar in both sediments [0.00157 and 0.00155 mmol kg-1 h-1 at 24 h SF, and 0.00023 and 0.00025 mmol kg-1 h-1 at 247 h SF, in sediment D and B2 (columns 1 and 2), respectively]. However, the desorption rates decreased substantially during leaching, indicating nonuniform distribution of either surface site binding energies, or diffusional pathways that connect remote nano and micropores with advective pores.
Because the majority of Cr(VI) is highly soluble, this characteristic promotes aqueous phase reactions. Current cleanup level for WCH surface remediation sites is 2.6 mg kg-1 (or 0.050 mmol kg-1). Cr(VI) mass released during both 24-h and 247-h SF events was 0.100 and 0.105 mmol kg-1 in sediment D (column 1), and 0.057 and 0.053 mmol kg-1 in sediment B2 (column 2), which was 2 to 10 times greater than the cleanup level, indicating sediments may act as a long-term source for Cr(VI).
The sediments were also able to sustain for a relatively long period of time an aqueous concentration greater than the EPA maximum contaminant level (MCL) of 0.1 ppm or 0.00192 mmol L-1. For example, Cr(VI) concentrations below MCL were not observed during the experiment conducted with sediment D (column 1), and were observed only after 21 PV of influent passed through column 2 (sediment B2). Therefore, although the majority of the Cr(VI) mass was removed in the first PV, the concentrations observed during the long-tailing phase were significant relative to long-term remediation goals, depending on the overall recharge to the water table.
3.3.2 Role of Aging, Initial Cr(VI) Concentration, and Mineralogical, Physical and Chemical Properties
Four additional column experiments, columns 3-6, were conducted to investigate Cr(VI) release from contaminated sediments A1, A2, B1, and D (Figure 3.2, A, B, C, and D). The objective of these experiments was to generate the Cr(VI) desorption profiles of four highly contaminated sediments, and to explain the differences among sediments based on their mineralogical, chemical and physical properties.
The experiments were run for a much longer period of time than the initial column experiments previously described. Four SF events with durations of 24, 96, 96, and 168 h were applied in all column experiments. One additional SF of 440 h was applied in columns 5 (sediment B1, Figure 3.2, C) and column 6 (sediment D, Figure 3.2, D). The objective was to test for the presence of chemical or physical nonequilibrium during leaching, and to create dynamic/variable fluid-residence time conditions that are helpful in model calibration and fitting.
The Cr(VI) leaching profiles of the four sediments showed similarities such as the following:
1. Initial high Cr(VI) concentration peak, indicating most of the Cr(VI) was released in the first PV
3.5

2. Long tailings, indicating the presence of a leaching resistance Cr(VI) pool
3. Significant changes in effluent aqueous concentrations before SF and after the flow was reestablished, indicating Cr(VI) desorption was time dependent
4. The pH values did not change significantly during leaching as were clearly shown by the frequent pH measurements taken at different times during these experiments
5. Initial pH values measured in the first portion of effluent coming out of the columns, which had the highest Cr(VI) concentration, were smaller than those measured in the effluents collected at later times during the experiments.
These sediments were able to sustain for long periods of time an aqueous concentration greater than the MCL (0.00192 mmol L-1). For example, Cr(VI) concentrations below the MCL were observed after 32 PV in sediment A1 (Figure 3.2, A), 49 PV in sediment B1 (Figure 3.2, C), and 77 PV in sediment D (Figure 3.2, D). Cr(VI) concentrations below the MCL were not observed in the experiments conducted with sediment A2, which lasted more than 65 PV (Figure 3.2, B). Therefore, although most of the Cr(VI) mass was removed in the first PVs, the tailing Cr(VI) concentrations were significant relative to long-term remediation goals in all tested sediments. These results corroborated the results of columns 1 and 2, as seen in Figure 3.1.
Significant differences were also observed on the datasets from experiments with different sediments, such as the following:
1. The average pH values varied from pH 7.93 ± 0.10 in sediment A2 (Figure 3.2, B), to pH 8.37 ± 0.16 in sediment D (Figure 3.2, D).
2. The peak concentrations measured during the SF events were sediment dependent; the peak intensity decreased from one SF to the other in sediment A1, but remained virtually invariable during the last 96-h and 168-h SF events applied in the experiments conducted with sediments A2, B1, and D1. This indicates the presence of a leaching resistance fraction able to sustain constant aqueous concentrations with time in the columns that were continuously leached with a contaminant-free solution.
3. A substantially greater peak concentration was observed after the 440-h SF events applied in columns 5 and 6 supported the hypothesis that the rate of release was variable and decreased with time during the experiment when the SF was applied.
4. The change in Cr(VI) concentration before and after SF events of the same duration was sediment dependent (Figure 3.2)
5. The rates of Cr(VI) desorption calculated with data collected during the SF events varied in different sediments (Table 3.3):
a. Desorption rates were a function of the initial Cr(VI) content in the contaminated sediments; e.g., the fastest rates were observed in the experiment conducted with sediment D (Table 3.3, column 6). This indicated the increase in Cr(VI) contamination did not noticeably affect Cr(VI); i.e., sediment interactions with Cr(VI) were weak.
3.6

b. Desorption rates calculated at two different times during leaching with data collected before and after the two 96-h SF events decreased with leaching time in all sediments. This indicated a progressive decrease in Cr(VI) sorbed mass and that the sediments were not able to retain significant amounts of Cr(VI) to sustain constant desorption rates during consecutive SF events of the same duration. However, as seen in item 2, a small leaching resistant pool of Cr(VI) was present in sediments A2, B1, and D.
c. The rate increase observed in the experiment with sediment B1 after the 440-h SF event was difficult to interpret. The likely cause is that contributions from remote sorption sites required more time than 168 h to reach the advective pores and subsequently the column effluents.
6. The leaching profiles of sediments A1 and A2 were significantly different, although these sediments were collected in sites that were close to one another (Figure 3.2, A and B). For example, the initial peak concentration was much greater in sediment A1, although this sediment was less contaminated with chromium than sediment A2. In addition, sediment A2 sustained for a much longer time a significantly greater Cr(VI) effluent concentration than sediment A1. Lastly, effluent pH was greater in sediment A1 than in sediment A2, which contributed to the faster Cr(VI) traveling time observed in sediment A1.
3.3.3 Modeling Results
The CXTFIT code (Parker and van Genuchten 1984, Toride et al. 1999) was used to calculate transport parameters based on the bromine BTC generated with data from each of the column experiments (Figure 3.3). The dispersion coefficient (D) values were used with the pore-water velocities (V) values to calculate dispersivity, λ (λ = D/V) (Jury et al. 1991) (Table 3.2), which is the characteristic mixing length, or the average travel distance in the one pore before entering another.
The calculated values of dispersivity were close to or within the range of typical values observed in packed laboratory columns (dispersivity < 2 cm) (Jury et al. 1991). The values of the Péclet number (PN = L/λ, where L is the column length) varied between 2.8 and 12.4 (Table 3.2). The Péclet number is a dimensionless number relating to the advection rate of a flow to its rate of diffusion. More precisely, the Péclet number is the product of system length and fluid velocity, divided by diffusivity, and is a measure of the relative importance of advective and diffusive transport of contaminants.
If Pe >>1, the transport is dominated by advection and large gradients exist. If Pe << 1, diffusion dominates transport. The Péclet numbers calculated with data from the column experiments were close to 1 indicating both advection and diffusion were equally controlling transport of Cr(VI) desorption from contaminated sediments.
Transport parameters were calculated using the bromide curves for each column (Figure 3.3). These parameters were used in simulation runs with the two-site model. The two-site model fit Cr(VI) desorption profiles well for columns 3, 4, 5, and 6 (Figure 3.4). The model fitting was significantly improved in column 5 and 6 when data from other column experiments conducted with sediment B1 and D were added to the respective plots to more accurately describe the trends of Cr(VI) concentration changes during leaching in the first PV. This was necessary because the majority of the Cr(VI) mass present in the sediment was removed during the initial leaching phase.
3.7

The equilibrium Kd values were 0 or close to 0 (Table 3.4), indicating weak or no interaction of Cr(VI) with the sediments. Most of Cr(VI) present in the sediments was present in the equilibrium fraction, which was comprised of 97.5, 95, 98.7, and 97% of the total Cr(VI) mass present in sediments A1, A2, B1, and D, respectively (Table 3.4).
A small fraction of the total mass exhibited time-dependent desorption. This fraction released Cr(VI) with reaction half-lives that varied from 76.1 h to 126 h. The largest kinetically controlled fraction and the slowest desorption reaction was found in sediment A2 (column 4). In addition, the kinetically controlled fraction of sediment A2 exhibited the greatest Kd value (45 ml g-1), while the Kd value of the other sediment collected at the same site (sediment A1) was 0. Detailed characterization analyses are required to gain insights and determine why these two sediments of common provenance behave differently in terms of the interaction with Cr(VI).
3.3.4 Results from Four Additional Small Column Experiments
Four short-term experiments (~5 PV), columns 7-10, were conducted in small columns with sediments A2, B1, B2, and D with the following objectives:
1. Investigate the dependence of transport-controlled Cr(VI) release from column dimensions.
2. Use the post-treatment leached sediments to conduct detailed spectroscopic and microscopic analyses.
Selected measured and calculated properties in each column are presented in Table 3.5. Substantial amounts of Cr(VI) that were initially present in the sediments were removed from the sediments (Figure 3.5), corroborating the results from previous column experiments presented above. These results demonstrated that Cr(VI) desorption is independent from experimental conditions; e.g., column dimensions, confirming that most Cr(VI) is mobile in these contaminated sediments. Results from microscopic inspections and spectroscopic interrogation of the leached sediment samples from these column experiments are presented in Section 4.0.
3.3.5 Cr(VI) Adsorption in Uncontaminated Sediments and Desorption from Short-Term Contaminated Sediments
A series of column experiments, columns 11-14, were conducted with two uncontaminated sediments (PNNL 003 and PNNL 004) collected at the 100-D Area, and with the original pipeline Cr(VI) solution diluted 10 and 1000 times with DI water. The pH of the original pipeline solution was 4.97, while the pH of the 10 and 1000 times diluted solutions used to leach the columns were 5.16 and 5.77, respectively. The uncontaminated sediments differed substantially in color and texture.
Objectives of these experiments included the following:
1. Study the rate and extent of Cr(VI) adsorption in two sediments, and as a function of the initial Cr(VI) concentration.
2. Study desorption from short-term contaminated sediments at two different Cr(VI) concentrations.
3.8

3. Compare the rates of Cr(VI) release during these experiments with those calculated from the experiments conducted with the long-term contaminated sediments.
Selected, measured and calculated physical properties of the packed columns used in this study are presented in Table 3.6. Results from experiments conducted with sediment PNNL 003 and PNNL 004 confirmed that Cr(VI) adsorption was insignificant in both sediments, and it was not controlled by the Cr(VI) initial concentration in the leaching solution (Figures 3.6, 3.7, and 3.8). Retardation coefficients were calculated using data from Cr(VI)-breakthrough curves. The coefficients were all close to 1, confirming that Cr(VI) retardation was insignificant during transport. Experiments with a conservative tracer (bromine) were conducted in each column to compare tracer transport behavior with that of Cr(VI) (Figures 3.6 and 3.7).
Cr(VI) desorption profiles obtained in columns 11, 12, 13, and 14 were presented in Figure 3.9, A, B, C, and D. Three or more SF events were applied in each experiment to determine whether chemical or physical nonequilibrium conditions were present, and to measure rates of Cr(VI) release at different times during leaching.
Cr(VI) leaching profiles of the two sediments showed similarities (Figure 3.9, A and B). The releasing curves exhibited tailings, although these tailings were shorter than the ones observed in the experiments conducted with the long-term contaminated sediments. Significant changes in effluent aqueous concentrations before SF and after the flow was reestablished were also observed, indicating that Cr(VI) desorption was time dependent.
Effluent pH changed from pH = 6.76 ± 0.07 and pH = 6.65 ± 0.20 in the high Cr(VI) concentration plateau (PV ~ 3, column 11 and 12) to pH = 8.47 ± 0.18 and pH = 8.28 ± 0.07 during the rest of the desorption phase. The frequent pH measurements taken at different times during leaching in the other two column experiments indicated that the pH values did not change significantly during leaching (pH = 8.28 ± 0.06 and pH = 8.12 ± 0.06 in column 13 and 14, respectively).
These sediments were able to sustain an aqueous concentration greater than the MCL (0.00192 mmol L-1). For example, Cr(VI) concentrations below the MCL were observed after 12 PV in sediment PNNL 003 (Figure 3.9, A), 11 PV in sediment PNNL 004 (Figure 3.9, B), 7 PV in sediment PNNL 003 (Figure 3.9. C) and 7 PV in sediment PNNL 004 (Figure 3.9, D). Although most of Cr(VI) mass was removed in the first PVs, the tailing Cr(VI) concentrations were significant in meeting long-term contamination goals in all tested sediments.
The rates of Cr(VI) desorption calculated with data collected during the SF events varied in different sediments (Table 3.7). Desorption rates were a function of the initial influent Cr(VI) concentration of the leaching solution; e.g., the fastest rates were observed in the experiment conducted in columns 11 and 12, with an input solution Cr(VI) concentration of 82.19 mmol L-1. Sediment PNNL 003 (column 11 and 13) had a greater capacity to retain Cr(VI) and sustain greater desorption rates than sediment PNNL 004 (column 12 and 14).
3.3.6 Cr(VI) Desorption from Two Borehole Contaminated Sediments
Two column experiments (column 15 and 16) were conducted with two borehole sediments (sediment 71-1 and 71-2 (Figure 3.10). These experiments were run for more than 30 PV. Two SF events were
3.9

applied in each of the experiments. The Cr(VI) desorption patterns were similar to those obtained from other contaminated sediments presented previously in this document.
3.3.7 Cr(VI) Reaction with Strong Reductant Solutions
A series of column experiments were conducted to asses the effect of a strong reductant, calcium polysulfide, on the mobility of Cr(VI) in contaminated sediments from the 100 Area at the Hanford Site (see Appendix B). Different input solutions of synthetic groundwater and varying calcium polysulfide solution concentrations were used.
Injection of strong reductants to the vadose zone was proposed as one of the remediation strategies to decrease Cr(VI) mobility by reducing it to less mobile Cr(III). Two sediments, sediment B2 and D, were used in this set of column experiments. The sediments, which were low in moisture content (6.02 and 4.91% in sediment B2 and D, respectively) were packed in columns and were leached from the bottom up at a constant flow rate with the respective leaching solution. The fluid residence time was close to 2 hours.
Results clearly showed Cr(VI) mobility was significantly affected by the injection of calcium polysulfide (Figure 3.11). In both sediments, a smaller amount of Cr(VI) was released in the effluents of the columns leached with the calcium polysulfide solutions. However, as a point of emphasis, most of the Cr(VI) that was present in the sediment traveled out of the column and appeared in the first portions of the effluents.
The constant flow regime during these hydraulically saturated column experiments yielded a fluid residence time of about 2 hours. This period was probably not long enough for the calcium polysulfide front to react with most of the aqueous Cr(VI) that was initially present in the sediment, and, as a result, aqueous Cr(VI) was almost all pushed out of the column reactor. Other technologies might be more efficient in decreasing the induced Cr(VI) mobility in contaminated vadose zone sediments than the one tested during this investigation.
3.3.8 Effluent Solution Composition
Effluent samples from selected column experiments (columns 7, 9, and 10) conducted with different sediments (sediments A2, B2, and D) were subjected to elemental analyses (Table 3.8). Effluent chemical composition was determined in samples collected at different times during leaching in the interval from 0 to 5 PV, during which most Cr(VI) was released in the effluents. Results indicated that in addition to chromium, appreciable amounts of sodium, calcium, magnesium, and sulfur were released in the effluents of these columns, confirming that most of the chromium present in the sediments was in the form of soluble salts. Barium concentrations were initially low and remained so during leaching indicating that insoluble barium chromate salt was not contributing significantly to Cr(VI) release from the sediment.
Effluent samples before and after the 440 h SF event applied in columns 5 and 6 were also analyzed to observe trends of changes in different element concentrations during the SF (Table 3.8). These column experiments were conducted with sediments B1 and D, respectively. Barium concentration changed only a little before (the first two samples) and after (the last two samples) the SF events. Significant changes
3.10

were observed in the concentration of calcium, and little or no changes were observed in the concentration of sodium, magnesium, and sulfur before and after the SF events.
These measurements indicated that initially, salts of sodium, calcium, and magnesium were contributing to Cr(VI) transport. At the later stages of leaching, low solubility salts (such as CaCrO4) were contributing to the Cr(VI) transport in these sediments. The solubility of chromate salts in cold water is 163 and 873 g L-1 for CaCrO4• 2H2O and Na2CrO4, respectively.
3.4 Summary of Transport Experiment Results
1. The majority of the Cr(VI) mass was transported without apparent reaction with the sediments, although the transport-controlled behavior of Cr(VI) was sediment dependent; significant retardation was not observed.
2. Experimental data clearly indicated at least two Cr(VI) pools with different leaching behavior (a fast and a slow releasing pool) were present in all tested sediments.
3. The slow releasing pool was greater in the old spill sediments.
4. A two-site model described well the Cr(VI) desorption profiles of both aged and freshly contaminated sediments.
5. Calculated equilibrium and kinetic site Kd and rate constants were sediment dependent; mass transfer from poorly accessible domains within sediment matrix was largely responsible for nonequilibrium Cr(VI) desorption.
6. Barium was not detected in the effluents, indicating that moderately soluble BaCrO4 (hashemite) or other less-soluble solid solutions of BaCrO4 – BaSO4, which usually form under high Cr(VI) concentrations, were not controlling Cr(VI) solubility and mobility.
7. Injection of strong reductant liquids mobilized the soluble Cr(VI) ahead of the reacting front, limiting the chemical reaction and fixation of the Cr(VI).
3.11

3.12
n
Table 3.1. Composition of the Synthetic Groundwater Used in the Chromium and Bromine Leaching Experiments
Analyte Concentratio× 10-4 mol L-1
Na 15.29 Ca 5.97 Mg 5.29 K 4.30 DICa ([CO3]TOT) 10.45 HCO3 (calc.)b 10.33 CO3 (calc.)b 0.11 SO4 9.81 Br 6.23 NO3 5.71 Ionic Strength 59.3 PCO2 10-3.5 atm pHa 8.29
c pH 8.05 aDIC = Dissolved inorganic carbon. bSpeciations or calculations performed with MINTEQA2. cMeasured analytically.

3.13
Table 3.2. Selected Measured and Calculated Physical Properties in Column Experiments 1, 2, 3, 4, 5, and 6
Column
1 Sediment D
2 Sediment B2
3 Sediment A1
4 Sediment A2
5 Sediment B1
6 Sediment D
Pore Volumeb
(cm3) 26.51 19.12 19.79 20.89 19.19 19.70
Water Contentb
(cm3 cm-3) 0.47 0.52 0.37 0.41 0.38 0.37
Residence Timeb
(h) 2.41 2.46 1.13 1.77 1.65 1.32
Bulk Densityb
(g cm-3) 1.40 1.25 1.68 1.57 1.65 1.66
Flow Ratea
(cm3 min-1) 0.183 ± 0.011 0.197 ± 0.014 0.333 ± 0.015
0.196 ± 0.008
0.194 ± 0.012
0.248 ± 0.035
Water Flux (cm min-1)
0.034 0.037 0.065 0.039 0.039 0.048
Pore Water Velocity (cm h-1)
4.32 4.26 10.56 5.76 6.24 7.92
Dispersion Coefficient (cm2 h-1)
27.3 10.1 5.21 29.3
Dispersivity (cm)
2.58 1.75 0.83 3.69
The Péclet number 4.1 5.9 12.4 2.8 aThe average flow rate was calculated from experimental measurements (the standard deviation is given in squared brackets, more than 100 experimental measurements were taken in each column to determine the average flow rate).
bPore volume, water content, residence time and bulk density were calculated based on the amount of sediments added in each column and the mass of water used to saturate the columns.

3.14
Initial Cr(VI)
mg L-1
Final Cr(VI)
mg L-1
Difference
mmol L-1
Sediment mass
g
Pore volume
mL
Rate of Cr(VI) released
mmol kg-1 h-1
Log rate Pore volume
Fluid residence time
h
Column 3 (15) during 24 h stop flow 0.168 2.926 0.05304 90.31 19.8 0.00048455 -3.31 25.7 24 during 96 h stop flow 0.018 1.36 0.02580 90.31 19.8 0.00005894 -4.22 49.6 96 during 96 h stop flow 0.0001 0.931 0.01790 90.31 19.8 0.00004088 -4.38 75.5 96
during 168 h stop flow 0.003 0.639 0.01223 90.31 19.8 0.00001596 -4.79 96.5 168
Column 4 (14) during 24 h stop flow 2.51 5.325 0.05413 79.195 20.9 0.00059531 -3.22 14.4 24 during 96 h stop flow 1.305 4.693 0.06515 79.195 20.9 0.00017912 -3.74 28.1 96 during 96 h stop flow 1.042 2.868 0.03511 79.195 20.9 0.00009654 -4.01 41.6 96
during 168 h stop flow 0.958 2.896 0.03727 79.195 20.9 0.00005854 -4.23 53.7 168
Column 5 (16) during 24 h stop flow 0.878 5.47 0.08831 83.74 19.2 0.00084326 -3.07 14.6 24 during 96 h stop flow 0.422 5.99 0.10708 83.74 19.2 0.00025562 -3.59 25.5 96 during 96 h stop flow 0.264 4.002 0.07189 83.74 19.2 0.00017160 -3.76 32.1 96
during 168 h stop flow 0.1186 4.152 0.07757 83.74 19.2 0.00010581 -3.97 41.2 168 during 440 h stop flow 0.055 15.93 0.30531 83.74 19.2 0.00015901 -3.79 53.4 440
Column 6 (17)
during 24 h stop flow 1.66 15.69 0.26982 88.895 19.7 0.00249203 -2.60 16.5 24 during 96 h stop flow 0.803 9.3198 0.16379 88.895 19.7 0.00037819 -3.42 27.7 96 during 96 h stop flow 0.7203 5.1038 0.08430 88.895 19.7 0.00019465 -3.71 36.8 96
during 168 h stop flow 0.4146 4.7172 0.08274 88.895 19.7 0.00010917 -3.96 46.9 168 during 440 h stop flow 0.2084 10.0817 0.18988 88.895 19.7 0.00009565 -4.01 63.1 440
Table 3.3. Cr(VI) Release Rates During the Stop-Flow Events Applied in Column Experiments 3, 4, 5, and 6

Table 3.4. Results from Modeling the Cr(VI) Desorption Data Using a Two-Site Equilibrium and Kinetic Model
Parameters Column 3 Sediment
A1
Column 4 Sediment
A2
Column 5c
Sediment B1
Column 6c
Sediment D
Kd – kinetic (ml g-1)
0 45 13 4.8
Kd – equilibrium (ml g-1)
0 0.33 0 0
Equilibrium site fraction (%) 97.5 95 98.7 97 Rate constant (kinetic site fraction) (h-1)
0.0082 0.0055 0.0091 0.0068
Reaction half-lifea (h) 84.5 126 76.1 101.9 Reaction characteristic timeb (h) 121.9 181.8 109.8 147.1 aReaction half-life: [ln(2)/rate constant]. bReaction characteristic time: (1/rate constant). cData from other columns were included in these simulations to better represent Cr(VI) effluent concentrations in the first pore volumes.
3.15

3.16
Table 3.5. Selected Measured and Calculated Physical Properties in Columns 7, 8, 9, and 10
Column 7 Sediment A2
Column 8 Sediment B1
Column 9 Sediment B2
Column 10 Sediment D
Pore Volumeb
(cm3) 13.15 10.91 12.46 11.86
Water Contentb
(cm3 cm-3) 0.50 0.43 0.48 0.45
Residence Timeb
(h) 0.62 0.98 0.60 0.57
Bulk Densityb
(g cm-3) 1.26 1.35 1.40 1.42
Flow Ratea
(cm3 min-1) 0.357 ± 0.011 0.185 ± 0.023 0.348 ± 0.009
0.343 ± 0.007
Water Flux (cm min-1)
0.079 0.041 0.077 0.076
Pore Water Velocity (cm h-1)
9.43 5.68 9.66 10.06
aThe average flow rate was calculated from experimental measurements (the standard deviation is shown as the uncertainty; more than 100 experimental measurements were taken in each column to determine the average flow rate). bPore volume, water content, residence time and bulk density were calculated based on the amount of sediments added in each column and the mass of water used to saturate the columns.

Table 3.6. Selected Measured and Calculated Physical Properties in Each Column
Column 11ac
Sediment PNNL 003
Column 11bd
Sediment PNNL 003
Column 12ac
Sediment PNNL 004
Column 12bd
Sediment PNNL 004
Column 13d
Sediment PNNL 003
Column 14d
Sediment PNNL 004
Pore Volumeb
(cm3) 41.44 41.44 40.07 40.47 44.19 50.22
Water Contentb
(cm3 cm-3) 0.36 0.36 0.34 0.34 0.38 0.43
Residence Timeb
(h) 7.14 6.37 6.99 6.84 7.58 8.74
Bulk Densityb
(g cm-3) 1.58 1.58 1.73 1.73 1.51 1.52
Flow Ratea
(cm3 min-1) 0.097 ± 0.002 0.109 ± 0.004 0.095 ± 0.003
0.098 ± 0.002
0.0971 ± 0.003 0.0958 ± 0.006
Water Flux (cm min-1)
0.012 0.013 0.0012 0.012 0.012 0.012
Pore Water Velocity (cm day-1)
51.29 54.58 49.63 50.77 45.76 39.83
Dispersion Coefficient (cm2 day-1)
11.2 4.97 6.71 4.83 9.02 4.3
Retardation coefficient 0.93 0.94 1.03 1.04 0.93 0.93 Dispersivity (cm)
0.22 0.09 0.13 0.09 0.20 0.11
The Péclet number 65.7 160.7 111.3 160.7 72.32 131.8 aThe average flow rate was calculated from experimental measurements (the standard deviation is shown as the uncertainty; more than 100 experimental measurements were taken in each column to determine the average flow rate). bPore volume, water content, residence time, and bulk density were calculated based on the amount of sediments added in each column and the mass of water used to saturate the columns. cData from Br breakthrough curve. dData from Cr breakthrough curve.
3.17

Table 3.7. Cr(VI) Release Rates During the Stop-Flow Events Applied in Column Experiments 11, 12, 13, and 14
Initial Final Difference Sediment Pore rate of Cr(VI) Log Pore Fluid
residence Cr(VI) Cr(VI) mass volume released rate volume time mmol/L mmol/L mmol/L g mL mmol/kg hr h
Column 11 (19) during 24 h stop flow 0.0088 0.488 0.4792 183.66 41.44 0.0045051 -5.90259 6.73 24 during 72 h stop flow 0.012 0.461 0.449 183.66 41.44 0.0014070 -6.40798 9.52 72 during 186 h stop flow 0.003 0.039 0.036 183.66 41.44 0.0000436 -7.91611 11.21 186 during 186 h stop flow 0.001 0.013 0.012 183.66 41.44 0.0000145 -8.39323 14.57 186
Column 12 (20)
during 24 h stop flow 0 201.16 45.29 0 #NUM! 6.39 24 during 96 h stop flow 0.013 0.058 0.045 201.16 45.29 0.0001055 -7.5329 8.87 96 during 186 h stop flow 0.002 0.007 0.005 201.16 45.29 0.0000060 -8.77438 10.48 186 during 186 h stop flow 0 0.015 0.015 201.16 45.29 0.0000181 -8.29726 14.26 186
Column 13 (21)
during 24 h stop flow 0.0003 0.0029 0.0026 176.2 44.19 0.0000271 -8.12222 8.93 24 during 96 h stop flow 0 0.0062 0.0062 176.2 44.19 0.0000161 -8.34686 11.75 96 during 96 h stop flow 0 0.0007 0.0007 176.2 44.19 0.0000018 -9.29416 15.19 96
Column 14 (22)
during 24 h stop flow 0.0063 0.0092 0.0029 177.28 50.21 0.0000342 -8.02199 6.95 24 during 96 h stop flow 0.0003 0.0032 0.0029 177.28 50.21 0.0000085 -8.62405 9.8 96 during 96 h stop flow 0.0003 0.0028 0.0025 177.28 50.21 0.0000073 -8.6885 12.22 96
3.18

Table 3.8. Effluent Composition at Different Times During Leaching in Different Column Experiments. The second and the third measurements in columns 5 and 6 were taken before and after the 440-h SF event.
Sample ID Al Ba Ca Cr Fe K Mg Mn Na P S Si Pore volume mg/L mg/L mg/L mg/L mg/L mg/L mg/L mg/L mg/L mg/L mg/L mg/L
Column 70.29 0.150 0.044 579.526 369.529 -0.047 34.321 103.846 0.005 329.674 -1.789 619.711 6.6460.78 0.083 0.038 693.210 175.349 -0.078 20.721 121.569 -0.003 263.079 -1.800 825.978 5.5691.99 0.062 0.020 550.417 19.906 0.026 15.785 87.782 -0.007 38.977 -1.659 593.302 5.8273.62 0.102 0.038 547.668 7.543 -0.075 12.813 66.411 -0.008 29.703 -1.687 567.495 6.3344.83 0.127 0.020 567.479 5.202 -0.090 11.871 43.874 -0.007 27.207 -1.631 551.187 5.574
Column 90.23 0.318 0.029 1491.535 2385.989 0.021 31.794 624.118 0.079 720.646 -1.260 815.569 8.8240.66 0.286 0.027 555.595 249.534 0.018 12.335 235.464 0.006 397.488 -1.528 814.533 18.1501.91 0.508 0.018 61.406 10.913 0.326 2.587 20.416 -0.002 22.955 -1.699 49.943 15.8573.60 0.488 0.018 39.860 4.633 0.328 2.275 13.063 -0.004 33.275 -1.902 34.539 12.3374.86 0.598 0.021 38.250 3.283 0.358 2.400 11.660 -0.003 36.270 -1.634 34.078 11.004
Column 100.25 0.849 -0.017 2147.471 5032.820 0.536 79.243 335.154 0.172 2443.812 -1.728 369.976 -7.8990.72 0.106 0.014 142.895 405.968 -0.072 7.631 22.333 0.006 351.759 -1.838 48.459 11.8162.01 0.113 0.020 11.942 22.894 -0.016 7.147 1.970 -0.006 117.449 -1.521 31.469 13.0633.72 0.402 0.010 6.064 10.627 0.326 2.245 0.823 -0.001 90.442 -1.432 22.880 12.1195.05 0.181 0.010 5.938 7.079 0.081 1.917 0.660 -0.005 80.839 -1.464 21.843 10.758
Column 547.36 0.091 0.028 35.588 0.421 -0.099 4.276 8.385 -0.008 34.703 -1.671 31.830 7.10853.44 0.099 0.032 36.751 0.359 -0.102 7.788 8.521 -0.008 37.356 -1.671 33.855 6.05053.73 -0.051 0.043 50.969 7.222 -0.103 9.056 11.656 -0.008 45.127 -1.803 40.293 9.84054.02 0.069 0.044 48.172 5.387 -0.100 8.753 11.295 -0.008 43.186 -1.739 37.476 10.284
Column 657.36 0.113 0.033 28.015 0.534 -0.101 12.442 9.778 -0.009 36.374 -1.890 31.852 2.63763.18 0.142 0.035 27.742 0.392 -0.105 14.014 10.164 -0.009 37.431 -1.835 32.485 2.45463.53 0.062 0.040 38.885 4.701 -0.091 13.894 10.537 -0.008 45.235 -1.882 34.323 7.69763.99 0.145 0.034 35.170 2.953 0.080 11.966 8.820 -0.007 41.110 -1.656 32.457 6.905
3.19

PORE VOLUME V/V0
0 5 10 15 20 25 30
Cr(
VI) c
once
ntra
tion
mm
ol L
-1
0
1
2
3
4
5
6
160Column 1, Sediment D
24 h stop-flow [Cr(VI)]aq increased from 0.033 to 0.144 mmol L-1 247 h stop-flow
[Cr(VI)]aq increased from 0.011 to 0.180 mmol L-1
pHaverage = 8.28 ± 0.16
Total Cr(VI) solubilized 17.47 mmol kg-1
Cr(VI)aq = 0.00216 mmol L-1
PORE VOLUME V/V0
0 5 10 15 20 25 30
Cr(
VI) c
once
ntra
tion
mm
ol L
-1
0
1
2
3
4
5
6607080
Column 2, Sediment B2
24 h stop-flow [Cr(VI)] increased from 0.021 to 0.108 mmol L-1
247 h stop-flow [Cr(VI)] increased from 0.005 to 0.152 mmol L-1
pHaverage = 8.08 ± 0.27
Total Cr(VI) solubilized 8.77 mg kg-1
Cr(VI)aq = 0.0011 mmol L-1
Figure 3.1. Cr(VI) Desorption Profiles in Sediment D and B2. Two stop-flows were applied in each
column experiments.
3.20

Pore Volume V/V0
0 20 40 60 80 100 120
Cr(
VI) c
once
ntra
tion
mm
ol L
-1
0.0001
0.001
0.01
0.1
1
10
100
24 h SF96 h SF
96 h SF168 h SF
pHaverage = 8.25 ± 0.15
0.056 mmol L-1
0.026 mmol L-1
0.018 mmol L-1
0.012 mmol L-1
21.13 mmol L-1 0-25 PVpH = 8.15 ± 0.19
pH = 7.79
50-75 PVpH = 8.32 ± 0.05
75-96 PVpH = 8.36 ± 0.14
96-117 PVpH = 8.21 ± 0.01
Column 3, Sediment A1
25-50 PVpH = 8.24 ± 0.06
A
Pore Volume V/V0
0 10 20 30 40 50 60 70
Cr(
VI) c
once
ntra
tion
mm
ol L
-1
0.0001
0.001
0.01
0.1
1
10
100
24 h SF96 h SF 96 h SF 168 h SF
pHaverage = 7.93 ± 0.096
0.102 mmol L-1
0.090 mmol L-1
0.055 mmol L-1
0.056 mmol L-1
10.31 mmol L-1
53-67 PVpH = 8.03 ± 0.015
42 - 53 PVpH = 7.89 ± 0.065
29 - 42 PVpH = 7.98 ± 0.021
15-28 PVpH = 7.96 ± 0.067
pH = 7.70
BColumn 4, Sediment A2 0-15 PV
pH = 7.85 ± 0.120
Figure 3.2. (A and B). Leaching Profiles of Two Contaminated Hanford Site Sediments. Both
sediments are of similar provenance. Numerous stop-flow events were applied in each column experiment at different times during leaching.
3.21

Pore Volume V/V0
0 10 20 30 40 50 60
Cr(
VI) c
once
ntra
tion
mm
ol L
-1
0.0001
0.001
0.01
0.1
1
10
100
24 h SF96 h SF
96 h SF168 h SF
0.105 mmol L-1
0.115 mmol L-1
0.076 mmol L-1
0.080 mmol L-1
3.26 mmol L-1
0-15 PVpH = 8.28 ± 0.07
25-32 PVpH = 8.26 ± 0.06
pHaverage = 8.26 ± 0.06
pH = 8.22
440 h SF
32-41 PVpH = 8.25 ± 0.01
15-25 PVpH = 8.23 ± 0.02
41-53 PVpH = 8.26 ± 0.03
53-63 PVpH = 8.29 ± 0.12
CColumn 5, Sediment B1
0.306 mmol L-1
Pore Volume V/V0
0 10 20 30 40 50 60 70 80
Cr(
VI) c
once
ntra
tion
mm
ol L
-1
0.0001
0.001
0.01
0.1
1
10
100
24 h SF96 h SF
96 h SF168 h SF
0.302 mmol L-1
0.179 mmol L-1
0.098 mmol L-1
0.091 mmol L-1
35.71 mmol L-1
0.194 mmol L-1
440 h SF
0-16 PVpH = 8.47 ± 0.17
28-36 PVpH = 8.26 ± 0.06
column 6, Sediment DpH = 8.36
36-46 PVpH = 8.25 ± 0.05
16-28 PVpH = 8.35 ± 0.11
46-63 PVpH = 8.33 ± 0.08
63-77 PVpH = 8.52 ± 0.26
pHaverage = 8.37 ± 0.16
D
Figure 3.2. (C and D). Leaching Profiles of Two Contaminated Hanford Site Sediments. Numerous
stop-flow events were applied in each column experiment at different times during leaching.
3.22

Column 3Br-release
Time (PV)0 2 4 6 8 10
Column 4 Br-BTC
Time (PV)0.0 0.5 1.0 1.5 2.0 2.5 3.0 3.5
Br
mg/
L
0
50
100
150
200
DataFitted
v = 5.8 cm/hD = 10.1 cm2/h
0
20
40
60
80
100
DataFitted
Br
mg/
L
v = 10.59 cm/hD = 27.3 cm2/h
Column 5Br - release
Time (PV)0.0 0.5 1.0 1.5 2.0 2.5 3.0 3.5
Br
mg/
L
0
20
40
60
80
100
120
140DataFitted
v = 6.24 cm/hD = 5.21 cm2/h
Column 6Br-BTC
Time (PV)0 1 2 3 4
Br
mg/
L
0
5
10
15
20
25
30
35
DataFitted
v = 7.96 cm/hD = 29.3 cm2/h
Figure 3.3. Br Transport in Columns 3, 4, 5, and 6. The equilibrium deterministic model of the CXTFIT
computer program was used to fit the experimental data
3.23

Pore Volume V/V0
0 20 40 60 80 100 120 140
Cr
(mm
ol/L
)
0.00001
0.0001
0.001
0.01
0.1
1
10
100
DataTwo-site model
Column 3 Sediment A1
Pore Volume V/V0
0 20 40 60
Cr
mm
ol/L
0.001
0.01
0.1
1
10
100
DataTwo-site model
Column 4 Sediment A2
Pore Volume V/V0
0 20 40 60
Cr
mm
ol/L
0.0001
0.001
0.01
0.1
1
10
100
DataTwo-site model
Column 5 sediment B1 Column 6 sediment D
Pore Volume V/V0
0 20 40 60 80
Cr
mm
ol/L
0.0001
0.001
0.01
0.1
1
10
100
1000
DataTwo-site model
Figure 3.4. The Results from Fitting the Two-Site (two-region) Model to the Experimental Data of
Column Experiments 3, 4, 5, and 6
3.24

Pore Volume V/V0
0 1 2 3 4 5 6
Cr(
VI)
mm
ol L
-1
0
2
4
6
8
10
Sediment A2Column 7Total Cr(VI) mass desorbed 2.688 mmol kg-1
Pore Volume V/V0
0 1 2 3 4 5 6
Cr(
VI)
mm
ol L
-1
0
10
20
30
40
50
60
Sediment B1Column 8Total Cr(VI mass desorbed 5.908 mmol kg-1
Pore Volume V/V0
0 1 2 3 4 5 6
Cr(
VI)
mm
ol L
-1
0
10
20
30
40
50
60
Sediment B2Column 9Total Cr(VI) mass desorbed 8.659 mmol kg-1
Pore Volume V/V0
0 1 2 3 4 5 6
Cr(
VI)
mm
ol L
-1
0
20
40
60
80
100
120
Sediment DColumn 10Total Cr(VI) mass desorbed 18.667 mmol kg-1
Figure 3.5. Results from Four Column Experiments (column 7, 8, 9, and 10)
3.25

Br BTC Column 11Sediment PNNL 003
R = 0.93
Pore volume V/V0
0 1 2 3 4
Br c
once
ntra
tion
C/C
0
0.0
0.1
0.2
0.3
0.4
0.5
0.6
0.7
0.8
0.9
1.0
1.1
1.2
C/C0 = 0.5
C/C0 = 1
Cr(VI) BTC Column 11Sediment PNNL 003
R = 0.94
Pore volume V/V0
0 1 2 3 4
Cr(
VI) c
once
ntra
tion
mm
ol/L
0.0
0.1
0.2
0.3
0.4
0.5
0.6
0.7
0.8
0.9
1.0
1.1
1.2
C/C0 = 0.5
C/C0 = 1
Figure 3.6. Br and Cr(VI) Breakthrough Curves in Column 11 (sediment PNNL 003). Cr(VI) input
solution concentration was 82.19 mmol L-1. Effluent pH during bromine BTC was pH = 8.51 ± 0.06, but changed from pH = 8.45 ± 0.01 before PV = 1 to pH = 6.79 ± 0.07 after PV = 1 of the Cr(VI) BTC.
3.26

Br BTC Column 12Sediment PNNL 004
R = 1.03
Pore volume V/V0
0 1 2 3 4
Br c
once
ntra
tion
C/C
0
0.0
0.1
0.2
0.3
0.4
0.5
0.6
0.7
0.8
0.9
1.0
1.1
1.2
C/C0 = 0.5
C/C0 = 1
Cr(VI) BTC Column 12Sediment PNNL 004
R = 1.04
Pore volume V/V0
0 1 2 3 4
Cr(
VI) c
once
ntra
tion
mm
ol/L
0.0
0.1
0.2
0.3
0.4
0.5
0.6
0.7
0.8
0.9
1.0
1.1
1.2
C/C0 = 0.5
C/C0 = 1
Figure 3.7. Br and Cr(VI) Breakthrough Curves in Column 12 (sediment PNNL 004). Cr(VI) input
solution concentration was 82.19 mmol L-1. Effluent pH during bromine BTC was pH = 8.47 ± 0.00, but changed from pH = 8.36 ± 0.13 before PV = 1 to pH = 6.47 ± 0.07 after PV = 1 of the Cr(VI) BTC.
3.27

Cr(VI) BTC Column 13Sediment PNNL 003
R = 0.93
Pore volume V/V0
0 1 2 3 4
Cr(
VI) c
once
ntra
tion
C/C
0
0.0
0.1
0.2
0.3
0.4
0.5
0.6
0.7
0.8
0.9
1.0
1.1
1.2
C/C0 = 0.5
C/C0 = 1
Cr(VI) BTC Column 14Sediment PNNL 004
R = 0.93
Pore volume V/V0
0 1 2 3 4
Cr(
VI) c
once
ntra
tion
C/C
0
0.0
0.1
0.2
0.3
0.4
0.5
0.6
0.7
0.8
0.9
1.0
1.1
1.2
C/C0 = 0.5
C/C0 = 1
SF event
Figure 3.8. Br and Cr(VI) Breakthrough Curves in Columns 13 (sediment PNNL 003) and 14 (sediment
PNNL 004). Cr(VI) input solution concentration was 0.869 mmol L-1. Effluent pH during bromine BTC was pH = 8.57 ± 0.08 and pH = 8.12 ± 0.04 (column 13 and 14, respectively), and during Cr(VI) BTC it was pH = 8.43 ± 0.06 and pH = 8.18 ± 0.11 (column 13 and 14, respectively). The duration of the SF event in column 14 was 24 hours.
3.28

Pore volume V/V0
4 6 8 10 12 14 16 18 20
Cr c
once
ntra
tion
mm
ol/L
0
10
20
30
40
50
60
70
80
90
24 h SF0.088 - 0.488 mmol L-1
72 SF0.012 - 0.461mmol L-1
186 h SF0.003 - 0.039mmol L-1
186 h SF0.001 - 0.013mmol L-1
Cr(VI) desorptionColumn 11Sediment PNNL 003
A)
Pore volume V/V0
4 6 8 10 12 14 16
Cr c
once
ntra
tion
mm
ol/L
0
10
20
30
40
50
60
70
80
90
24 h SF1.343 mmol L-1
96 h SF0.013 - 0.058mmol L-1
186 h SF0.002 - 0.007mmol L-1
186 h SF0.000 - 0.015mmol L-1
Cr(VI) desorptionColumn 12Sediment PNNL 004
B)
Figure 3.9. Cr(VI) Desorption Profiles Obtained in Column 11 (A), 12 (B), 13 (C), and 14 (D) After Injection of the Cr(VI) Input Solution Followed by the Cr(VI)-Free Input Solution
3.29

Pore volume V/V0
4 5 6 7 8 9 10 11 12 13 14 15 16 17 18
Cr(
VI) c
once
ntra
tion
mm
ol L
-1
0.0
0.1
0.2
0.30.80.91.0
24 h SF0.0003 - 0.0029 mmol L-1
96 h SF0.00 - 0.0062 mmol L-1
96 h SF0.00 - 0.0007 mmol L-1
Cr(VI) desorptionColumn 13Sediment PNNL 003
C)
Pore volume V/V0
3 4 5 6 7 8 9 10 11 12 13 14 15
Cr(
VI) c
once
ntra
tion
mm
ol L
-1
0.0
0.1
0.2
0.30.80.91.0
24 h SF0.0063 - 0.0092 mmol L-1
96 h SF0.0003 - 0.0032 mmol L-1
96 h SF.0003 - 0.0028 mmol L-1
Cr(VI) desorptionColumn 14Sediment PNNL 004
D)
Figure 3.9. (contd)
3.30

Pore volume V/V0
0 5 10 15 20 25 30 35
Cr(
VI) c
once
ntra
tion
mm
ol/L
0.00
0.05
0.10
0.15
0.20
0.25
0.30
29 h SFfrom 0.01079to 0.08299 mmol L-1
96 h SFfrom 0.013to 0.058 mmol L-1
Column 15, Sediment 71-1pHaverage = 8.13 ± 0.29
pHinitial = 7.65
Pore volume V/V0
0 5 10 15 20 25 30 35 40
Cr(
VI) c
once
ntra
tion
mm
ol/L
0.0
0.2
0.4
0.6
0.8
1.0
1.2
1.4
29 h SFfrom 0.00to 0.066 mmol L-1
96 h SFfrom 0.00to 0.2189 mmol L-1
Column 16, Sediment 71-2pHaverage = 8.29 ± 0.16
pHinitial = 8.17
Figure 3.10. Cr(VI) Desorption Profiles from Two Borehole Sediments (column 15 and 16)
3.31

3.32
PORE VOLUME V/V
0
2
4
6
8
10
0
0 1 2 3 4 5 6
Cr(
VI) c
once
ntra
tion
mm
ol k
g-1
8.28 mmol kg-1
8.66 mmol kg-1
Sediment B2
7.27 mmol kg-1
Column 18 CaS5 0.5%Column 9 SGW2Column 20 CaS5 5%
PORE VOLUME V/V0
0 1 2 3 4 5 6
Cr(
VI) c
once
ntra
tion
mm
ol k
g-1
0
5
10
15
20
25
Column 19 CaS5 0.5%Column 10 SGW2Column 21 CaS5 5%
16.84 mmol kg-1
18.67 mmol kg-1
Sediment D
14.36 mmol kg-1
Figure 3.11. Cr(VI) Desorption in the Columns Leached with Synthetic Groundwater and Calcium
Polysulfide

4.0 Microscopic Investigation of Sediments: Chromium Spatial Distribution
4.1 Introduction
Selected sediment samples (i.e., sediments A1, A2, B1, B2, D, 71-1, and 72-1) that were contaminated with chromium (some had very high chromium concentrations) were examined with detailed microscopic and spectroscopic techniques to identify areas of high chromium concentration and study the chemical and mineralogical nature of the chromium: sediment interactions and association(s).
In this investigation, researchers used the following instruments and methods:
1. X-ray microprobe (XMP)
2. X-ray absorption near edge structure (XANES)
3. Scanning electron microscopy (SEM) with energy dispersive spectrometry (EDS)
4. X-ray photoelectron spectroscopy (XPS).
Initially, X-ray fluorescence (XRF) spectra were collected on representative areas of the sediments samples to find spots with high chromium concentrations. XANES spectra were collected at the chromium K-edge on some of these spots to determine the oxidation state of chromium. The same samples were then inspected with SEM and EDS to determine mineral phases associated with chromium. XPS is a surface sensitive technique and it was used to confirm the presence or absence of Cr(III) and/or Fe(II) on soil mineral surfaces.
4.2 Materials and Methods
4.2.1 X-Ray Microprobe and X-Ray Absorption Near Edge Structure Measurements
Sediment samples were imbedded in epoxy, wafered using a diamond saw, and prepared as 100-μm-thin sections on fused quartz slides. The XMP, XRF mapping, and XANES measurements were conducted at the Advanced Photon Source at Argonne National Laboratory, Argonne, Illinois.
The primary X-ray beam was focused using Kirkpatrick-Baez mirrors to a 6- to 10-μm diameter spot on the sample surface. The sample was oriented in a precision-translation stage at 45° to the X-ray beam, and the detectors were oriented normal to the beam. Chromium maps were obtained by monitoring the chromium Mα fluorescence line using a wavelength dispersive detector. Other elements were monitored using an energy dispersive detector.
Initially, XRF spectra were collected on representative areas of the sediment samples. Each sample was moved through the beam over a 300 µm × 300 µm area in 10-µm steps to determine areas within the
4.1

sample that contained relatively high concentrations of chromium, and to determine the elemental associations. The detection limit was approximately 1 μg/g for all elements, equivalent to approximately 109 atoms within the beam “spot.” Fluorescence X-ray intensities were normalized to the ion chamber current generated by the primary X-ray beam at a flux of about 5 x 10¹¹ ph/sec.
XANES spectra were collected on selected spots using a focused beam after the spatial distributions of chromium had been mapped; the incident energy was varied while monitoring the X-ray fluorescence. A silicon (111) double-crystal monochromator was used with an energy resolution (ΔE/E) of about 1.4 x 10⁻⁴. Powdered rutherfordine (UO2CO3) and cuprous oxide (CuO) were used to calibrate the beam energy.
4.2.2 Scanning Electron Microscopy and Energy Dispersive Spectrometry Analyses and Measurements
For the SEM and EDS analyses and measurements, thin sections and individual clasts were carbon coated to make them electrically conductive. They were examined using a JEOL model 8200 electron microprobe (EMP) and a JEOL 6340f SEM; images were then collected using a backscattered electron detector for atomic number contrast. The detection limit for EMP was approximately 100 μg/g, and the optical resolution was 10 to 20 nm. However, in all samples that were examined, chromium was below detectible limits for SEM/EDS, and EMP.
4.2.3 X-Ray Photoelectron Spectroscopy Measurements
These measurements were performed at Lehigh University, Bethlehem, Pennsylvania. A Scienta ESCA300 that employs a high-flux monochromatic Al Kα X-ray beam was used to obtain the XPS data. Operational conditions yielded a Fermi edge width = 0.41 eV for silver. The binding energy scale was referenced to adventitious C1s at 285.0 eV. Spectra were best fit by nonlinear least squares. Ratios of elements were quantified using Scofield photoionization cross sections for the Cr2p3/2, Si2p, Al2p, and Fe2p levels.
4.3 Microscale Investigation Results and Discussion
4.3.1 X-Ray Microprobe Elemental Maps, X-Ray Absorption Near Edge Structure Speciation, and Chromium Distribution Within Sediment Matrix
In all samples that were examined, chromium was below detectible limits for SEM/EDS but was detectable by XMP/XRF. Several contaminated samples were examined before any treatment or leaching. Elemental abundance maps for sediment A2 (old spill, 134 mg Cr kg-1), sediment B2 (old spill, 476 mg Cr kg-1) and sediment D (new spill, 824 mg Cr kg-1) are presented in Figure 4.1. Another set of elemental abundance maps for sediment 71-1 and 72-1 is presented in Figure 4.2.
XMP chromium mapping results indicated that chromium was dispersed around grain boundaries and also found in chromium-rich inclusions within the sediment matrix. The chromium distribution was similar in the following:
4.2

1. Contaminated sediments collected in the old or new spill sites (sediment A2/B2 versus sediment D)
2. Contaminated sediments with relatively high or low chromium concentration (sediment D versus sediment A2)
3. Contaminated sediments collected near surface or in the deeper vadose zone subsurface (sediment A2/B2/D versus 71-1 and 72-1).
XMP-elemental abundance maps were obtained from three contaminated sediments (sediment A2, B2, and D) after leaching with 5 pore volumes of a chromium-free synthetic groundwater to remove aqueous and weakly bounded Cr(VI) (Figure 4.3). All leached sediments only had a weak chromium signal, indicating that most chromium mass initially present in these sediments was removed during leaching.
Micro-XANES spectra were collected at the chromium K-edge on selected high chromium concentration spots in each sample. Reduced chromium was observed in small concentrated zones within the fine-grained coatings on chromate-contaminated surfaces (Figure 4.4). These micro-XANES measurements confirmed that mixed valence chromium [Cr(VI) and Cr(III)] was present within sediment matrices. These zones had variable Cr(VI)/Cr(III) ratios, as illustrated by the micro-XANES measurements taken in sediment D (the intensity of the pre-edge peak at 5993 eV varied in different spots) (Figure 4.4).
A series of micro-XANES measurements were taken in a sample of sediment 71-1. Most of the chromium present in sample 71-1 was Cr(III) (Figure 4.5). This suggests that a greater degree of reduction had occurred in this sample, which was collected at a greater depth than samples A, B, or D.
Micro-XANES measurements were also taken in two samples of sediment B2 and D after they were leached in column experiments with 5 pore volumes of a chromium-free synthetic groundwater to remove soluble Cr(VI) (Figure 4.6). The chromium signal was weak and total chromium mass was significantly decreased as a result of washing (a much stronger chromium signal was present in the prewashed samples (Figure 4.1). Examination of the washed samples demonstrated the presence of only insoluble Cr(III).
4.3.2 Scanning Electron Microscopy and Energy Dispersive Spectrometry Measurements
The XMP abundance maps for chromium and other elements were used to precisely locate the position within the sections of elevated chromium concentrations. The mineralogical context of the chromium inclusions was examined by SEM. This methodology provided high-resolution images and qualitative compositions of the minerals associated with elevated chromium concentrations.
In each case, the inclusion was associated with fine-grained secondary mineral coatings. For example, the SEM micrograph taken in sediment D that was not leached or otherwise treated, indicated that chromium was associated with secondary mineral phases and clay inclusions within sediment matrix (Figures 4.7 and 4.8).
Sorption sites within aggregates of secondary mineral phases and clay inclusions are sites that communicate via micron sized pores with the much larger advective pores. These domains may have
4.3

hosted the leaching resistant fraction of Cr(VI) that lead to long tailing during column desorption experiments.
A closer examination of two chromium-rich areas of sediment 71-1 presented in Figure 4.9 revealed that in one particle, chromium was associated with iron oxides (most likely magnetite) (Figure 4.10) and was present as moderately soluble BaCrO4 in the other particle (Figure 4.11). Magnetite, which is a Fe(II)-bearing mineral, is common in Hanford Site sediments and serves as a potential source of electrons for chromate reduction. Cr(VI) may be fully reduced to Cr(III) on magnetite surfaces (Kendelewicz et al. 2000), although a surface passivation mechanism (via accumulation or buildup of a Fe(III) layer or maghemite coating on the magnetite surface) may decrease the rate or stop the electron transfer from the magnetite surface to chromate (Peterson et al. 1996a).
The EDS spectra collected in the boxed areas presented in Figure 4.9 demonstrated the presence of secondary mineral phases (such as alumino-silicates). Chromium was again present in these areas. However, chromium was not detected on the surface of a titanium magnetite (ilmenite) particle (boxed area F in Figure 4.9 and Figure 4.12).
A sample of sediment B2, which was collected after leaching of the sediment with 5-pore volume of a chromium-free synthetic groundwater, was also examined with SEM and EDS (Figure 4.13). Remaining chromium was associated with secondary alumino-silicates and/or iron oxides coatings, and/or iron-rich aluminosilicate (which might be biotite and/or ferroan clinochlore that are common soil minerals in the Hanford sediments). XRD analysis of the fines portions of these sediments indicated the presence of clinochlore [(Mg,Fe)6(Si,Al)4O10(OH)8]. The common presence of potassium also suggested the presence of biotite, [K(Mg,Fe)3AlSi3O10(F,OH)2], a ferrous-iron bearing mineral ubiquitous in Hanford Site sediments.
Similarly to the other spectra taken in these contaminated sediments, the EDS spectra collected at boxed areas C, D, E, and F indicated the presence of alumino-silicates, iron oxides, or iron-bearing alumino-silicates secondary phases.
The SEM and EDS measurements did not define a particular mineralogical association for the ubiquitous Cr(VI) grain coatings seen in the XMP elemental maps. The chromium-rich inclusions were dominated by reduced Cr(III) associated with iron oxides or iron-bearing aluminosilicates. Barium chromate was rarely seen and there was no apparent correlation of chromium with calcium that would indicate the presence of calcium chromate or calcium sulfate/chromate.
4.3.3 Results from X-Ray Photoelectron Spectroscopy Measurements
The surfaces of unreacted sediments were also examined by XPS, with the majority of the chromium present as Cr(VI); only a small fraction of the total chromium was observed to be reduced to Cr(III). Because XPS is a surface technique, this analysis confirmed that the reduced Cr(III) was not a component of primary minerals within sediment clasts, but represents reduction of the contaminant Cr(VI).
All data are given as a ratio of element of interest to silicon, except for valence determinations. Reduction of Cr(VI) to Cr(III) occurred during XPS analysis (a common observation) (Figure 4.14). Initially, researchers attempted to estimate original Cr(III)/CrT ratios by extrapolating a sequence of Cr(III)/CrT ratio measurement versus time in the beam back to time zero. However, reduction was
4.4

nonlinear and the predicted Cr(III)/Si was much greater than CrT/Si ratios in the leached samples. Consequently, Cr(III) for the nonleached samples were estimated using Cr(III) from the leached samples to yield maximum Cr(III)/CrT ratios in the nonleached samples. When analyzed this way, sediment D had a lower chromium signal and a higher Cr(III)/Cr(VI) ratio in the after-leaching sample (Figure 4.15). These ratios are maximum estimates because some remaining Cr(VI) might have reduced to Cr(III) in the leached samples; however, most chromium in the leached samples appeared to be Cr(III) with no systematic trend in valence state as a function of beam exposure.
Iron was present in mixed valence states, with a predominance of Fe(III) but an appreciable Fe(II) component (Figure 4.16). Curve fitting to extract quantitative Fe(II)/Fe(III) ratios was difficult because of the complicated multiplet structures inherent to the Fe2p line. Initial analyses yield Fe(II)/FeT = 0.12 – 0.27. In some cases, the leached samples had a higher Fe(II)/FeT ratio.
In Hanford Site sediments that are low in organic matter, the Fe(II) induced abiotic reduction of Cr(VI) to Cr(III) might be an important pathway of immobilizing Cr(VI). Aqueous and/or sorbed ferrous iron might react with toxic Cr(VI) to form Cr(III), which is not toxic to most living organisms and has limited mobility and bioavailability. However, although this is a viable pathway of Cr(VI) attenuation, it is clearly demonstrated in other sections of this report that Cr(VI) reduction was neither significant nor complete in the Hanford Site sediments exposed to concentrated chromium waste liquids. A summary of the XPS results is provided in Table 4.1.
4.3.4 Summary of Microscale Characterization 1. In all samples that were examined, chromium was below detectible limits for SEM/EDS
measurements but was detectable by XMP.
2. Similar distribution of solid phase chromium was observed in the old or new chromium spills and were not related to chromium concentration or depth of collection.
3. Chromium was dispersed around grain boundaries and in occasional high chromium concentration grains within the sediment matrix.
4. Solid phase chromium was associated with secondary mineral phases and clay inclusions within the sediment matrix.
5. Evidence of chromium associated with iron oxides [most likely magnetite, which is a redox sensitive mineral with structural Fe(II)] and as insoluble BaCrO3 was also found in the contaminated sediments.
6. Chromium was also present in areas rich in alumino-silicates and/or iron-rich alumino-silicates (most likely ferroan clinochlore or biotite).
7. Surface Fe(II) of Fe oxides (magnetite) or Fe(II) of phyllosilicates (biotite, ferroan clinochlore) may reduce small quantities of Cr(VI).
8. Cr(VI) reduction to insoluble Cr(III) was neither significant nor complete even in localized areas. The bulk chromium mass in all sediments was present as Cr(VI).
9. XANES measurement confirmed that reduced Cr(III) was present in small concentrated zones within the fine-grained coatings. Zones of mixed valence chromium [Cr(VI) and Cr(III)] were present within sediment matrices. These zones had different Cr(VI)/Cr(III) ratios.
4.5

10. All leached sediments had a weak chromium signal because most of the chromium mass occurred as soluble Cr(VI), which was removed during leaching. The Cr(VI) grain coatings were almost completely removed and remaining Cr(VI) was localized in fine-grained mineral inclusions. The chromium in leached sediments was dominantly Cr(III).
11. There are several reasons for partial Cr(VI) reduction in 100 Area sediments at the Hanford Site:
a. Although reductants were present in these sediments, they most likely were not in sufficient amounts to reduce all Cr(VI) present in the sediments.
b. The presence of nonconductive coatings (e.g., calcium carbonate or oxide coatings) on the surfaces of Fe(II)-bearing minerals.
c. The creation of a passive Cr(III) layer on the surfaces of Fe(II)-bearing minerals, which can stop the electron flow from the reductant to chromate.
12. XPS analyses confirmed the reduced chromium was not a component of primary minerals within sediment clasts, and was dispersed throughout the samples.
XPS analyses confirmed that iron was mixed valent, indicating the predominance of Fe(III) but with an appreciable Fe(II) component, which may have been involved in reduction of chromate.
Table 4.1. X-Ray Photoelectron Spectroscopy
Sediment B2 (Not Leached) Sediment B2 (Leached with 5 Pore Volume) Cr/Si = 0.012 Cr/Si = 0.00263 Al/Si = 0.382 Al/Si = 0.330 Fe/Si = 0.083 Fe/Si = 0.074 Cr3+/CrT < ~0.21 Cr3+/CrT < ~0.92 Fe2+/FeT = 0.12 Fe2+/FeT = 0.21 (Noisy and lost high BE tail, so background is compromised)
Sediment A2 (Not Leached) Sediment A2 (Leached with 5 Pore Volume) Cr/Si = 0.00666 Cr/Si = 0.0038 Al/Si = 0.487 Al/Si = 0.463 Fe/Si = 0.072 Fe/Si = 0.069 Cr3+/CrT < ~0.52 Cr3+/CrT < ~0.99 Fe2+/FeT = 0.16 Fe2+/FeT = 0.27 (Lost high BE tail, so background is compromised; also not the best energy resolution, Si2p FWHM = 1.79 eV with slight distortion on high BE side)
Sediment D (Not Leached) Sediment D (Leached with 5 Pore Volume) Cr/Si = 0.0178 Cr/Si = 0.0034 Al/Si = 0.390 Al/Si = 0.377 Fe/Si = 0.069 Fe/Si = 0.075 Cr3+/CrT < ~0.20 Cr3+/CrT < ~0.92 Fe2+/FeT = 0.21
4.6

4.7

4.8

4.9

4.10

Figure 4.1. XMP Elemental Abundance Maps for Sediments A2 (old spill, 134 mg Cr kg-1), B2 (old
spill, 476 mg Cr kg-1), and D (new spill, 824 mg Cr kg-1) Before Leaching. Similar distribution (high/low concentrations and old/new spills; Cr was concentrated around grain boundaries and in high concentration zones).
4.11

Sediment 71-1
4.12

Sediment 72-1
Figure 4.2. XMP Elemental Abundance Maps for Sediment 71-1 and 72-1. Chromium was concentrated on grain surfaces and in high concentration zones.
4.13

Sediment A2
4.14

Sediment B2
4.15

Sediment D
Figure 4.3. XMP Elemental Mapping Taken in the Samples of Sediment A2, B2, D, After Leaching with
5 Pore Volume of a Synthetic Groundwater Water
4.16

SEDIMENT D
Positions:
-2874, 4314
-2377, 4398
-2916, 4464
-2779, 3673
-3204, 3679
-3284, 3967
4.17

SEDIMENT B2
Positions:
3521, 280
3052, -51
3689, 81
3040, -411
2986, 430
3846, 207
4.18

SEDIMENT A2
Positions:
-5915, -291
-5867, -519
-5753, 51
-5621, 141
-6137, 370
-5518, -207
Figure 4.4. XANES Measurements in Sediment D Before Leaching. XANES results indicated varying Cr(VI) content in analyzed hot spots.
4.19

Figure 4.5. Chromium XMP Elemental Mapping and Micro-XANES Analyses Performed in a Sample
of Sediment 71-1 Showing the Presence of Insoluble Cr(III)
4.20

4.21

Figure 4.6. Chromium XMP Elemental Mapping and Micro-XANES Analyses Conducted in Samples
of Sediment B2 and D After Leaching with 5 Pore Volumes of a Cr-Free Synthetic Groundwater. XANES spectra show that chromium concentration was low and mainly Cr(III) was present in the sediments indicated by small or lack of the pre-edge peak at 5 in Cr-XANES spectra.
4.22

Figure 4.7. SEM Micrographs and XMP Elemental Mapping Taken in a Sample of Sediment D Before
Leaching. Areas A, B, and C were inspected with SEM.
4.23

A.) Secondary mineral concretion B.) Secondary mineral concretion
C.) Clay inclusion
Figure 4.8. SEM Micrographs of Regions A, B, and C Depicted in Figure 4.7 (sediment D). Chromium was associated with secondary mineral phases and clay inclusions.
4.24

Figure 4.9. SEM Image of Sediment 71-1. Circles areas are where chromium was observed in X-ray probe mapping. Boxed areas were measured with EDS.
4.25
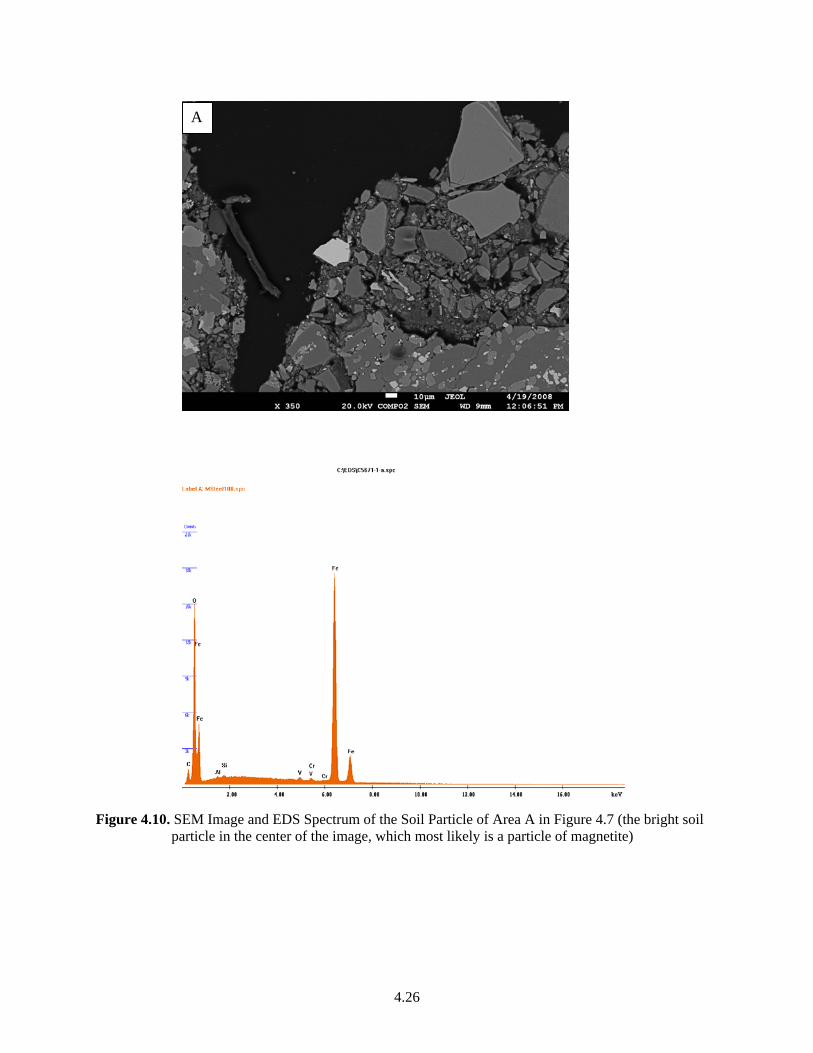
A
Figure 4.10. SEM Image and EDS Spectrum of the Soil Particle of Area A in Figure 4.7 (the bright soil
particle in the center of the image, which most likely is a particle of magnetite)
4.26

B
Figure 4.11. SEM Image and EDS Spectrum of the Soil Particle of Area B in Figure 4.7 (white color
particle in the center of the image, which most likely is a particle of BaCrO4)
4.27

Figure 4.12. EDS Spectra Collected in the Boxed Areas K and F of Figure 7.4. They show the presence
of secondary alumino-silicate minerals and ilmenite (titanium magnetite).
4.28

Figure 4.13. SEM Image (up) of a Sample from Sediment B2 Leached with 5 Pore Volume of a Cr-Free
Synthetic Groundwater. Circles are areas where chromium was observed with XMP. Boxed areas were measured with EDS. EDS spectrum from area A is presented below the SEM image.
4.29

Figure 4.14. XPS of One Spot in the Sample of Sediment D Before Leaching Showing Progressive
Reduction of Cr6+ to Cr3+ with Increasing Beam Exposure
4.30

Figure 4.15. XPS of the Sample of Sediment D After Leaching Showing Lower Chromium Signal and
Higher Cr3+:Cr6+ Ratio
4.31

4.32
Figure 4.16. XPS Measurement of a Sample of Sediment D Before Leaching. XPS indicates that Fe is mixed valence: Fe3+ is dominant but there is an appreciable Fe2+ signal.

5.0 Conclusions
Because there was little or no mechanistic data to describe Cr(VI) interaction with the oxic vadose zone or aquifer sediments under slightly alkaline conditions, which were exposed to high concentrated plumes of chromium waste liquids, researchers conducted this study with chromium contaminated sediments collected in the 100 Area at the Hanford Site.
Researchers hypothesized that vadose zone retention of Cr(VI) as a chromate anion (CrO42-) in the
100 Areas of the Hanford Site probably results from physical matrix potential effects holding CrO42-
contaminated pore water against gravimetric force. As water content reduces with time (up to 40 or 50 years) to more typical vadose zone conditions (~15% by wt), conditions are created for the formation of very soluble and slightly soluble Cr(VI) phases and/or for Cr(VI) to be reduced to less-soluble Cr(III). The soluble forms then act as long-term sources for groundwater CrO4
-2 contamination.
The objectives were to accomplish the following:
1. Determine the leaching characteristics of Cr(VI) from contaminated sediments collected from 100 Area spill sites.
2. Elucidate possible Cr(VI) mineral and/or chemical associations that may be responsible for Cr(VI) retention in the Hanford Site 100 Areas through the use of i) macroscopic leaching studies, and ii) microscale characterization of contaminated sediments.
3. Provide information to construct a conceptual model of Cr(VI) geochemistry in the 100 Area vadose zone at the Hanford Site.
The following summarized conclusions might be helpful in gaining a fuller understanding of Cr(VI) entrained in the vadose zone, which can be utilized in modeling field-scale Cr(VI) movement and transport. Based on a fundamental understanding of Cr(VI) vadose zone geochemistry, remedial action may be taken to accelerate the 100 Area Columbia River Corridor cleanup.
Results from column experiments indicated that most of contaminant chromium travels quickly through the sediments and appears as Cr(VI) in the effluents. Adsorption of Cr(VI) to sediments from spiked Cr(VI) solution was low and calculated retardation coefficients were close to one. The fine-grained surface coatings acted as a porous but restricted medium that was accessible to chromate by diffusion from migrating chromate-laden water.
The Cr(VI) concentration remained above the drinking water standard of 100 μg/L for many pore volumes. However, the significance of this for groundwater concentrations would depend on the mass flux of recharge to the water table.
Calcium polysulfide solutions readily reduced Cr(VI) to Cr(III) in column experiments. Importantly, a significant mass of the Cr(VI) was mobilized ahead of the polysulfide solution front. This has significant implications for in-situ reductive remediation techniques. Results demonstrated it would be difficult to design a remedial measure using infiltration of liquid phase reductants and avoiding a massive Cr(VI) outside the contaminated zone toward the water table.
5.1

5.2
The microscopic characterization results were consistent with the results from column studies. Cr(VI) was found as ubiquitous coatings on sediment grain surfaces. Small, higher concentration, chromium sites were associated with secondary clay mineral inclusions, with occasional occurrences of barium chromate minerals and reduced Cr(III) in association with iron oxides (most likely magnetite) and/or phyllosilicates (most likely ferroan clinochlore and biotite).
In summary, results indicated that at least four pools of Cr(VI) with different leaching behavior were present in the tested contaminated sediments. The first pool contained highly mobile and easily removed Cr(VI) dominate in all sediments (over 95% of total Cr was present in this pool). The second pool contained Cr(VI) held in physical and mineralogical remote sites that provide a longer-term continuing source of contaminant chromium. The third pool consisted of reduced immobile Cr(III) most likely by surface mediated redox reaction of aqueous Cr(VI) and aqueous, sorbed, or structural Fe(II). The fourth pool was composed of Cr(VI) in the form of BaCrO4 precipitates that apparently did not contribute to the overall transport of Cr(VI).

6.0 References
Allison IS. 1933. “New Version of the Spokane Flood.” Bulletin of the Geological Society of America 44:675-722.
Allison JD, DS Brown, and KJ Novo-Gradac. 1991. MINTEQA2/PRODEFA2, A Geochemical Assessment Model for Environmental Systems: Version 3.0 User's Manual. Environmental Protection Agency, Athens, Georgia.
Allison JD, DS Brown, and KJ Novo-Gradac. 1998. MINTEQA2/PRODEFA2, A Geochemical Assessment Model for Environmental Systems: User Manual Supplement for Version 4.0. Environmental Protection Agency, Athens, Georgia.
Anselm KA, PE Kreuger, and WS Thompson. 2004. Results of Hexavalent Chromium Sampling Near 100-D Area Sodium Dichromate Transfer Station Railroad Tracks BHI-01747 Rev 0. Bechtel Hanford Inc., Richland, Washington.
Brezonik PL. 1993. Chemical Kinetics and Process Dynamics in Aquatic Systems. Lewis Publishers, Boca Raton, Florida.
Brusseau ML, QH Hu, and R Srivastava. 1997. “Using Flow Interruption to Identify Factors Causing N Nonideal Contaminant Transport.” J. Contam. Hydrol. 24:205-219.
Carpenter RW and SL Cote. 1994. 100-K Area Technical Baseline Report. WHC-SD-EN-TI-239 Rev 0, Westinghouse Hanford Company, Richland, Washington.
Connelly MP. 1997. Assessment of the Chromium Plume West of the 100-D/DR Reactors. BHI-00967 Rev 1, Bechtel Hanford, Inc., Richland, Washington.
Delaney CD, KA Lindsey, and SP Reidel. 1991. Geology and Hydrology of the Hanford Site: A Standardized Text for use in Westinghouse Hanford Company Documents and Reports. WHC-SD-ER-TI-003, Westinghouse Hanford Company, Richland, Washington.
EPA. 1992. Chromium, Hexavalent (Colorimetric). EPA SW-846, Method 7196A, U.S. Environmental Protection Agency, Washington, D.C.
EPA. 1996. Alkaline Digestion for Hexavalent Chromium. EPA SW-846, Method 3060A, U.S. Environmental Protection Agency, Washington, D.C.
EPA. 2007. Determination of Inorganic Anions by Ion Chromatography. EPA SW-846, Method 9056A, U.S. Environmental Protection Agency, Washington, D.C.
Foster RF. 1957. Recommended Limit on Addition of Dichromate to the Columbia River. HW-49713, General Electric Company, Richland, Washington.
6.1

Gerber MA. 1996. The Plutonium Production Story at the Hanford Site: Processes and Facilities History. WHC-MR-0521 Rev 0, Westinghouse Hanford Company, Richland, Washington.
Hartman MJ. 2000. Hanford Site Groundwater Monitoring: Setting, Sources, and Methods. PNNL-13080, Pacific Northwest National Laboratory, Richland, Washington.
Hartman MJ, LF Morasch, and WD Webber. 2006. Hanford Site Groundwater Monitoring for Fiscal Year 2005. PNNL-15670, Pacific Northwest National Laboratory, Richland, Washington.
Hartman MJ, LF Morasch, and WD Webber. 2007. Hanford Site Groundwater Monitoring for Fiscal Year 2006. PNNL-16346, Pacific Northwest National Laboratory, Richland, Washington.
Horton DG, GV Last, TJ Gilmore, and BN Bjornstad. 2001. A Catalog of Geologic Data for the Hanford Site. PNNL-13653, Pacific Northwest National Laboratory, Richland, Washington.
Horton DG, GV Last, TJ Gilmore, and BN Bjornstad. 2002. A Catalog of Geologic Data for the Hanford Site. PNNL-13653 Rev 1, Pacific Northwest National Laboratory, Richland, Washington.
Jury WA and K Roth. 1990. Transfer Function and Solute Movement Through Soils. Birkhauser Verlag, Boston, Massachusetts.
Jury WA, WR Gardner, and WH Gardner. 1991. Soil Physics. John Wiley & Sons, Inc., New York.
Kendelewicz T, P Liu, CS Doyle, and GE Brown. 2000. “Spectroscopic Study of the Reaction of Aqueous Cr(VI) with Fe3O4(111) Surfaces.” Surf. Sci. 469:144-163.
Leij FJ and JH Dane. 1992. “Moment Method Applied to Solute Transport with Binary and Ternary Exchange.” Soil Sci. Soc. Am. J. 56:667-674.
Lerch JA. 1998. 100-D Area Chromium Study Summary Report. BHI-01185 Rev 0, Bechtel Hanford Inc., Richland, Washington.
Lindberg JW. 1995. Hydrogeology of the 100-K Area Hanford Site, South-Central Washington. WHC-SD-TI-294 Rev 0, Westinghouse Hanford Company, Richland, Washington.
Lindsey KA. 1995. Miocene- to Pliocene-Aged Suprabasalt Sediments of the Hanford Site, South-Central Washington. BHI-00184 Rev 0, Bechtel Hanford Inc., Richland, Washington.
Parker JC and MT van Genuchten. 1984. “Determining Transport Parameters from Laboratory and Field Tracer Experiments.” Virg. Agric. Exp. Stn. Bull. 84.
Pearl WL and JC Whipple. 1953. A Proposal for Liquid Sodium Dichromate Facilities for the 100-C and 100-D Areas. HW-27270, Richland, Washington.
Peterson ML, GEJ Brown, and GA Parks. 1996a. “Direct XAFS Evidence for Heterogeneous Redox Reaction at the Aqueous Chromium/Magnetite Interface.” Colloids Surf., A 107:77-88.
6.2

Peterson RE, RF Raidl, and CW Denslow. 1996b. Conceptual Site Models for Groundwater Contamination at 100-BC-5, 100-KR-4, 100-HR-3, and ,100-FR 3 Operable Units. BHI-00917 Rev 0, Bechtel Hanford Inc., Richland, Washington.
Qafoku NP, CC Ainsworth, and SM Heald. 2007. “Cr(VI) Fate in Mineralogically Altered Sediments by Hyperalkaline Waste Fluids.” Soil Sci. 172:598-613.
Qafoku NP, CC Ainsworth, JE Szecsody, and OS Qafoku. 2003. “Effect of Coupled Dissolution and Redox Reactions on Cr(VI)aq Attenuation During Transport in the Hanford Sediments Under Hyperalkaline Conditions.” Environ. Sci. Technol. 37:3640-3646.
Qafoku NP, CC Ainsworth, JE Szecsody, and OS Qafoku. 2004. “Transport-Controlled Kinetics of Dissolution and Precipitation in the Hanford Sediments Under Hyperalkaline Conditions.” Geochim. Cosmochim. Acta 68:2981-2995.
Rai D and JM Zachara. 1986. Geochemical Behavior of Chromium Species. Research Project 2485-3 EA-4544. Pacific Northwest National Laboratory, Richland, Washington.
Rai D, LE Eary, and JM Zachara. 1989. “Environmental Chemistry of Chromium.” Sci. Tot. Environ. 86:15-23.
Reidel SP and MA Chamness. 2007. Geology Data Package for the Single-Shell Tank Waste Management Areas at the Hanford Site. PNNL-15955, Pacific Northwest National Laboratory, Richland, Washington.
Rohay VJ, DC Weekes, WJ McMahon, and JV Borghese. 1999. The Chromium Groundwater Plume West of the 100-D/DR Reactors: Summary and Fiscal Year 1999 Update. BHI-01309 Rev 0, Bechtel Hanford, Inc, Richland, Washington.
Serne RJ, HT Schaef, BN Bjornstad, BA Williams, DC Lanigan, DG Horton, RE Clayton, VL LeGore, MJ O'Hara, CF Brown, KE Parker, IV Kutnyakov, JN Serne, AV Mitroshkov, GV Last, SC Smith, CW Lindenmeier, JM Zachara, and DB Burke. 2001. Characterization of Uncontaminated Sediments from the Hanford Reservation-RCRA Borehole Core and Composite Samples. PNNL-2001-1, Pacific Northwest National Laboratory, Richland, Washington.
Spane FA, Jr. and WD Webber. 1995. Hydrochemistry and Hydrogeologic Conditions Within the Hanford Upper Basalt Confined Aquifer System. PNL-10817, Pacific Northwest Laboratory, Richland, Washington.
Thompson WS. 2007. Sampling and Analysis Instruction for Evaluation of Residual Chromium Contamination in the Subsurface Soil at 100-C-7. WCH-00154 Rev. 0, Washington Closure Hanford, Richland, Washington.
Thorne PD, MA Chamness, FA Spane, VR Vermeul, and WD Webber. 1993. Three-Dimensional Conceptual Model for the Hanford Site Unconfined Aquifer System, FY 93 Status Report. PNL-8971, Pacific Northwest Laboratory, Richland, Washington.
6.3

6.4
Thornton EC. 1992. Disposal of Hexavalent Chromium in the 100-BC Area - Implications for Environmental Remediation. WHC-SD-EN-TI-025 Rev 0, Westinghouse Hanford Company, Richland, Washington.
Thornton EC, TJ Gilmore, KB Olsen, R Schalla, and KJ Cantrell. 2001. Characterization Activities Conducted at the 183-DR Site in Support of an In Situ Gaseous Reduction Demonstration. PNNL-13486, Pacific Northwest National Laboratory, Richland, Washington.
Thornton EC, KJ Cantrell, JM Faurote, TJ Gilmore, KB Olsen, and R Schalla. 2000. Identification of a Hanford Waste Site for Initial Deployment of the In Situ Gaseous Reduction Approach. PNNL-13107, Pacific Northwest National Laboratory, Richland, Washington.
Toride N, FJ Leij, and MT van Genuchten. 1999. The CXTFIT Code for Estimating Transport Parameters from Laboratory or Field Tracer Experiments. Research Report 137, U.S. Salinity Laboratory.
U.S. Department of Energy. 2006. The Second CERCLA Five-Year Review Report for the Hanford Site. DOE/RL-2006-20 Rev 1, U.S. Department of Energy Richland Operations Office, Richland, Washington.
Whipple JC. 1953. Design Planning of a dichromate system for the 100-K Areas. HW-26913, Richland, Washington.
Zachara JM, DC Girvin, RL Schmidt, and CT Resch. 1987. “Chromate Adsorption on Amorphous Iron Oxyhydroxide in the Presence of Major Groundwater Ions.” Environ. Sci. Technol. 21:589-594.
Zachara JM, CE Cowan, RL Schmidt, and CC Ainsworth. 1988. “Chromate Adsorption by Kaolinite.” Clays Clay Miner. 36:317-326.
Zachara JM, CC Ainsworth, GE Brown, JG Catalano, JP McKinley, OS Qafoku, SC Smith, J. Szecsody, SJ Traina, and JA Warner. 2004. “Chromium Speciation and Mobility in a High Level Nuclear Waste Vadose Zone Plume.” Geochem. Cosmochim. Acta 68:13-30.

Appendix A
Results from the XRD and SEM Analyses


A.1
A.1

A.2
A.2

A.3
A.3

A.4
A.4

A.5
A.5

A.6

Appendix B
Results from SEM Analyses Performed in Post-Treatment Sediments Exposed to Calcium Polysulfide Concentrated
Liquids


B.1
3/11/2008 9:50:11 AM Cr (VI) Site 1 Spectra 1

3/11/2008 9:51:33 AM Cr (VI) Site 1 Spectra 2
Distribution No. of Copies 2 Fluor Hanford, Inc. R. Jackson E6-35 S. W. Petersen E6-35
No. of Copies 5 Pacific Northwest National Laboratory P. E. Dresel K6-96 M. D. Sweeney K6-75 M. J. Truex K6-96 Information Release Office (2) P8-55
B.2

3/11/2008 9:52:28 AM Cr (VI) Site 1 Spectra 3
B.3

B.4
Cr (VI) Site 1 Spectra 4 3/11/2008 9:53:08 AM Cr (VI) Site 1 Spectra 5 3/11/2008 9:53:57 AM

3/11/2008 9:54:34 AM Cr (VI) Site 1 Spectra 6
B.5

3/11/2008 10:30:54 AM Cr (VI) Site 1 Spectra 7
B.6

3/11/2008 10:32:37 AM Cr (VI) Site 2 Spectra 1
B.7

3/11/2008 10:33:33 AM Cr (VI) Site 2 Spectra 2
B.8

3/11/2008 10:34:08 AM Cr (VI) Site 2 Spectra 3
B.9

3/11/2008 10:34:42 AM Cr (VI) Site 2 Spectra 4
B.10

3/11/2008 10:35:17 AM Cr (VI) Site 2 Spectra 5
B.11

3/11/2008 10:36:18 AM Cr (VI) Site 3 Spectra 1
B.12

3/11/2008 10:37:04 AM Cr (VI) Site 3 Spectra 2
B.13

3/11/2008 10:37:37 AM Cr (VI) Site 3 Spectra 3
B.14

3/11/2008 10:38:09 AM Cr (VI) Site 3 Spectra 4
B.15
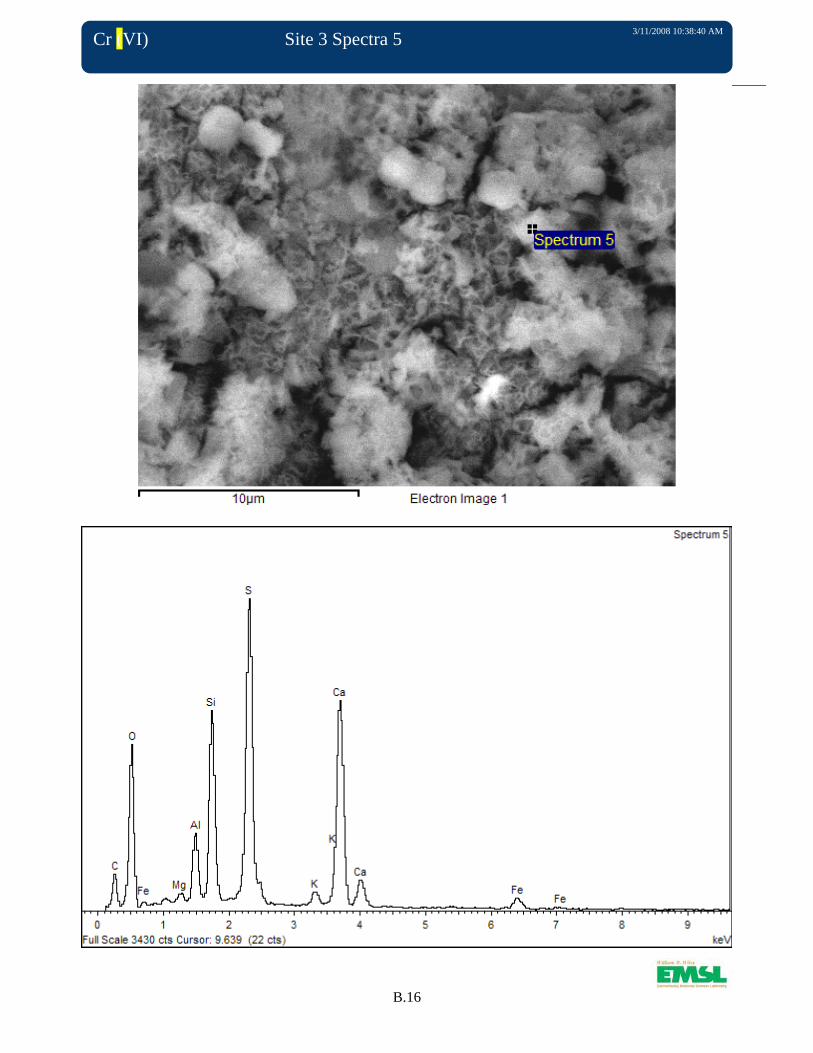
3/11/2008 10:38:40 AM Cr (VI) Site 3 Spectra 5
B.16

3/11/2008 10:39:09 AM Cr (VI) Site 3 Spectra 6
B.17

3/11/2008 10:39:47 AM Cr (VI) Site 3 Spectra 7
B.18

3/11/2008 10:40:34 AM Cr (VI) Site 3 Spectra 8
B.19

B.20
Cr (VI) Site 4 Spectra 1 3/11/2008 10:41:31 AM Cr (VI) Site 4 Spectra 2 3/11/2008 10:42:22 AM

3/11/2008 10:43:01 AM Cr (VI) Site 4 Spectra 3
B.21

3/11/2008 10:43:35 AM Cr (VI) Site 4 Spectra 4
B.22

3/11/2008 10:44:13 AM Cr (VI) Site 5 Spectra 1
B.23

3/11/2008 10:44:53 AM Cr (VI) Site 5 Spectra 2
B.24

3/11/2008 10:45:23 AM Cr (VI) Site 5 Spectra 3
B.25


PNNL-17674
Distribution
No. of No. of Copies Copies
Distr.1
OFFSITE R. B. Rowley, EM-22 U.S. Department of Energy Office of Environmental Management 1000 Independence Avenue, S.W. Washington, DC 20585 ONSITE 2 DOE Richland Operations Office
J. P. Hanson A5-11
M. Thompson A6-38 3 Fluor Hanford, Inc.
R. Jackson E6-35 S.W. Petersen E6-35 A. F. Shattuck E6-44
16 Pacific Northwest National Laboratory P. E. Dresel (2) K6-96 J. S. Fruchter K6-96 J. L. Hughes K6-79 E. S. Ilton K8-96 C. Liu K8-96 J. P. McKinley K8-96 J. L. Phillips K3-61 N. P. Qafoku (2) K8-96 M. D. Sweeney K6-75 J. E. Szecody K3-61 M. J. Truex K6-96 J. M. Zachara K8-96 Information Release Office (2) P8-55 3 Washington Closure Hanford M.A. Buckmaster X9-08 D.W. Shea X9-08 W.S. Thompson H4-23
