geo task us-09-01a - earth observations · geo task us-09-01a highest ranked ... - report outline...
TRANSCRIPT

GEO Task US-09-01a: Earth Observations Priorities Common to
Many Societal Benefit Areas
Task Activities
US-09-01a Task Lead: Lawrence Friedl, USA-NASA
User Interface Committee Member
January 2011
2
Group on Earth ObservationsTask US-09-01a
GEO Task US-09-01a
Objective:Establish and conduct a process for identifying critical Earth observation priorities common to many GEO societal benefit areas, involving scientific and technical experts, taking account of socio-economic factors, and building on the results of existing systems’ requirements development processes.
GEO Societal Benefit Areas:Agriculture Disasters HealthBiodiversity Ecosystems WaterClimate Energy Weather

3
Group on Earth ObservationsTask US-09-01a
GEO Task US-09-01a
Main Topics for UIC Discussion
A.Task Review- Updates- Issue: Biodiversity
B.Follow-on Activities- Gap Analysis- Parameter Characteristics
C.ISRSE-34 Events- Workshop- ISRSE Exhibit Booth

GEO Task US-09-01aHighest Ranked Observations (#1-20) and Associated SBAs
All of the 20 Highest-ranked observations are common to 4 or more SBAs
All of 30 Highest-ranked obs. are common to 3 or more SBAs
3 Highest-Ranked: Precipitation, Soil Moisture, Surface Air Temperature
* Biodiversity SBA Team did not produce a set of Earth observations priorities.
Note: Some observations may be relevant to an SBA even though not included in the SBA’s set of priorities.
| 4
5
Group on Earth ObservationsTask US-09-01a
Biodiversity SBA – Status Biodiversity community had a meeting in early March and discussed biodiversity priority observations. Results of meeting TBD.
In discussion with Michele Walters (GEO BON Exec. Officer) about a Biodiversity SBA report
- Need to follow the 9-step process for consistency- Report outline and observation list to combination into Cross-SBA
Timeline TBD
When/if they produce a report, this will require a revision to Final Cross-SBA report

6
Group on Earth ObservationsTask US-09-01a
GEO Task US-09-01a
Main Topics for UIC Discussion
A.Task Review- Updates- Issue: Biodiversity
B.Follow-on Activities- Gap Analysis- Parameter Characteristics
C.ISRSE-34 Events- Workshop- ISRSE Exhibit Booth

Group on Earth ObservationsTask US-09-01a
Follow-on Activities
1. Gap AnalysisGap analysis of observationpriorities relative to current andplanned availability.
2. Parameter Characteristics – Precipitation Assess specific parameter characteristics for precipitation. Examine precipitation needs across a breadth of SBAs, applications, and users to identify loci of common parameter needs.
7

8
Group on Earth ObservationsTask US-09-01a
US-09-01a Gap AnalysisReport Recommendation: Conduct an assessment of the current andplanned availability of the priority Earth observations.
Assess Current and Planned Availability of Observat ions- Up to 15 years for planned missions- Approx. top 30-35 observations from report- Initial Focus on Satellite observations
Use CEOS Mission, Instruments, and Measurements” databaseas primary source
Parameters to CaptureSatellite name, instrument, and primary agencyType of satellite (GEO or LEO) and geographic coverageMeasurement type (e.g., precipitation rate) and unitsTemporal and spatial resolutionSatellite launch date and planned end of life date
Identify any temporal or geographic measurement gap s

Gap Analysis: Process
1. Use the entries in the CEOS Measurements, Instruments, and Missions (MIM) database (http://database.eohandbook.com/) as a basis for determining available satellite measurements.
2. For each listed instrument/satellite in CEOS database, conduct internet searches to locate specific measurement information and datasets, and record measurement information (when available):– Satellite name, instrument, and primary agency
– Type of satellite (GEO or LEO) and geographic coverage
– Measurement type (e.g., precipitation rate) and units
– Temporal and spatial resolution
– Satellite launch date and planned end of life date
9

Gap Analysis: Results to Date
• Analysts have gathered information on measurements for 5 of the top 10 highest-ranked parameters (precipitation, soil moisture, surface air temperature, vegetation cover, NDVI)
• Example – excerpt of results for precipitation :
Current Planned
Currently there are: 40 measurements from 14 instruments on 26 satellitesfor precipitation
In planning stages, there are17 instrumentsfor precipitation
10

11
Gap analysis of observation priorities relative to current and future availability.
Current & Future States of Critical
Earth Observation Priorities
Results of Gap Analysis can be shown
in such a diagram.
Gap Analysis : End Results

Gap Analysis : End Results
12
• Results may also be summarized as follows:

Instrument SatellitePrimary
Agency
Equitorial
Overpass
Time (LST)
Geographic
Coverage
(of Measurement)
Satellite
Launch Date
Planned
Satellite End
of Life Date
Type of
MeasurementUnits
Temporal
Resolution
Spatial
Resolution
AMSR-E Aqua NASA 13:30 70°N - 70°S 5/4/2002 9/1/2011
L2B Global
Swath Rain
Rate/Type GSFC
Profiling
Algorithm
mm/hr 1 day 5.4 km
AMSR-E Aqua NASA 13:30 70°N - 70°S 5/4/2002 9/1/2011
Monthly L3 5x5
deg Rainfall
Accumulations
mm 1 month 5° x 5°
AMSU-B NOAA-15 NOAA 7:30
Global, N. America,
CONUS, Eurasia, W.
Atlantic, E. Atlantic,
C. Pacific, E. Pacific
5/13/1998 12/1/2010 rain rate mm/hr 12 hr 16 km
AMSU-B NOAA-15 NOAA 7:30 CONUS 5/13/1998 12/1/2010 hourly rainfall mm 12 hr 16 km
AMSU-B NOAA-16 NOAA 13:30
Global, N. America,
CONUS, Eurasia, W.
Atlantic, E. Atlantic,
C. Pacific, E. Pacific
9/21/2000 12/1/2012 rain rate mm/hr 12 hr 16 km
AMSU-B NOAA-16 NOAA 13:30 CONUS 9/21/2000 12/1/2012 hourly rainfall mm 12 hr 16 km
Excerpt of Current Polar-Orbiting Satellites Measuring Precipitation
13

Gap Analysis: Findings to Date
• Ease of public access to on-line measurement datasets varies by sponsoring agency
• Existence of multi-observation blended products is a complicating factor (not listed in CEOS database)
• In some cases, there is limited information on specific measurements for planned satellite missions– Limits the ability to assess transition from current to planned
satellite products
14
15
Group on Earth ObservationsTask US-09-01a
US-09-01a Parameter CharacteristicsReport Recommendation: Gather information and engage users on specific characteristics of the priority Earth observations, especially Precipitation.
Users and ApplicationsExamine users and applications across SBAs as systematic way to capture breadth of needs (e.g., famine early warning, agriculture production, hydropower, flood prediction, landslides, tropical cyclones, numerical weather prediction systems, groundwater recharge)
Parameter CharacteristicsAssess the needed parameters in the breadth of applications and users to identify common loci of common parameter needs- e.g., some may need weekly averages at 1km resolution, some mayneed 1º x 1º every hour
This activity is currently being done for precipitation , could be repeated for other observations, such as soil moisture or land cover.

Parameter CharacteristicsProcess
Activity in Process:1.Assemble a preliminary list of users, purposes, and
required characteristics of precipitation info from:- Documents cited in individual SBA reports (over 50 documents
already analyzed) to capture details- Documents provided by other precipitation working groups
(Step 1 is ~70% complete)
Next Steps:2.Gather feedback via presentations/discussions with 12-15
relevant organizations (including GEO CoPs)3.Compile final results.
16

Parameter Characteristics Representative User Types
17
ResearchersTechnology DevelopersClimate ResearchersAtmospheric Scientists
Media ProfessionalsJournalistsBroadcast Meteorologists
Policy MakersAdvisory OrganizationsElected OfficialsPolicy Analysts
Financial Sector ManagersPlanners and investorsRisk Assessors
Resource Managers/PlannersAgriculture Planners/ManagersCoastal ManagersEmergency/ Disaster Response ManagersForest ManagersMineral Resource PlannerWater Resource Managers
ForecastersHydrologistsMeteorologists
RegulatorsPermitting AgenciesEnergy Commissions
Private Citizens & Civic LeadersTouristsSchool Principals
Developers OperatorsAviation Industry/ PilotsHealth Care ProvidersElectric Grid OperatorsUtility Companies
EngineersCivil EngineersChemical Engineers

SourcePDF
Page #
Horizontal
Resolution
Temporal
ResolutionLocation Accuracy Uses
GCOS
2006a15
Routinely-
producedGlobal Validated
"weather and climate forecasts… agricultural
planning, forestry and water management"
Lauritson
20029
1km
(Optimal)
50km
(Threshold)
5 min
(Optimal)
4 hour
(Threshold)
Global Flash flood monitoring and response
Ceccato
et al 20051-3
Areas with
risk or
potential
risk of
malaria
Predicting outbreaks of malaria in areas where
rainfall or other weather parameters have
changed
18
Parameter Characteristics: Excerpt of User Needs Analysis
Parameter Characteristics
Findings to Date – Part A
• Certain user types are well-represented in literature:– Climate researchers
– Emergency/disaster response managers
– Resource managers (water, forests)
– Forecasters (weather, hydrologists)
• These tend to be users of primary precipitation data.
• There is especially strong user interest in forecasts.
19

Parameter Characteristics
Findings to Date – Part B
• Certain user types are under-represented in literature:– Financial Sector Managers (e.g., Risk Assessors)
– Policy Makers (e.g., Advisory Organizations, Elected Officials, and Policy Analysts)
– Regulators (e.g., Permitting Agencies, Energy Commissions)
– Engineers (e.g., Civil Engineers, Chemical Engineers)
– Various others: Coastal Managers, Aviation Industry/Pilots Electric Grid Operators, Utility Companies, Journalists,
– Private Citizens & Civic Leaders
• These tend to be users of secondary precipitation products.
20
Next Steps
• Complete the Gap Analysis (satellite measurement availability) for top 30-35 highest-ranked observations– Several high-priority indirect/modeled observations (e.g.,
urbanization, stream/river flow, cultivation, deforestation, soil composition) are not categories in the CEOS database and will beexcluded or treated separately
• Use initial results from the Parameter Characteristics to reach out to GEO COPs and other user organizations to identify additional information on specific user needs for precipitation
Estimated date of completion for Activities: Fall 2011
21
Uses of Gap Analysis and Precipitation Characteristics Results
• GEO Members can:– Use results to support planning for future satellite missions– Identify key opportunities to serve their users’ needs
• GEO Committees and Tasks can:– Examine access to high priority observations through GEOSS– Identify key gaps in current and planned availability of priority
observations
• COPs can:– Inform members about available satellite measurement for high
priority observations
• Users can: – Advocate to fill gaps and weaknesses of high priority observations– Recognize users with similar needs and collaborate
22
23
Group on Earth ObservationsTask US-09-01a
GEO Task US-09-01a
Main Topics for UIC Discussion
A.Task Review- Updates- Issue: Biodiversity
B.Follow-on Activities- Gap Analysis- Parameter Characteristics
C.ISRSE-34 Events- Workshop- ISRSE Exhibit Booth
24
Group on Earth ObservationsTask US-09-01a
Workshop
Comments from workshopComments from workshop
25
Group on Earth ObservationsUIC Exhibit – ISRSE-34
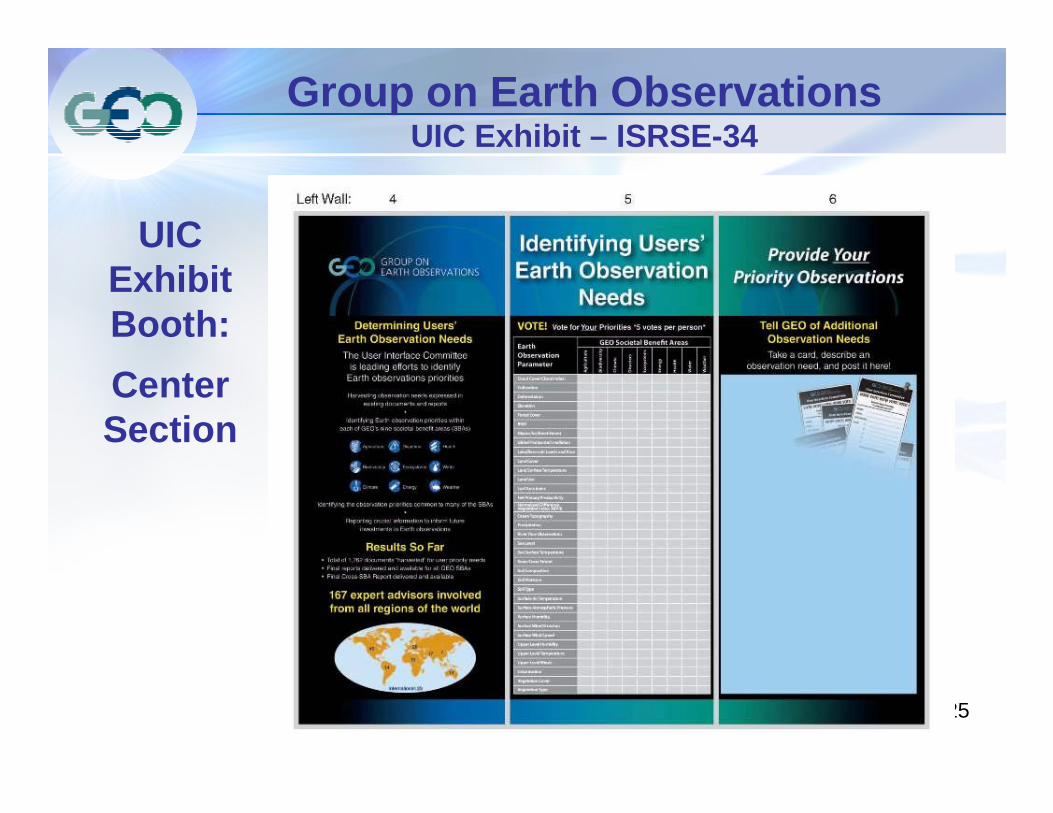
UIC Exhibit Booth:
Center Section

26
Group on Earth ObservationsUIC Exhibit – ISRSE-34
UIC Exhibit BoothEarth Observations: Panels 4-6One hand-out is the US0901a Summary of Results(Note: There are 30 copies of the Full Report if someone shows interest in the Full Report. Otherwise, point them to the US0901a website listed in the Summary hand-out)
Panels 5 & 6 are interactive. We have a hand-out with instructions. Also, there are color stickers (panel 5) & and a card (panel 6).
For Panel 5, people can “vote” for five observations. The panel has a large table of SBAs (along top) and Observations (along left side). Each person will get five colored stickers to affix to the panel. They can put their stickers in boxes corresponding to an observation and a SBA associated with their priority. We’ll tally the results at the end.
Voting multiple times over multiple days is not permitted.
27
Group on Earth ObservationsUIC Exhibit – ISRSE-34
UIC Exhibit BoothEarth Observations: Panels 4-6One hand-out is the US0901a Summary of Results(Note: There are 30 copies of the Full Report if someone shows interest in the Full Report. Otherwise, point them to the US0901a website listed in the Summary hand-out)
Panels 5 & 6 are interactive. We have a hand-out with instructions. Also, there are color stickers (panel 5) & and a card (panel 6).
For Panel 6, people can identify an important observation that doesn’t appear on Panel 5. It’s their chance to tell us of an additional observation. There will be cards for people to fill-out and then affix to Panel 6. The cards ask them to identify:
- Observation- Name, Organization, Email- How observation is used & why it’s important

28
Group on Earth ObservationsUIC Exhibit – ISRSE-34
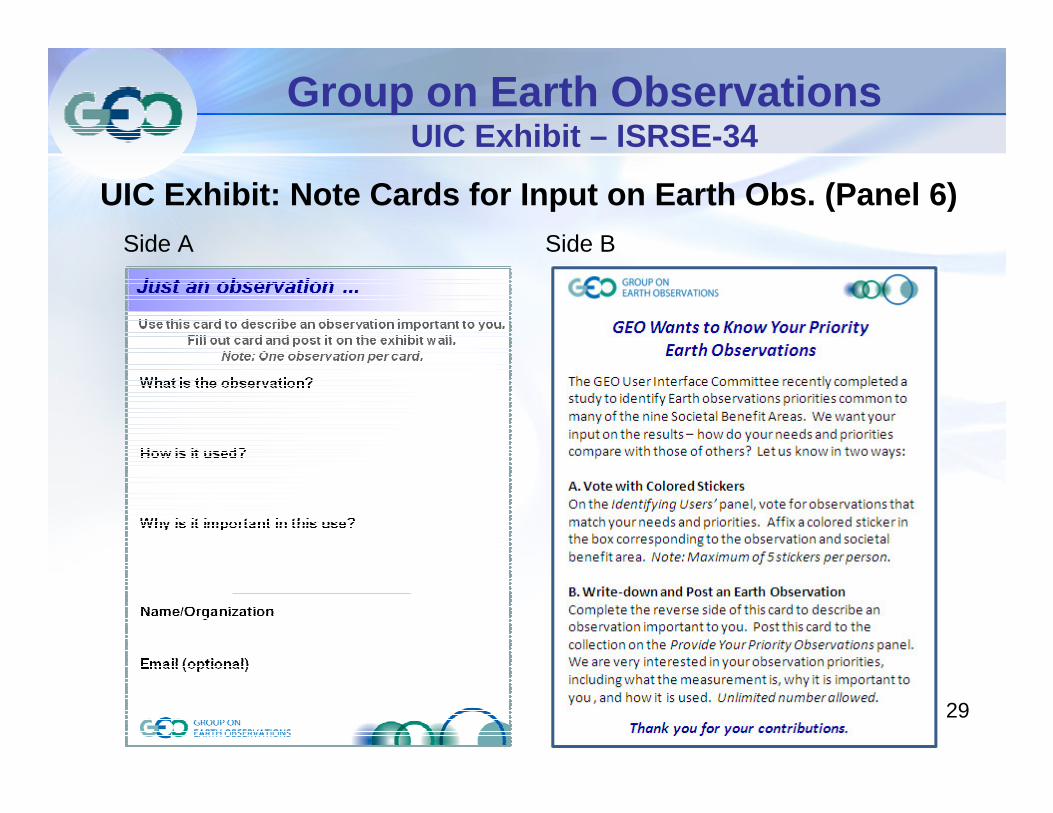
UIC Exhibit: Note Cards for Input on Earth Obs. (Pa nel 6)Side A Side B
29
Group on Earth ObservationsUIC Exhibit – ISRSE-34
UIC Exhibit: Note Cards for Input on Earth Obs. (Pa nel 6)Side A Side B
Group on Earth ObservationsTask US-09-01a
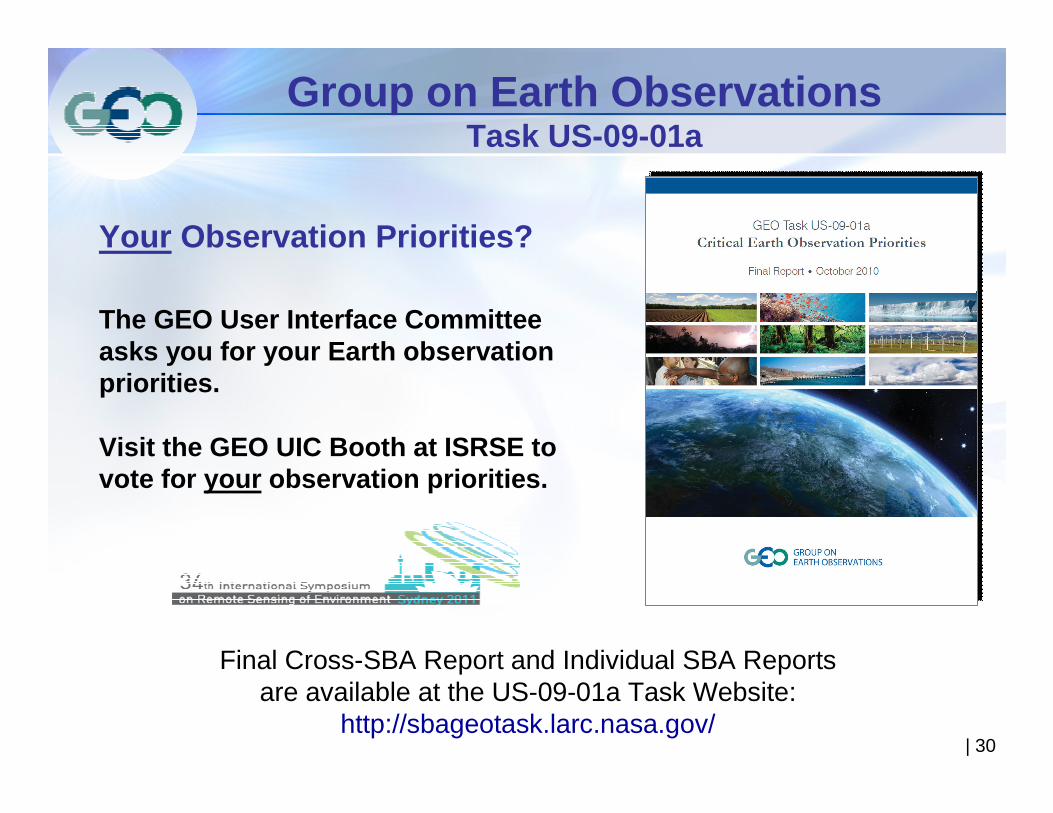
Your Observation Priorities?
The GEO User Interface Committee asks you for your Earth observation priorities.
Visit the GEO UIC Booth at ISRSE to vote for your observation priorities.
Final Cross-SBA Report and Individual SBA Reports are available at the US-09-01a Task Website:
http://sbageotask.larc.nasa.gov/| 30