genuine parts 3q20 earnings presentation
TRANSCRIPT

Genuine Parts 3Q20 Earnings PresentationOctober 22, 2020
2GPC 3Q20 EARNINGS PRESENTATION |
Genuine Parts Company Snapshot (NYSE: GPC)
Leading Global Distributor in Diversified End Markets
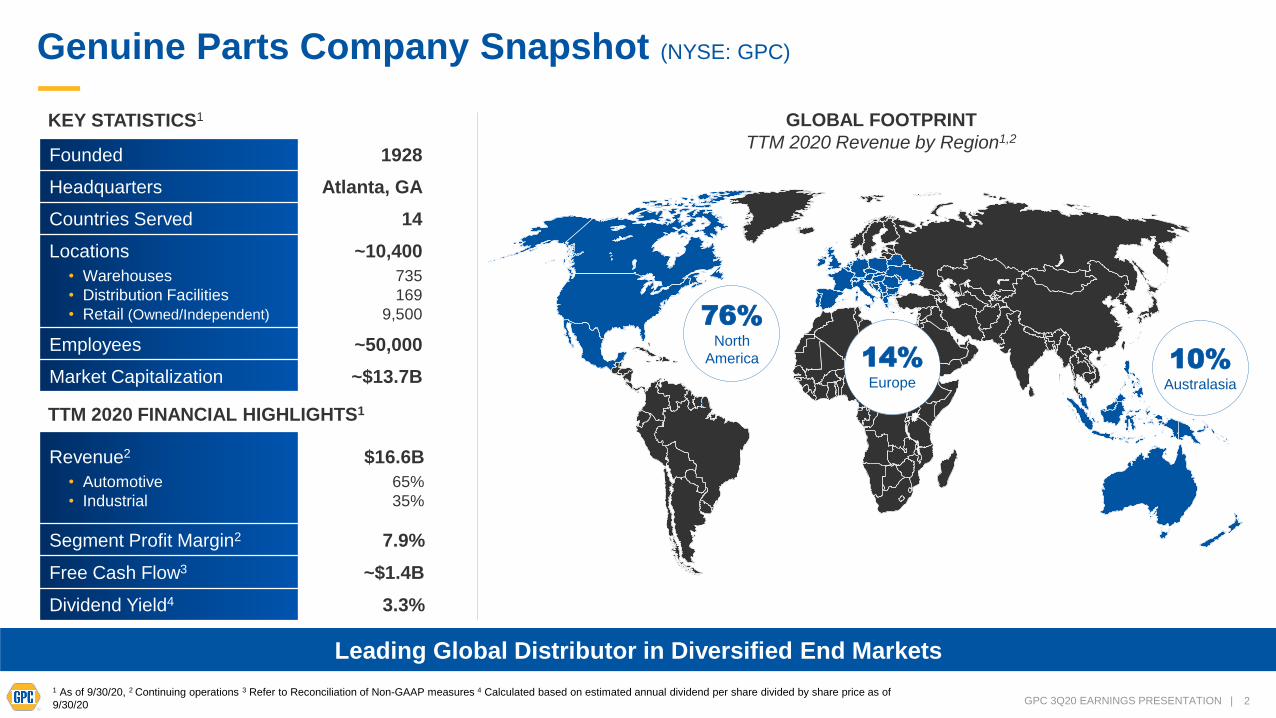
GLOBAL FOOTPRINT
TTM 2020 Revenue by Region1,2
KEY STATISTICS1
Founded 1928
Headquarters Atlanta, GA
Countries Served 14
Locations
• Warehouses
• Distribution Facilities
• Retail (Owned/Independent)
~10,400
735
169
9,500
Employees ~50,000
Market Capitalization ~$13.7B
TTM 2020 FINANCIAL HIGHLIGHTS1
Revenue2
• Automotive
• Industrial
$16.6B
65%
35%
Segment Profit Margin2 7.9%
Free Cash Flow3 ~$1.4B
Dividend Yield4 3.3%
76%North
America 10%Australasia
14%Europe
1 As of 9/30/20, 2 Continuing operations 3 Refer to Reconciliation of Non-GAAP measures 4 Calculated based on estimated annual dividend per share divided by share price as of
9/30/20

3GPC 3Q20 EARNINGS PRESENTATION |
Safe Harbor Statement
FORWARD-LOOKING STATEMENTS: Some of the comments made during this conference call and information contained in our presentation constitutes forward-looking
statements that are subject to the safe harbor provisions of the Private Securities Litigation Reform Act of 1995. All statements in the future tense and all statements accompanied
by words such as “expect,” “likely,” “outlook,” “forecast,” “preliminary,” “would,” “could,” “should,”, “position”, “will,” “project,” “intend,” “plan,” “on track,” “anticipate,” “to come,” “may,”
“possible,” “assume,” and variations of such words and similar expressions are intended to identify such forward-looking statements. These forward-looking statements include,
without limitation, our expected ability to operate and protect our workforce during the COVID-19 pandemic, our strategies for growing our automotive and industrial businesses, the
execution and effect of our cost savings initiatives, our efforts and initiatives to help us emerge from the pandemic well-positioned, our ongoing efforts to maintain compliance and
flexibility under our debt covenants, our liquidity position and actions to maximize cash flow to continue to operate during these highly uncertain times and plans for future cost
savings. The Company cautions that its forward-looking statements involve risks and uncertainties, and while we believe that our expectations for the future are reasonable in view
of currently available information, you are cautioned not to place undue reliance on our forward-looking statements. Actual results or events may differ materially from those
indicated as a result of various important factors. Such factors may include, among other things, the extent and duration of the disruption to our business operations caused by the
global health crisis associated with the COVID-19 outbreak, including the effects on the financial health of our business partners and customers, on supply chains and our suppliers,
on vehicle miles driven as well as other metrics that affect our business, and on access to capital and liquidity provided by the financial and capital markets; the Company’s ability to
maintain compliance with its debt covenants; the Company's ability to successfully integrate acquired businesses into the Company and to realize the anticipated synergies and
benefits; the Company's ability to successfully divest businesses; the Company's ability to successfully implement its business initiatives in its two business segments; slowing
demand for the Company's products; the ability to maintain favorable supplier arrangements and relationships; disruptions in our suppliers' operations, including the impact of
COVID-19 on our suppliers as well as our supply chain; changes in national and international legislation or government regulations or policies, including changes to import tariffs,
short term government subsidies, and the unpredictability of such changes and their impact to the Company and its suppliers and customers, data security policies and requirements
as well as privacy legislation; changes in general economic conditions, including unemployment, inflation (including the impact of tariffs) or deflation and the United Kingdom's exit
from the European Union, commonly known as Brexit, and the unpredictability of the impact following such exit from the European Union; changes in tax policies; volatile exchange
rates; volatility in oil prices; significant cost increases, such as rising fuel and freight expenses; the Company's ability to successfully attract and retain employees in the current labor
market; uncertain credit markets and other macroeconomic conditions; competitive product, service and pricing pressures; failure or weakness in our disclosure controls and
procedures and internal controls over financial reporting, including as a result of the work from home environment; the uncertainties and costs of litigation; disruptions caused by a
failure or breach of the Company's information systems, as well as other risks and uncertainties discussed in the Company’s latest SEC filings. The statements are only as of the
date they are made, and the Company undertakes no duty to update its forward-looking statements made during this presentation or in these materials except as required by law.
Actual results may vary materially and, as such, you are cautioned not to place undue reliance on these forward-looking statements.
NON-GAAP MEASURES: This presentation contains adjusted net income from continuing operations, adjusted diluted earnings per share from continuing operations, adjusted tax
rate, adjusted gross profit, adjusted operating and non-operating expenses, net sales excluding divestitures, segment profit excluding divestitures, segment profit margin excluding
divestitures, and free cash flow, which are financial measures that are not derived in accordance with United States generally accepted accounting principles ("GAAP"). The
Company considers these non-GAAP measures useful to investors because they provide greater transparency into management’s view and assessment of the Company’s core
operating performance. These measures are widely used by analysts, investors and competitors in our industry, although our calculation of the measure may not be comparable to
similar measures disclosed by other companies, because not all companies and analysts calculate these measures in the same manner. The Company does not, nor does it
suggest investors should, consider non-GAAP financial measures superior to, in isolation from, or as a substitute for, GAAP financial information. The Company has included
reconciliations of this additional information to the most comparable GAAP measure in the appendix of this presentation.

4GPC 3Q20 EARNINGS PRESENTATION |
3Q20 Highlights & COVID-19 UpdatePaul DonahueChairman & CEO

5GPC 3Q20 EARNINGS PRESENTATION |
3Q20 Key Messages and Priorities
Focus on Core Automotive and Industrial Segments
01Ensuring the continued health and safety of our employees, customers, suppliers and
communities in which we operate
03Management of our working capital to drive strong free cash flow, strengthen our financial position
and enhance liquidity
02Execution of our strategic initiatives and cost actions to deliver customer value, operational
efficiencies and strong financial results
04Effective capital deployment, including strategic reinvestments in the business, paying a consistent
dividend to our shareholders and the repayment of debt
05 Advanced our ESG initiatives with the release of our 2020 Corporate Sustainability Report

6GPC 3Q20 EARNINGS PRESENTATION |
Operating Through the Challenges of COVID-19
Working Together As One GPC Team
Executed with agility aggressively managing our operations through COVID-19
Committed to operational excellence to fulfill critical customer needs
Engaging with our teams at every level
Operating well and prepared with appropriate readiness plans in the event of a “second wave”
Thank you to our 50,000+ team members across our global footprint!
7GPC 3Q20 EARNINGS PRESENTATION |
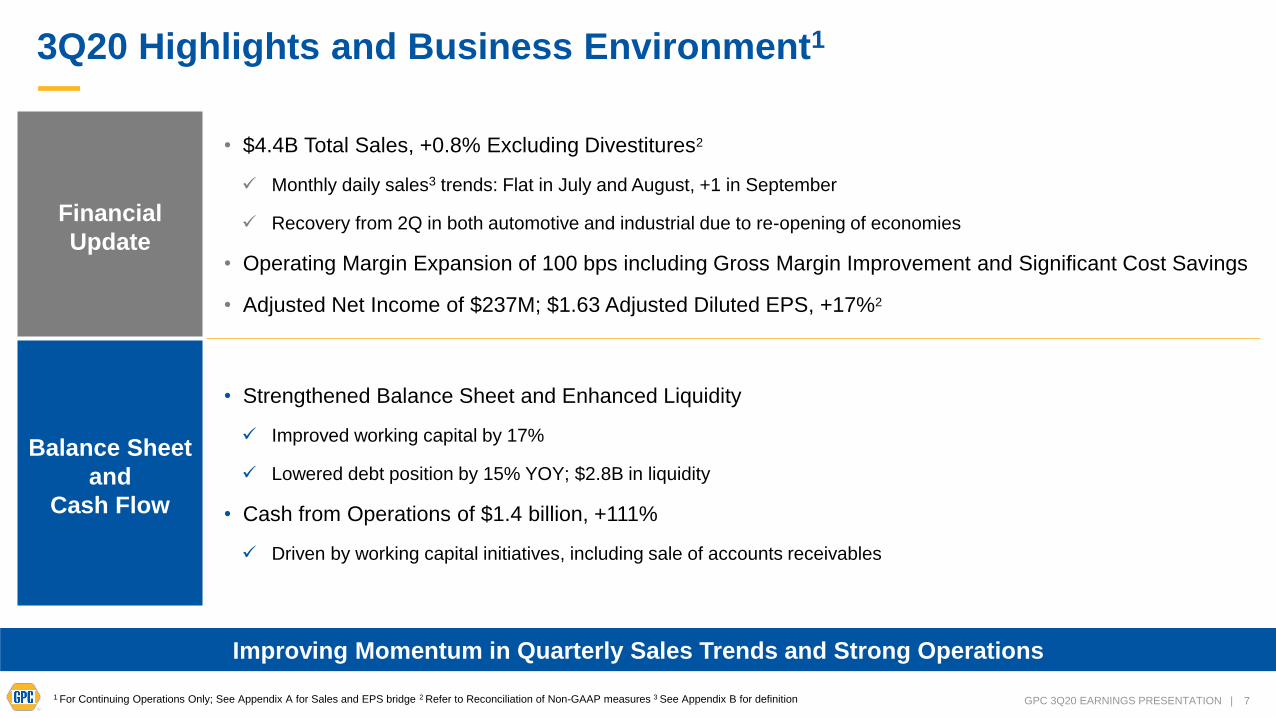
3Q20 Highlights and Business Environment1
Improving Momentum in Quarterly Sales Trends and Strong Operations
1 For Continuing Operations Only; See Appendix A for Sales and EPS bridge 2 Refer to Reconciliation of Non-GAAP measures 3 See Appendix B for definition
Financial
Update
• $4.4B Total Sales, +0.8% Excluding Divestitures2
✓ Monthly daily sales3 trends: Flat in July and August, +1 in September
✓ Recovery from 2Q in both automotive and industrial due to re-opening of economies
• Operating Margin Expansion of 100 bps including Gross Margin Improvement and Significant Cost Savings
• Adjusted Net Income of $237M; $1.63 Adjusted Diluted EPS, +17%2
Balance Sheet
and
Cash Flow
• Strengthened Balance Sheet and Enhanced Liquidity
✓ Improved working capital by 17%
✓ Lowered debt position by 15% YOY; $2.8B in liquidity
• Cash from Operations of $1.4 billion, +111%
✓ Driven by working capital initiatives, including sale of accounts receivables

8GPC 3Q20 EARNINGS PRESENTATION |
3Q20 Segment Highlights/ Macro Trends
Automotive
Total sales up 6.0%
Industrial Total sales down 8.7%1
Comp Sales • Comp sales2 up 2.2% compared to a 12.6% decrease in 2Q • Comp sales2 down 9.2% compared to a 16.7% decrease in 2Q
NORTH AMERICA
• U.S. comp sales2 down 2.8% compared to a 14% decrease in 2Q
• Positive DIY sales / DIFM still pressured but recovering
• Continued strong on-line sales growth, 2X pre-COVID levels
• Segment profit margin expansion +60 bps
• Canada comp sales2 up 0.5% compared to a 15% decrease in 2Q
• Segment profit margin expansion +200 bps
• Sales to independent store owners in U.S. and Canada in-line with company-
owned stores
• Strengthening industrial economy driving improved sales trends
• Segment profit margin expansion +80 bps1
• Safety products outperforming with low teens sales growth
• Significant industry diversification
• Most industry sectors are pressured
• Equipment & Machinery, Iron & Steel, Auto, Fabricated Metals, Oil & Gas
• Stronger, more resilient sectors
• Food Products, Pulp & Paper, Lumber & Wood, Equipment Rental/ Leasing
EUROPE
• Comp sales2 up 11.6% compared to a 16% decrease in 2Q
• Sales environment strengthened significantly during the quarter
• Segment profit margin expansion +140 bps
AUSTRALASIA
• Comp sales2 up 14.8% compared to a 2% increase in 2Q
• Robust DIY/DIFM sales growth during the quarter
• Continued restrictions/lockdowns in Melbourne and Victoria
• Continued strength in on-line sales, 2-3X pre-COVID levels
• Segment profit margin expansion +180 bps
• Mi Asia Pac performed well in 3Q / Positive YoY sales growth
• Benefiting from resiliency of mining industry
• Significant operating margin expansion
• Steady operational performance since July 2019 acquisition
MACRO
• Strong long-term industry fundamentals
• Growing and older car parc, low gas prices, improving miles driven trends
• Following miles driven & consumer spending as aftermarket demand indicators
• Strong growth outlook for plant automation and robotics solutions
• Following manufacturing PMI and industrial production as industrial demand
indicators
1Sales and segment profit exclude divestitures. These amounts are non-GAAP measures (See Reconciliation of Non-GAAP Measures). 2 See Appendix B for definition

9GPC 3Q20 EARNINGS PRESENTATION |
Engrained ESG Best Practices Throughout Organization
Published 2020 Sustainability Report Highlighting Significant Progress Made on Our ESG Journey
Environmental
• Completed hundreds of retail location and
distribution center lighting retrofits
offsetting 60M lbs of CO2 (2015-19)
• Our fleet management program reduced
fuel consumption by 15% saving 1.6
million gallons of gasoline (2017-19),
which reduced carbon emissions by 19%
• Recycled 6,397 tons of material in 2019
through comprehensive waste recycling
program
• Vendors meet strict supply chain
sustainability standards
Social Governance
• Donated time, resources and $5M+ in
2019 to:
‒ United Way
‒ Intrepid Fallen Heroes
‒ City of Hope
‒ American Cancer Society
‒ Starlight Children’s Foundation
• Provided health and wellness benefits to
employees, including biometric screenings,
fitness challenges, eLearning modules and
counseling/recovery assistance programs
• Increased spend with diverse suppliers
by 8% in 2018 from 5,200 diversity supplier
partners
• Diversity & Inclusion Committee to advance
initiatives supportive of an environment built on
respect, dignity & fairness
• Formalizing our sustainability governance,
including ongoing shareholder engagement
and routine updates to the Board of Directors
• Ambassadors will serve on cross company
corporate sustainability committee to drive
positive change
• Safety Council serves as an internal advisory
group approving policy, actions and
communications
10GPC 3Q20 EARNINGS PRESENTATION |
030201
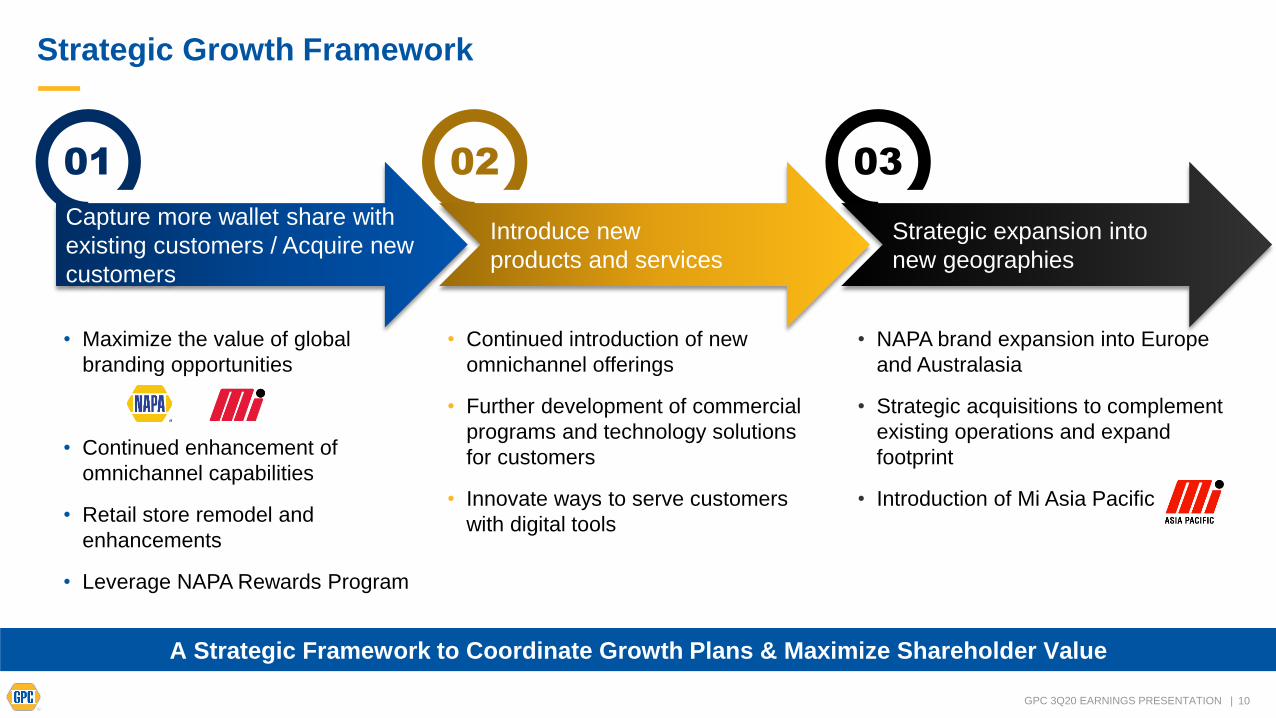
Strategic Growth Framework
A Strategic Framework to Coordinate Growth Plans & Maximize Shareholder Value
Capture more wallet share with
existing customers / Acquire new
customers
Introduce new
products and services
Strategic expansion into
new geographies
• Maximize the value of global
branding opportunities
• Continued enhancement of
omnichannel capabilities
• Retail store remodel and
enhancements
• Leverage NAPA Rewards Program
• Continued introduction of new
omnichannel offerings
• Further development of commercial
programs and technology solutions
for customers
• Innovate ways to serve customers
with digital tools
• NAPA brand expansion into Europe
and Australasia
• Strategic acquisitions to complement
existing operations and expand
footprint
• Introduction of Mi Asia Pacific

11GPC 3Q20 EARNINGS PRESENTATION |
3Q20 Financial PerformanceCarol YanceyEVP and CFO

12GPC 3Q20 EARNINGS PRESENTATION |
3Q20 Financial Results
Sales1 Adj Gross Profit1 Adj Op/Non-Op Expenses1 Segment Profit1 Adj EPS1
+0.8% +1.3% (1.5%) +12.8% +17.3%
• Reported sales down 3.4%
• 4.2% impact from divestitures
• (1.8%)2 comp sales
• Pressured by COVID-19
• +1.3% acquisitions
• Auto – Todd & Other bolt-ons
• Ind. – FPH, TRC, F&L & AMMC
• +1.0% foreign currency
• Improving trends through the quarter
• Positive comps in Europe, Asia
Pac and Canada
• 12 consecutive quarterly increases in
Gross Margin
• Driven by benefits of:
• Sales mix
• Product mix
• Strategic category mgmt. initiatives
• Pricing initiatives
• Global sourcing
• Divestitures
• SG&A down 1.7% from PY, driven by
cost savings initiatives
• ~$100M total savings
• Includes ~$40M of $100M original
cost savings plan
• Includes ~$60M+ in COVID-19
savings
• Gross margin expansion
• Significant SG&A cost savings
• Automotive margin +100 bps
• Margin expansion in all four
markets/regions
• Industrial margin +80 bps
• Margin expansion in both
markets/regions
• Reported earnings per diluted share
$1.61
• Includes $0.02 in after-tax
adjustments for restructuring,
transaction and other costs and
income
• Adj. tax rate1 was 23.4% compared to
24.9% in 3Q19
$4,336 $4,370
3Q19 3Q20
($M, except per share data)
$1,510$1,529
33.4%
35.0%
20.0%
21.0%
22.0%
23.0%
24.0%
25.0%
26.0%
27.0%
28.0%
29.0%
30.0%
31.0%
32.0%
33.0%
34.0%
35.0%
36.0%
37.0%
38.0%
39.0%
40.0%
41.0%
42.0%
43.0%
44.0%
45.0%
46.0%
47.0%
48.0%
49.0%
50.0%
$1,200
$1,250
$1,300
$1,350
$1,400
$1,450
$1,500
$1,550
$1,600
3Q19 3Q20
+162 bps
$1,238 $1,220
27.4% 27.9%
0.0%
1.0%
2.0%
3.0%
4.0%
5.0%
6.0%
7.0%
8.0%
9.0%
10.0%
11.0%
12.0%
13.0%
14.0%
15.0%
16.0%
17.0%
18.0%
19.0%
20.0%
21.0%
22.0%
23.0%
24.0%
25.0%
26.0%
27.0%
28.0%
29.0%
30.0%
31.0%
32.0%
33.0%
34.0%
35.0%
36.0%
37.0%
38.0%
39.0%
40.0%
41.0%
42.0%
43.0%
44.0%
45.0%
46.0%
47.0%
48.0%
49.0%
50.0%
51.0%
52.0%
53.0%
54.0%
55.0%
56.0%
57.0%
58.0%
59.0%
60.0%
61.0%
62.0%
63.0%
64.0%
65.0%
66.0%
67.0%
68.0%
69.0%
70.0%
$0
$200
$400
$600
$800
$1,000
$1,200
$1,400
3Q19 3Q20
+55 bps
$347
$392
8.0%9.0%
1.0%
2.0%
3.0%
4.0%
5.0%
6.0%
7.0%
8.0%
9.0%
10.0%
11.0%
12.0%
13.0%
14.0%
15.0%
16.0%
17.0%
18.0%
19.0%
20.0%
$0
$50
$100
$150
$200
$250
$300
$350
$400
$450
3Q19 3Q20
+100 bps
Note: All comparisons are YoY unless otherwise stated 1 Sales and Segment Profit exclude divestitures and discontinued operations. Adjusted Gross Profit, adjusted Operating / Non-Operating
expenses, adjusted EPS and adjusted tax rate excludes restructuring, transaction and other certain costs. These amounts are non-GAAP measures (See Reconciliation of Non-GAAP Measures)2 See Appendix B for definition
$1.39
$1.63
3Q19 3Q20
13GPC 3Q20 EARNINGS PRESENTATION |
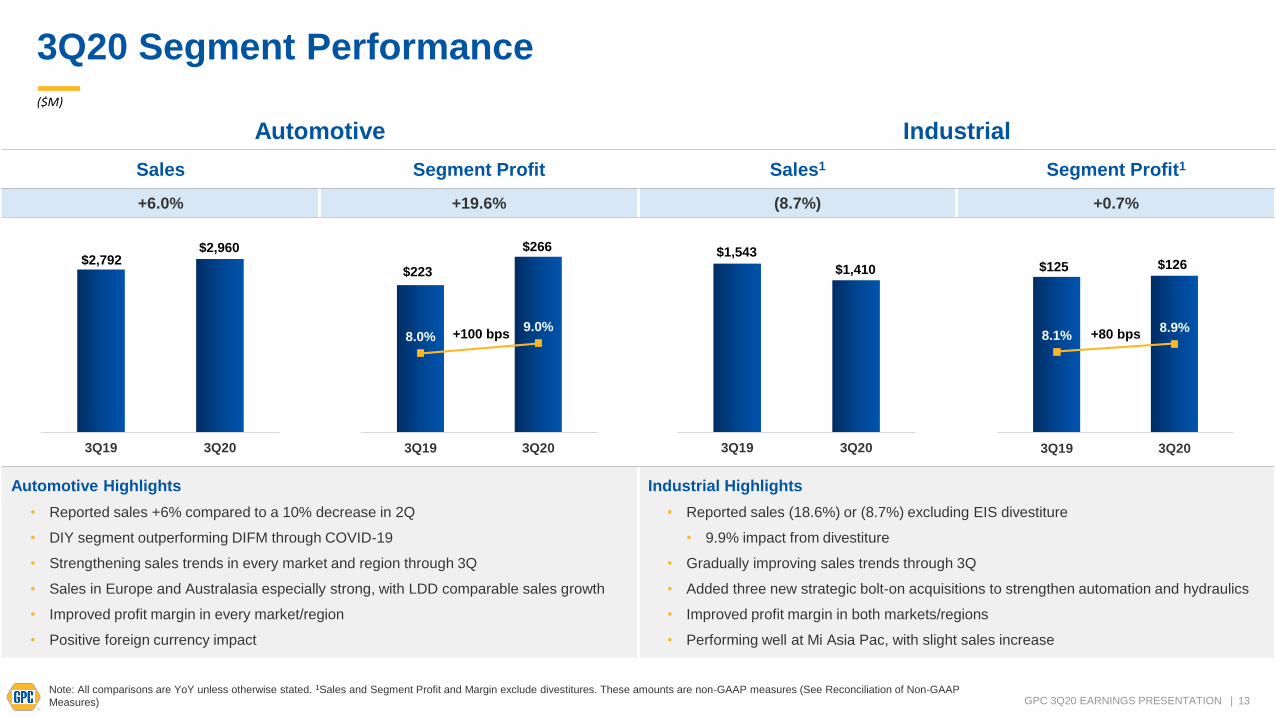
3Q20 Segment Performance
($M)
Note: All comparisons are YoY unless otherwise stated. 1Sales and Segment Profit and Margin exclude divestitures. These amounts are non-GAAP measures (See Reconciliation of Non-GAAP
Measures)
Automotive Industrial
Sales Segment Profit Sales1 Segment Profit1
+6.0% +19.6% (8.7%) +0.7%
Automotive Highlights
• Reported sales +6% compared to a 10% decrease in 2Q
• DIY segment outperforming DIFM through COVID-19
• Strengthening sales trends in every market and region through 3Q
• Sales in Europe and Australasia especially strong, with LDD comparable sales growth
• Improved profit margin in every market/region
• Positive foreign currency impact
Industrial Highlights
• Reported sales (18.6%) or (8.7%) excluding EIS divestiture
• 9.9% impact from divestiture
• Gradually improving sales trends through 3Q
• Added three new strategic bolt-on acquisitions to strengthen automation and hydraulics
• Improved profit margin in both markets/regions
• Performing well at Mi Asia Pac, with slight sales increase
3Q19 3Q20
$2,792$2,960
8.0%9.0%
0.0%
2.0%
4.0%
6.0%
8.0%
10.0%
12.0%
14.0%
16.0%
18.0%
20.0%
$0
$50
$100
$150
$200
$250
$300
3Q19 3Q20
$223
$266
3Q19 3Q20
$1,543
$1,410
8.1%8.9%
0.0%
2.0%
4.0%
6.0%
8.0%
10.0%
12.0%
14.0%
16.0%
18.0%
20.0%
$0
$20
$40
$60
$80
$100
$120
$140
$160
3Q19 3Q20
$125 $126
+100 bps +80 bps
14GPC 3Q20 EARNINGS PRESENTATION |
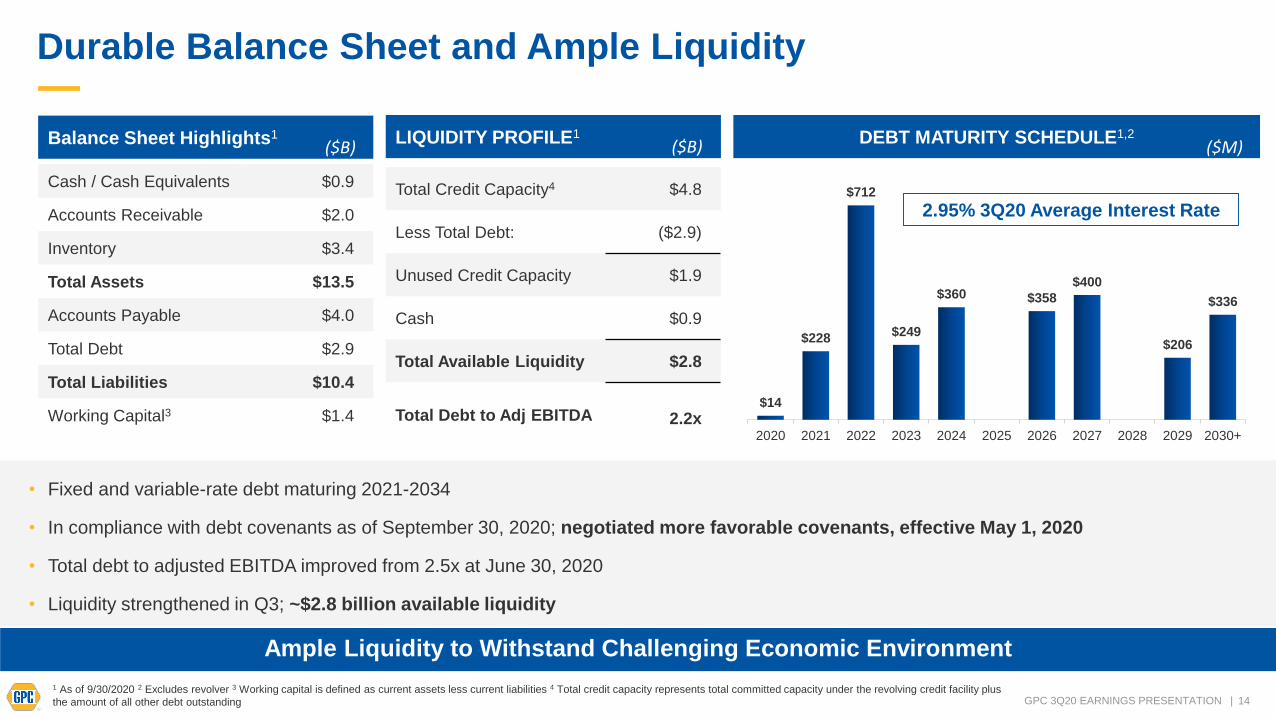
Durable Balance Sheet and Ample Liquidity
• Fixed and variable-rate debt maturing 2021-2034
• In compliance with debt covenants as of September 30, 2020; negotiated more favorable covenants, effective May 1, 2020
• Total debt to adjusted EBITDA improved from 2.5x at June 30, 2020
• Liquidity strengthened in Q3; ~$2.8 billion available liquidity
DEBT MATURITY SCHEDULE1,2Balance Sheet Highlights1 LIQUIDITY PROFILE1
Cash / Cash Equivalents $0.9
Accounts Receivable $2.0
Inventory $3.4
Total Assets $13.5
Accounts Payable $4.0
Total Debt $2.9
Total Liabilities $10.4
Working Capital3 $1.4$14
$228
$712
$249
$360 $358
$400
$206
$336
2020 2021 2022 2023 2024 2025 2026 2027 2028 2029 2030+
Ample Liquidity to Withstand Challenging Economic Environment
2.95% 3Q20 Average Interest Rate
($B)
1 As of 9/30/2020 2 Excludes revolver 3 Working capital is defined as current assets less current liabilities 4 Total credit capacity represents total committed capacity under the revolving credit facility plus
the amount of all other debt outstanding
Total Credit Capacity4 $4.8
Less Total Debt: ($2.9)
Unused Credit Capacity $1.9
Cash $0.9
Total Available Liquidity $2.8
Total Debt to Adj EBITDA 2.2x
($B) ($M)
15GPC 3Q20 EARNINGS PRESENTATION |
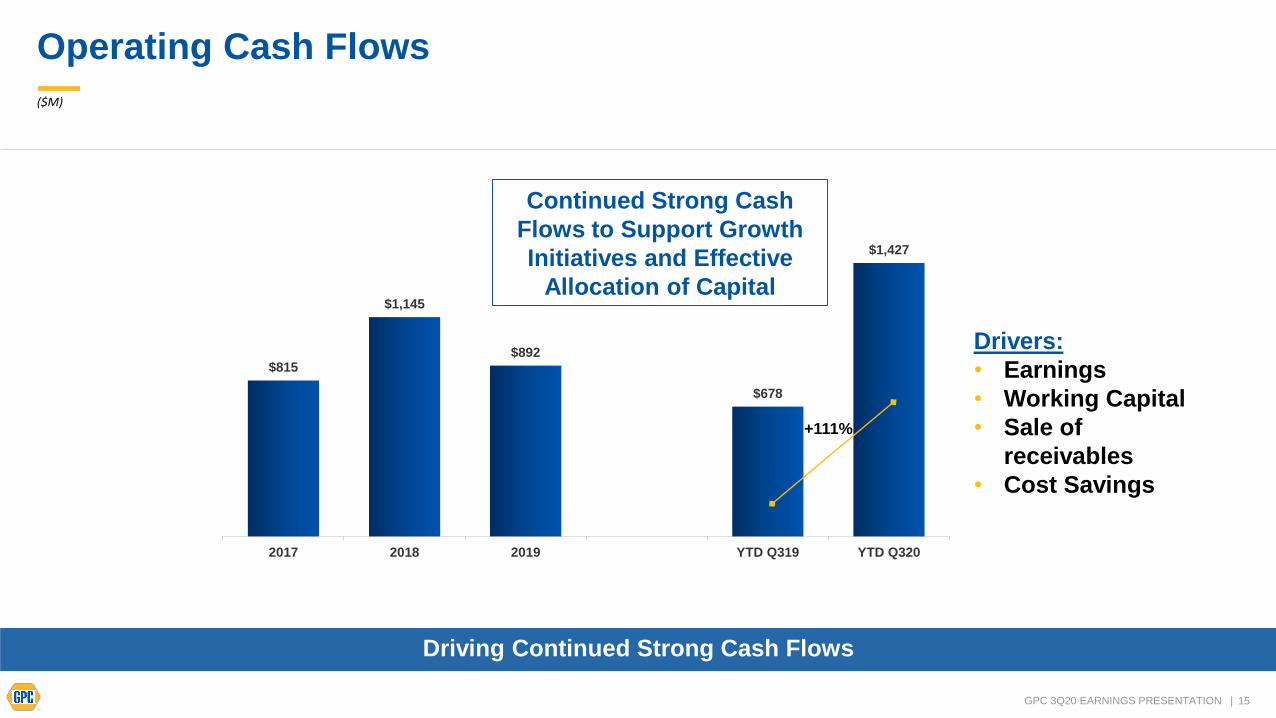
Operating Cash Flows
$815
$1,145
$892
$678
$1,427
2017 2018 2019 YTD Q319 YTD Q320
($M)
+111%
Continued Strong Cash
Flows to Support Growth
Initiatives and Effective
Allocation of Capital
Driving Continued Strong Cash Flows
Drivers:
• Earnings
• Working Capital
• Sale of
receivables
• Cost Savings
16GPC 3Q20 EARNINGS PRESENTATION |
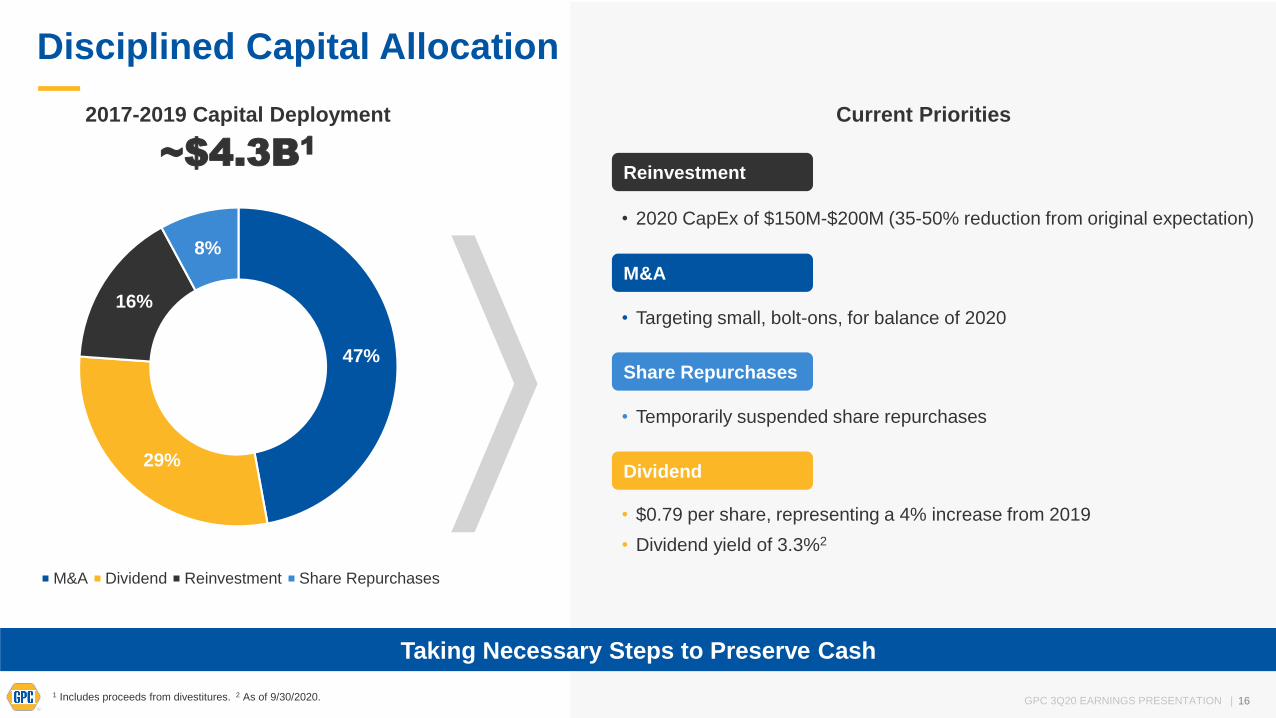
Disciplined Capital Allocation
Taking Necessary Steps to Preserve Cash
47%
29%
16%
8%
M&A Dividend Reinvestment Share Repurchases
2017-2019 Capital Deployment
~$4.3B1
16
Current Priorities
Dividend
• $0.79 per share, representing a 4% increase from 2019
• Dividend yield of 3.3%2
Reinvestment
• 2020 CapEx of $150M-$200M (35-50% reduction from original expectation)
M&A
• Targeting small, bolt-ons, for balance of 2020
Share Repurchases
• Temporarily suspended share repurchases
1 Includes proceeds from divestitures. 2 As of 9/30/2020.

17GPC 3Q20 EARNINGS PRESENTATION |
Closing Comments
Focus on Top Priorities for Sustained Growth and Operational Excellence
Strengthening sales trends in Automotive and Industrial
Continued gross margin expansion
Transformative cost actions and significant cost savings
Operating margin expansion in each of our businesses
A stronger balance sheet, enhanced liquidity and substantial cash flows
The continued focus on our top priorities resulted in a strong financial performance for the
quarter; 3Q results highlight our progress in several key areas

18GPC 3Q20 EARNINGS PRESENTATION |
Q&A

19GPC 3Q20 EARNINGS PRESENTATION |
Appendix

20GPC 3Q20 EARNINGS PRESENTATION |
Consolidated Sales and EPS Bridge
Reported Sales (3.4%)
Divested Operations +4.2%
Sales Excl. Divestitures1 +0.8%
EPS1,2
SALES1 ($M)
Appendix A
Adjusted Diluted EPS2 $1.63
Adjustments ($0.02)
GAAP Diluted EPS $1.61
1Sales excluding divestitures and discontinued operations and adjusted earnings per share are non-GAAP measures (See Reconciliation of Non-GAAP Financial Measures). 2 All earnings per share
amounts assume dilution.

21GPC 3Q20 EARNINGS PRESENTATION |
Other Information Appendix B
Comparable Sales: Comparable sales refer to period-over-period comparisons of our sales excluding the impact of acquisitions, divestitures and foreign currency. The Company considers this metric useful to investors because it provides greater transparency into management’s view and assessment of the Company’s core ongoing operations. This is a metric that is widely used by analysts, investors and competitors in our industry, although our calculation of the metric may not be comparable to similar measures disclosed by other companies, because not all companies and analysts calculate this metric in the same manner.
Daily Sales: Daily sales is a key metric that represents the amounts invoiced to the Company's customers each day. Daily sales do not represent GAAP-based sales because, among other things, invoices are not always generated at the same time goods and services are delivered to customers and the amounts do not include adjustments for estimates of returns, rebates or other forms of variable consideration. Management uses this metric to monitor demand trends at each of its subsidiaries throughout each month for the purposes of monitoring performance against forecasts and to make operational decisions. The Company considers this metric useful to investors because it provides greater transparency into management’s view and assessment of the Company’s core ongoing operations. The calculation of this metric may not be comparable to similar measures disclosed by other companies, because not all companies and analysts calculate this metric in the same manner.
22GPC 3Q20 EARNINGS PRESENTATION |
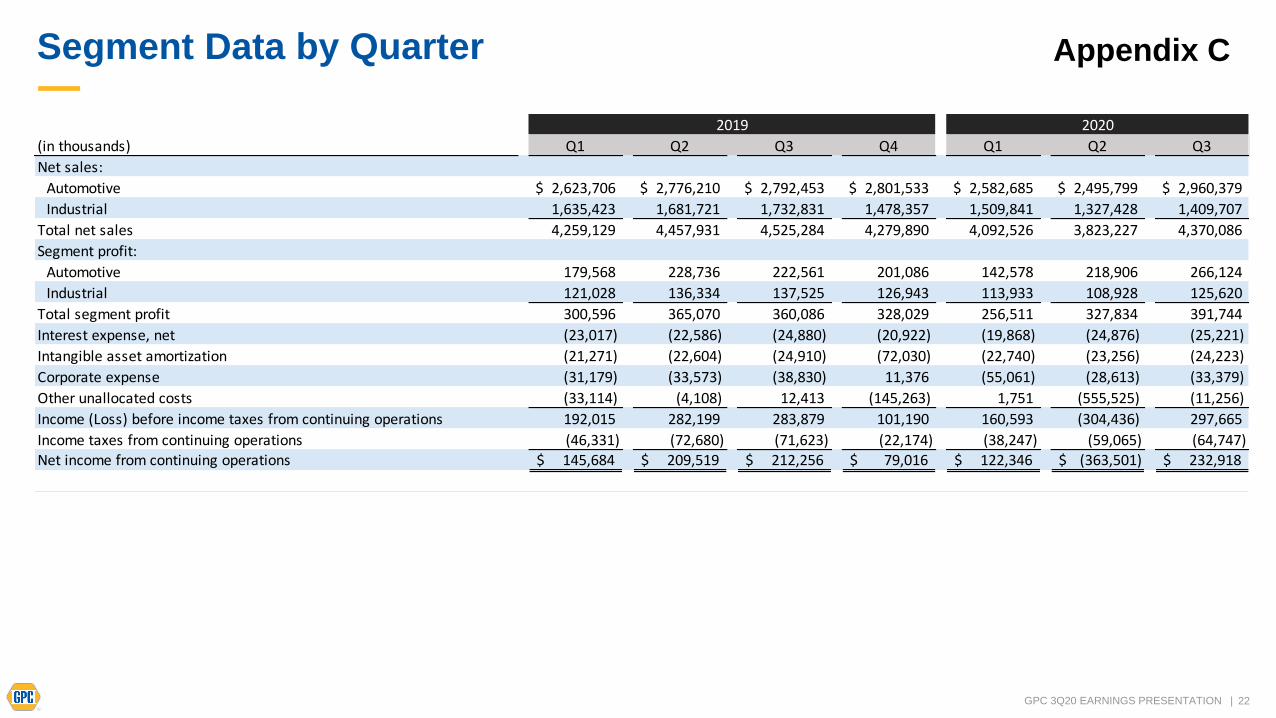
Segment Data by Quarter Appendix C
(in thousands) Q1 Q2 Q3 Q4 Q1 Q2 Q3
Net sales:
Automotive $ 2,623,706 $ 2,776,210 $ 2,792,453 $ 2,801,533 $ 2,582,685 $ 2,495,799 $ 2,960,379
Industrial 1,635,423 1,681,721 1,732,831 1,478,357 1,509,841 1,327,428 1,409,707
Total net sales 4,259,129 4,457,931 4,525,284 4,279,890 4,092,526 3,823,227 4,370,086
Segment profit:
Automotive 179,568 228,736 222,561 201,086 142,578 218,906 266,124
Industrial 121,028 136,334 137,525 126,943 113,933 108,928 125,620
Total segment profit 300,596 365,070 360,086 328,029 256,511 327,834 391,744
Interest expense, net (23,017) (22,586) (24,880) (20,922) (19,868) (24,876) (25,221)
Intangible asset amortization (21,271) (22,604) (24,910) (72,030) (22,740) (23,256) (24,223)
Corporate expense (31,179) (33,573) (38,830) 11,376 (55,061) (28,613) (33,379)
Other unallocated costs (33,114) (4,108) 12,413 (145,263) 1,751 (555,525) (11,256)
Income (Loss) before income taxes from continuing operations 192,015 282,199 283,879 101,190 160,593 (304,436) 297,665
Income taxes from continuing operations (46,331) (72,680) (71,623) (22,174) (38,247) (59,065) (64,747) Net income from continuing operations 145,684$ 209,519$ 212,256$ 79,016$ 122,346$ (363,501)$ 232,918$
2019 2020
23GPC 3Q20 EARNINGS PRESENTATION |
Reconciliation of Non-GAAP Financial Measures Appendix D
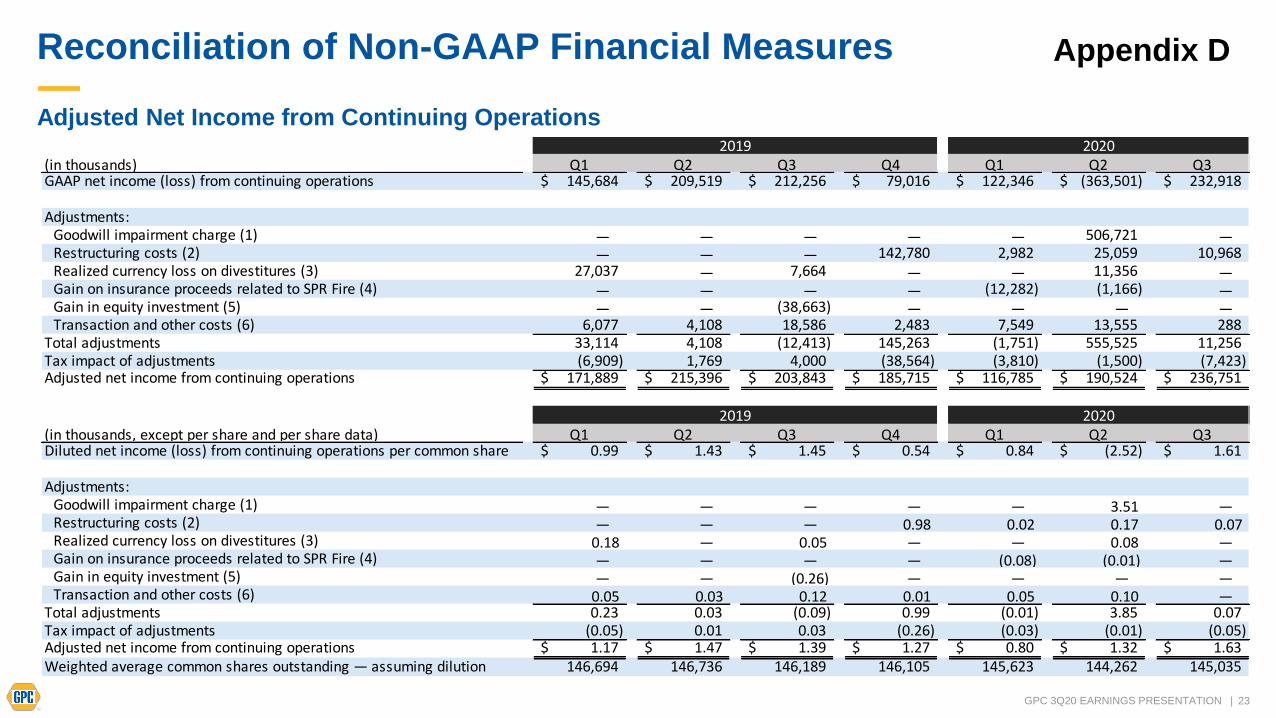
Adjusted Net Income from Continuing Operations
(in thousands) Q1 Q2 Q3 Q4 Q1 Q2 Q3GAAP net income (loss) from continuing operations 145,684$ 209,519$ 212,256$ 79,016$ 122,346$ (363,501)$ 232,918$
Adjustments:Goodwill impairment charge (1) — — — — — 506,721 — Restructuring costs (2) — — — 142,780 2,982 25,059 10,968 Realized currency loss on divestitures (3) 27,037 — 7,664 — — 11,356 — Gain on insurance proceeds related to SPR Fire (4) — — — — (12,282) (1,166) — Gain in equity investment (5) — — (38,663) — — — — Transaction and other costs (6) 6,077 4,108 18,586 2,483 7,549 13,555 288
Total adjustments 33,114 4,108 (12,413) 145,263 (1,751) 555,525 11,256 Tax impact of adjustments (6,909) 1,769 4,000 (38,564) (3,810) (1,500) (7,423) Adjusted net income from continuing operations 171,889$ 215,396$ 203,843$ 185,715$ 116,785$ 190,524$ 236,751$
(in thousands, except per share and per share data) Q1 Q2 Q3 Q4 Q1 Q2 Q3Diluted net income (loss) from continuing operations per common share 0.99$ 1.43$ 1.45$ 0.54$ 0.84$ (2.52)$ 1.61$
Adjustments:Goodwill impairment charge (1) — — — — — 3.51 — Restructuring costs (2) — — — 0.98 0.02 0.17 0.07 Realized currency loss on divestitures (3) 0.18 — 0.05 — — 0.08 — Gain on insurance proceeds related to SPR Fire (4) — — — — (0.08) (0.01) — Gain in equity investment (5) — — (0.26) — — — — Transaction and other costs (6) 0.05 0.03 0.12 0.01 0.05 0.10 —
Total adjustments 0.23 0.03 (0.09) 0.99 (0.01) 3.85 0.07 Tax impact of adjustments (0.05) 0.01 0.03 (0.26) (0.03) (0.01) (0.05) Adjusted net income from continuing operations 1.17$ 1.47$ 1.39$ 1.27$ 0.80$ 1.32$ 1.63$ Weighted average common shares outstanding — assuming dilution 146,694 146,736 146,189 146,105 145,623 144,262 145,035
2019 2020
2019 2020

24GPC 3Q20 EARNINGS PRESENTATION |
Reconciliation of Non-GAAP Financial Measures (Cont.) Appendix D
Adjusted EBIT and Adjusted EBITDA
(in thousands) Q1 Q2 Q3 Q4 Q1 Q2 Q3
GAAP net income (loss) from continuing operations 145,684$ 209,519$ 212,256$ 79,016$ 122,346$ (363,501)$ 232,918$
Depreciation and amortization 58,617 62,684 65,667 70,295 67,254 66,733 69,097
interest expense, net 23,017 22,586 24,880 20,922 19,868 24,876 25,221
Income taxes from continuing operations 46,331 72,680 71,623 22,174 38,247 59,065 64,747
EBITDA 273,649$ 367,469$ 374,426$ 192,407$ 247,715$ (212,827)$ 391,983$
Goodwill impairment charge (1) — — — — — 506,721 —
Restructuring costs (2) — — — 142,780 2,982 25,059 10,968
Realized currency loss on divestitures (3) 27,037 — 7,664 — — 11,356 —
Gain on insurance proceeds related to SPR Fire (4) — — — — (12,282) (1,166) —
Gain in equity investment (5) — — (38,663) — — — —
Transaction and other costs (6) 6,077 4,108 18,586 2,483 7,549 13,555 288 Adjusted EBITDA 306,763$ 371,577$ 362,013$ 337,670$ 245,964$ 342,698$ 403,239$
2019 2020
(in thousands) Q1 Q2 Q3 Q4 Q1 Q2 Q3GAAP net income (loss) from continuing operations 145,684$ 209,519$ 212,256$ 79,016$ 122,346$ (363,501)$ 232,918$
interest expense, net 23,017 22,586 24,880 20,922 19,868 24,876 25,221 Income taxes from continuing operations 46,331 72,680 71,623 22,174 38,247 59,065 64,747
EBIT 215,032$ 304,785$ 308,759$ 122,112$ 180,461$ (279,560)$ 322,886$ Goodwill impairment charge (1) — — — — — 506,721 — Restructuring costs (2) — — — 142,780 2,982 25,059 10,968 Realized currency loss on divestitures (3) 27,037 — 7,664 — — 11,356 — Gain on insurance proceeds related to SPR Fire (4) — — — — (12,282) (1,166) — Gain in equity investment (5) — — (38,663) — — — — Transaction and other costs (6) 6,077 4,108 18,586 2,483 7,549 13,555 288
Adjusted EBIT 248,146$ 308,893$ 296,346$ 267,375$ 178,710$ 275,965$ 334,142$
2019 2020

25GPC 3Q20 EARNINGS PRESENTATION |
Explanation of Adjustments Appendix D
(1) Goodwill Impairment Charge: Adjustment reflects the second quarter goodwill impairment charge related to the Company's European reporting unit.
(2) Restructuring Costs: Adjustment reflects restructuring costs related to the ongoing execution of the 2019 Cost Savings Plan announced in the fourth quarter of 2019. The costs are primarily associated with severance and other employee costs, including a voluntary retirement program, and facility and closure costs related to the consolidation of operations.
(3) Realized Currency Loss: Adjustment reflects realized currency losses related to divestitures.(4) Gain on Insurance Proceeds Related to SPR Fire: Adjustment reflects insurance recoveries in excess of losses incurred
on inventory, property, plant and equipment and other fire-related costs related to the S.P. Richards Headquarters and Distribution Center.
(5) Gain on Equity Investment: Adjustment reflects the gain from remeasuring the Company's preexisting 35% equity investment to fair value upon acquiring the remaining equity of Inenco on July 1, 2019.
(6) Transaction and Other Costs: Adjustment includes transaction and other costs related to acquisitions and divestitures. For the nine months ended September 30, 2020, adjustment includes $8,490 of incremental costs associated with COVID-19. COVID-19 related costs include incremental costs incurred relating to fees to cancel marketing events and increased cleaning and sanitization materials, among other things.

26GPC 3Q20 EARNINGS PRESENTATION |
Reconciliation of Non-GAAP Financial Measures (Cont.) Appendix D
Adjusted Gross Profit
Adjusted Operating and Non-Operating Expenses
(in thousands) 2020 2019 $ Change % Change
GAAP Gross Profit 1,528,066$ 1,505,233$ 22,833$ 1.5%
Adjustments:
Cost of goods sold 604 4,521 (3,917) (86.6)%
Total Adjustments (2) 604 4,521 (3,917) (86.6)%
Adjusted Gross Profit $ 1,528,670 $ 1,509,754 $ 18,916 1.3%
Adjusted Gross Profit as a Percent of GAAP Net Sales 35.0% 33.4% 160 bps
Three Months Ended September 30, QTD Change
(in thousands) 2020 2019 $ Change % Change
GAAP Operating and Non-Operating Expenses 1,230,401$ 1,221,354$ 9,047$ 0.7%
Adjustments:
Selling, administrative and other expenses — 15,879 (15,879) (100.0)%
Restructuring costs 10,968 — 10,968 100.0%
Non-operating (income): Other (316) (32,813) 32,497 (99.0)%
Less: Total Adjustments (2) 10,652 (16,934) 27,586 (162.9)%
Adjusted Operating and Non-Operating Expenses $ 1,219,749 $ 1,238,288 $ (18,539) (1.5)%
Adjusted Operating and Non-Operating Expenses as a Percent of GAAP Net Sales 27.9% 27.4% 50 bps
QTD ChangeThree Months Ended September 30,
(2) Refer to adjusted net income from continuing operations and adjusted diluted earnings per share from continuing operations reconciliation for explananation of pre-tax adjustments
27GPC 3Q20 EARNINGS PRESENTATION |
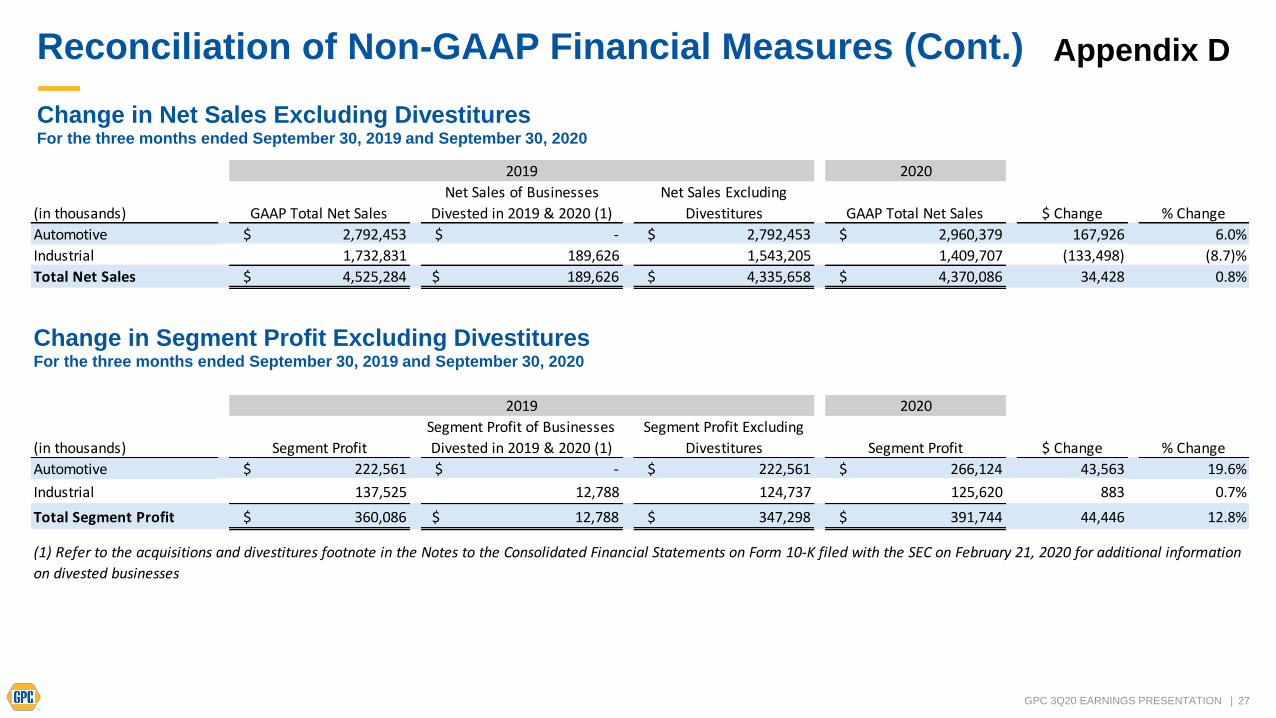
Reconciliation of Non-GAAP Financial Measures (Cont.) Appendix D
Change in Net Sales Excluding DivestituresFor the three months ended September 30, 2019 and September 30, 2020
Change in Segment Profit Excluding DivestituresFor the three months ended September 30, 2019 and September 30, 2020
2020
(in thousands) Segment Profit
Segment Profit of Businesses
Divested in 2019 & 2020 (1)
Segment Profit Excluding
Divestitures Segment Profit $ Change % Change
Automotive $ 222,561 $ - $ 222,561 $ 266,124 43,563 19.6%
Industrial 137,525 12,788 124,737 125,620 883 0.7%
Total Segment Profit $ 360,086 $ 12,788 $ 347,298 $ 391,744 44,446 12.8%
2019
(1) Refer to the acquisitions and divestitures footnote in the Notes to the Consolidated Financial Statements on Form 10-K filed with the SEC on February 21, 2020 for additional information
on divested businesses
2020
(in thousands) GAAP Total Net Sales
Net Sales of Businesses
Divested in 2019 & 2020 (1)
Net Sales Excluding
Divestitures GAAP Total Net Sales $ Change % Change
Automotive $ 2,792,453 $ - $ 2,792,453 $ 2,960,379 167,926 6.0%
Industrial 1,732,831 189,626 1,543,205 1,409,707 (133,498) (8.7)%
Total Net Sales $ 4,525,284 $ 189,626 $ 4,335,658 $ 4,370,086 34,428 0.8%
2019

28GPC 3Q20 EARNINGS PRESENTATION |
Reconciliation of Non-GAAP Financial Measures Appendix D
Adjusted Tax Rate
Free Cash Flow
(in thousands) 2020 2019
(Loss) income before income taxes $ 297,665 $ 283,879
Total adjustments 11,256 (12,413)
Adjusted Income before income taxes $ 308,921 $ 271,466
Income taxes $ 64,747 $ 71,623
Tax impact of adjustments 7,423 (4,000)
Adjusted income taxes $ 72,170 $ 67,623
Adjusted Tax Rate 23.4% 24.9%
Three Months Ended September 30,
Trailing Twelve Months
(in thousands) September 30, 2020
Net cash provided by operating activities $ 1,560,184
Less: Purchases of property, plant and equipment (206,980)
Free Cash Flow 1,353,204$